
Abstract
Scholarly articles and the Australian media claim that 30–50% of Australian teachers leave teaching within their first five years in the role. The figures are considered to be well established although some articles acknowledge that they are estimates. In reality, there is no robust Australian evidence, and figures do not agree. What evidence there is, nationally and internationally, suggests that attrition is dynamic, varies by school level and location, and is not always negative and not always due to the school environment. In the absence of Australian evidence, articles should be more cautious about figures cited, and about causation. Attention should be paid to the classification of attrition types and a typology is outlined in this article, based on the teacher supply pipeline, along with what evidence exists on teacher exits at each level. This typology may facilitate greater transparency about levels of early career teacher attrition, leading to a broader and more nuanced policy and research conversation in the area of teacher supply.
Keywords
Introduction
Recent Australian media, research, and journal articles have stated that early career teacher attrition in Australia is worryingly high, with estimates commonly of 30–50% of teachers leaving within their first five years in teaching (e.g. Arnup & Bowles, 2016; Bennett, Newman, Kay-Lambkin, & Hazel, 2016; Brennan, 2016; Manuel & Carter, 2016; McKinnon & Walker, 2016; Singhal, 2017; Stroud, 2017; Vucovic, 2015). In one case, Australian media reported that 40% of Australian teachers were leaving in their first year (Lumsden, 2015) despite citing only UK figures (Weale, 2015). Such estimates have appeared over the last two decades and are presented as being “well established” (Ewing & Manuel, 2005) and “an intractable problem of epidemic proportions” (Gallant & Riley, 2014).
Australian research into early career teacher attrition as it is presented in scholarly articles is largely about why teachers leave their jobs and what can be done about it. Mason and Poyatos Matas (2015) found 20 journal articles on teacher attrition and retention research in Australia. All were concerned about attrition levels although not all specified a figure (e.g. Ashiedu & Scott-Ladd, 2012; Rice, 2014). Where figures were presented some journal articles did retreat from those figures to a certain extent, noting that they were estimates, often with a high degree of uncertainty (e.g. Arnup & Bowles, 2016; Ewing & Smith, 2003).
Given ongoing media interest and the current citation of high attrition rates (commonly 50% in the media, cf. Brennan, 2016; Haesler, 2012; Marshall, 2013; Singhal, 2017), this article considers the following questions:
Where/what is the Australian evidence of (high) early career teacher attrition? What definitions of attrition are being, or should be, used? How can attrition in Australia be measured?
Logically, the second question should come first. However, the question order reflects the somewhat under-developed thought in the area. Statements on early career teacher attrition tend to gravitate to one overarching proportional figure with little consideration of the figures’ underlying definitions which can involve important differences such as those between the primary and secondary teacher workforce, or between metropolitan, regional, and rural schools. Attrition in recent Australian literature is generally portrayed as high, negative, and specifically related to the context of employment—lack of support, burn out (e.g. Arnup & Bowles, 2016; Ewing and Manuel, 2005; Gallant & Riley, 2014; Mansfield, Beltman & Price, 2014)—which ignores a number of other relevant contexts and issues such as short-term contracts and lack of ongoing positions, personal issues such as illness or family concerns, or choosing to leave to pursue an alternative career.
This article therefore firstly considers the figures that have been cited over the past 17 years for Australia and follows the references back to the original sources. A brief overview of international figures is also provided. The second section considers questions two and three and develops a detailed description of attrition based on the Australian teacher supply pipeline. This places early career teacher attrition in the context of teacher supply and demand, which is the policy area associated with early career teachers, who must first graduate from a recognized initial teacher education (ITE) degree, and must be provisionally registered before they can teach, and become fully registered as a teacher only after they have completed at least one year of teaching. Attention is given to the different levers or causes of attrition, many of which appear to be ignored in the general estimates that tend to be the norm in the literature.
Method
This study into the evidence for teacher attrition in Australia was based on recent articles in the media and journals. Thus, rather than using specific databases or search parameters, the study started with a handful of recent media and scholarly articles and looked for the references and citations in each, following these back to the original source documents. That is, all documents were reviewed to ascertain what, if any, early career teacher attrition figures were presented. Where figures were provided, the following questions were considered:
What is the definition of attrition used? That is, are early career teachers considered to be those in their first three years or first five years? Does the figure refer to all teachers nationally, or is it a state level figure, or primary/secondary education level figure? What is the evidence? Is the figure from original research or does the document cite another source? Is the figure based on Australian data? How reliable is the evidence? How old are the original figures? Are there any trend data?
Most journal articles provided multiple references and these were reviewed, except in some cases where older original documents no longer appeared to be available. In addition, where scholarly articles were listed in databases or on journal websites that pointed to similar material, this material was also examined. One reason for not using specific databases was that many reports in the area were grey literature: works written or commissioned by government and other bodies that are not published in journals or by publishing houses (some of these references could not be sourced) (Lawrence, Thomas, Houghton & Weldon, 2015). In total, this led to 86 documents being accessed, with 60 from Australia: 31 reports by government and independent bodies, 16 journal articles, plus one book and one thesis, and 11 media news articles. Of the other references accessed, 11 were reports from the UK, nine were from the US (six reports, three journal articles), four were from Europe, including three OECD reports, and two were from Canada. Some of the international sources, such as those from the OECD, referenced Australian data.
Results and discussion
The results of the study are presented below. Each of the figures cited for Australian early career teacher attrition is followed back to its original source. As some figures appear to be based on international figures rather than Australian figures, some findings from England, the United States, and Canada are also presented.
Australian attrition figures and sources
The original sources of some Australian figures are difficult to find. One of the figures commonly quoted in the literature is that (up to) 25% of teachers leave within their first five years. Of those citing that figure, Mansfield et al. (2014) quote a Productivity Commission report (2012), which does not itself provide a source. Arnup and Bowles (2016) quote Ewing and Manuel (2005), who cite Lee Dow (2003). The Lee Dow reference is better known as Australia’s Teachers, Australia’s Future, the final report of the Review of Teaching and Teacher Education carried out in 2002–2003 (Australian Government Department of Education, Science and Training [DEST], 2003), and this appears to be the origin of the 25% figure (see pp. 87, 150). The 25% figure was drawn from a New South Wales (NSW) Department of Education and Training (DET) submission to the review which was described as anecdotal. The, 2003 review figure was also cited in a 2008 review of teacher workforce data and planning processes for the Australian government (Owen, Kos, & McKenzie, 2008), suggesting that no other figure was known to exist at that time.
The 25% figure also appears in a later inquiry into teacher education, the 2007 Top of the class report, cited in a recent report on early career teacher attrition by the Australian Institute for Teaching and School Leadership (Australian Institute of Teaching and School Leadership [AITSL], 2016, p. 8) and a recent Queensland College of Teachers (QCT) report on attrition (QCT, 2013, p. 11). The Top of the class report (House of Representatives Standing Committee on Education and Vocational Training, 2007) quotes the 2003 review (p. 9) and then quotes a submission by DEST (p. 89), which gives the 25% figure (DEST, 2005, p.3) without indicating a source and which is likely also to refer to the 2003 review. That is, all mention of a 25% attrition rate in over a decade appears to be based on a submission of anecdotal evidence by one state department to the 2003 review.
Another common reference is the 2005 report by the Organization for Economic Cooperation and Development, Teachers Matter (Organization for Economic Cooperation and Development [OECD], 2005), and the country background report submitted to the OECD by Australia for that review (Skilbeck & Connell, 2003). Mason and Poyatos Matas (2015) reference the OECD study as indicating that up to 30% of Australian teachers leave their careers within the first five years. Jensen, Hunter, Sonnemann and Burns (2012, p.76) reference Ewing and Manuel (2005). Ewing and Manuel (2005) reference both the OECD report and the country background report when citing a figure of one-third and reference the country background report when citing figures of between 25 and 40%. However, neither the OECD report nor the Australian country background report cites a specific attrition figure for Australia.
The Australian figure of 33% provided in the OECD report refers to the proportion of Australian teachers across all age ranges who indicated an intention to leave prior to retirement when surveyed (OECD, 2005, p. 176). Skilbeck and Connell recognize that “significant numbers of young people leave the profession within the first five to eight years” (2003, p.17) but also state: “The degree to which teachers move in and out of the profession is of considerable current interest, but data are not detailed, and a full picture has yet to emerge” (p. 23).
A year later, Skilbeck and Connell (2004) prepared an additional report for the Teacher Quality and Educational Leadership Taskforce of the Ministerial Council for Education, Employment Training and Youth Affairs. This report cited a figure of 30%, based on research carried out by the Western Australian Department of Education, which stated: “For teachers under 30 years, terminations peak at two years of service (16%) falling off rapidly after this. While some 30% leave service with the department within their first five years, some 12% have returned by 10 to 15 years later” (in Skilbeck & Connell, 2004, p. 26).
Peters and Pearce (2012) cite a 30% figure, referencing the NSW review of teacher education (Ramsey, 2000), also referenced by Ewing and Manuel (2005). The Ramsey report also does not provide a specific attrition figure although it does note that the highest levels of attrition are in the early years. Watt and Richardson (2007) also note a 30% figure but provide no citation.
The highest figures presented in the materials reviewed are 40–50% (Haesler, 2012 in Arnup & Bowles, 2016; McKinnon & Walker, 2016; McMillen, 2013; Singhal, 2017). These figures appeared in all 11 reviewed media articles except one (Latifoglu, 2016) and are generally attributed to Gallant and Riley (2014). In their scholarly article, Gallant and Riley (2014) state that “nearly half the graduating teachers” in several countries including Australia “fill positions vacated by teachers who have left with less than five years’ experience” (p. 562). This is not the same as saying that 50% of teachers leave within the first five years and none of the Australian references given (Ewing & Manuel, 2005; Riley, 2011; Skilbeck & Connell, 2003) provide evidence for such a figure. Gallant and Riley go on to claim that “in general the rate of loss to the profession in many countries is around 40–50% over the five years post entry” (p. 562) but without a supporting citation.
One other attrition figure has been quoted, that of 8–10%, which came from a budget estimates paper by the NSW Government. This figure was referenced by Mason and Poyatos Matas (2015), who sourced it from QCT (2013). This figure was not an isolated one: the NSW government in its budget estimates publishes an annual figure for “Newly appointed teachers resigning from the Department of Education within their first five years” (see e.g. NSW Government 2012, 2013, 2014, 2015a, 2016), including “actual” figures for the previous three years and a “forecast” figure for the current year. These figures refer to the combined population of primary and secondary school teachers in NSW Government schools and have been about 8% for at least the last five years.
However, figures presented by the NSW Education Department relate to teachers in permanent positions (see e.g. NSW Government, 2015b). Temporary teachers make up at least 16% of the NSW government teacher workforce (Bagshaw, 2015), are most likely to be early career teachers 1 (McKenzie, Weldon, Rowley, Murphy, & McMillan, 2014), and are not included in the budget estimate figures. This is also the case in Victoria, where about 19% of teachers are in contract positions which are not included in overall attrition rates (Weldon, Shah & Rowley, 2015).
The only other data that appear to be publicly available in Australia come from the research done by the QCT, based on its register of all Queensland teachers, including teachers in non-government schools. It found that of those granted provisional registration in Queensland from 2006 to 2008, 13.5% had their names removed from the register within four years of being granted that registration (QCT, 2013). Teachers may maintain registration while not teaching, however, so it is possible that this is an underestimation of real attrition figures.
In summary, no national figures for Australia were sourced in the last 17 years despite the variety of references. Three figures of attrition within the first five years have been published: two from the NSW state government (25%—in DEST (2003) and 8–10%—in NSW Government (2016)), and one from the WA state education department (30%—in Skilbeck & Connell, 2004).
The evidence for early career teacher attrition has been acknowledged to be inadequate (AITSL, 2016; Mitchell Institute, CIRES, DET & AITSL, 2015; Buchanan et al., 2013) and on the basis of what is known, describing teacher attrition in Australia as well established, or at epidemic proportions, appears at best to rely upon figures from other countries, as will be discussed in the following section.
International attrition figures
Scholarly articles tended to cite figures from other countries, conflating them with the Australian context (e.g. Ewing & Manuel, 2005; Mansfield et al., 2014; Manuel & Carter, 2016; Manuel & Hughes, 2006;). A recent AITSL Spotlight publication cites data from the US which are based on data from regular cycles of a representative sample survey of teachers and school administrators since 1987 (AITSL, 2016). In 2003, attrition rates in the US among early career teachers were calculated to be 40–50% (Ingersoll, 2003, in AITSL, 2016). However, this figure did not account for those who resumed teaching at a later date, which could be as many as 25% of early leavers. In addition, the American education system does not always have clear parallels with the Australian system: unlike Australia, in many states, people can teach without teaching qualifications, and this difference may affect attrition rates.
A 2016 UK government publication notes that 19% of newly qualified entrants to the government sector in England were not recorded as working in the sector two years later. The five-year rate for 2010 entrants was 28%, the 10-year rate for 2005 entrants was 38%. These figures have been broadly stable since 2006 (Department for Education [DfE], 2016). According to this publication, teachers in part-time service are under-recorded by 10–20% which may result in some under-estimation, however, it is also the case that not all of these teachers will have left the profession—some will be working outside the state sector, or in Scotland or Wales.
A 2014 report by the Ontario College of Teachers in Canada notes that “since, 2005 the loss of new education graduates in the first five years has increased by more than 60%—from 9.5% in, 2005 to 15.5% in 2014” (Ontario College of Teachers, 2014, p.53).
The point here is that attrition figures differ widely in the international context. The extent to which attrition figures are well measured, well understood, and so well established can be challenged, particularly if attrition is dynamic, affected by a variety of changeable environmental contexts both at individual school and system level, and broader employment and economic trends or events. For example, it may be the case that the global financial crisis and periodic downturns in the economy which affect job outlooks might encourage some teachers to remain in teaching who would otherwise have considered an alternate career.
Defining attrition
Both media and scholarly articles tend to assume or infer a definition of attrition and its major causes. The inferred definition of early career teacher attrition is of teachers who have obtained one or more teaching roles in a primary or secondary school following graduation and have stopped teaching within (usually) five years of starting (e.g. Ewing & Manuel, 2005; Gallant & Riley, 2014; Mansfield et al., 2014; Peters & Pearce, 2012).
As noted in a recent study of Australian literature in this field, articles tend to concentrate on subsets of attrition, such as attrition of language teachers who may still be teaching but are no longer teaching a language, or attrition of teachers in non-metropolitan areas (Mason and Poyatos Matas, 2015).
Attrition can have more technical definitions, which can make comparisons problematic. For example, in English data for the OECD report Teachers matter, attrition was defined as teachers who had been in full-time service who were no longer in full-time service after a certain date. As a consequence, these attrition figures included teachers who had dropped to part-time service (OECD, 2005, p. 173).
Teacher supply and demand studies are the most common source of attrition figures outside of scholarly papers. These studies tend to contextualize attrition within the area of supply, which, in Australia, is a pipeline generally beginning with ITE courses (e.g. Mitchell Institute et al., 2015; Owen et al., 2008; Weldon et al., 2015). To teach in Australia requires the successful completion of a recognized ITE program, either by undertaking an undergraduate degree in education or by completing a degree in a subject area followed by the completion of a postgraduate qualification in teaching. Once the necessary qualification has been obtained, registration is required by the statutory authority in your state or territory.
Table 1 involves a definition of attrition based on the supply pipeline concept and illustrates the points at which potential or qualified teachers can exit the pipeline. Supply and demand studies tend to include the pre-graduation stage. However, articles that mention an attrition figure tends to focus on the employment stage only and, within that stage, seldom acknowledge that there are many more reasons for leaving than job-related stress and lack of support (Mason and Poyatos Matas, 2015), in this article termed the Environment effect. The “eligible for employment stage” is an important consideration for early career teacher attrition because it includes people who are qualified and registered to teach. This highlights the importance of defining precisely what is meant by “early career teacher.”
Attrition typology in the teacher supply pipeline.
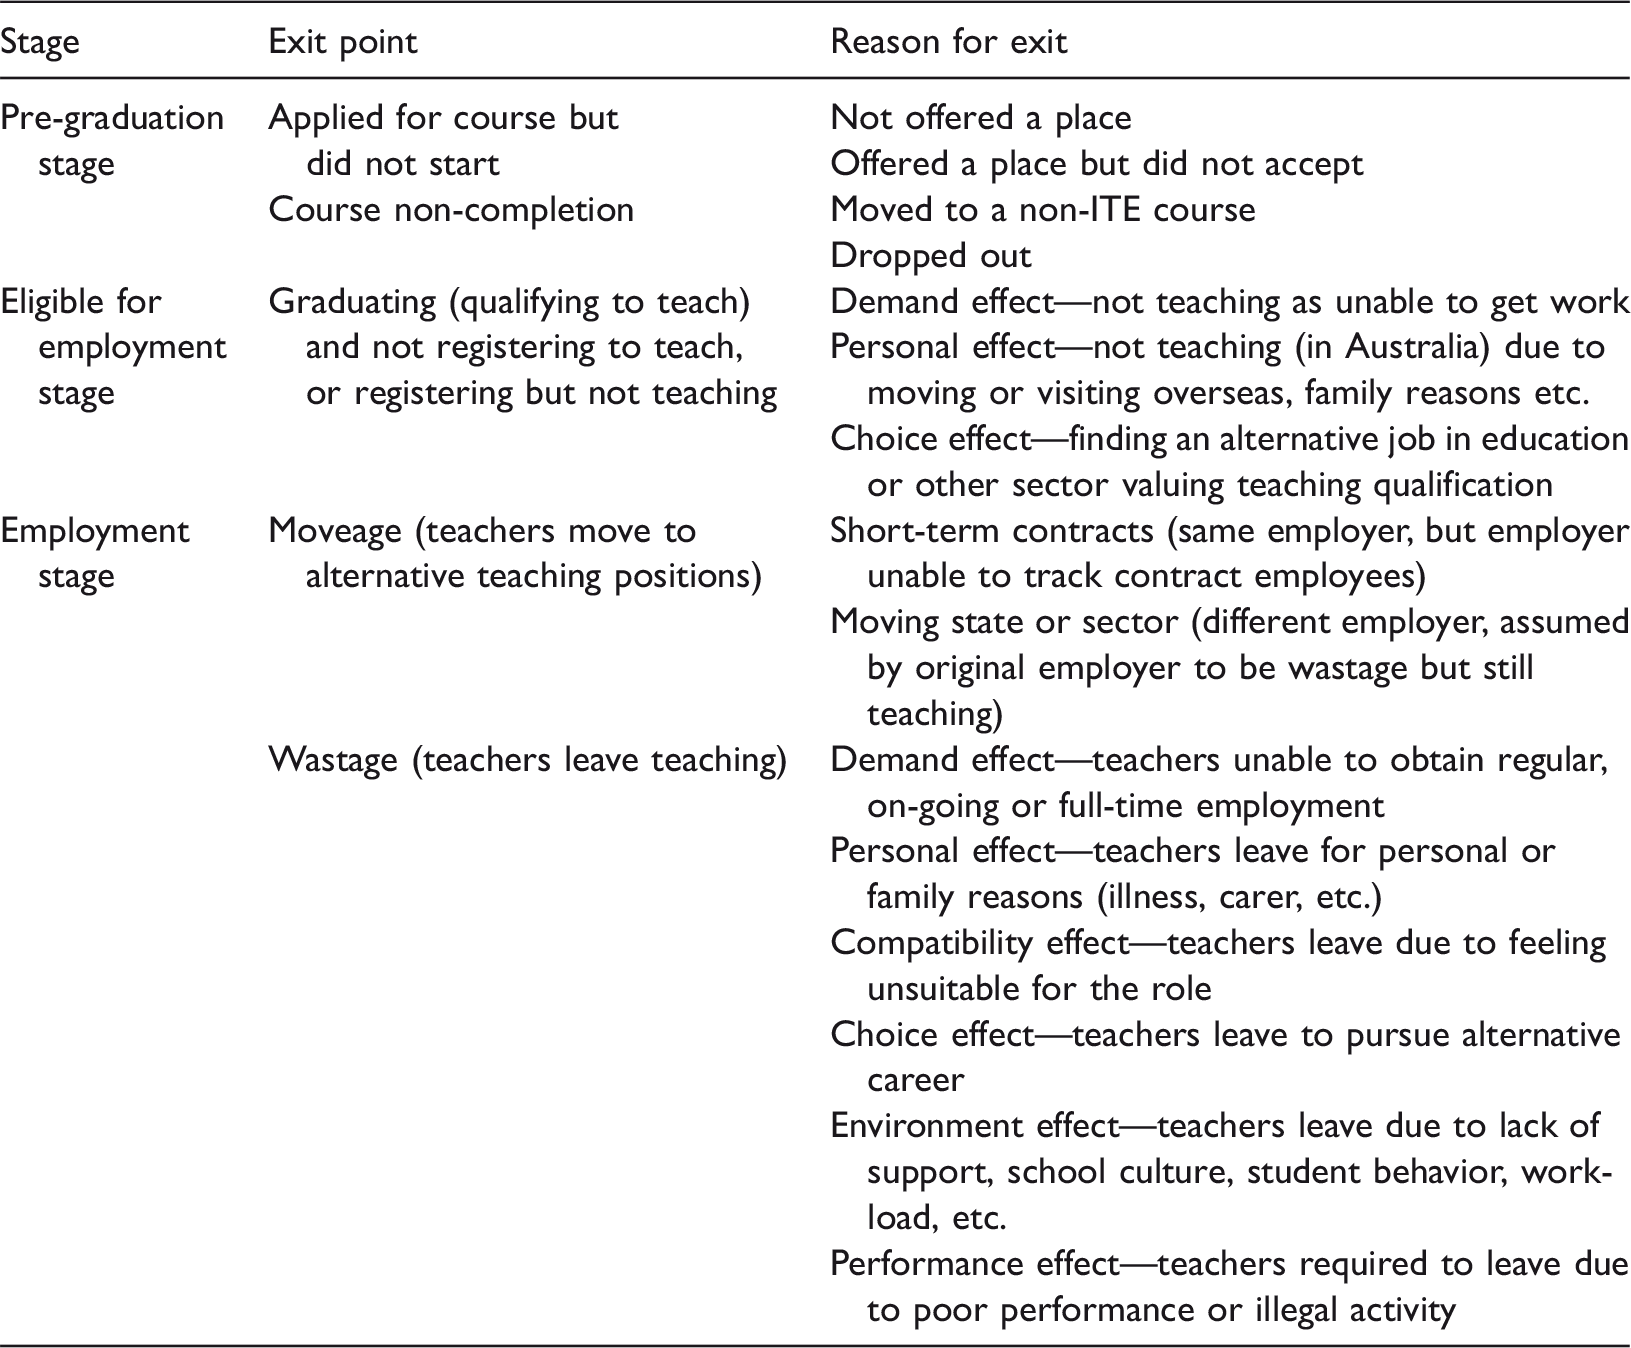
ITE: initial teacher education.
It is therefore worth defining what is meant by early career as this also differs in the literature. This article uses the definition agreed on nationally in Australia for the Staff in Australia’s Schools (SiAS) surveys, which consider early career teachers to be in their first five years of teaching (McKenzie et al., 2014). The SiAS surveys sought responses only from current, qualified teachers, including in non-teaching roles, working at least one day a week. They did not include teachers on long-term leave, relief teachers, or registered teachers not currently working, all of whom do come under the scope of the general definition of an early career teacher.
Measuring attrition
This section discusses the extent to which attrition is currently measured in Australia, and what is known about teachers entering the workforce at the point of graduation. Course applications and completion are not considered in detail as they are out of the scope of this article.
Graduates eligible for employment
The Victorian supply and demand report suggests that up to 20% of Victorian ITE graduates do not apply for provisional registration in Victoria (Weldon et al., 2015). This is an uncertain figure but the difference between annual graduate and provisional registration numbers justifies the estimate. In Australia, qualified teachers are unable to teach unless they are registered by the state statutory body. So these people, having qualified to teach in Australia, are immediately unavailable to the teaching pool. In some cases, they may be international students (about 5% of ITE graduates) who return to their home country. Other graduates may choose initially to travel, or to teach in another country (the UK and Canada actively recruit Australian teachers), and register at a later point. Given the rise in online ITE courses, some Victorian graduates may actually reside in another state (Edwards & Weldon, 2017). Others may choose to relocate interstate. Some, despite graduating, choose not to enter the classroom at all and find work in other areas.
Then, there are those who graduate and register, but who do not teach. For some, it may be because they cannot find work. The forecast supply of primary and secondary teachers in Victoria is currently higher overall than the forecast demand, so it seems inevitable that some recent graduates will not find work (Weldon et al., 2015). The Graduate Destinations Survey collects data regarding the post-study activity of new graduates about four months after graduation. Victorian data over time show that those with a postgraduate ITE qualification were more likely to be working outside education (31.5%) than those with an undergraduate ITE qualification (14.2%) (Weldon et al., 2015).
Employment stage: moveage
The term moveage was introduced in a 2005 report on teacher attrition in England (Smithers & Robinson, 2005). Moveage refers to the movement of teachers between schools. In the US, the terms used have been leavers and movers (in OECD, 2005). This is an aspect of attrition that is important but often overlooked. Of course, it should be important for individual schools to consider their own attrition in comparison with like schools, just as it should be important for the state government sector (or the Catholic sector) to view the health of their workforce in terms of attrition from their sector. 2 But attrition at the school or sector level is not the same as attrition from teaching.
The most recent SiAS survey showed that about 17% of all primary teachers and 30% of all secondary teachers were working in a different school sector to the one in which they started. A further analysis for this article found that 18% of primary and 27% of secondary early career teachers were teaching in a different sector to the one in which they started. About 10–12% of all teachers were also teaching in a different state to where they started (McKenzie et al., 2014, p. 84).
Analysis of the SiAS data for this article also showed that 48% of primary and 44% of secondary early career teachers had taught in more than one school. This is unsurprising given the high proportion of the early career workforce on short-term contracts (see e.g. Weldon et al., 2015).
These data highlight the difficulty inherent in obtaining accurate attrition data for teachers in Australia. The SiAS data demonstrate that early career teacher attrition figures from a single employer do not represent attrition from teaching: a proportion will be teachers moving to other employers.
A national teacher registration or identification system would be required in order to obtain accurate data that took moveage into account. Recent work for the Australian DET and the Australian Institute for Teaching and School Leadership (AISTL) has recommended the further development of a national teacher workforce dataset, including a unique teacher identifier (Mitchell Institute et al., 2015, p. 10).
Employment stage: wastage
Quoting a single, overall proportion of attrition suggests that it is possible to have an overview of the entire teaching population. As noted above, such an overview is currently not possible in Australia. It would be disingenuous to claim that any single figure could refer to teachers leaving the profession because data are available which show that teachers move between states and sectors, and also leave and return, a point noted in a paper by Buchanan (2012).
The SiAS surveys looked at interruptions to the teaching career and found that about one quarter of women at both primary and secondary levels were absent for two years or less and about 10% were absent for 3–5 years and 10% were absent for 6–10 years (McKenzie et al., 2014, p. 82). The corresponding numbers were considerably lower for men. An additional analysis for this article found that about 9% of female teachers in their first five years of teaching had interrupted their career and half of these (or about 4%) had done so for three years or more.
In addition, responses to another question in SiAS revealed that 13% of primary teachers and 15% of secondary teachers had previously resigned from teaching. Of these, just under half cited changed personal or family reasons for their return. One-third of returning teachers said they had come back because they missed teaching (McKenzie et al., 2014, p. 101).
Such data demonstrate that in terms of a definition, attrition should not be conflated with wastage, which refers to teachers departing the profession (not moving between school sectors and not returning at a later point). It is generally assumed that a teacher who leaves a position without taking another teaching position is lost to the profession. This fails to recognize growing workforce agility and, more particularly, a common decision (usually) by women to leave the workforce for several years in order to care for young children.
The data also show that it is inappropriate to assume that all early career attrition is negative. Movement between schools, systems, and sectors can be positive. No one expects teachers to stay in the same position for a lifetime. A promotion, a fresh environment, different colleagues, different challenges, different ways of doing things can be important for the health and career progression of employees in most industries. Leaving teaching for career or family reasons is also not necessarily negative for the individual. It may also be the case that some who leave teaching early in their career have found themselves unsuited to it.
Exit points in the pipeline
Based on the discussion and figures presented above, Table 2 provides exit figures for each stage of the teacher supply pipeline, where known. The moveage figures are highlighted in grey as they do not represent attrition from teaching, but from schools and sectors or state/territory. As was noted in the first part of this article, there is little actual evidence in Australia to confirm the high figures often quoted for the attrition of early career teachers in active employment. The issue of moveage and its potential to affect the accuracy of attrition figures is seldom discussed.
Known and unknown attrition figures in the teacher supply pipeline.
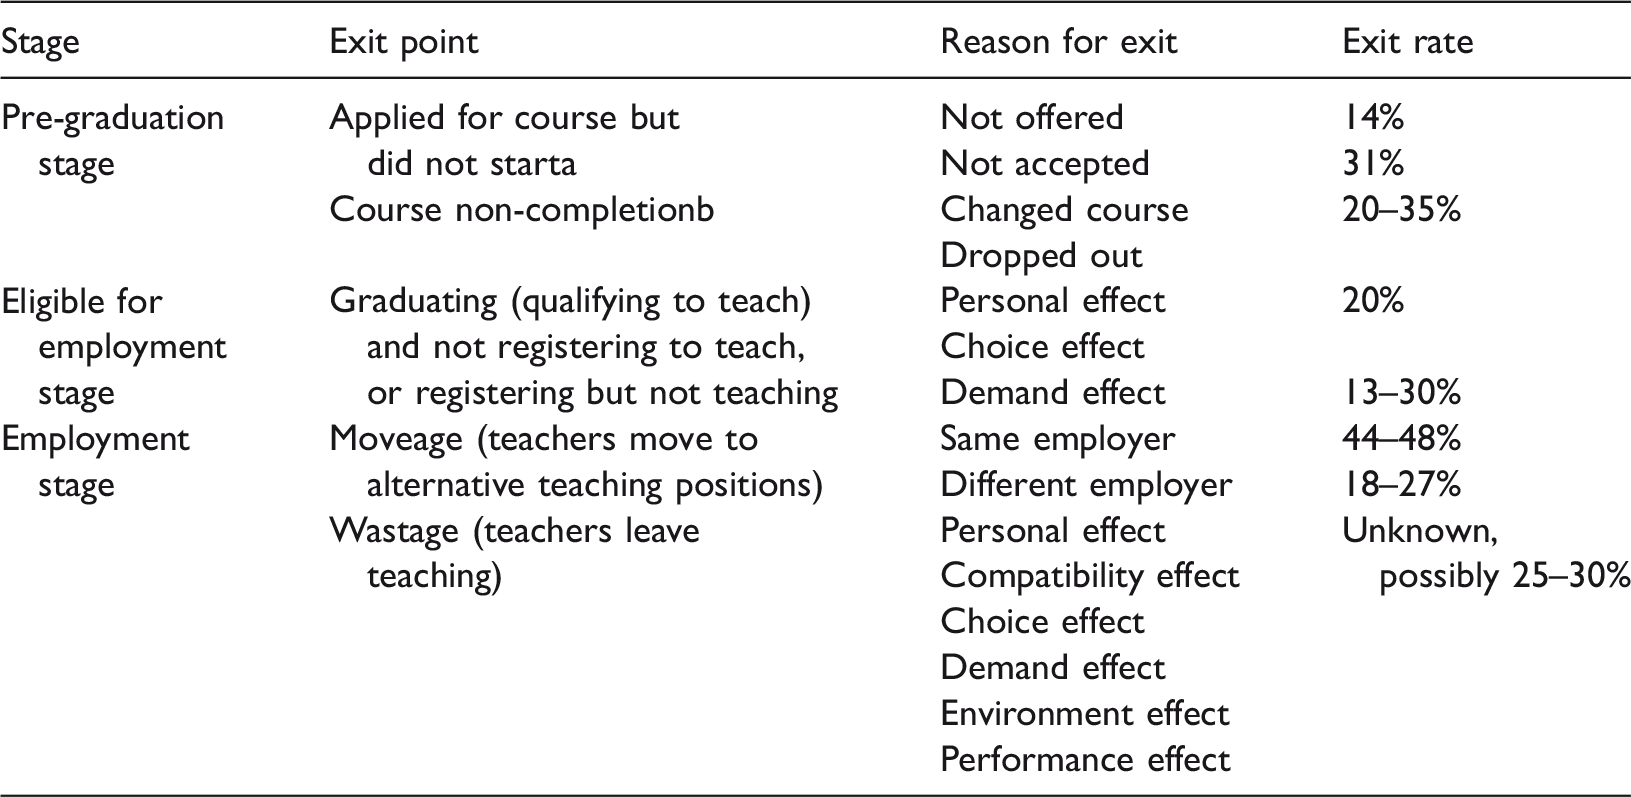
aBased on Victorian figures: see Weldon, Shah & Rowley, 2015.
bBased on national figures: see AITSL 2016.
On the basis of the figures in Table 2, 100 graduating students would yield 49–60 teachers still teaching after five years. If the wastage figures really are as high as 40–50%, 35–48 of 100 graduating students would still be teaching after five years.
Capturing attrition data
If a national method for capturing attrition is developed, an important consideration would be the equivalent of an exit interview as a means of asking about the reasons for leaving the profession. Table 1 suggested six major areas affecting the decision to leave teaching having qualified to teach:
Demand effect—teachers unable to find regular employment Personal effect—leaving for personal or family reasons, such as illness Compatibility effect—leaving due to feeling unsuited for the role Career Choice effect—leaving to pursue an alternative career Environment effect—leaving due to lack of support, school and leadership culture, workload, etc. Performance effect—teachers sacked/de-registered due to poor performance or illegal activity
From their analysis of the Australian literature, Mason and Poyatos Matas (2015) identify 13 themes contributing to attrition or retention of Australian teachers. All 13 fall within what is termed above as the Environment effect. However, teachers leaving for personal or family reasons, or to pursue a different career, have not necessarily had a negative experience of teaching. Given the high rates of short-term contracts in the early career workforce, it is highly likely that demand issues play a larger role in attrition than is generally assumed in reporting. As well as short-term contracts, teaching is increasingly becoming a part-time profession, with over one quarter of primary teachers and one in five secondary teachers working part-time (Weldon, 2015). Younger teachers are less likely to be employed part-time (Weldon et al., 2015) and it is not clear to what extent the trend for part-time teachers impacts on demand for early career teachers.
Attrition from regional, rural, and remote schools may be a consequence of location as teachers moving to rural areas can face lack of resources, cultural barriers, lack of preparation for multi-age classrooms, social isolation, and a lack of shops and leisure activities (Hudson & Hudson, 2008; Roberts, 2005; Starr & White, 2008). These issues highlight a need to pay close attention to the context surrounding attrition.
To understand attrition better, it would be useful to collect data on the variables indicated in Table 3. For example, a proportion of early career teachers in Australia (14–16%) is aged over 40 (McKenzie et al., 2014). Hence, a break down by age would answer the question as to whether attrition rates are different for this older cohort than for younger teachers. Moreover, it would be helpful to understand not only if levels of attrition differed by age group but also whether reasons for attrition differed for various age groups. Finally, level of schooling is important to understanding attrition as teachers at secondary school level in different subject areas have different levels of access to employment outside education. Given the potential for teacher shortages in subjects such as mathematics, information technology, physics and chemistry, it is important to understand whether attrition rates differ by subject areas. Therefore, location, gender, school socioeconomic status, sector, and schooling level are all likely to affect attrition rates in different ways. Data at this level have the potential to assist with the better targeting of policies to reduce attrition as well as a greater understanding of the supply pipeline and the different points at which teachers potentially exit.
Proposed variables to collect alongside attrition data.
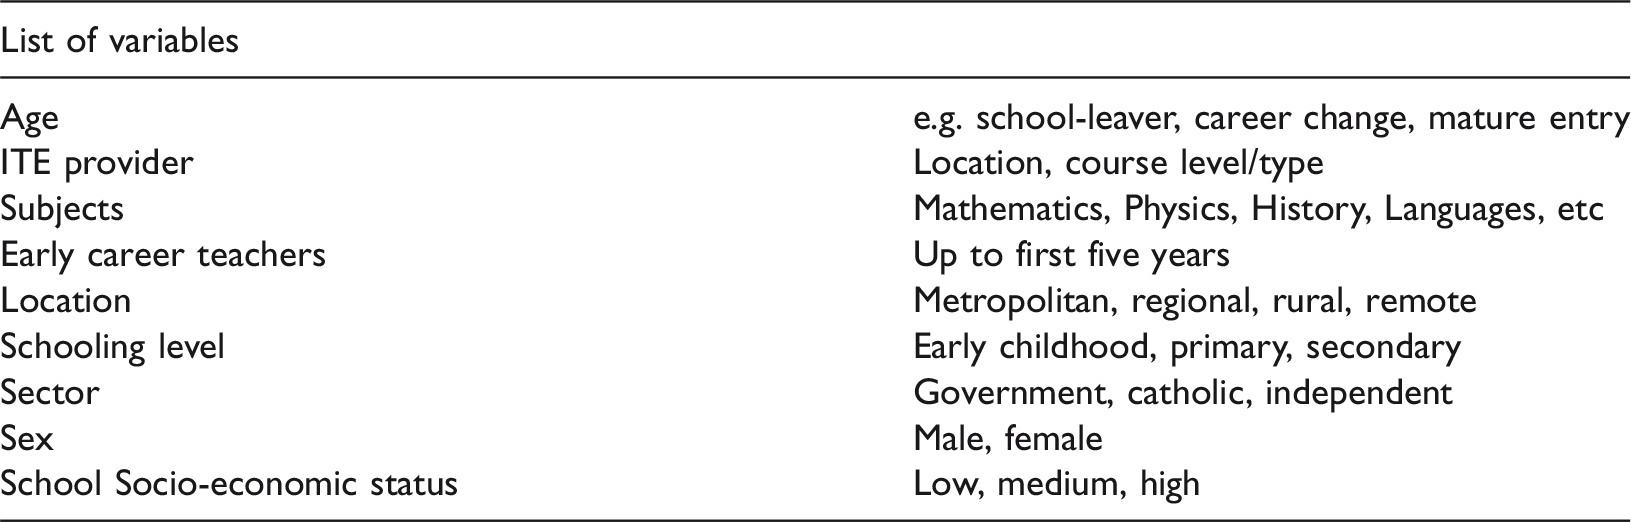
ITE: initial teacher education.
Conclusion
The attrition rate of early career teachers in Australia is an issue, but not because it is worryingly high or an intractable problem of epidemic proportions. While these claims may be true there is currently no reliable evidence to support them. Therefore, the main issue is that the attrition rate in Australia is, in fact, not well established. It is unknown.
Regular government-sponsored reviews and academic research in the area over the last two decades have all said the same thing—that there is a teacher attrition problem, and that early career teachers should be better supported. This article does not seek to deny that attrition is a factor that merits investigation, but rather to suggest that it is inappropriate to quote figures as high as 50% without reliable Australian evidence and an agreed definition.
Policies have changed in the last decade and additional supports have been provided in various jurisdictions around Australia. However, it is currently not known—nor do we currently have any means of knowing—to what extent these policies have made a difference. Defining common terms such as early career teacher, or attrition, and collecting national Australian data to monitor actual attrition rates over time and for important subsets of the teaching workforce is an important and overdue innovation that would impact policy makers, ITE design, and schools. Such data would inform questions such as:
Which supports and school environments work to retain early career teachers? Current topical issues such as how many science, technology, engineering and mathematics (STEM) teachers are coming into the workforce compared to teachers in other fields and is there a difference in retention between fields? Are there differences in retention in metropolitan and regional settings and are different policy settings in different states making a difference? Do attrition rates change over time and, if so, what causes these changes? What is the impact of temporary positions on early career teachers?
Without reliable baseline data and ongoing measurement, this field will continue to rely on international figures and continue to attract an emotive and negative commentary that, in itself, is unlikely to create change.
Scholarly articles and, indeed, media articles, in a field that is regularly the subject of media interest would benefit from a more cautious assessment of the issues and less reliance on an overall, contested early career teacher attrition figure for a diverse, dynamic and evolving teaching workforce as a source of context for their reporting.
Footnotes
Author’s note
As this article is a review of the literature, articles in the reference section are marked as follows:
No preceding asterisk: In-text reference in article, not part of the review materials.
One preceding asterisk (*): In-text reference in article and part of the review materials.
Two preceding asterisks (**): Article in review material only, not referenced in article.
Declaration of conflicting interests
The author(s) declared no potential conflicts of interest with respect to the research, authorship, and/or publication of this article.
Funding
The author(s) received no financial support for the research, authorship, and/or publication of this article.
Notes
References
Supplementary Material
Please find the following supplemental material available below.
For Open Access articles published under a Creative Commons License, all supplemental material carries the same license as the article it is associated with.
For non-Open Access articles published, all supplemental material carries a non-exclusive license, and permission requests for re-use of supplemental material or any part of supplemental material shall be sent directly to the copyright owner as specified in the copyright notice associated with the article.