
Abstract
This article reports on the development and implementation of the Student Success Program, a strategic, University-wide, consistent approach to increasing the success and retention of first year students, during 2014. To this end, a centrally coordinated process integrated historic student, application, enrolment, academic performance and learning management data in a data warehouse. These data were used to build chi-squared automatic iterative detection (CHAID) decision tree models aimed at predicting each student’s risk of attrition. Predictions were made multiple times per year before peak attrition time points to allow for changes in student behaviour and availability of new data. An intervention using peer-to-peer phone-call communication targeted students with the largest predicted risks, to offer support, foster retention and enable a successful outcome in higher education. The accuracy of the chi-squared automatic iterative detection models benefited most from the inclusion of data representing first year student study behaviours.
Keywords
Background
Australian students in their first year of higher education experience higher levels of attrition compared to later year students (Department of Education and Training, 2013). Similar to results reported by Ward and Banks (2011), most attrition among first year students at Flinders University in South Australia occurs by the end of the first semester and is concentrated just before each Census in both semesters, and at the end of each semester. The Census date is the final date in which a student can withdraw from studies without incurring a financial liability, and is thus a major trigger for attrition. Early attrition, particularly within the first year of study, is attributed to a variety of reasons including students struggling with the transition to university, boredom, lack of interest, inadequate preparation, insufficient academic and social engagement, negotiating an appropriate balance between study-loads and personal commitments, and dissatisfaction with the course or university (Coates, 2014; Hobsons, 2014).
Internal research using Flinders University student exit surveys suggests a capacity to reduce attrition (Flinders University, 2016). A study by Coates (2014) showed that more effective provision of student support would improve retention, given the strong relationship between these two aspects. In addition, Kokaua, Sopoaga, Zaharic, and Van der Meer (2014) discussed the notion that students often sought help only after already having failed elements of their course work, with intervention unlikely to be of benefit. It is assumed that the effectiveness of support services could be improved by targeting those who would benefit from using the services, and by delivering the support just-in-time.
Increased competitiveness, emerging technologies, greater variety and improved access to student data have enabled universities to employ targeted retention strategies (Ward & Banks, 2011). Higher education has started to use predictive analytics techniques which have been applied in the commercial sector to target and retain customers for many years now (Bloemer, De Ruyter, & Peeters, 1998). Predictive analytic techniques in higher education have incorporated the use of demographics, application and enrolment related characteristics and academic performance since research has shown an association between these characteristics and attrition (Griffith University, 2012; Harvey & Luckman, 2014). However, the accuracy and precision of predictive models in the commercial setting are higher than for most models within the higher education sector, due to the use of behavioural data (Buckinx & Van den Poel, 2005).
The Office for Learning & Teaching (2015) undertook recently a review of analyses across the higher education sector of behavioural data collected from user interactions with technologies, such as Learning Management System (LMS) data. The study revealed an increasing adoption of analysing LMS data as a process to address student retention (Campbell, DeBlois, & Oblinger, 2007; Jayaprakash, Moody, Lauría, Regan, & Baron, 2014; Macfadyen & Dawson, 2010; Wolff, Zdrahal, Nikolov, & Pantucek, 2013). Nevertheless, no study referenced in the review combined the use of student demographic, application, enrolment and academic performance data located outside of the LMS with learning behaviour data from the LMS to address student retention.
However, Flinders University is aware of two other Australian institutions which have combined similarly extensive lists of student data to address student retention in recent years (Deakin University, 2015). In addition, Altis (2015) recently made available a function that combines multiple sources of data to examine retention. However, the solution was based on an arguably subjective model which had staff assign attrition risks rather than an objective predictive model which assigned attrition risks based on historic data. At that time, no Australian university had adopted Altis’ proposed solution. While there has been significant progress, the higher education sector continues to lag behind the commercial sector with respect to integrating behavioural data using student data from all available sources to build a predictive analytics capability that can address student retention across an institution.
The use of behavioural data has the potential to introduce significant gains in accuracy and precision of predictions in all predictive model forms. Marginal components of behavioural data used to build commercial models follow seasonal trends that are unrelated to attrition. The remainder of behavioural data is strongly related to attrition, an association that is independent of the time of year. A resulting benefit includes the ability to use all historical data, regardless of the time of attrition, to develop and run a single attrition model at any point in time. Unlike the commercial sector, student learning and engagement behaviours in the higher education sector are very dependent on the time of academic semester and year. Consequently, a separate model predicting attrition in higher education needs to be built for a particular time of the year.
While survival analysis, decision trees and neural networks are utilised in both sectors, higher education predictive models often predict long-term attrition either when students begin their studies or at the beginning of an academic year (Eshghi et al., 2011; Harvey & Luckman, 2014; Nandeshwar et al., 2011; Pike & Graunke, 2015; Smith & Naylor, 2001; Ward & Banks, 2011). Changes in behaviours occurring immediately before attrition, such as a reduction in engagement with an online component of learning, occur in the lead up to an attrition event. Since predictive models in the higher education sector are commonly built at the beginning of a year, they are unable to incorporate changes in student behaviour that occur after the models are run.
In order to further maximise the accuracy and precision of a predictive model, and to capture and incorporate changes in behaviours, it is important to choose a time point that is known to have high attrition incidence. As mentioned earlier, attrition events are concentrated just before each Census in both semesters, and at the end of each semester. The introduction of behavioural data and their integration with data from all other available sources in predicting attrition occurring in the lead up to each Census date has the potential to improve greatly the accuracy and precision compared with traditional higher education predictive models.
Predictive models built within the commercial sector commonly use hazard and survival functions that are based upon predicting continuous and ongoing attrition, since customer lifecycles can start and end at any time (Drew, Mani, Betz, & Datta, 2001; Lu, 2002; Van den Poel & Larivere, 2004). These functions allow businesses to predict whether and when a customer is likely to leave. Traditional models have features such as the handling of missing data which limit the models’ usefulness in the proposed context (Friedman, Hastie, & Tibshirani, 2001). Where such models are used to predict attrition, students for whom information is missing must either be excluded from estimation and consequently from targeted interventions, or valuable variables with missing values must be removed from the list of inputs to the predictive model. Although such models have frequently been adopted in the higher education sector (Campbell et al., 2007; Jayaprakash et al., 2014; Macfadyen & Dawson, 2010), other models, for example those using non-parametric techniques, must be considered to overcome those issues.
Non-parametric decision tree algorithms, such as the chi-squared automatic iterative detection (CHAID) decision tree model, have been used to predict customer attrition in the commercial sector, and have been shown to outperform parametric predictive models (Au, Ma, & Li, 2003; Buckinx & Van den Poel, 2005). Au and colleagues (2003) discuss that in addition to precision and accuracy, the benefits of a decision tree method include model parsimony, robustness, handling of missing data, enabling the inclusion of customers with missing data in retention activities. CHAID models are relatively simple to interpret, validate and implement (Ramaswami & Bhaskaran, 2010), suit the available data and are consequently an appropriate choice for predicting student attrition.
This article combines the benefit and practicality of solutions in both sectors by using behavioural data to predict shorter-term student attrition using CHAID. The CHAID model is a tool that utilises chi-squared significance tests to automatically and iteratively divide the population up into optimal subsets, according to student characteristics that best describe each student’s probability of early departure. CHAID, originally proposed by Kass (1980), allows outcome and predictor variables to be either continuous or categorical with both of these data types being common in higher education. In order to be used in building the decision trees, continuous predictors are automatically divided into categories that most optimally divide the population according to attrition probabilities. CHAID can also handle missing data, which is important when missing information has a meaning in itself which needs to be treated differently from zero values, particularly in relation to behavioural data.
CHAID models were developed to predict each student’s risk of attrition as part of the Student Success Program (SSP) which was introduced to Flinders University in 2014 to identify and target students at risk of dropping out of university (Seidel & Kutieleh, 2015). Models were run multiple times per year, before peak attrition time points. Cortell Australia was commissioned to build the data mining process in SPSS Modeller. Outputs from CHAID predictive models, built from a large volume and variety of data sourced from multiple systems, formed the basis of a targeted intervention strategy.
The intervention
The intervention strategy consisted of peer-to-peer communication whereby students with highest predicted attrition probabilities were contacted by students in their second or subsequent year of study, offered advice and referred to relevant support services where considered appropriate and helpful. Each instance that the intervention strategy was implemented was known as a campaign. Four campaigns were conducted in each semester before each peak attrition time point and provided targeted support to complement the transition timeline of the academic year which combines all aspects of an institution from a first-year student-centred perspective (Nelson, Kift, Humphreys, & Harper, 2006).
Flinders University teaches in two semesters per year. The campaigns were run in weeks 2, 4, 8 and 12 during each semester. Each semester consisted of 12 teaching weeks, with the Census day falling on the Friday of week 5. Thus, two of the scheduled campaigns in each semester were held before Census and two were held after Census. The final campaign was held just before the examination period. Each campaign involved running a separate predictive model, producing a refreshed ranked list of all ‘in scope’ students (see first paragraph under ‘Target population’ section below), and implementing an agreed communication strategy.
The intention was for the SSP to increase student satisfaction with the University, enable students to make informed decisions about their future in higher education and minimise preventable attrition occurring among first year students at Flinders.
Method
Target population
Student data use in predictive models.
Students with zero current enrolled study load were excluded from modelling as a student withdrawing from all coursework was immediately and deterministically identified and encouraged to participate in retention processes other than the SSP.
Data
Prior research and personal experiences led the researchers to consider all data sources, both static and dynamic, that were readily available for all students in scope (Griffith University, 2012; Harvey & Luckman, 2014). Warehousing and connectivity across the campus allowed a variety of data sources to be considered, including:
Student demographics Application to higher education via the South Australian Tertiary Admissions Centre (SATAC) Course and topic enrolment characteristics Academic performance in secondary and higher education Logins to enrolment systems Registrations into lectures, tutorials, practicals and seminars Logins to online LMS (Learning Management System) known as FLO (Flinders Learning Online)
The availability, completeness and use of data in predictive models grew as the academic year progressed. Student demographic data was available as soon as students began to enrol. As the academic year progressed, and the beginning of each semester approached, students started to log into enrolment systems to enrol themselves in topics, lectures, tutorials, practicals and seminars. Once the semester began, students started to engage with FLO to work on a variety of course-related tasks such as assessments. Enrolment system and LMS logins are both forms of behavioural data. Academic performance in topics became available after the end of each semester. Increasing availability and completeness of data allowed predictive models developed later in the year to utilise more information.
Predictive models were built using up to five years of historical data, from years 2009 to 2013. However, LMS login data were only available from 2012. Consequently, models that utilised these data were built using only two years of historical data.
Predictive models
SPSS Modeller was the statistical software used to:
connect to databases across the University to extract, integrate, format, summarise and construct a variety of data sources, develop a data-mining process, build models to predict each student’s likelihood of attrition, output student data and predicted risk values required for intervention.
The integrated data were stored within a local secure Oracle database.
Key periods in the transition timeline and peak attrition time points were identified to ensure timely intervention, to maximise the accuracy of the predictive models and to minimise the number of students leaving the University for preventable reasons. Figure 1 below shows three distinct periods of attrition, along with three associated key events – enrolment, Census date and the end of semester whereby Census in the following semester was used as a proxy for this last point.
Attrition periods and key events.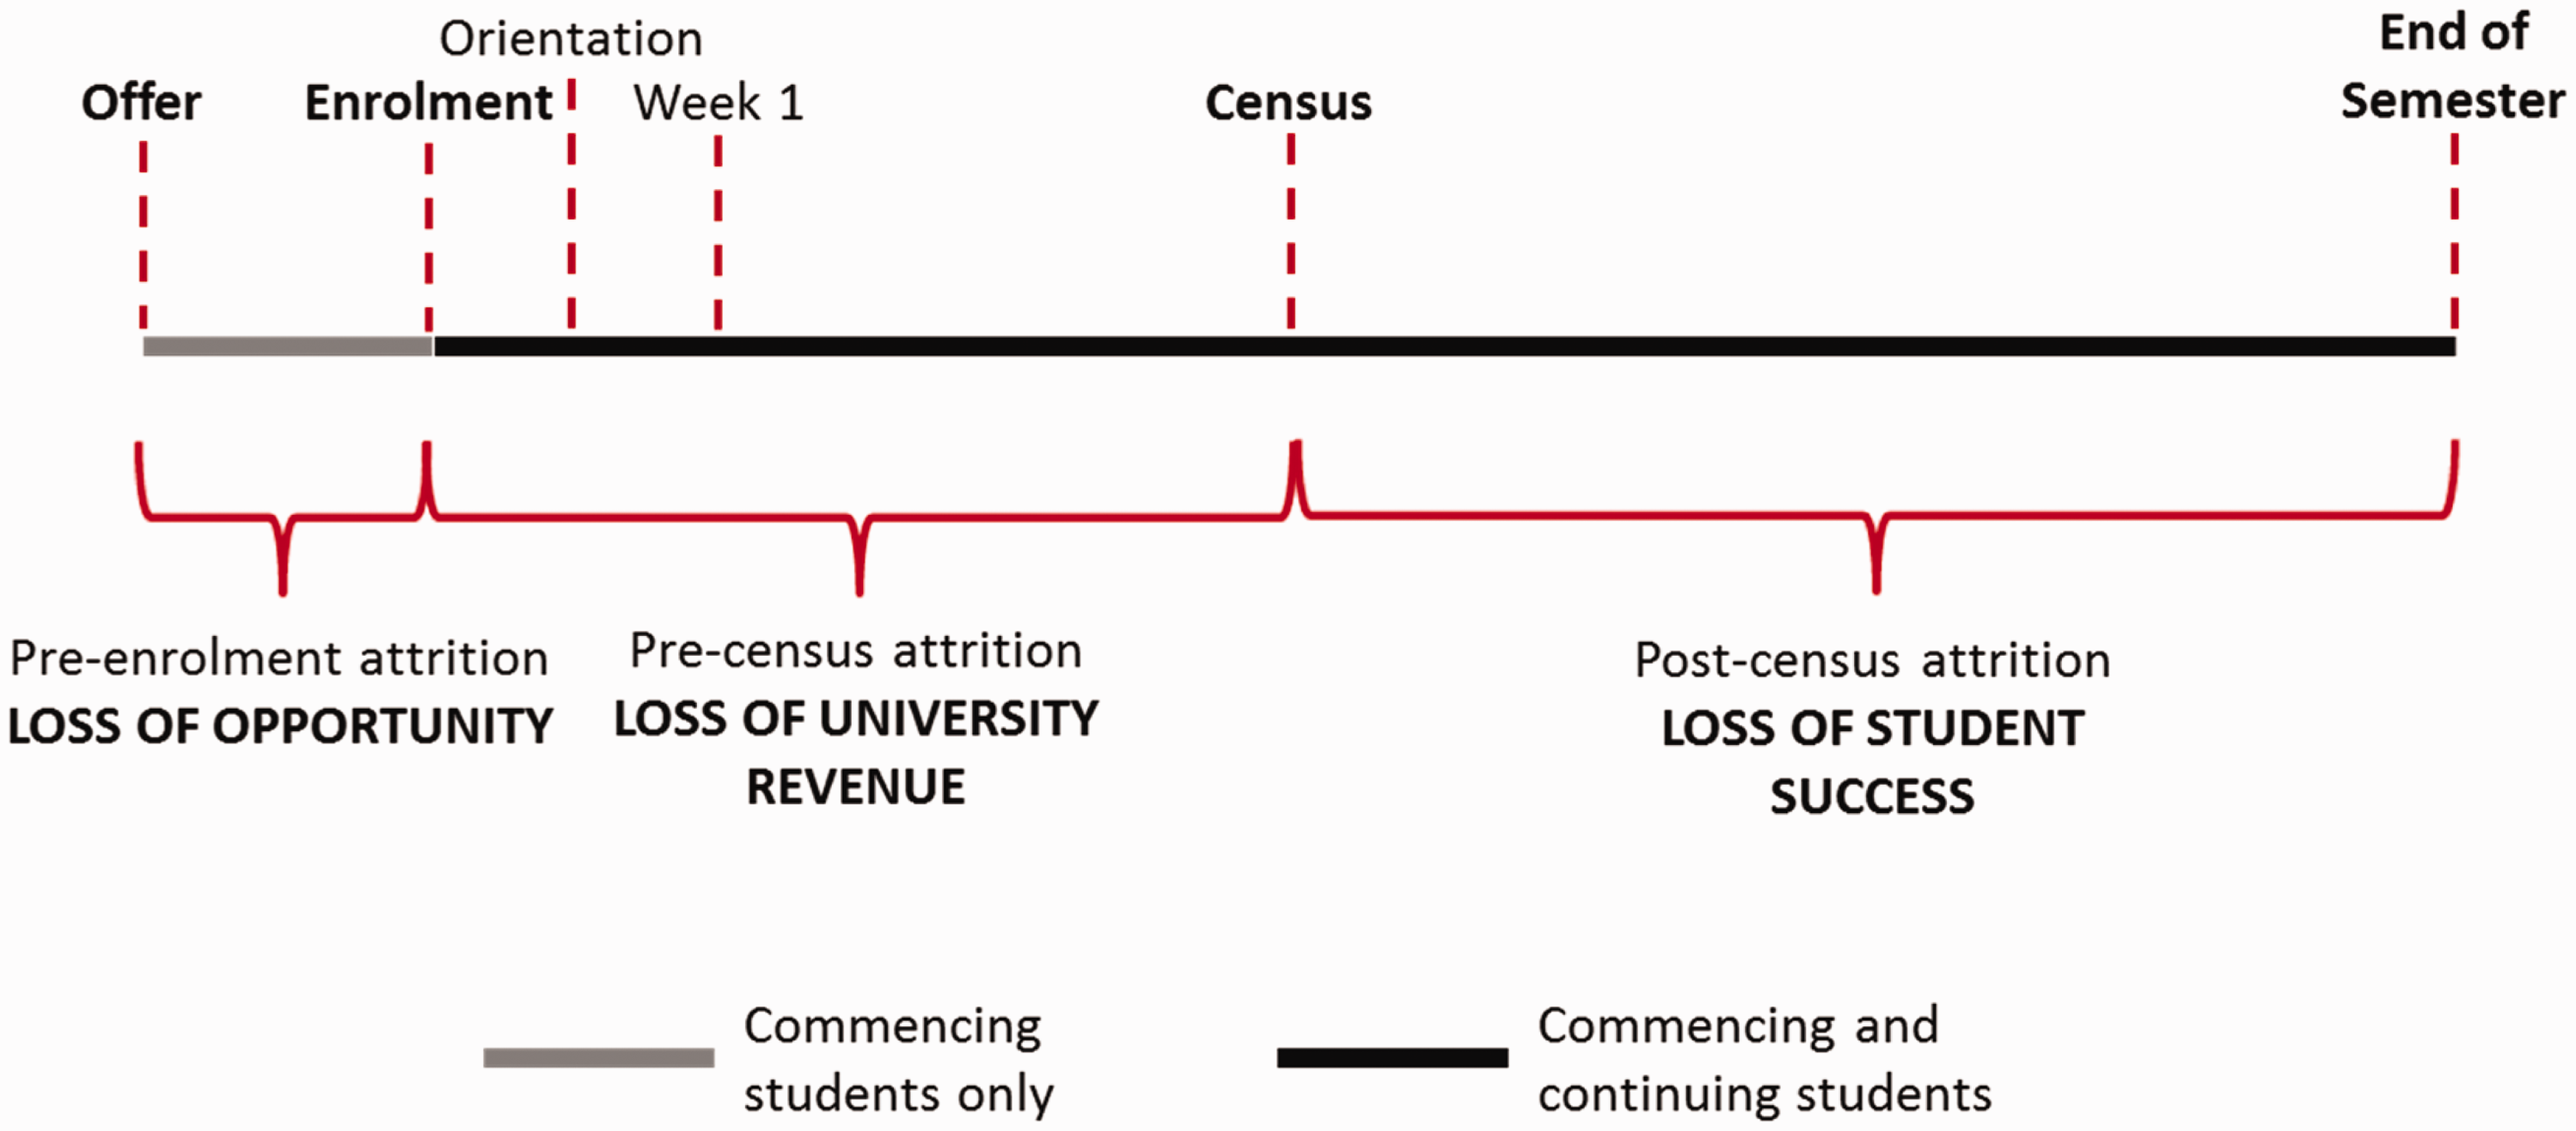
Course enrolment data at Census were used to determine each student’s attrition status, either enrolled or withdrawn, because it could accurately identify historically the time of each student’s exit. Students who left soon after Census could not be distinguished from those who continued until the end of semester and did not return the following semester. However, due to low incidence of withdrawals after Census, and limited availability and accuracy of data to identify such students, the use of enrolment data at Census in the following semester was still considered the most adequate solution.
An overview of the modelling can be seen in Figures 2 and 3 below, for pre- and post-Census attrition, respectively. While these figures represent a student’s first semester of study, most aspects also apply to later semesters of study.
Modelling overview – pre-Census. Modelling overview – post-Census.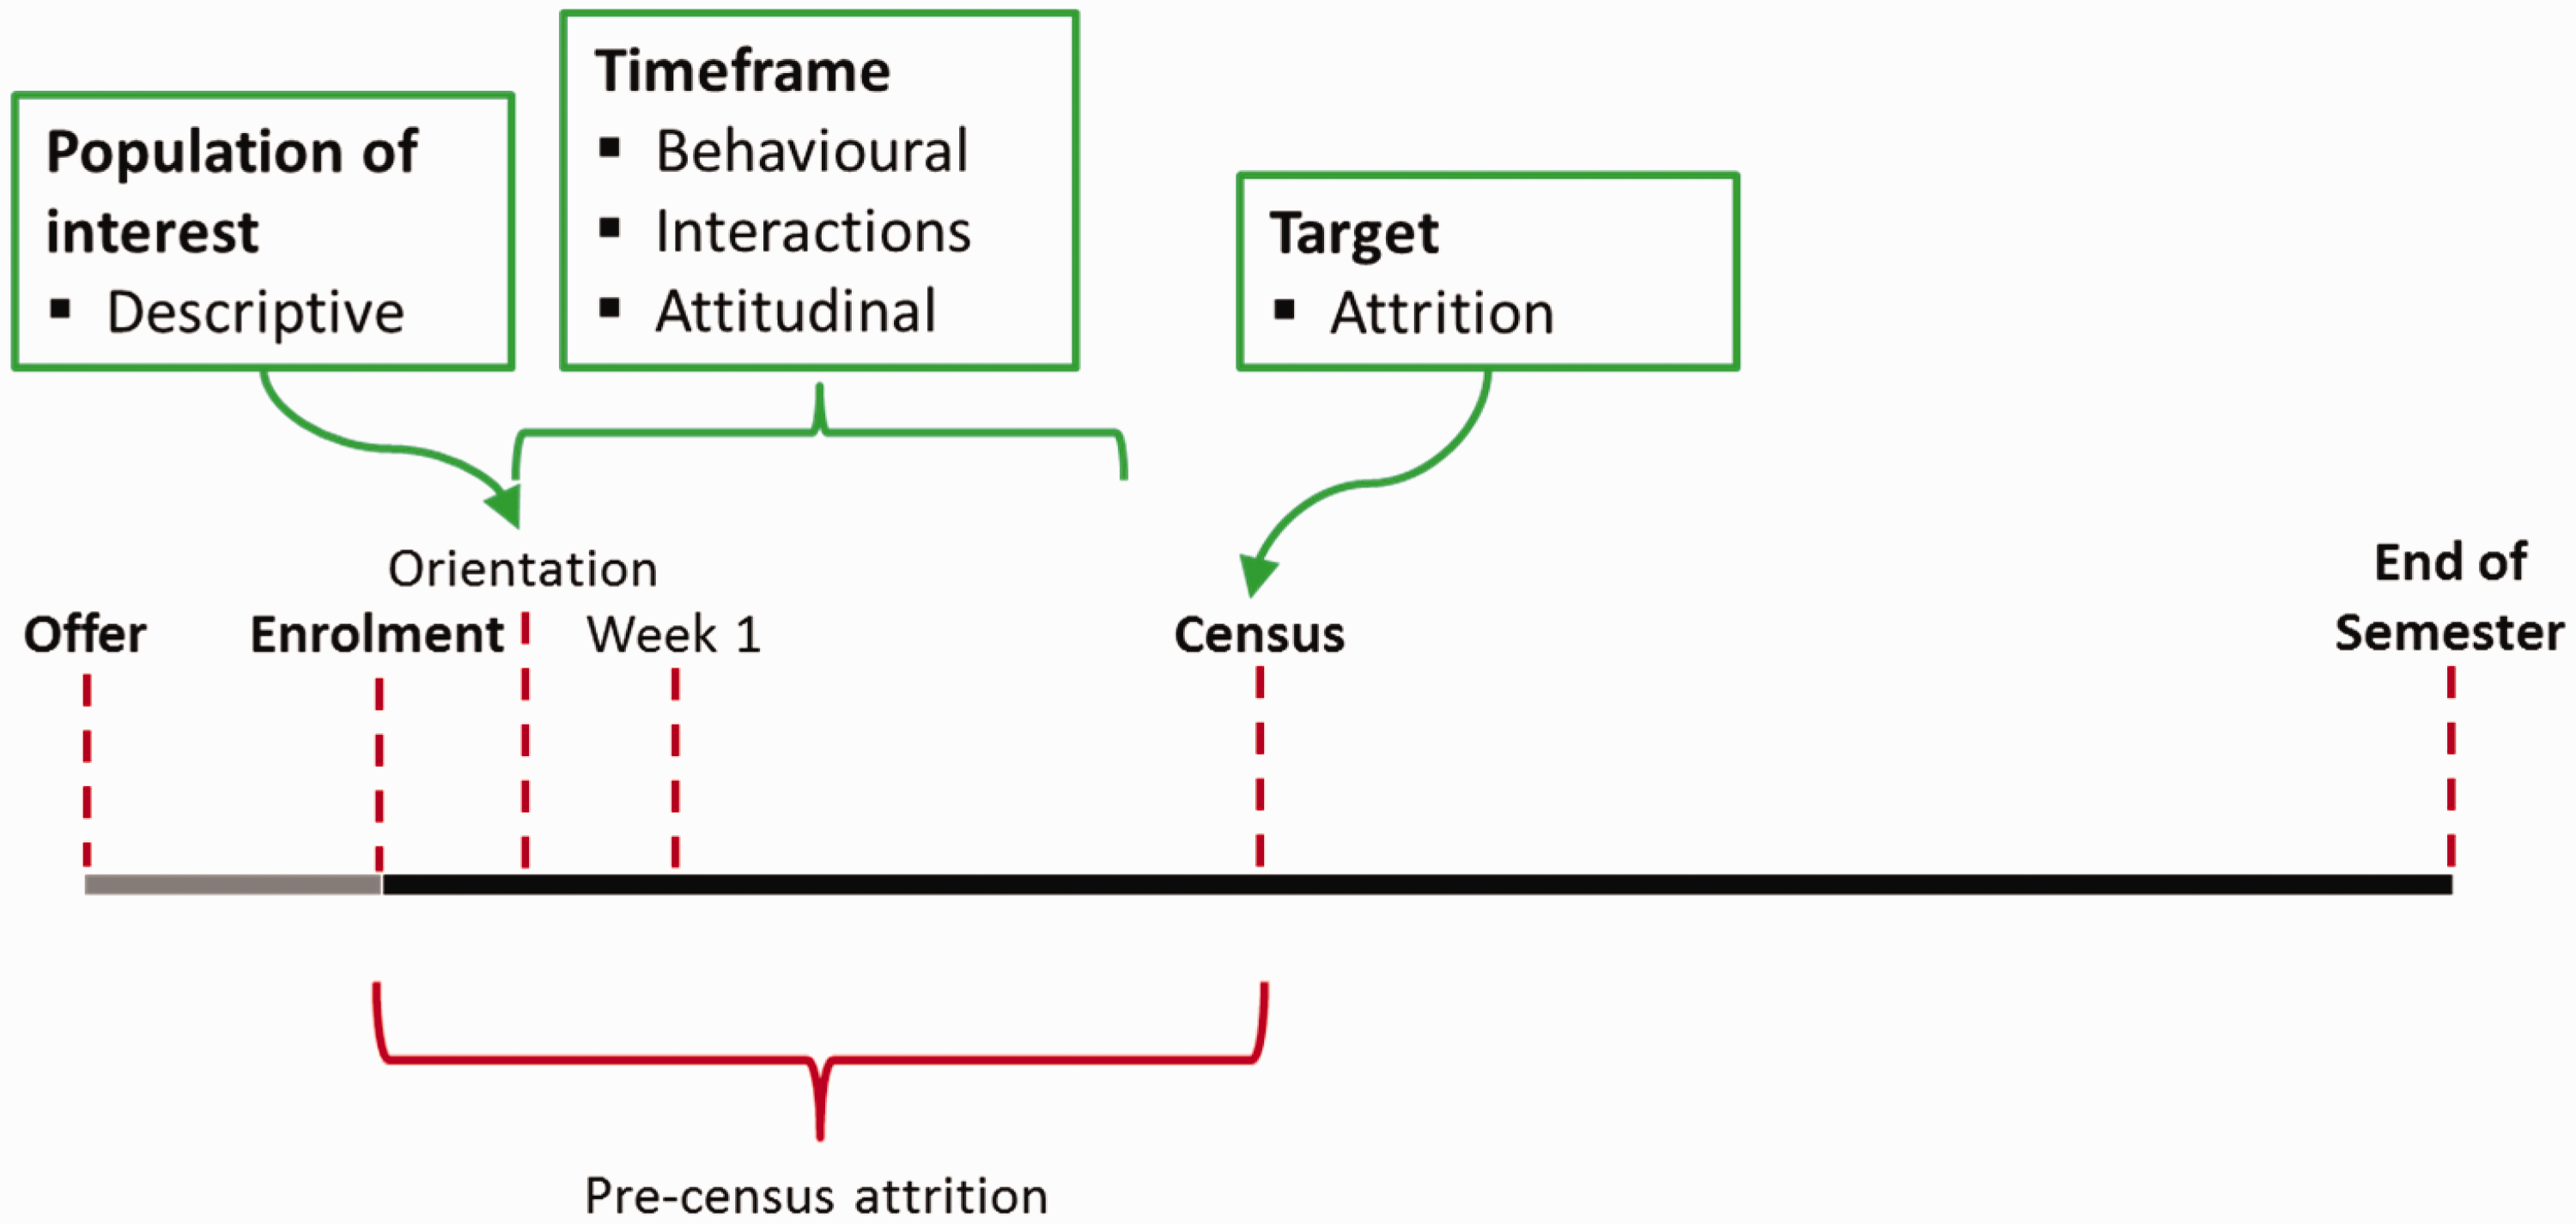
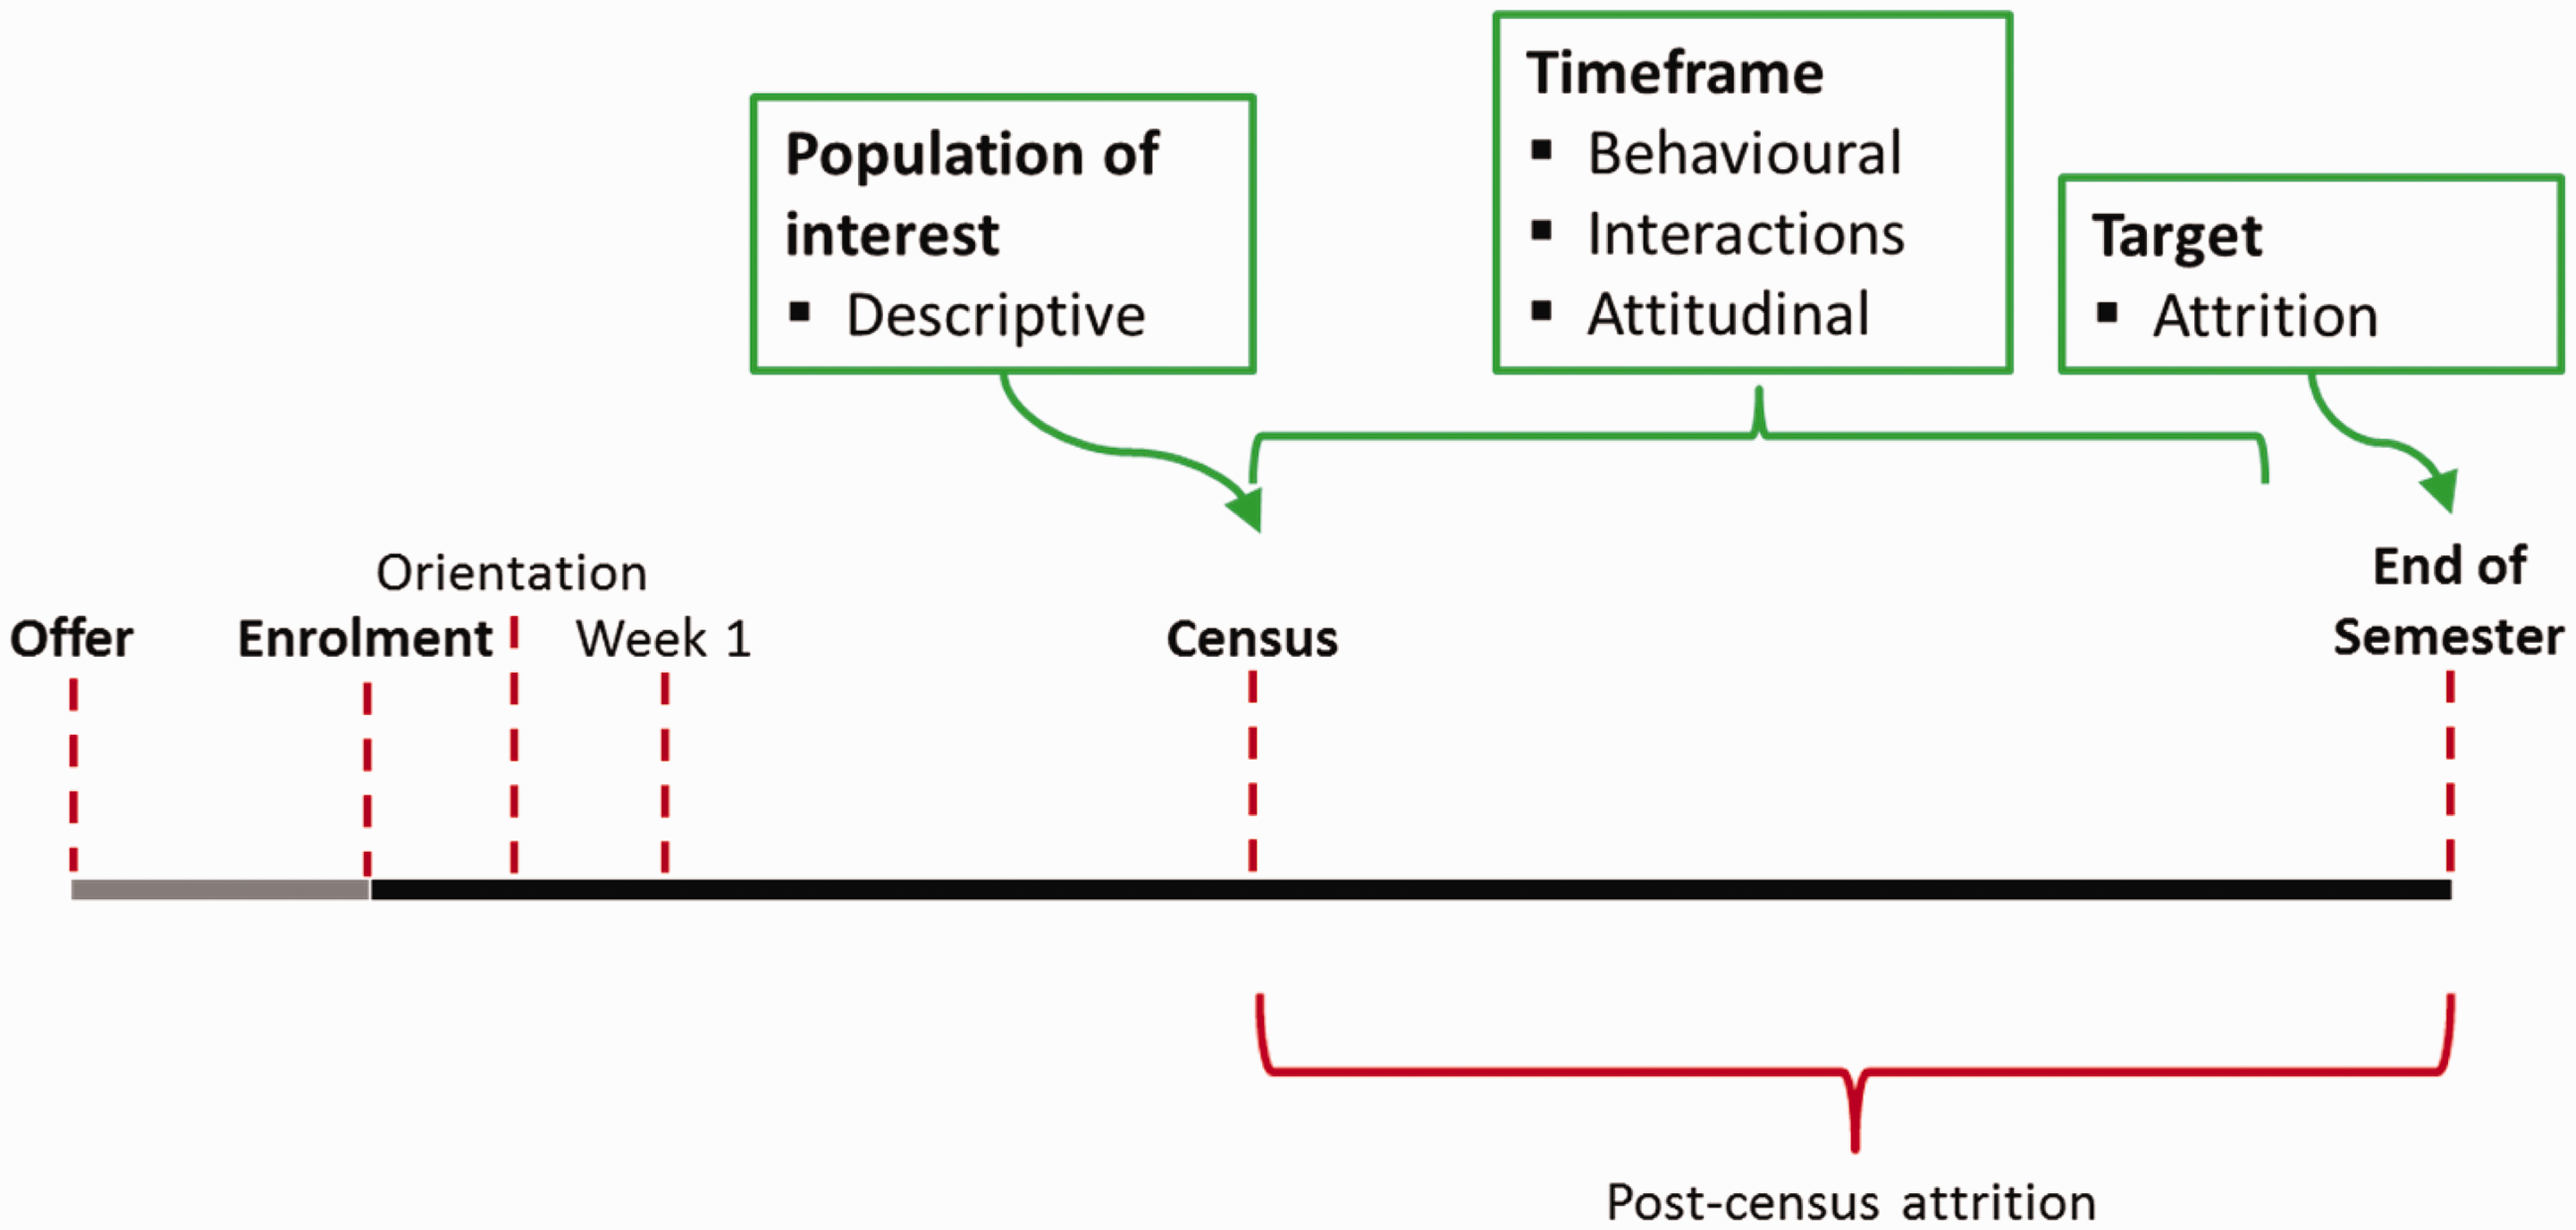
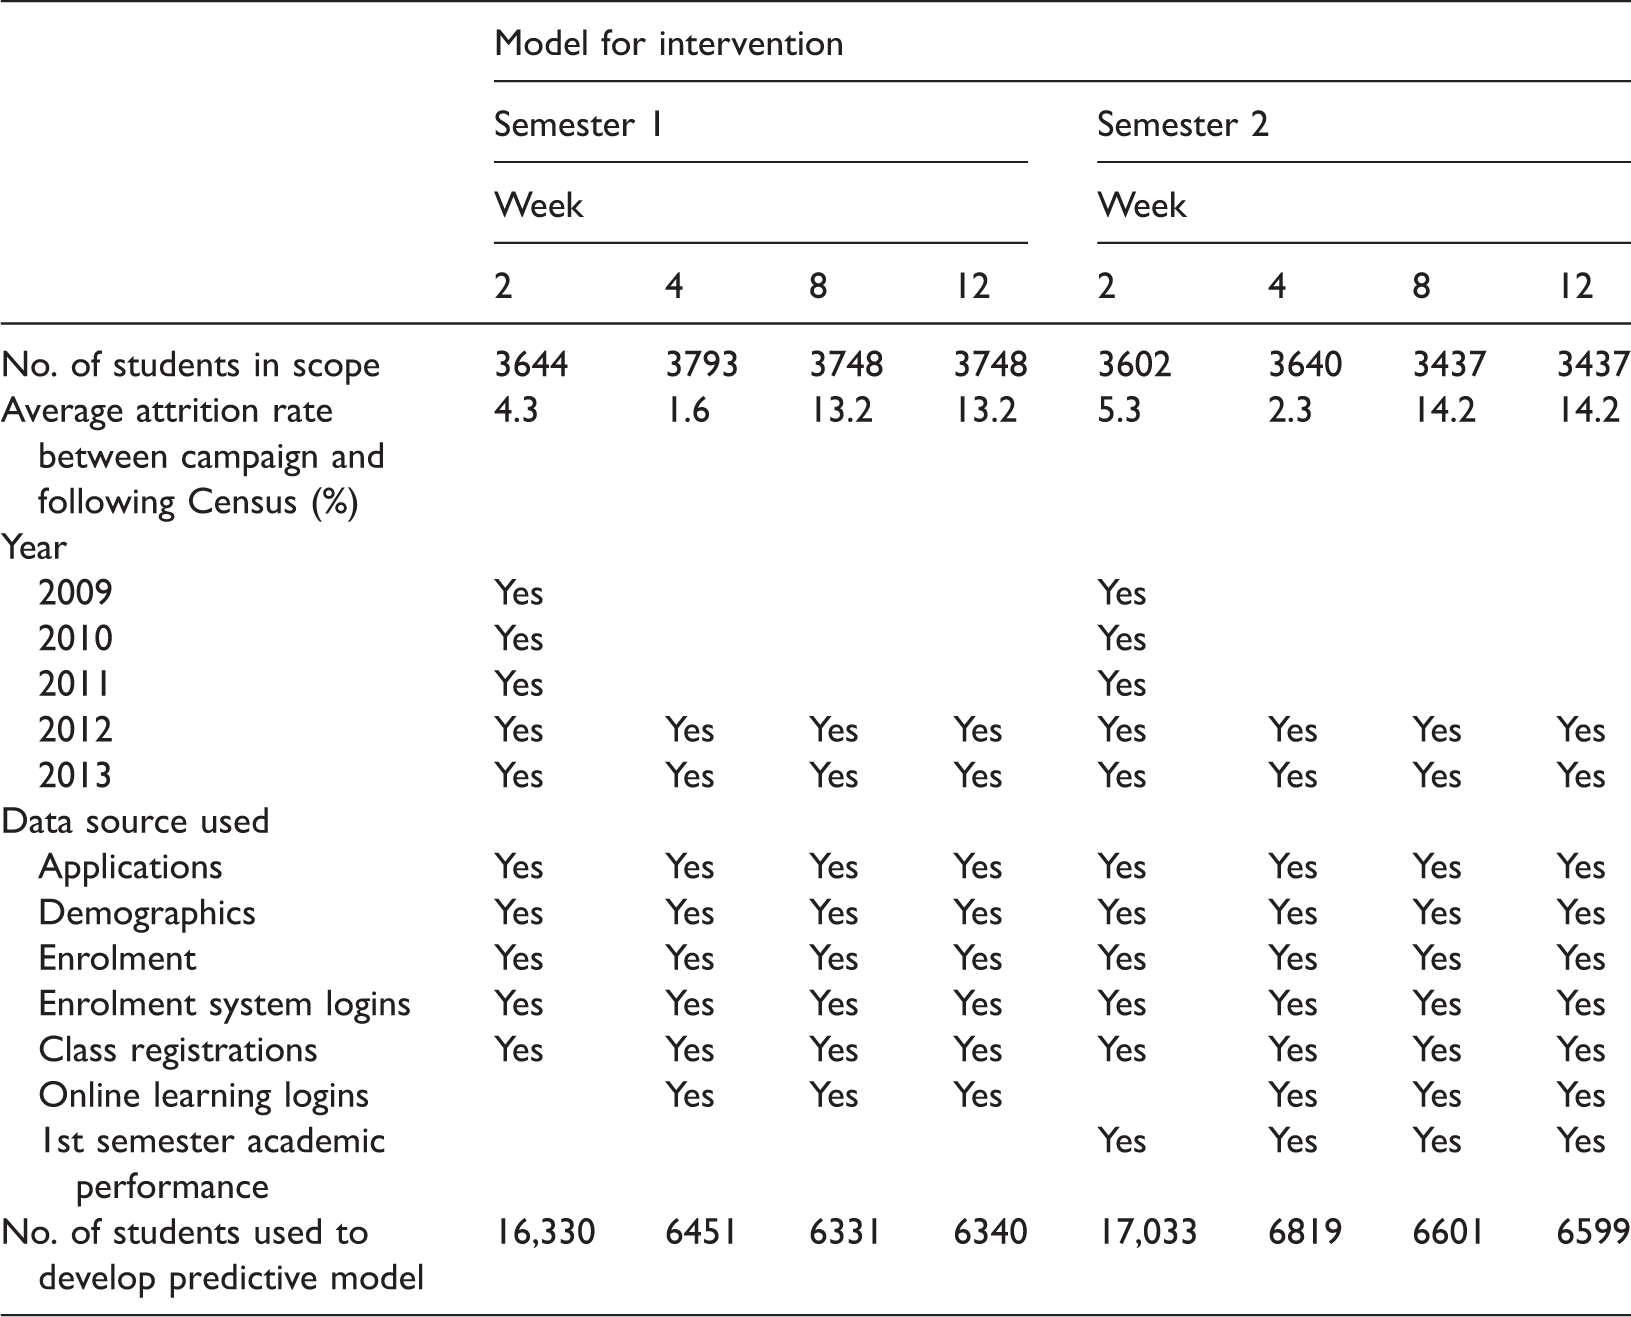
Table 1 presents the details of the number of students in scope, the data sources and years used to develop the eight predictive models. Campaigns can be identified in the table by the semester in which they were run, including either Semester 1 or Semester 2, and the week of semester in which they were run, including Week 2, Week 4, Week 8 and Week 12.
Table 1 shows that five years of historic data were used to build the CHAID models in week 2 (in both semester 1 and 2), and consequently used more data than the models in weeks 4, 8 and 12 (in both semester 1 and 2). Table 1 also shows that campaigns in weeks 8 and 12 were predicting attrition events in time periods during which more than 13 per cent attrition occurred, which was higher than for the campaigns run earlier in the semester.
The number of students in scope, and the average attrition rates shown for the week 8 and 12 campaigns were identical due to enrolment data forming the basis of selection and attrition measurement. While students were able to withdraw after Census to avoid academic penalties, they still technically remained enrolled since they had incurred a financial liability, and were thus in scope of each campaign. Similarly, attrition rates were the same in both campaigns since the scope was identical. Although the scope remained the same in the week 8 and 12 campaigns, a new predictive model in the week 12 campaign allowed each student’s attrition probability to be revised. The revision enabled intervention to be targeted towards students who displayed new characteristics associated with attrition.
Predictive model development used a dichotomous outcome variable, indicating whether students withdrew from studies between the time of each campaign and the following Census. As potential predictors, variables from all data sources (e.g. student enrolment, application, online learning, see also Table 1) were considered initially for inclusion. Those variables which were associated with attrition at the 5 per cent significance level were included in the model. Seventy per cent of historical data were used as training data to develop the predictive models with the remaining 30 per cent used as testing data to validate model accuracy and precision. Cumulative gains charts were the main diagnostic tool to assess CHAID model performance.
Figure 4 provides an example of a gains chart which for the purpose of the SSP compares the effectiveness of random intervention with a targeted intervention that is guided by the CHAID model. The diagonal line in red plots the expected percentage of attriters successfully contacted if selected at random. For instance, targeting 50 per cent of students at random corresponds to successfully targeting approximately 50 per cent of attriters. The curved line indicates the predicted increase in the percentage of attriters successfully contacted by targeting those with the highest predicted attrition probabilities. A steeper curve results in a higher gain and thus a greater benefit.
Cumulative gains chart example.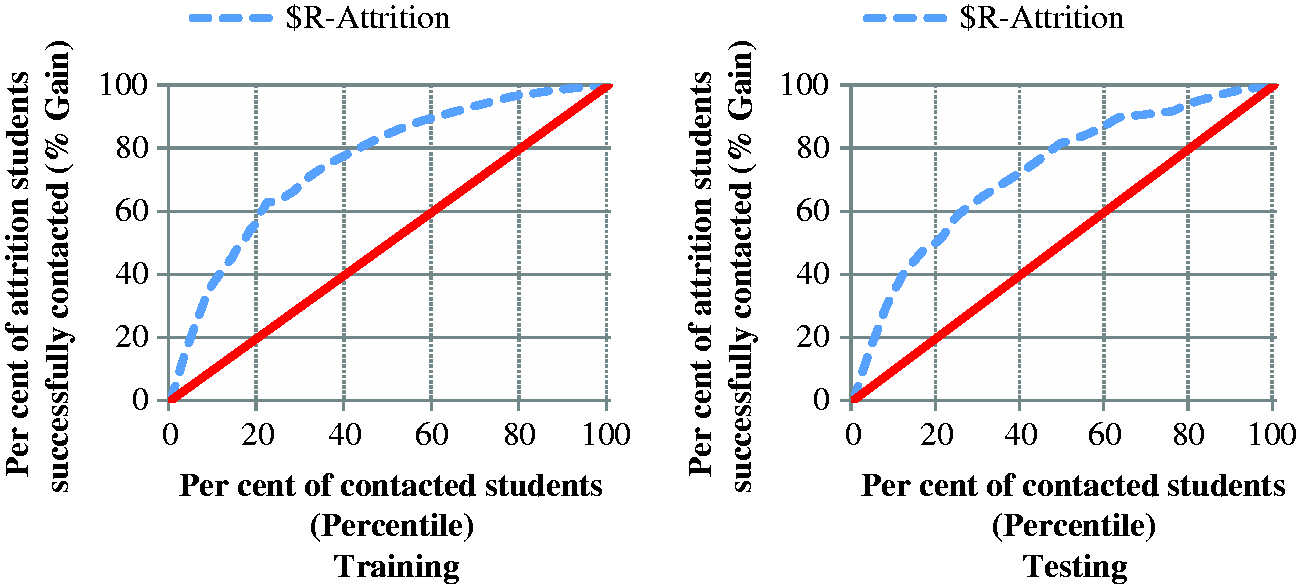
Two figures are produced side-by-side in gains charts. One displays the gains based on training data (as in ‘training’ the model; see the left hand side of Figure 4) while the other is based on testing data (as in ‘testing the model’; see the right hand side of Figure 4). The shape of the curved line must be similar in both figures to be confident that the model is parsimonious and thus applicable to the entire population it was designed for. In the next step, the CHAID decision tree models which had been developed in this fashion were applied to current commencing students to predict their probability of early departure from University at the time of each campaign.
Research was conducted to verify whether CHAID predictive models were indeed the most suitable machine learning solution. Alternative classification predictive models, including C&R Tree, Quest, C5.0, Discriminant, Bayesian Network, Logistic Regression and Neural Networks were compared against CHAID by utilising an automatic classifier function in SPSS Modeller. This function used the gains chart as the main diagnostic to rank models. Models with overall accuracy less than 90 per cent were discarded, leaving only the CHAID, Quest and C&R Tree as options for comparison. Figure 5 shows that CHAID had the largest lift and thus produced the most accurate predictions of attrition. These results support the continued use of CHAID predictive models.
Gains chart comparing predictive models.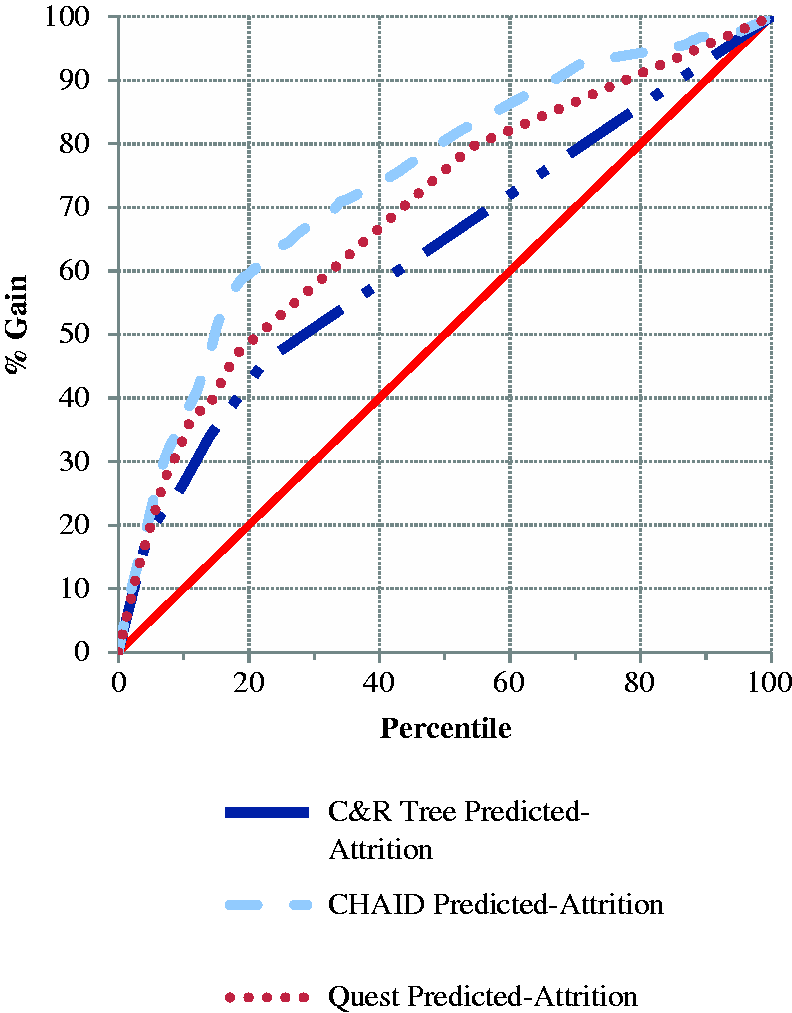
A separate predictive model was developed for each campaign to allow for changes in student enrolment characteristics and availability of new data sources and variables. Each model captured the effect of different drivers of success and captured students who switched from being an active and engaged learner to being at risk of leaving. Consequently, all students were assigned revised probability values at each campaign to be used in revised targeted communication strategies.
Attrition probabilities were used to guide targeted peer-to-peer contact. Student lists, sorted in descending order by predicted attrition probabilities were input into a spreadsheet using Smartsheet software, a customer relations management tool, allowing peers to identify which students to contact and to store information regarding contact made with students. Student enrolment and demographic details were made available to peers as contextual information, irrespective of their association with the student’s attrition probability. Characteristics which were directly related to attrition according to the predictive model were not provided to the peers, as this information was considered not helpful to the conversation. Peers attempted to contact those students with the largest predicted attrition probabilities by phone.
No attrition probability cut-off was used to determine where and when to stop the intervention in terms of contacting students at risk of leaving university early. Rather, the program continued to target students further down the sorted list of all first year students until resources ran out, resulting in around 15 per cent of students in scope being contacted during each campaign. Due to having a separate predictive model for each campaign, the same predicted probability of attrition derived in a different campaign was based on different student characteristics. This needs to be considered when assessing whether to alter the range of probabilities to target for intervention. While, for the purposes of the SSP, no alteration was made to the targeting strategy, this may be revised in the future. Paper-based scripts to guide the conversations between peers and high attrition risk students were developed and adapted for each campaign to discuss issues relevant to the transition timeline. Electronic scripts, such as ones used during computer-assisted personal interviews, were intentionally not used in order to allow conversations to flow naturally. Early campaigns focused on identifying whether or not students were settling into studies and navigating around the campus and computer systems. Later campaigns focused on assessments, exam preparedness and other academic-related issues. A commonality across all campaigns was that peers would start the conversation assuming the student had no issues, in case the student had no issues and to prevent unnecessary angst. The majority of elements of each contact were recorded in Smartsheet, including whether or not each student was contacted successfully, how each student responded to the scripted questions, and whether and to where or whom they were referred. Contact information and data stored within Smartsheet were later used to assess whether or not to follow-up with students who continued to have high predicted attrition probabilities (e.g. those who had predicted attrition probabilities higher than the overall population attrition rate) and to assess the effectiveness of the SSP.
Results and discussion
An assessment of cumulative gains charts showed the predictive models enabled the program to successfully target students with a high rate of attrition compared with contacting students at random. Figure 6 shows the cumulative gains chart corresponding to the CHAID model build for Semester 1 in week 2. Its shape was typical of that seen for CHAID models built for all other campaigns. The figure shows that by targeting 20 per cent of students with the highest attrition probabilities, the model predicts the targeted intervention was expected to reach 60 per cent of attriters. This presents a vast improvement compared with a random intervention strategy that would reach approximately 20 per cent of attriters.
Cumulative gains chart for the semester 1 week 2 model (S1W2).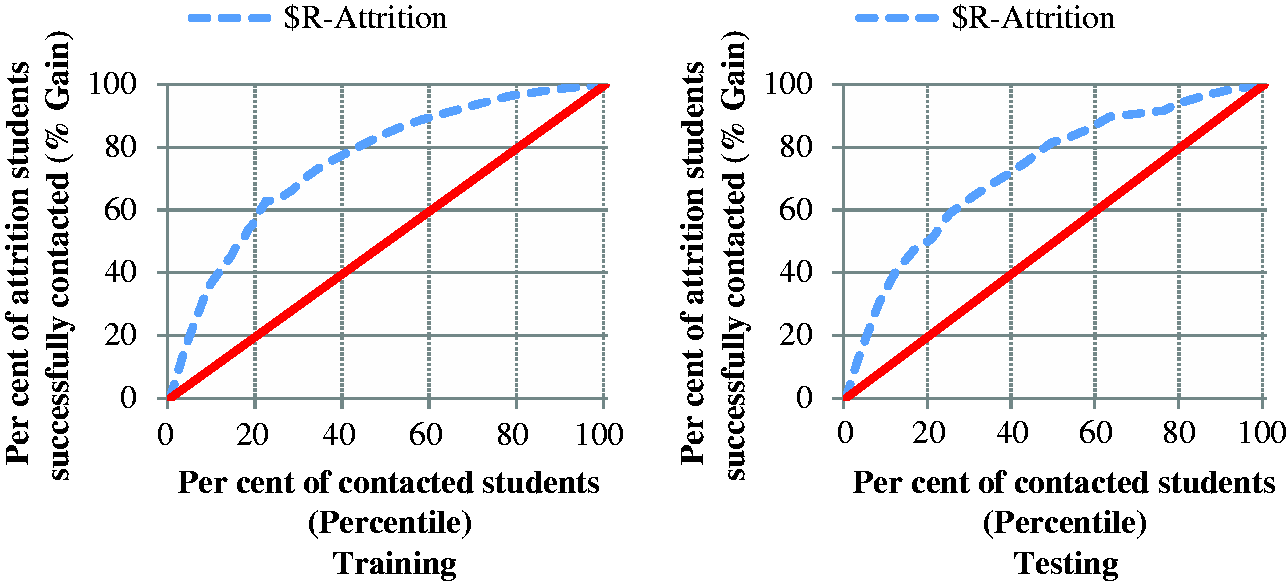
These results were comparable to those reported by Lu (2002) who developed a successful customer churn model for the telecommunications industry. The model used in that study incorporated the essential elements discussed here, including behavioural data to predict the timing of an attrition event. The ‘Lift’ of 3 [60% / 20%] achieved here meant the CHAID model allowed the program to accurately target students at high risk of attrition.
As discussed earlier, the eight predictive models varied in the historical data they made use, the number of data sources, and in terms of changes within the same source of data (e.g. a new course offering made to a student that was evident within applications data, a student may have switched topics or courses or reduced their study load which was evident within enrolment data). This was to accommodate the availability of data, and to capture changes in student behaviours and apparent risk of attrition.
Statistically significant predictors of attrition in each campaign model.
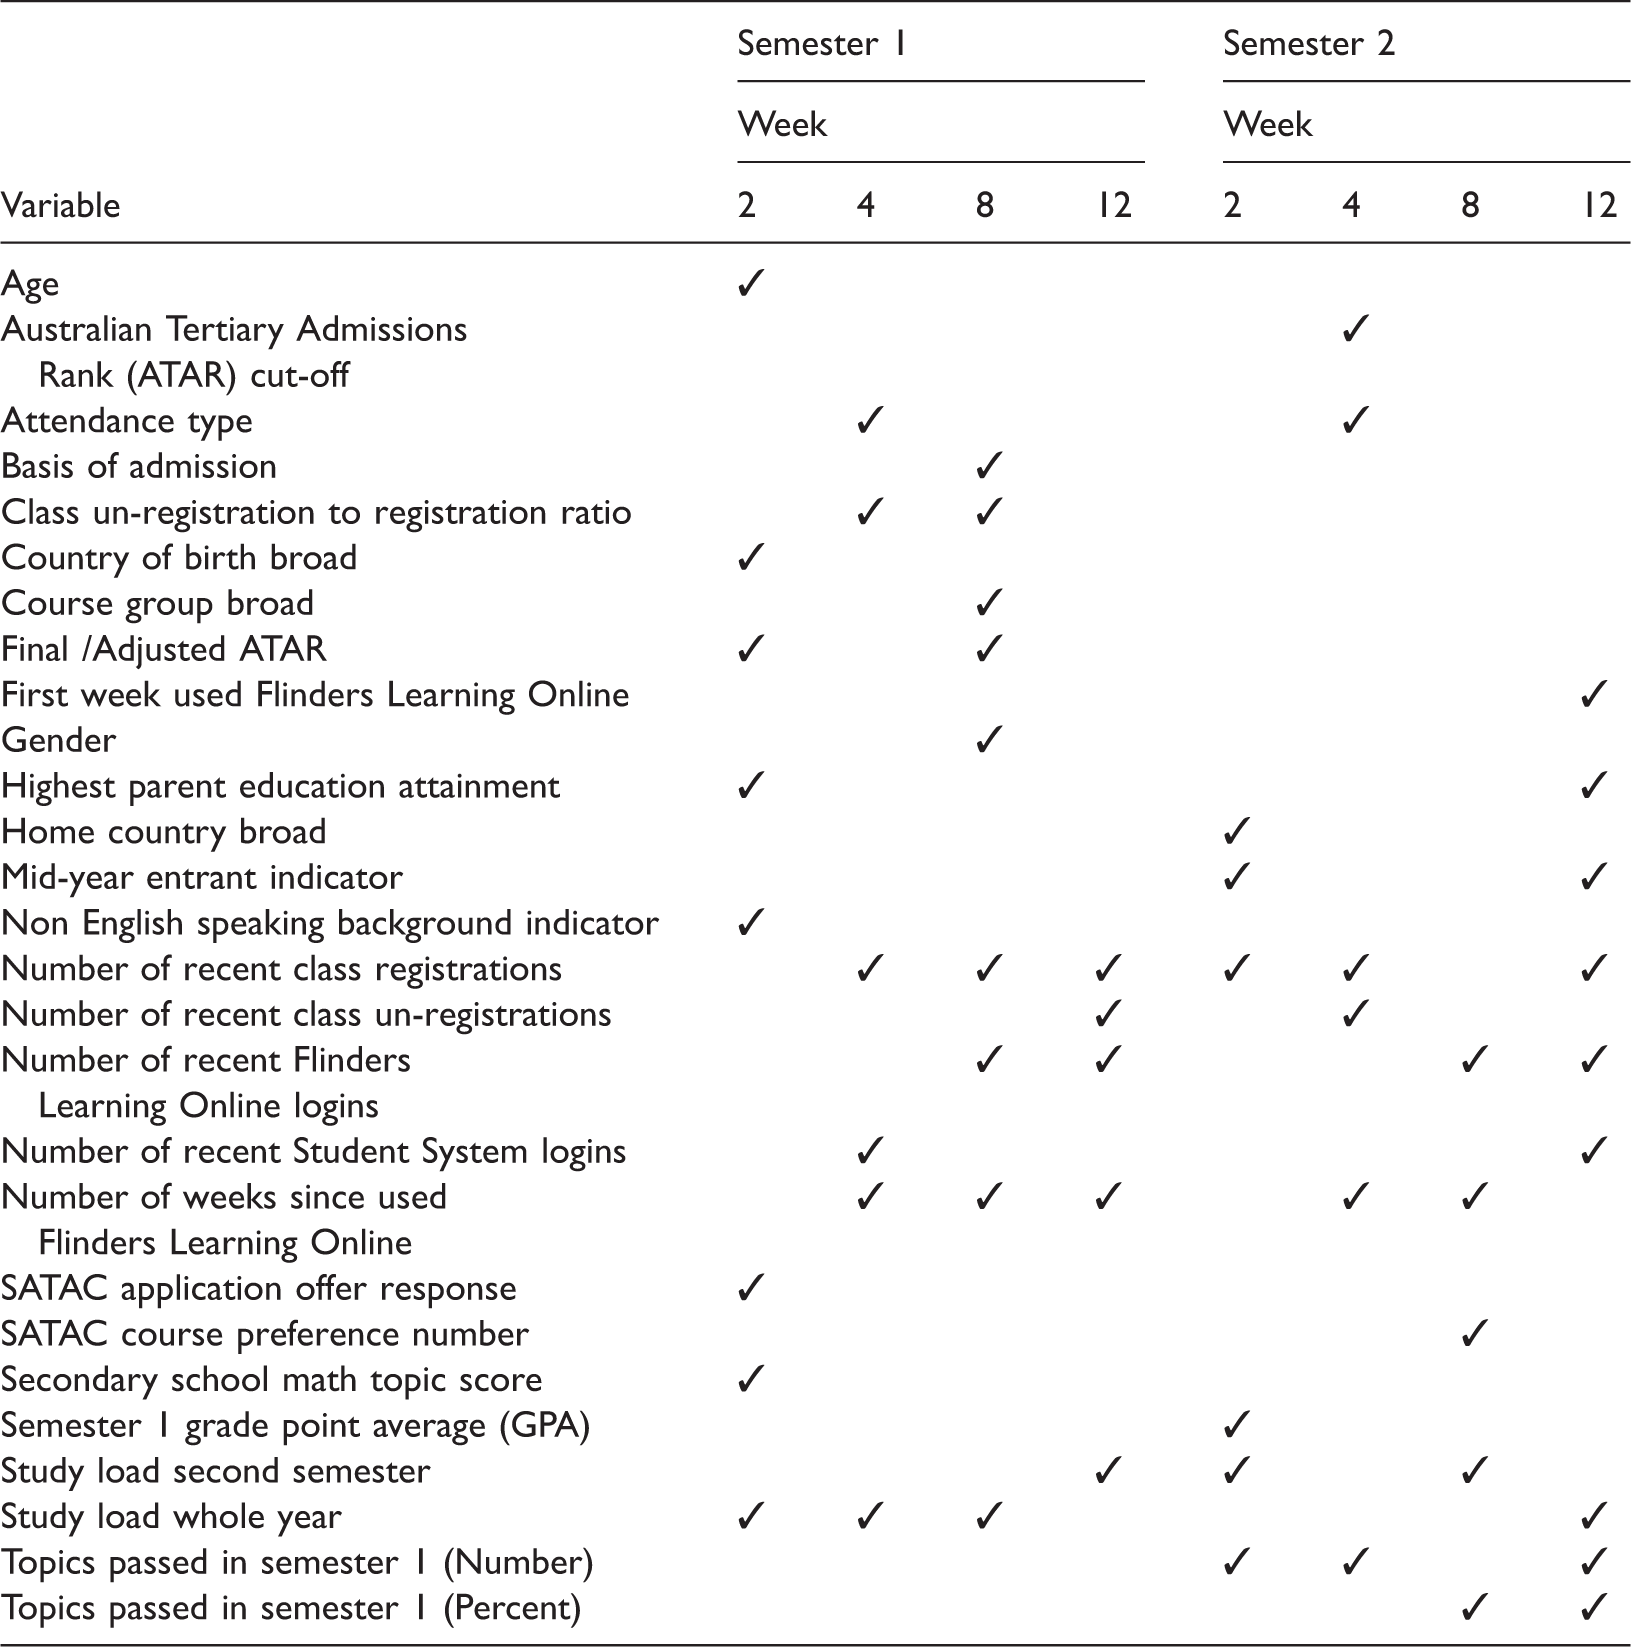
More than 50 variables were considered for use when building each predictive model, with the number of variables increasing as the year progressed due to more data becoming available. Most variables shown in Table 2 were considered for use in each of the eight models. Three variables in Table 2 were included only in semester 2 models, namely the Grade Point Average as well as the number and percentage of topics passed, all corresponding to academic achievement occurring in semester 1 and thus not available for use in models built in semester 1.
Although considered for use in all eight models, due to the availability of new data, some of the time sensitive variables in the table changed. An example includes the variable corresponding to the number of recent class registrations, a variable that was commonly statistically significant and thus included in the models. For models developed earlier in the year, this could only be measured using class registrations occurring early in the year. For the purpose of succinctly summarising the findings, the field showing the number of recent class registrations is treated as the same variable across the year.
Table 2 shows that the number and predictors differ for the predictive models. The table indicates that many of the predictors of attrition are included in more than one model. However, it is difficult to succinctly report on the strength and magnitude of the association between each variable and attrition since they can differ across models. Associations also commonly differ in each branch of a decision tree, analogous to parameter estimates corresponding to interactions between variables in traditional statistical models. Consequently, the findings discussed below relate only to the direction of associations between variables and attrition.
Similar to Harvey’s findings (2014), the infrequent inclusion in Table 2 shows that demographic variables, such as age and gender tended to be weak predictors of attrition. The strongest predictors tended to be behavioural data related to learning and academic performance. The predominant feature with learning data is that students who have minimal engagement with or stop using Flinders Learning Online – in other words reduce their interaction with the university online LMS – have elevated levels of attrition. Similarly, poor recent academic achievement is strongly associated with elevated levels of attrition. A possible explanation for behavioural data being a stronger indicator of attrition compared with demographic variables is that although the reasons for attrition may differ, students behave similarly by beginning to disengage from their learning and achieving poor academic performance before they leave their studies.
As can be seen in Table 2, whereas the SATAC application offer response variable was a predictor in the first model of semester one, it did not emerge as a significant predictor in the first model of semester two or in models after Census. The association related to this variable comprised students who had declined or indicated they wanted to defer their offer from SATAC, and subsequently had elevated levels of attrition before Census in the first semester. Discovering that students who declined or deferred an offer were still enrolled was counter-intuitive. Further investigations identified a lack of students’ understanding of the enrolment withdrawal process, resulting in many students following the wrong procedure and thus not notifying the University of their intended withdrawal from studies. Predictive model development for the SSP has enabled the university to identify such students, and due to their high predicted attrition risk, we are able to identify and target communication with these students and ensure their enrolment status is corrected.
Also, Flinders Learning Online usage appeared as a strong predictor in models deployed after Census, at times appeared in the week 4 models deployed just before Census, but did not appear at all as a predictor in the week 2 models at the start of each semester. The exclusion of Flinders Learning Online activity in models built early in the semester is due to the infrequent use of FLO at the beginning of each semester.
Additional notable differences between semester 1 and 2 models include the addition of academic performance in semester 2 models, since this information was not available in the semester 1 models. Also, semester 2 enrolled study load was a strong attrition predictor in the week 12 model in semester 1, but was not statistically significant in the semester 2 week 12 model.
This result meant that a lack of semester two topic enrolments, and thus zero semester 2 study load, was associated with increased attrition in the semester 1 week 12 model. That is, a lack of enrolments in the following semester was indicative of students not intending to return to studies the following semester. This finding can be explained by the enrolment process. That is, students are permitted to enrol in semesters 1 and 2 simultaneously, as soon as they receive an offer to enrol at Flinders. Students are also permitted to delay enrolment into semester 2, allowing the display of the delayed enrolment behaviour to be considered in the semester 1 week 12 predictive model. However, since students cannot enrol for the following year until after semester 2 is complete, this indicative behaviour does not exist and thus cannot be considered at the time of developing the week 12 semester 2 model.
A comparison of predictors across models showed that the strength of an association between attrition related behaviours and attrition events increases when the time between the behaviour and attrition is shortened. For instance, a lack of semester two topic enrolments (zero semester two study load) grew in strength as a predictor of attrition during semester one. An increasing strength in association, such as this, provides accuracy gains to the predictive model and allows for improved targeted intervention with students. This finding emphasises that prediction of even shorter term attrition stands to benefit in improved model accuracy by including behavioural data.
2014 attrition rates within equity groups.
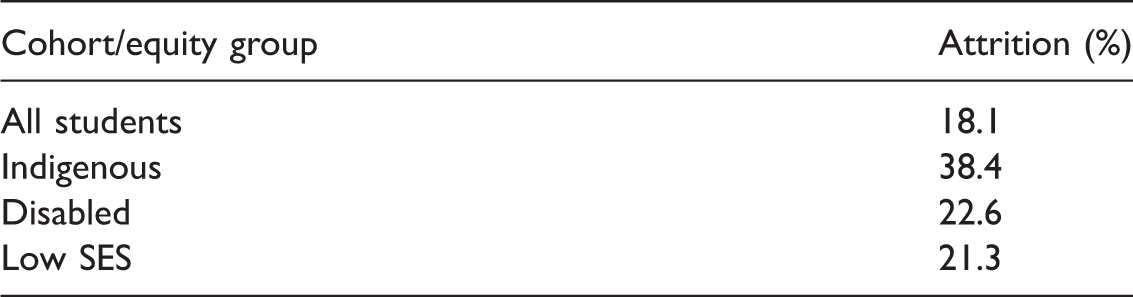
Similar to demographic variables, variables identifying student equity groups were not statistically significant and thus not included in any of the eight CHAID models. Table 3 shows elevated attrition within each equity group compared to the overall population, particularly for Indigenous students who have a noticeably and statistically significantly higher attrition rate (at the 5% level) when compared with all other commencing undergraduate students.
Despite having elevated attrition, the equity group variables were not statistically significant and thus not included in the predictive models, a finding that may be explained by the following reasons. Firstly, the proportion of the first year student population that is either Indigenous or disabled equates to a minority (1% Indigenous, 7% disabled in 2014) and thus, there is insufficient historical data to include these characteristics in the CHAID models. Secondly, the association between behavioural data and attrition is much stronger when compared with equity groups. Consequently, students who disengage are predicted to have much higher attrition rates compared with equity groups. Lastly, as discussed earlier, students with different personal characteristics that may cause them to withdraw from studies may in fact behave similarly to each other by beginning to disengage from their learning before they leave their studies. For these reasons, the predictive models tend to more precisely identify students within each cohort/equity group who have elevated attrition risks. Rather than targeting communication with all students in equity groups, the inclusion of behavioural data in the CHAID model helps identify which of the students in the known equity groups are disengaging, have elevated attrition probabilities, and thus are worthy recipients of targeted intervention.
Campaign results.
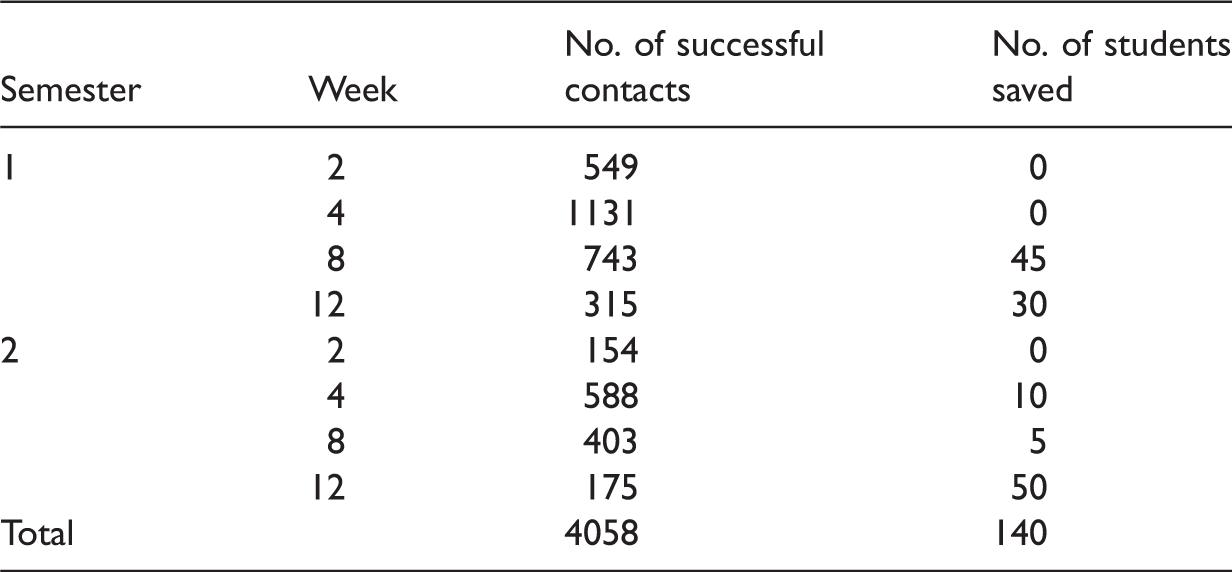
Collection of communication information, stored in Smartsheet, allowed the quantitative findings to be supported qualitatively. For instance, many students commented on how the contact prevented them from either leaving their studies or enabled their eventual return. The following quote is an example of comments made by students during SSP contact. ‘Thank you for the support you gave me earlier on in the year. Your referral helped resolve my issues. Now I’m having a really good university experience and am excelling in all of my topics’. Communication information also suggests students are more receptive to the phone call once they are aware that the contact officer is a later year student. Contact officers have noted that this allows conversations to be organic, that the contact officers can share their experiences, worries and frustrations, and that this is generally well received by students. Qualitative evidence suggests that providing peer-to-peer support to students with elevated attrition probabilities is highly appreciated by students and that it helped reduce attrition among students in their first year at Flinders in 2014.
Communication information stored in Smartsheet provided a greater than expected benefit in providing context from previous discussions. Contact officers were able to quickly identify whether the SSP had previously reached out to each student, whether and what the student’s previous issue was, whether a follow-up call was required and thus whether to target another student further down the list. The background information proved rather useful when targeting students for a second or subsequent time.
Communication data and feedback also assisted in identifying a variety of elements of the intervention strategy that worked well and that need improvement. Intervention at the start of a semester was most appreciated but had a smaller positive effect on improving attrition. Feedback suggested that students would have benefited from even earlier intervention, possibly before Orientation Week, a suggestion that Flinders has since implemented. Conversely, interventions just before exams were least appreciated but had a larger positive effect on improving attrition. Feedback suggested that the week 12 campaigns were too close to exams and that they be bought forward possibly to week 10, to provide students with more time to seek referred help. That suggestion has also since been implemented. Lastly, communication data and feedback suggested that International students and mature aged students appreciated SSP contact most, due to experiencing more difficulties with the transition to higher education and requiring more assistance. There was insufficient quantitative evidence to test whether intervention with these cohorts assisted in reducing attrition.
The introduction of the SSP coincided with an improvement in student satisfaction. Results from the independently run Student Experience Survey indicated that commencing student satisfaction with support received from the university to settle into study and support relevant to the students’ circumstances significantly increased after the SSP was first piloted, and has been maintained at increased levels since then.
Survey data will be considered for use when seeking improvements to future predictive models since CHAID models deal well with missing data. Flinders University runs multiple student surveys asking students about their perception, satisfaction and experiences during their study, which are likely to be related to attrition and therefore a useful predictor of attrition. If survey data are considered, the predictive models will be able to identify whether certain responses are associated with increased attrition. If certain responses emerge as strong indicators of attrition, students responding in this way will receive elevated predicted attrition risk values, and will stand to benefit by receiving additional support from the SSP.
Support from senior leadership of the University has enabled the SSP to continue, evolve and expand, driven by quantitative and qualitative findings. Feedback from contacted students and internal analysis encouraged more efficient use of resources and more effective targeting strategies by slightly changing the timing of scheduled campaigns. These changes included conducting a campaign before each semester, conducting only one campaign before Census, and one after Census. Other changes made to the SSP included an expansion of scope to other cohorts with comparatively high attrition, expansion of data sources utilised in predictive models, and prediction of academic success to complement attrition prediction.
Conclusion
The analysis suggested that the predictive models had the greatest level of improvement when student behavioural data was introduced as predictor variables, a concept that continues to be affirmed in higher education, and longstanding in the commercial sector. Previous research findings indicate, of all the sources of data considered, attrition in the first year was most strongly related and therefore more accurately predicted by utilising behavioural data related to learning and academic performance. This finding was corroborated in this study. The results also exhibited that demographic variables were comparatively weak predictors of attrition, which contradicts the prevailing perception.
The CHAID predictive models provided a suitable solution for predicting short-term student attrition. The models were relatively simple to implement, easily understood, and the outputs and diagnostics were useful and well received. CHAID models are most suitable for the variety and types of student data available. For these reasons, the SSP program will continue to use CHAID predictive models as the basis for its targeting strategy in future.
Analysis showed that the CHAID predictive models enabled the SSP to accurately target students with highest attrition risks. The communication strategy, involving targeted peer-to-peer contact helped to improve retention and student satisfaction.
It is acknowledged that universities differ in many ways, including attracting students from different backgrounds and for varying reasons, and students experience different lifecycles and study patterns. While, for these reasons the predictive models built in this study may not necessarily extrapolate to other universities, the proposed methodology presents an effective solution to addressing student retention in higher education. It is recommended that each university build institution specific predictive decision-tree based models that utilise all student data sources available, particularly the behavioural kind, to predict short-term attrition. Custom-built predictive models will enable institutions to accurately identify students with elevated attrition probabilities, enabling them to offer support to those most in need, and resulting in an effective use of resources to address and improve student retention and satisfaction.
Footnotes
Declaration of conflicting interests
The author(s) declared no potential conflicts of interest with respect to the research, authorship, and/or publication of this article.
Funding
The author(s) received no financial support for the research, authorship, and/or publication of this article.