
Abstract
A critical challenge within early childhood policy is to increase the capacity of early childhood education and care systems to intervene effectively and sufficiently early to improve the learning and development outcomes of marginalised children. An initial step is to reliably identify young children at risk of poorer learning outcomes. This article presents findings from the Australian E4Kids study, a longitudinal study of 2654 children recruited at age 3–4 years within a random sample of early childhood programs. Sixteen different child-, family- and community-level risk factors which had been identified previously as potentially having an adverse impact on child outcomes were analysed in relation to evidence of the children’s cognitive abilities and problem behaviour. Fifteen risk factors were linked directly to either lower cognitive abilities, problem behaviour or both and poorer outcomes were found in children experiencing more risk factors. Risk groupings may be used to identify vulnerable children early and to provide evidence to support the development of appropriate service responses.
Introduction
Australia and other OECD countries have a strong and long-standing public policy interest in being able to promote the development and learning of young children. This interest stems from recognition of the critical importance of the early years of life for many areas such as long-term wellbeing, concern about the poor development and learning outcomes for particular groups of children, the potential of early intervention to improve child outcomes and the cost effectiveness of intervention well before children commence school (Cuna & Heckman, 2010; OECD, 2006). An initial step is the ability to identify vulnerable children as early as possible in order to target scarce resources where they are needed most.
Defining vulnerability
A range of distal and proximal influences have been shown to affect child development and predict young children’s vulnerability to having poor personal, social and educational outcomes. Risk factors are conditions that are associated with poorer child outcomes, and various measures of family disadvantage have been identified, including being poor (Burchinal, Vandergrift, Pianta, & Mashburn, 2010), being socio-economically disadvantaged (Burger, 2010), experiencing a combination of low levels of economic, social and cultural capital (Willms, 2002) or through children being exposed to extreme stresses (Reynolds, Temple, White, Ou, & Robertson, 2011).
An overview of different measures of family socio-economic status (SES) is offered by Bradley and Corwyn (2002). They agree that a combined measure of family SES is a better predictor of the level of child outcomes than individual aspects of SES. Income, education and occupation, however, do not necessarily predict children’s competencies directly, but rather are associated with other important contextual variables such as housing space and diet and influences such as the social and cultural environment provided within the family and the surrounding community.
Consequently, child vulnerability to poor personal, social and academic achievement outcomes involves taking into account a wide variety of risk factors that traverse economic, educational, social and cultural dimensions. For instance, an educational activity that involves stimulating the child’s immediate environment, such as the frequency a child is read to, has been found to correlate with SES and also with the linguistic performance of children in both international and Australian studies (Hood, Conlon, & Andrews, 2008; Niklas & Schneider 2013; Niklas, Tayler, & Schneider, 2015; Sénéchal & LeFevre, 2014). Socially and culturally, both being an English learner or non-English speaker and living within low SES households leads to being less school ready when making a transition into English-oriented school systems such as in the US (cf. Brooks-Gunn, Rouse, & McLanahan, 2007). In addition, in a Spanish sample Lara, Garcia, and Dekovic (2013) found that stressful life events were associated with internalizing problems that influence social and educational outcomes.
Multiple risk factor approach
The degree of child vulnerability is clearly important. It predicts relative levels of child outcomes. In demonstrating the merit of using a risk-index approach, Sameroff, Bartko, Baldwin, Baldwin, and Seifer (1998) reported results from two large studies on multiple risks in children, the Rochester Longitudinal Study and the Philadelphia Study. Children with greater earlier vulnerability (i.e., greater number of experienced risks) in both studies not only performed worse later on in relation to cognitive measures, such as intelligence, but they also showed poorer psychological adjustment and more problem behaviours. The number of risk factors has been found to predict poorer child outcomes across cognitive, social and emotional development (Burchinal, Nelson, Carlson, & Brooks-Gunn, 2008; Oliver, Kretschmer, & Maughan, 2013).
The presence of multiple risks has usually shown to be a stronger predictor of child outcomes than any single risk-factor, particularly when multiple risks, such as low income or parental mental health problems persist over time (Burchinal, Robert, Hooper, & Zeisel, 2000). In an Australian study, data from two cohorts (babies and four- to five-year-old children), each consisting of about 5000 families, were used to identify two risk domains (Gubhaju et al., 2013). In the domain material disadvantage, typical SES measures such as economic aspects, occupational status and the financial situation of the family were taken into account as well as life events and parental substance abuse. The domain psychosocial disadvantage consisted of measures of time pressure, parenting style, relations within the family, parent wellbeing and social support. Each of these risk domains was associated with both child cognitive and behavioural outcomes, with material disadvantage showing higher correlations with vocabulary and early literacy and psychosocial disadvantage with problematic behaviour measured by the Strengths and Difficulties Questionnaire (Goodman, 1997).
Altogether, research shows that vulnerability in children exists from a very early age, is often sustained and is associated with poorer child educational and behavioural outcomes. Relevant risk factors identified in studies are derived from SES characteristics, family structure and process characteristics, child characteristics as well as social support and community characteristics (e.g., Brownell et al., 2016; Burchinal et al., 2008; Gubhaju et al., 2013; Sameroff et al., 1998). Classical SES measures such as education, occupation and income are often complemented by additional factors such as the number of children and bedrooms at home, parental mental health issues, family language, the occurrence of stressful life experiences and community SES. Consequently, the multiple risk factor approach postulates multiple layers of influence, including factors intrinsic to the child, to families – including social and employment experiences – to the quality of the local residential neighbourhood, and to the society and the historical periods in which children live (Bronfenbrenner, 1979; Burchinal et al., 2008; OECD, 2006). This broader understanding of influences on children’s development aligns very well with Bronfenbrenner’s (1979) ecological theory.
Children experiencing few or even no risks may be classified in a low-risk group to which almost three-fourth of the samples belong (e.g., Brinkman et al., 2013; Sameroff et al., 1998). The remaining quarter can then be further divided into low to moderate, moderate to high or high risk, depending on the number of risks that apply to the children. According to studies using data from the Australian Early Development Census (AEDC), children are categorized as developmentally vulnerable if their scores on the AEDC domains fall below the 10th percentile (cf. Goldfeld et al., 2016).
Research focus
Many risk factors have been identified and verified by researchers using large samples, for example in the US and Canada (e.g., Brownell et al., 2016; Sameroff et al., 1998) and first analyses in regard to risk factors have been conducted with 5-year-old Australian children (e.g., Brinkman et al., 2013; Harrison & McLeod, 2010; Wong, Whiteford, Rivalland, & Harrison, 2014). However, information about risk factors and their association with different child outcomes for Australian children before school entry is still not well developed, though some work has been undertaken at the Australian Institute of Family Studies (e.g., Gubhaju et al., 2013) and using data from the Longitudinal Study of Australian Children (e.g., Harrison & McLeod, 2010).
We thus decided to use data from a large Australian early childhood sample to contribute to the body of knowledge in this area by examining whether it is possible to assign children at 3–4 years of age to different levels of risk and to ascertain how the levels relate to the children’s cognitive outcomes or the presence of behavioural difficulties, which, in turn, may influence children’s educational trajectories.
Risk factors were selected from the domains identified by prior research to influence child outcomes. In addition, two risk factors were selected because of their specific relevance to the Australian context. The first was possession of a Health Care Card issued to families on the basis of a low income and which also serves as an eligibility condition to access a range of health, transport and services concessions, which was recently shown to predict children’s literacy and mathematical outcomes (Hildenbrand, Niklas, Cohrssen, & Tayler, 2015). The second was whether or not the family home was rented as an indicator of housing insecurity.
Method
Sample
The E4Kids longitudinal study focuses on the effects on children of participating in various forms of mainstream early childhood education and care (ECEC) programs (Tayler et al., 2016). For our analyses, the first round of data collected in 2010 is considered. At the beginning of data collection, data from almost 2500 children from the Australian states of Queensland and Victoria were obtained (N = 2494). Another N = 160 children joined the E4Kids sample one year later, having not participated in formal ECEC programs in the previous year. These children were added because they were of almost equivalent age to the 2010 sample, thereby both samples having similar ages in their ‘baseline’ year. Further, the 2011 (no-program) sample did not differ significantly from the 2010 (original E4Kids) sample in regard to sex, measures of family SES and the language spoken at home (p > .05). However, small, but significant differences were found for child age, community SES and the outcome measures and while children in the no-program sample lived in more disadvantaged areas, they showed better outcomes on most of the measures used in the study than the children in the original E4Kids sample.
Data from the no-program sample were included to improve the representativeness of the study sample, as many Australian children do not attend mainstream ECEC programs in comparison with other OECD countries (OECD, 2012; cf. Gilley, Tayler, Niklas, & Cloney, 2015), resulting in a total sample size of N = 2654.
Descriptive statistics (means and standard deviations) for the original E4Kids sample and no-program sample.
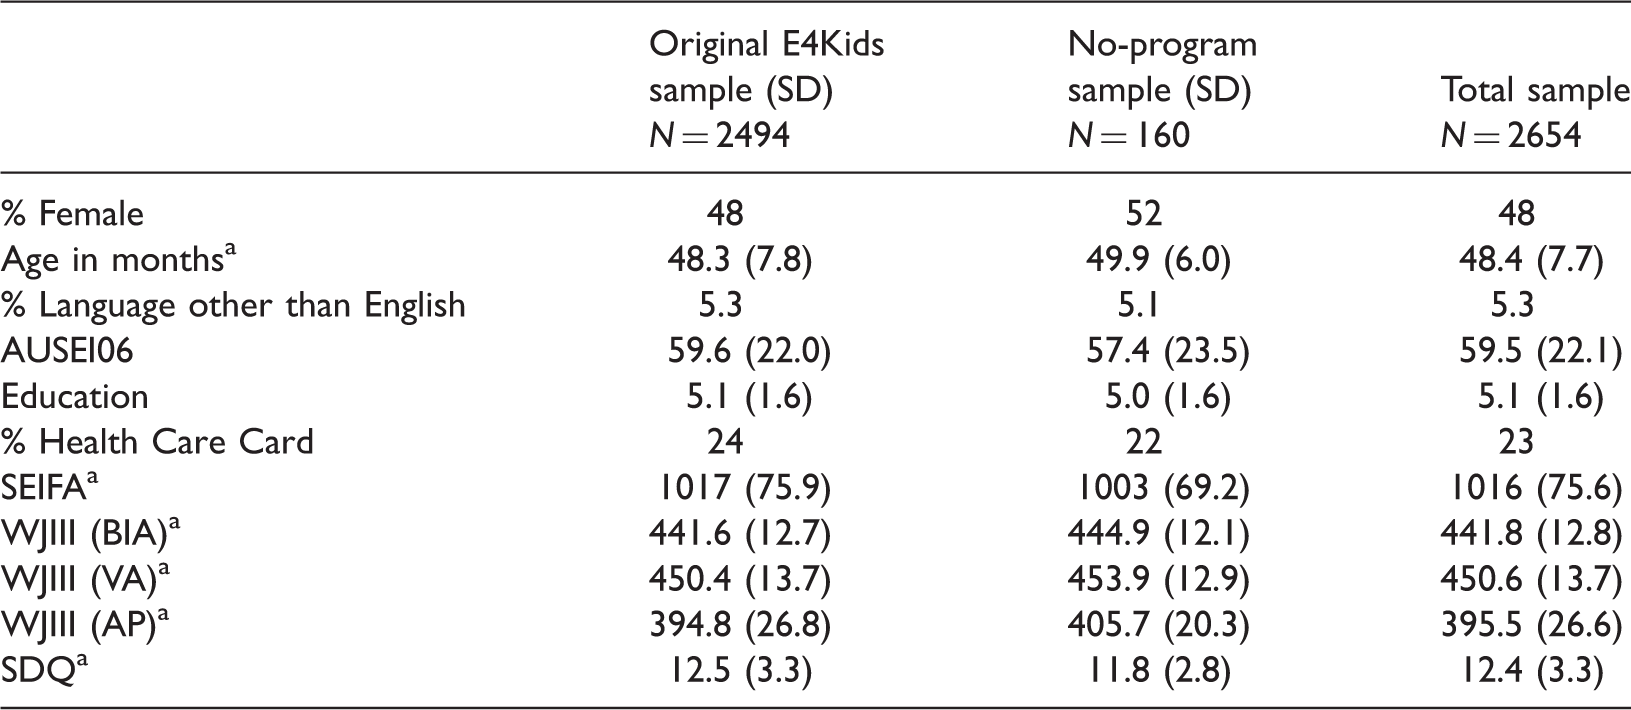
AUSEI06: prestige of parental occupation assessed with the Australian Socioeconomic Index 2006; Education: Highest parental education in the household; SEIFA: Socio-Economic Indices For Areas (Australian measure of community SES); WJIII: Woodcock–Johnson-III (BIA: Brief Intelligence Assessment; VA: Verbal Abilities; AP: Applied Problems); SDQ: problem behaviour (Strength and Difficulties Questionnaire).
Significant differences between original E4Kids and no-program sample (p < .05).
The main focus of the analyses presented in this article is on risk factors and their association with child cognitive and behavioural outcomes. Since not all surveys were fully completed and not all children could be assessed with the cognitive tasks, we imputed data for some of the children to be able to use a larger proportion of the overall sample in the analyses. To ensure that this approach was justified, multiple imputations were used (e.g., Graham, 2009) and a minimum set of the following data was required for the inclusion of cases: Only children for whom we had information about child gender, main language, education of the parents and community SES were included in subsequent analyses. All variables included later in the analyses as well as additional information on children and families were used as sources of information for the multiple imputations. We used this approach as simulation studies showed that multiple imputations give reasonable estimates as long as strong covariates are included in the model (Sinharay, Stern, & Russell, 2001).
This approach resulted in the records of 2016 children being included in all analyses, rather than only the 1188 children for whom complete data were available. Between 32 values (information on marital status of parents/caregivers) and 394 values (information on child temperament) were imputed five times for each child. A comparison of the selected (N = 2016) and disregarded sample (N = 638) showed that the analysed and disregarded samples did not differ in regard to age, sex, temperament, behavioural problems of the children or the prestige of the parental occupation (p > .05). However, the 638 children excluded from the analysis on the basis of insufficient data were more likely to come from disadvantaged communities and showed weaker performances on the cognitive outcome measures (all p’s < .001).
Test instruments and parental survey
The major tests used in this study were researcher-administered direct assessments of children’s cognition and achievement. Also undertaken was an extensive parental survey on child family circumstances and child-level strengths and difficulties from which risk-factors were sourced. A detailed report of the survey and the child testing is provided by Tayler et al. (2016).
Risk factors for vulnerability
Overview of the individual risk factors.
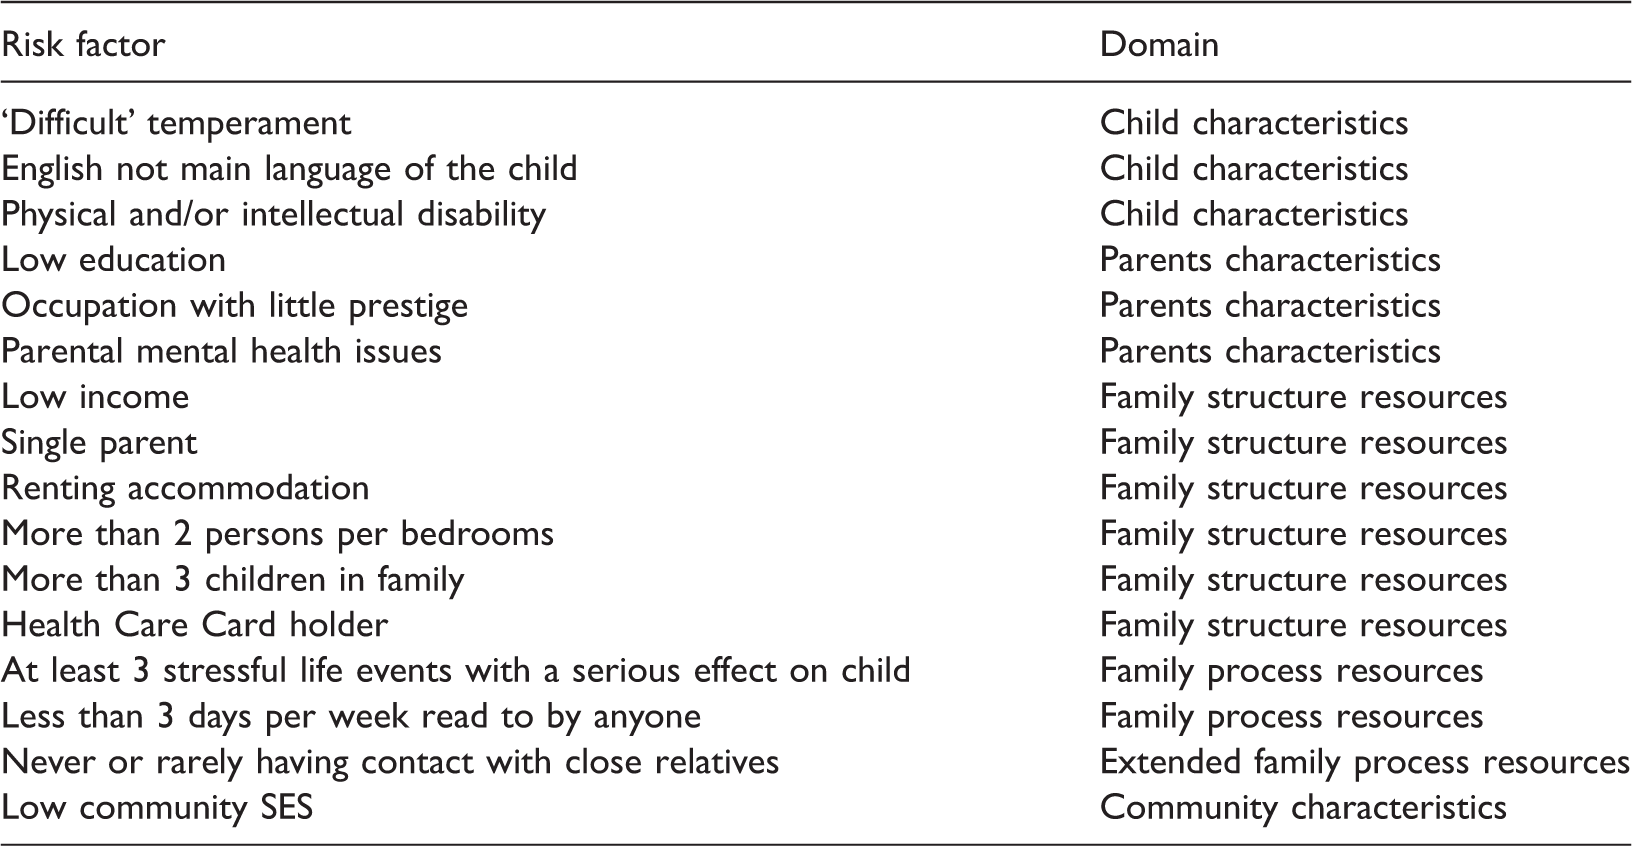
SES: Socio-Economic Status.
Regarding the family influences, a further distinction was made between family structure resources, such as family income and family size, and family process resources, such as stressful life events and frequency of parent reading to child (Zubrick et al., 2008). Overall, our list of risk factors also reflected data available within the E4Kids data base and, comparatively, the number of factors is greater than the number of factors used in some former studies but lower than within other studies (e.g., Brinkman et al., 2013; Sameroff et al., 1998). All of the risk factors included have been identified and used in other studies before, with the exception of risks specific for an Australian sample identified earlier, namely the Health Care Card and being in rental accommodation.
In regard to the child characteristics, parents identified 5.4% of children having a language other than English as their main language, 4.6% were reported to have a physical and/or intellectual disability and 6.8% could be classified as having a difficult temperament (low flexibility, sociability and persistence) as measured by a shortened form of the ‘Short Temperament Scale for Children’ (cf. Sanson, Smart, Prior, Oberklaid, & Pedlow, 1994). ‘Difficult temperament’ was included as a risk factor because previous Australian studies had found that it is associated with negative behavioural outcomes such as aggression or hyperactivity (see Harrison & McLeod, 2010; Smart & Sanson, 2005). The values ranged from 0 to 5 with lower values indicating a more problematic temperament. Children with values of 2 or lower were classified as having a difficult temperament.
Parental risk factors included finishing Year 10 or equivalent, representing the highest level of parental education in the family (8.3%), suffering from mental health problems (7.2%) or having a low prestige occupation (9.7%). The prestige of occupation was assessed with the Australian Socioeconomic Index 2006 (AUSEI06) that assigns values ranging from 0 to 100 to each occupation. A value of less than 31 in the AUSEI06 was classified as at risk because a bigger gap in values and numbers was observed in our sample between parents with values below 31 and above 32. In the domain of family structure and resources six different risk factors were identified, including families with an overall income of less than AU$ 50,000 a year (21.1%), single parent households (11.1%), more than 3 children at home (8.3%), more than 2 persons per bedroom (16.5%), families having a Health Care Card (24.2%) or being in rental accommodation (25.7%).
Another domain of possible risk factors is family process resources. Children who experienced at least three stressful life events such as divorce or death of a close family member were classified as being at risk (6.2%), and children who were read to less than three times a week (10.4%) were also classified as at risk of diminished child development outcomes. Another process risk factor identified was children who never or only rarely had contact to close relatives such as grandparents, aunts or uncles (9.2%).
Finally, the ‘Socio-Economic Indices For Areas’ (SEIFA) was used as a community risk characteristic. SEIFA is an Australian measure of community SES and has been used to assign families an SES rating based upon residential location (Ishimine, 2011). Observed values in our sample ranged from 800 up to 1214. Here, 8.5% of the sample was identified as living in an area with a comparable low community SES; that is, having a value in the SEIFA of 928 and lower. As was done with the AUSEI06, again a suitable gap in regard to numbers and values was identified and then used as a cut-off point. The specific questions and cut-offs for each of these variables are provided in Appendix 1. For each risk factor a child either was assigned a ‘0’ for ‘no risk’ or a ‘1’ for ‘living in the context of this specific risk’.
Child outcome measures
Cognitive outcomes were obtained through use of a selection of Woodcock–Johnson-III tests (WJIII; Mather & Woodcock, 2001a, 2001b; McGrew, Woodcock, & Mather, 2001). Here, the Brief Intelligence Assessment (BIA) was used as a brief measure of intelligence, Verbal Ability (VA) measured linguistic competences and Applied Problems (AP) measured the mathematical competences of the children.
The BIA score is derived from three cognitive tests that measure general cognitive ability. It is made up of comprehension knowledge, fluid reasoning and processing speed (median cluster reliability = .95).
VA consists of the four subtests: Picture Vocabulary, Synonyms, Antonyms and Verbal Analogies. These subtests measure different aspects of children’s acquired vocabulary skills. For four- to six-year-old children, estimated reliabilities on Verbal Comprehension range from .89 to .90.
The AP subtest evaluates the participant’s ability to solve mathematical problems. As this requires quantitative reasoning and mathematical understanding as well as the ability to disregard superfluous information, it is fairly difficult for young children. However, even for this age group this subtest is a reliable and valid measure of mathematical competencies (median test reliability = .93).
In order to consider behavioral problems reported about the children data from the Strength and Difficulties Questionnaire (SDQ; Goodman, 1997), a brief behavioral screening tool for 3–16 year olds was utilized, including 25 items divided in five subscales. In this study, the sum score of the subscales ‘Hyperactivity/Inattention’, ‘Emotional symptoms’, ‘Conduct Problems’ and ‘Peer Problems’ served as an indicator of overall problematic behavior, with higher scores indicating a higher level of problem behavior in children.
Overview of statistical analyses
Descriptive statistics and correlational analyses
After the application of the multiple imputations procedure for the treatment of missing data using SPSS, we calculated correlations for all risk factors, and the outcome measures, and present them together with descriptive statistics. The phi-coefficient represents the correlation between dichotomous variables (i.e., values of either 0 or 1 are possible), and this coefficient equates the Pearson correlation coefficient when the association between two dichotomous variables is measured as is the case with our risk factors (Sedlmeier & Renkewitz, 2008). The association of our dichotomous risk factors and the interval-scaled outcome measures was assessed with the point biserial correlation coefficient, which is also mathematically equivalent to the Pearson correlation coefficient (Howell, 2007).
Risk status and outcome measures
Overview of the groups with different risk status out of a possible maximum of 16 risks (N = 2016).
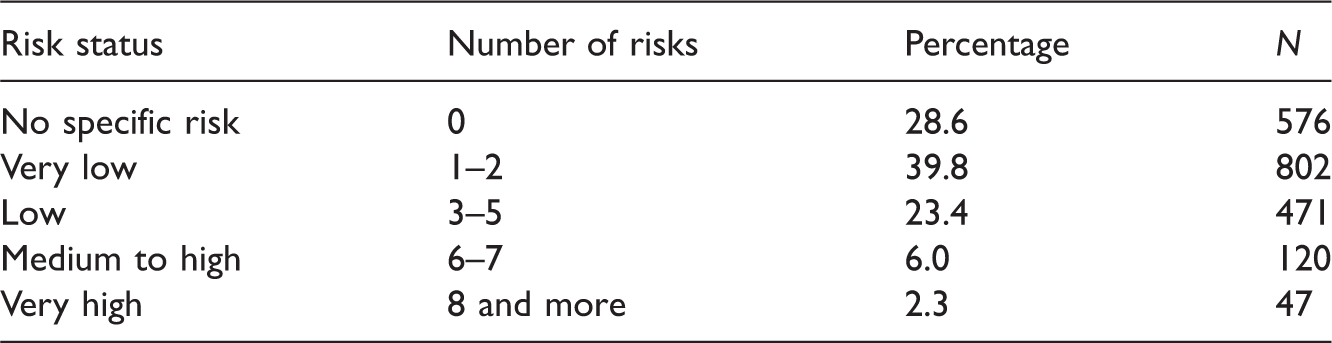
The basis for the formation of these five groups was derived from different sources. The mean risk of children in the sample was M = 2.01 (SD = 2.12; Min = 0; Max = 11), indicating that on average every child was living in the context of two risk factors. However, the mode was 0 and the median 1. Thus, the biggest subgroup of children (about 28.6%) experienced no risk factors and slightly more than half of the sample either lived in the context of no or one risk factor only. Taking this into account, we decided to build two larger groups experiencing no or very low risk (1 or 2 risk factors). These two groups consisted of about two-thirds of the children in the sample and were deemed developmentally on track.
The rest of the sample (about 32%) was then divided into a bigger subgroup with low risk (3 to 5 risk factors) and two smaller subgroups with medium to high or very high risk. In particular, the latter two groups can be regarded as being vulnerable: the percentage of children in these groups aligns well with the vulnerable range in the AEDC domains (cf. Goldfeld et al., 2016). Further support for this approach comes from other studies on risk factors which identified about 75% of their samples as developmentally on track and about 10% as being developmentally very vulnerable (see for example Brinkman et al., 2013; cf. Sameroff et al., 1998). However, it differs from other studies on risk factors with a different focus and fewer risk factors analysed (e.g., Wong et al., 2014).
The resulting categories were compared in regard to each of the cognitive and behavioural outcome measures using analyses of covariance (ANCOVAs; cf. Huitema, 2011) that took into account child age and sex as control variables. In addition, post hoc tests without covariates were conducted to test which groups differed in their outcomes. As SPSS does not provide combined results for ANCOVAs and post hoc tests with multiple imputed data sets, we present the median F-scores, means and partial η2s.
Results
Descriptive statistics and correlational analyses
Correlations between the different risk factors (R) and the four outcome measures as well as descriptive statistics.
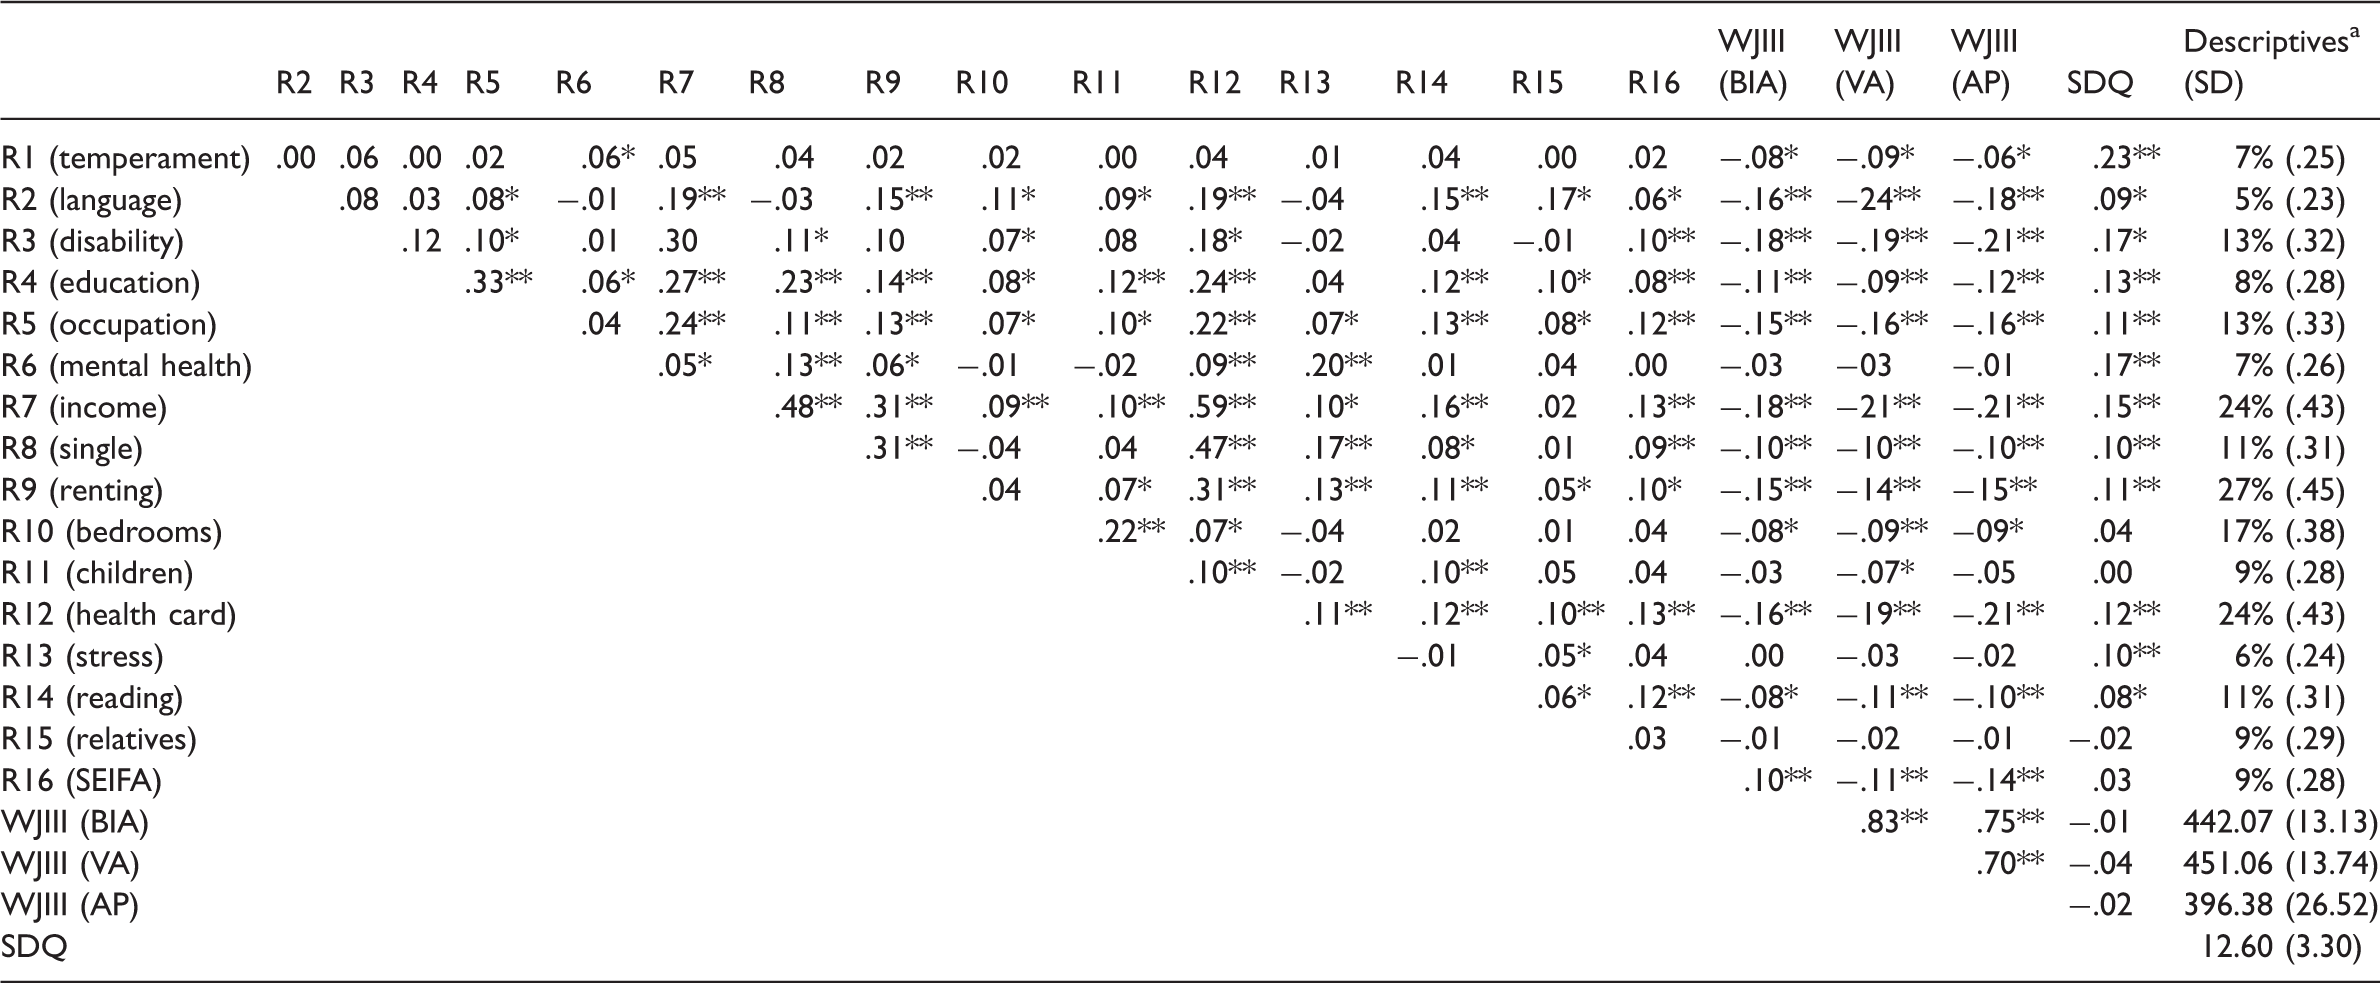
Descriptives for R1–R15 show proportion of the sample having a specific characteristic: E.g. 7% of children had a difficult temperament; 5% of children in the sample live in families speaking a language other than English; 13% of children’s parents have occupations that have a low prestige; 24% of children’s parents have a lower income or 11% of children are read to less than 3 times a year.
p < .05; **p < .001. SEIFA: Socio-Economic Indices for Areas; WJIII: Woodcock–Johnson-III (BIA: Brief Intelligence Assessment; VA: Verbal Abilities; AP: Applied Problems); SDQ: problem behaviour (Strength and Difficulties Questionnaire).
As can be seen in Table 4 the cognitive outcome measures (BIA, VA, and AP) were highly correlated (from 0.70 to 0.83) but were not significantly associated with the total score of problem behaviour (SDQ). The individual risk factors differed in their interrelations with medium to high correlations for classical aspects of family SES such as education, income, occupation and Health Care Card. Other specific risk factors were mostly unrelated to the collective of the risk factors (e.g., ‘difficult temperament’) or even showed negative associations with one another (e.g., ‘more than 2 persons per bedroom’ and ‘single parent’ or ‘more than 3 stressful life events’).
All risk factors were weakly, but significantly associated with at least one of the outcome measures (correlations between |.1| and |.3|, indicating small effect sizes (Cohen, 1992)) except ‘rarely or no contact to close relatives’. Reported parent mental health problems, a disability of the child, and a difficult temperament showed the highest correlations with child problem behaviour. A low income, holding a Health Care Card, a parent having an occupation with low prestige, a child suffering from a disability or speaking a language other than English as main language proved to be important risk factors that were associated with lower cognitive outcomes.
Risk status and outcome measures
Overview of the results of the ANCOVAs (df: 4,2009) comparing the groups with different risk status (no, very low, low, medium, and high risk) in regard to cognitive and behavioural child outcomes.
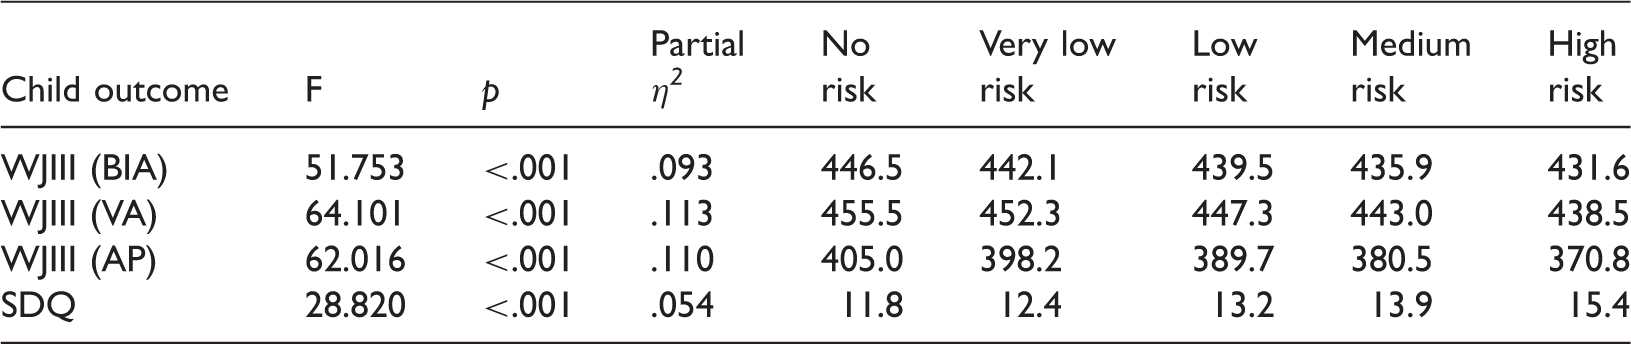
WJIII: Woodcock–Johnson-III (Brief Intelligence Assessment (BIA); Verbal Abilities (VA); Applied Problems (AP)); SDQ: problem behaviour (Strength and Difficulties Questionnaire).
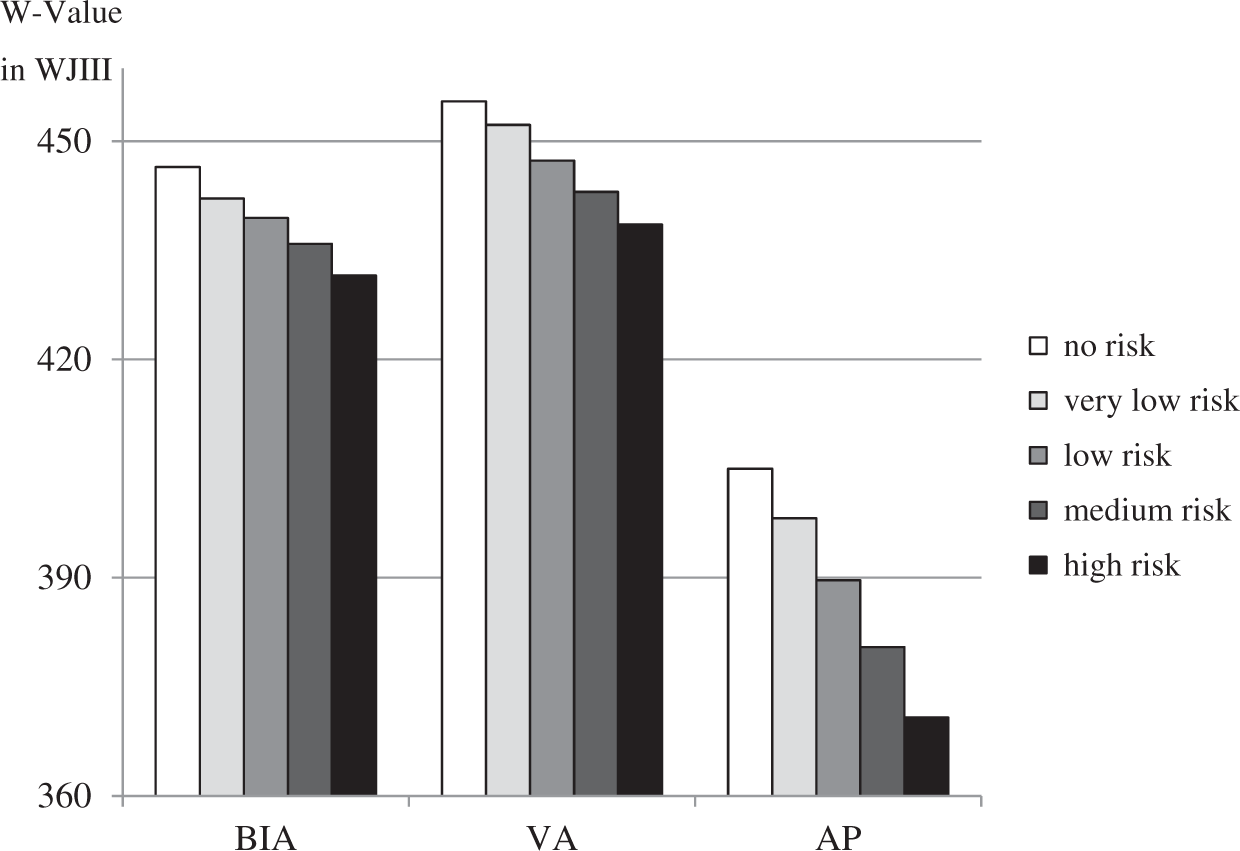
Differences in the cognitive test scores of selected Woodcock–Johnson-III measures according to risk status. BIA: Brief Intelligence Assessment; VA: Verbal Ability; AP: Applied Problems; WJIII: Woodcock–Johnson-III.
Post hoc tests (without controlling for age or sex) for the cognitive measures showed that almost all groups differed significantly from each other. Smaller, but significant differences (p < .05) were found for all comparisons between adjacent groups with the exception of the comparison between the groups with medium and high risk (p > .05). Larger differences in regard to the Woodcock–Johnson subtests (p < .001) were found for comparisons of the groups with no or very low risk only in comparison to all other groups. As expected, the high risk group showed the weakest performance in the tests assessing cognitive abilities and in groups with fewer risks better outcomes were observed (see Table 5).
An analysis of variance controlling for age and sex and predicting problematic behaviour in children showed again significant results for risk status (see Table 5). About 5.4% of the variance was explained by the grouping (partial η2), indicating a small to medium effect size. Figure 2 shows the differences in the means of problematic behaviour as measured by the SDQ.
Differences in the problematic behaviour (SDQ) in regard to different risk status. SDQ: Strength and Difficulties Questionnaire.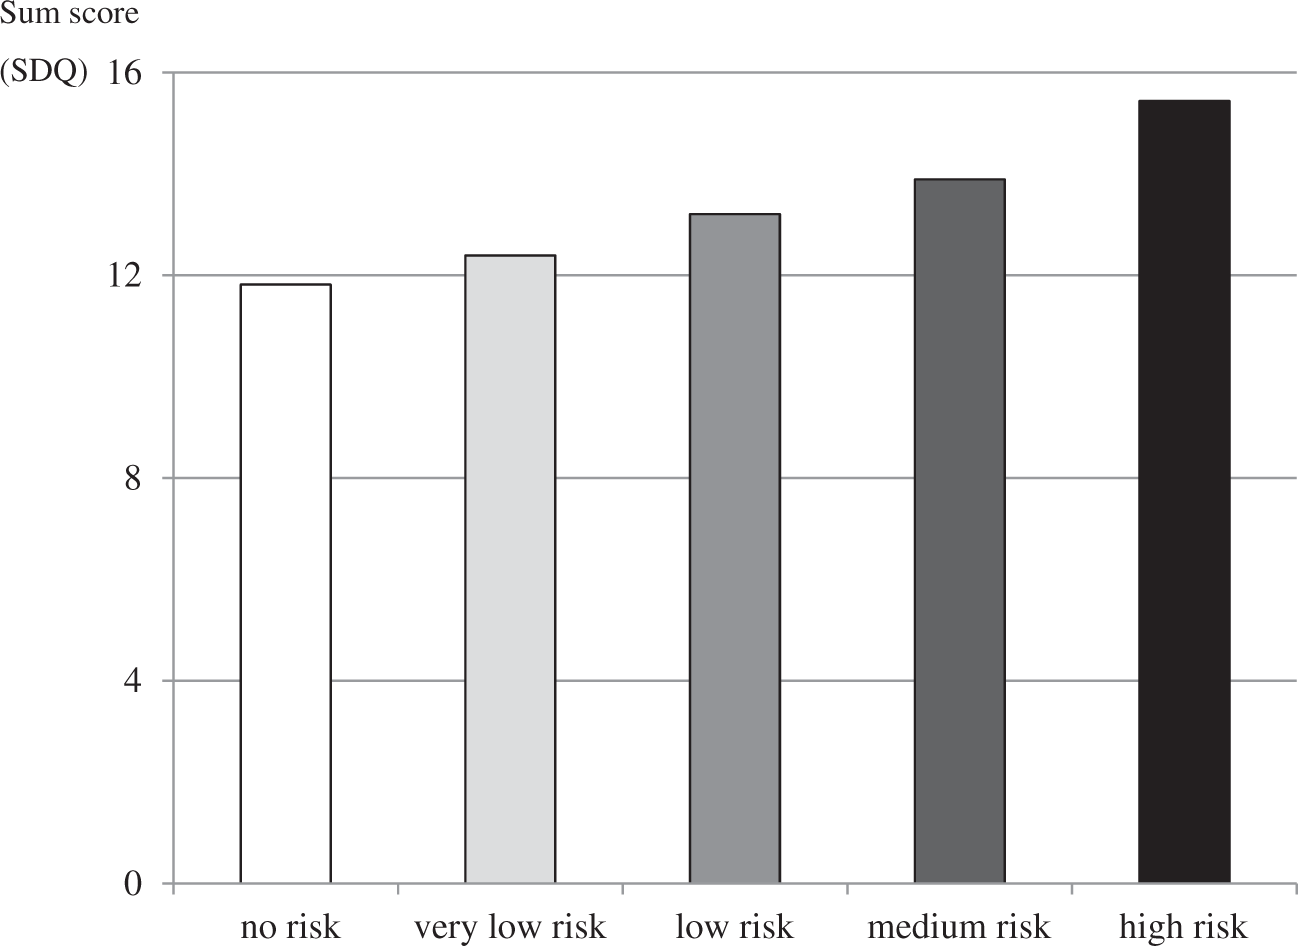
Again the group with no specific risk showed the best outcomes, indicated here with lower overall values in problematic behaviour (p < .001; p < .05 in comparison to the very low risk group). As expected, the following pattern was found: the more risks in a group, the greater the problem behaviour reported for the children in this group. No significant differences were found for the comparison of the low with the medium risk group and for the medium with the high risk group (p > .05), whereas all other comparisons showed significant differences in problem behaviour (p < .05).
Discussion
Children acquire linguistic and mathematical competences long before school enrolment, and wide variability in their cognitive performance can already be found in young children long before school entry (cf. Schneider, Niklas, & Schmiedeler, 2014; Tayler, Cloney, & Niklas, 2015). Consequently, it is important to identify children with a risk of developmental vulnerability as early as possible to ensure a preventative approach and to provide enhanced learning and development experiences before they enter formal schooling. In this study, we tested the influence of 16 risk factors, some of which had been shown in former studies to affect children’s outcomes while others were specific to the Australian context (Gubhaju et al., 2013; Hildenbrand et al., 2015; Sameroff et al., 1998).
The cognitive and behavioural outcomes of children encountering multiple risk factors were found to be most affected, relative to peers who were associated with fewer risk factors, reinforcing the picture provided by other research that multiple risks are usually a better indicator of children’s outcomes than simply focussing on one risk such as family SES (cf. Bradley & Corwyn, 2002). We were able to identify certain risks that were closely associated with lower cognitive and/or behavioural child outcomes.
Interestingly, a lack of extended family process resources was not associated with any of the child outcome measures used in this study. These findings are contrary to results of other studies (e.g., Gubhaju et al., 2013). One reason for this might be the composition of our family process measure that asked only for contact with grandparents, aunts and uncles, whereas in other studies the family process measure was much broader. Consequently, it might be that the children classified at risk in regard to extended family process resources had other social supports, such as frequent visits by other relatives, close friends or neighbours.
However, our overall risk factor model proved effective in distinguishing the majority of children in the cohort who were experiencing no risk or very low risk, from a group with low risk, and a further two groups with medium-to-high or very-high risk. In an exploratory approach, we subdivided the group with very low risk into two groups with either one or two risk factors: these two groups, however, were very similar in regard to child outcomes, did not differ significantly, and were thus grouped together in our final analyses. The subdivision between medium and high risk might also not be necessary as children in both groups did not differ significantly in their outcomes (see also Brinkman et al., 2013). Nevertheless, this subdivision may serve functionally if scarce resources have to be spent purposefully and the non-significant differences might be due to small group sizes only.
Limitations
In simply counting the number of risks, there are two limitations: counting risks does not identify the intensity of any individual risk, and it treats all risks as if they are the same, such as having a child with a disability, being on a low family income or having a low level of parental education. It remains possible, for example, for one of the risk factors, such as a severe intellectual disability, to lead to low results in the two outcome areas used in this study, namely cognitive skills and behaviour problems – though, for example, an analysis of the incidence of child disability in our sample shows that it is spread across the different risk categories used in this analysis which limits this concern. Over a large sample in this study, the analysis appears to hold despite these types of exceptions (cf. Gubhaju et al., 2013).
Further, the risk factors analysed accounted for some of the variance in child outcomes only. The inclusion of other aspects of vulnerability which were not included in our analyses such as child depression or anxiety may increase the explained variance (Lewis & Olsson, 2011). In addition, parents rated both children’s problem behaviour and some of the risk factors, which could have led to biased ratings. Still, we were able to identify various risk factors from several domains that proved in most cases to be important for very young children’s outcome measures.
Our analyses focussed on individual risk factors experienced by children and thus neglected the nested design of the E4Kids study (i.e., several children attending the same ECEC programs). Intraclass correlation coefficients that test how much of the total variance in an outcome measure is explained by room characteristics such as program quality and room composition showed that about 30% of the total variance of verbal abilities and mathematical abilities in the E4Kids sample in 2010 is explained by room characteristics (Niklas & Tayler, 2017). Consequently, future research could use a multi-level approach to test the association of risk factors with child outcomes.
Finally, there may be a ‘middle classing’ effect in the E4Kids study data. The selection of the vast majority of the children through their participation in ECEC programs is likely to understate the population of vulnerable children in the Australian population, on the basis that the most vulnerable children and families are less likely to participate in ECEC programs (Gilley et al., 2015; Goldfeld et al., 2016; Wong et al., 2014). This exclusion of more vulnerable children in the analyses on the basis of incomplete data remains as a limitation, and likely underestimates levels of risk and the association with child outcomes. Thus, our results are probably conservative: it is to be expected that the percentages of children at risk could be higher, and that their overall outcomes would be lower than those in our analyses. However, the application of the multiple imputations procedure for the treatment of missing data enhanced reliability and validity of the findings (cf. Graham, 2009; Sinharay et al., 2001).
Strengths
This investigation brings together an analysis of multiple risk factors affecting a large cohort of Australian children mostly recruited from ECEC settings in 2010, in order to assess impacts on child outcomes. It identifies a broad range of risks that are known to affect important aspects of child development.
Whereas analyses with regard to vulnerable children in Australia have been reported recently (e.g., Brinkman et al., 2013; Gubhaju et al., 2013; Wong et al., 2014), this is one of the first studies to present results for a cohort of very young Australian children attending ECEC programs. In addition, the small cohort introduced later in the analyses consisted of children who did not attend an ECEC program in 2010, a group that is substantial in Australia in comparison to many other countries (Gilley et al., 2015; OECD, 2012). Results related to the links between risk indicators and child outcomes remained the same when only data of the small subsample group were analysed. The effect of grouping according to risk status on children’s cognitive outcomes was even higher and more significant for this subgroup than for the larger sample, whereas the effect on the behavioural outcomes remained the same, but was not significant due to the much smaller sample size. Consequently, our results were stable and are reliable and valid for both cohorts of children.
In addition, while reviewing the individual risk factors and analysing their association with the cognitive and behavioural outcomes, we identified certain risks that were closely associated with problem behaviour (e.g., difficult temperament, parental mental health issues and intellectual/physical disability of a child). When these three individual factors were combined and used for grouping, a higher amount of variance in problem behaviour was explained than by the risk factor model including all 16 variables. The same was true for the cognitive outcomes for which more classical SES measures and a child’s home language were of importance. These results align with the results of Gubhaju et al. (2013) who also found similar differential effects of certain risk factors with cognitive vs behavioural outcomes. Future studies can make use of these results and build specific risk factor models according to the outcome measures that are of interest, and take a longitudinal approach to probe rates of change in risk and developmental outcomes over time (cf. Burchinal et al., 2000).
Conclusion and implications
Multiple risk analysis has support in the literature for being a predictor of later outcomes, particularly when multiple risks persist over time. Using multiple risk analysis proved to be better than focusing on single risk factors only. The analysis of children in the E4Kids study, across 16 risk factors, into multiple risk categories, and allocating them to a series of risk categories from no risk to very high risk, demonstrated similar proportions to former studies (Brinkman et al., 2013). These risk groupings were strongly correlated with problem behaviour and cognitive abilities and achievement in the year of recruitment into the study when the children were 3 to 4 years of age.
In public policy terms, the analysis provides a basis for broadly considering government investment strategies. Strategies that pay greater attention to the very young within families, and that define risk groupings based upon multiple risk factors would help to target vulnerable children early in order to provide timely intervention services where they are needed most. Several of the analysed risks are readily assessable by service providers such as Health Care Card status, number of children at home or family main language and such information can be taken into account, when targeting resources to vulnerable young children. Another approach would be to ensure that vulnerable children in Australia have access to high-quality ECEC programs (Goldfeld et al., 2016). This is all the more important as this group of children is most likely to miss out on such programs (Wong et al., 2014).
In addition, the results of a recent study conducted by Brownell et al. (2016) indicate that the greatest impact on early child development may come from interventions and policies that support communities and the families that live in them. Consequently, providing specific additional supports to low SES communities and in particular to the families within such communities who live in the context of additional risk factors such as parental mental health issues, child disabilities or low education or income can be both socially responsible and economically efficient. Finally, educators need to be aware of vulnerable children in their centres and should try to support these children in their development, which may act as a protective factor.
Footnotes
Acknowledgements
E4Kids is a project of the Melbourne Graduate School of Education at The University of Melbourne and is conducted in partnership with Queensland University of Technology. E4Kids is funded by the Australian Research Council Linkage Projects Scheme (LP0990200), the Victorian Government Department of Education and Early Childhood Development, and the Queensland Government Department of Education and Training. E4Kids is conducted in academic collaboration with the University of Toronto Scarborough, the Institute of Education at the University of London and the Royal Children’s Hospital in Melbourne. The E4Kids team would like to sincerely thank the ECEC services, directors, teachers/staff, children and their families for their ongoing participation in this study.
Declaration of conflicting interests
The author(s) declared no potential conflicts of interest with respect to the research, authorship, and/or publication of this article.
Funding
The author(s) disclosed receipt of the following financial support for the research, authorship, and/or publication of this article: E4Kids is funded by the Australian Research Council Linkage Projects Scheme (LP0990200), the Victorian Government Department of Education and Early Childhood Development, and the Queensland Government Department of Education and Training. This work was supported by a fellowship within the Postdoctoral Programme of the German Academic Exchange Services (DAAD).