
Abstract
Research evidence suggests school self-evaluation with the participation of school stakeholders could improve teaching and learning. Identification and use of appropriate self-evaluation frameworks, however, is not an easy task for schools. Such a framework, the LEAD School Effectiveness Surveys, has been developed by Independent Schools Victoria in Australia. The LEAD suite of school stakeholder surveys enables schools to evaluate their overall effectiveness in several domains and make informed decisions for school improvement. This article evaluates the reliability as well as the face, content and construct validity of the LEAD surveys and discusses the ways in which school self-evaluation results could contribute to school improvement. Data were gathered from a total of 119,749 students, teaching staff, general and parents taking the LEAD Surveys in 112 independent (non-government) schools and followed a five-year longitudinal design from 2009 to 2013. The results support the reliability as well as the face, content and construct validity of the LEAD surveys. The importance of evaluating the measuring properties of instruments used for school self-evaluation is discussed and suggestions for school self-evaluation are provided.
Keywords
Introduction
Evidence-based educational policy is regarded as an important component of the efforts to turn around low-performing schools and enhance student outcomes (Levin, 2010; Rosenkvist, 2010). Such a policy advocates a more rational, rigorous and systematic approach in taking policy decisions. According to Sutcliffe and Court (2005), policy decisions should be better informed by available evidence, because policy which is based on systematic evidence is seen to produce better outcomes. Evidence-based policy development usually follows a number of development cycles consisting of several phases such as agenda setting; policy formulation; policy implementation; and finally a process of monitoring and policy evaluation (Antoniou, Kyriakides, & Creemers, 2015; Kyriakides, Creemers, Antoniou, Demetriou, & Charalambous, 2015; Sutcliffe & Court, 2005).
Central to the successful development of evidence-based educational policy at the school level is the capability to identify needs and priorities for improvement in each school. This capability could be achieved through the adoption and implementation of a school self-evaluation framework which emphasises a school’s own responsibility for quality (Creemers, Kyriakides, & Antoniou, 2013; Hofman, Hofman, & Gray, 2010). Such an initiative is important because, according to Barber (1996), the essence of a successful organisation is the search for improvement of which effective self-evaluation is a key element. School self-evaluation (SSE) could be described as an ongoing quest for evidence in a school’s transparent sense of purpose, behaviour, relationships and classroom performance. It is a collaborative, reflective process of school review. Devos (1998) argues that SSE should be seen as “a process mainly initiated by the school to collect systematic information about the school’s functioning, to analyse and judge this information regarding the quality of the school’s education and to make decisions that provide recommendations” (pp. 1–2). In such a process, schools are seen as the “basic unit of change and school educators, that is teachers and principals, are not only the agents, but also the initiators, designers, and directors of change efforts” (Smith & O’Day, 1991, p. 235). School stakeholders are thought to be more aware of their schools’ needs and may therefore be more efficient at directing effort, resources and educational processes to meet such needs (Nir & Ben Ami, 2005; Antoniou & Kyriakides, 2013). They represent key forces in school policy development and are considered to be the levers which are especially well positioned to take actions to improve their schools (Broadhead, Cuckle, Hodgson, & Dunford, 1996; Vitaska, 2008).
Research indicates that meaningful SSE, focused on teaching and learning, and on improving outcomes for pupils, brings about improvement (Creemers & Kyriakides, 2012; MacBeath, 1999). As Kyriakides and Campbell (2004) argue, the overarching goals for SSE are twofold, namely to improve the overall quality of schools and to improve teaching and learning. Improving the quality of schools includes matters such as social relations between members, organisational climate and culture (Freiberg, 1999), the nature of decision making (Hoy & Miskel, 2001) and the responsiveness of schools as organisations to external and internal change forces (Fullan, 2001). Improving teaching and learning involves the concepts of teacher effectiveness (Creemers & Kyriakides, 2006; Muijs & Reynolds, 2001), school effectiveness (Creemers & Kyriakides, 2012; Scheerens & Bosker, 1997; Teddlie & Reynolds, 2000) and decisions about how these concepts are measured appropriately within a school setting (Goldstein, 1995).
The importance of SSE for school improvement has been acknowledged in the Australian education system and has been used as a framework for a number of school improvement approaches. According to the Australian Education Act 2013 (Section 77(2)(d)(ii)), all schools in Australia are required to have a school improvement plan by 1 January 2017. Regulation 44 explains what a school improvement plan must consider and how it is to be distributed to members of the school community. Schools are required to develop, implement, publish and review their school improvement plans. (https://aeaguide.education.gov.au/content/d31-school-improvement-plans).
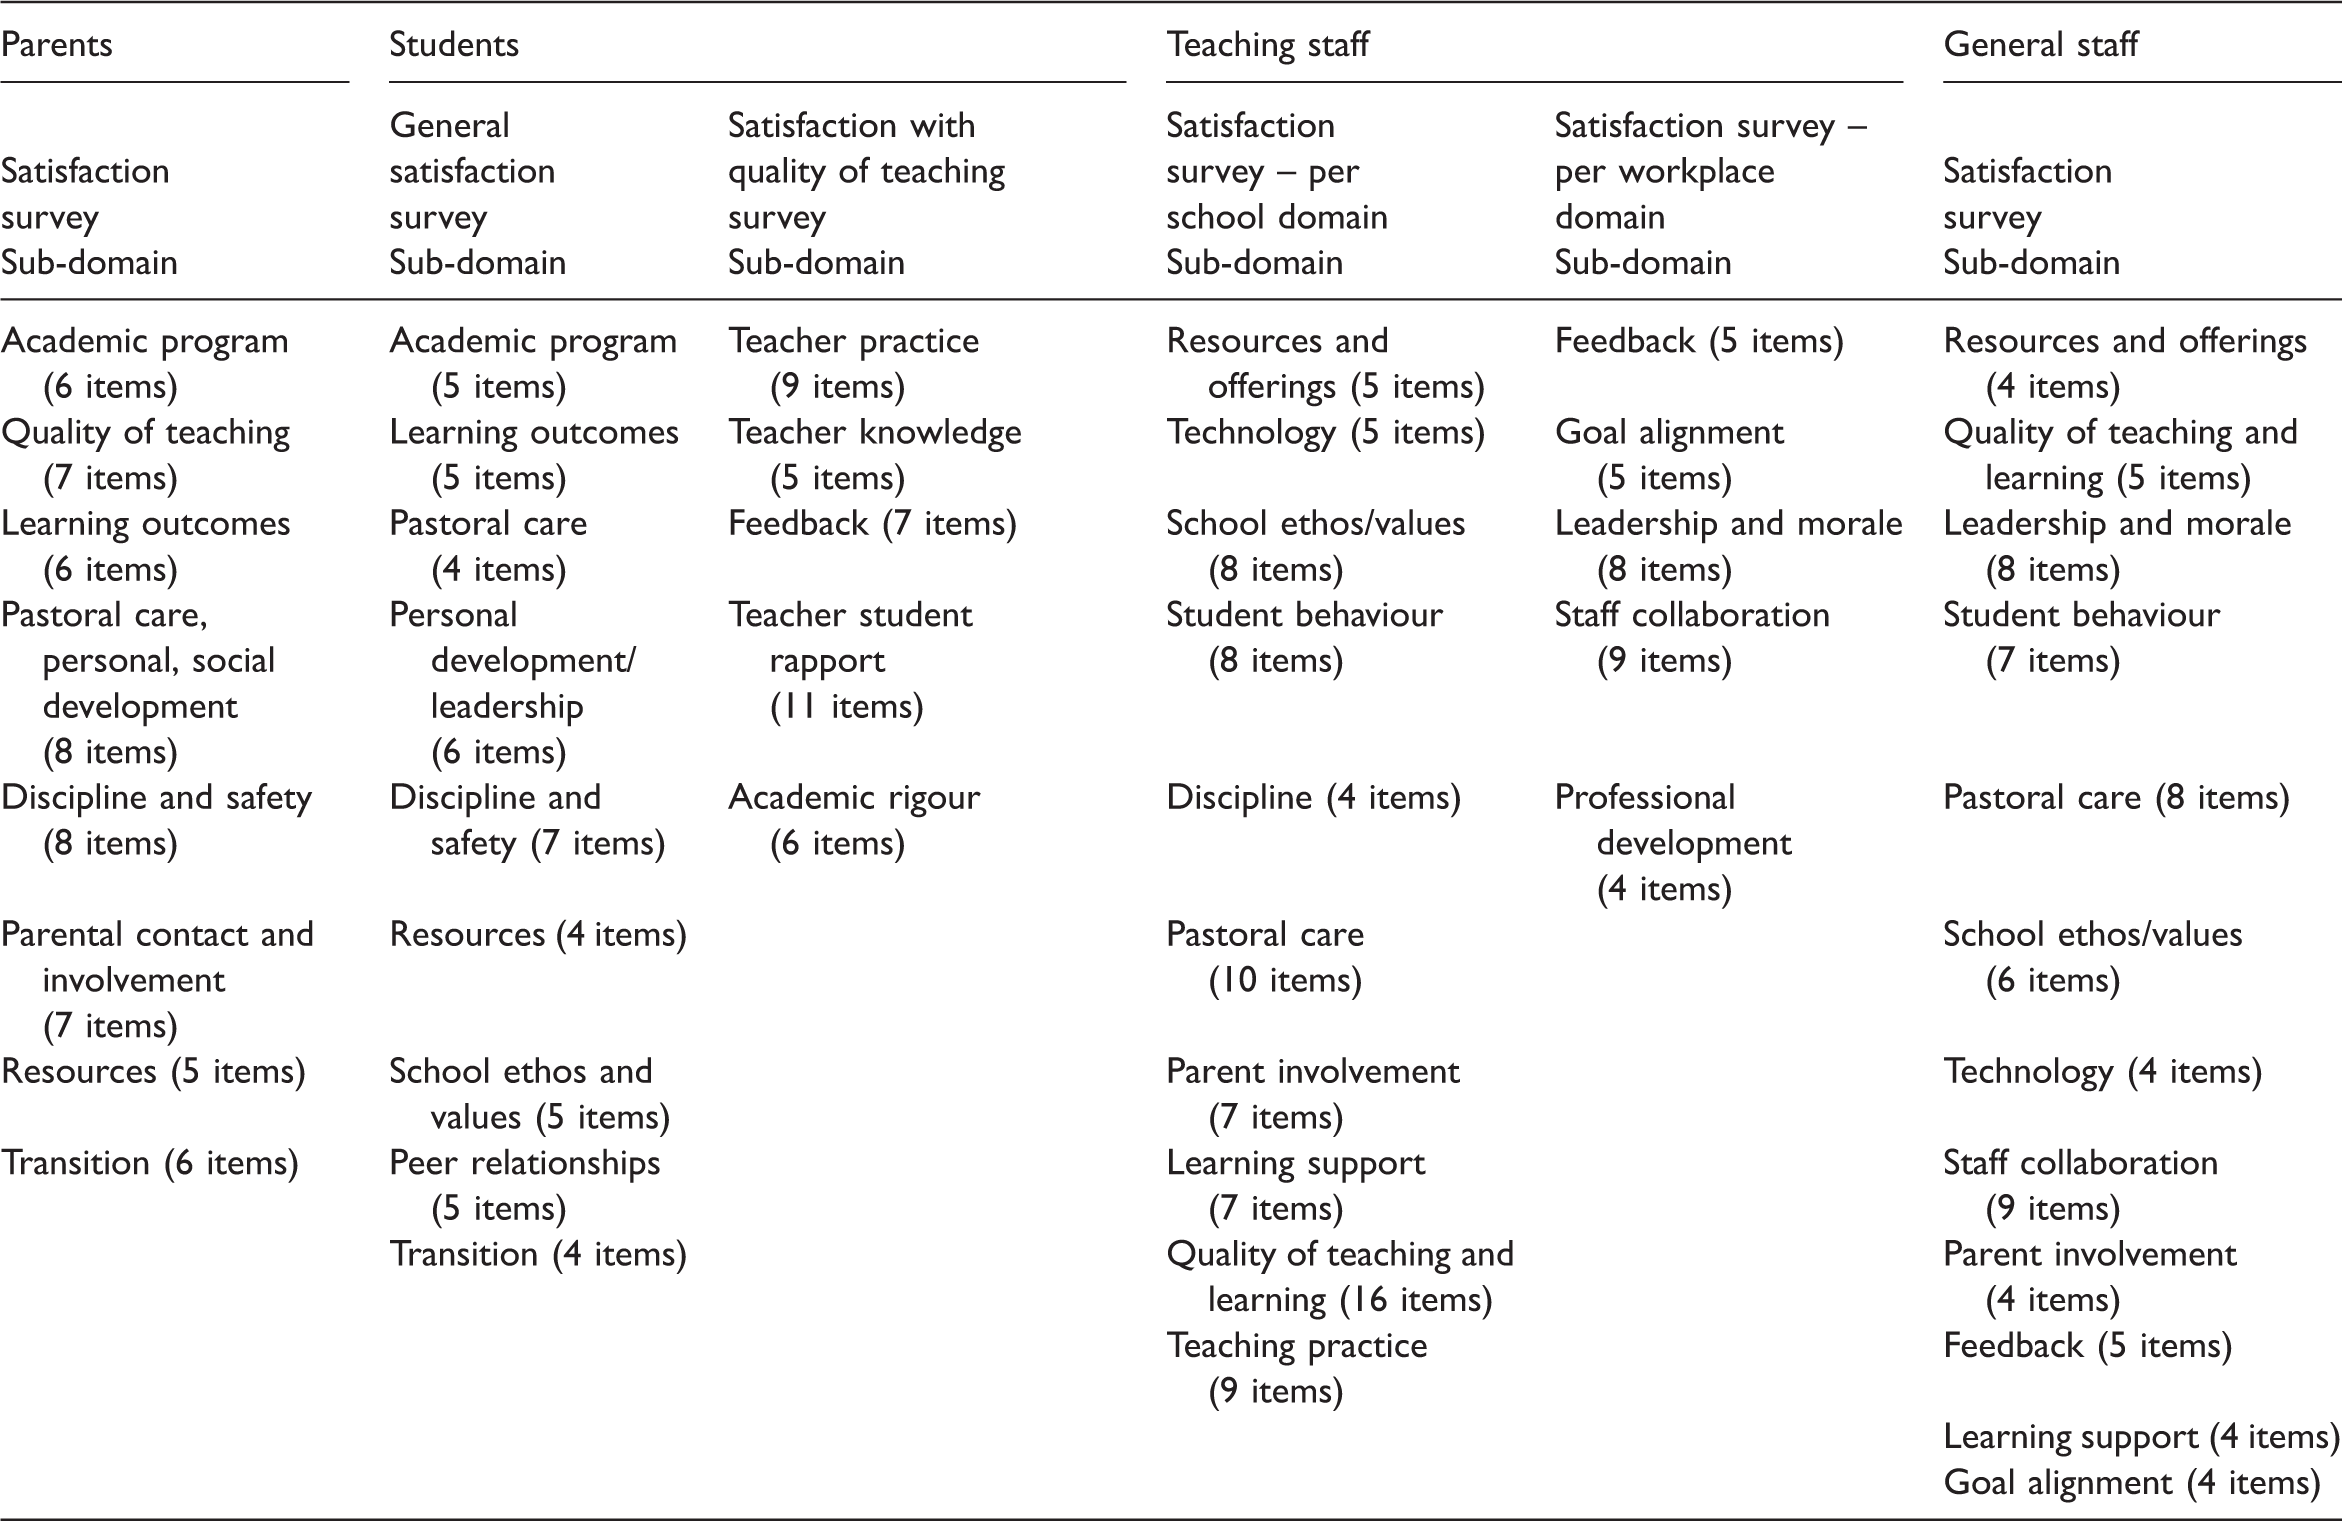
Previously, from 1993 to 1999, in a major school improvement initiative in the state of Victoria, the “Schools of the Future” program, there was an accountability framework comprising three elements: school charter, annual report and triennial review. The triennial review was based on school self-assessment and independent external verification leading to the development of a new school charter (Gurr, 1999). Community consultation was encouraged at all stages of the process, with many schools utilising significant community input into the development of school self-assessment. As for the school annual report, the Department of Education required schools to collect, analyse and report certain data for school self-assessment. Currently, SSE in Victoria focuses on three key areas: student achievement; student well-being and engagement; and student transitions and pathways (Gurr, Drysdale, & Walkley, 2012). Data for these three foci relate to student achievement; teacher opinions of student progress; time allocated to key learning areas; parent opinions on academic rigour; teaching quality; student reporting; school environment; general satisfaction; student attendance; professional development undertaken by staff; and various staff opinion scales. While schools have valued this process, there has been concern expressed about the time and resource demands placed on schools (Victorian Auditor-General’s Office, 1997, p. 67).
Elsewhere in Australia a number of comprehensive approaches to school improvement with elements of SSE have emerged in recent years (Crowther, Andrews, Morgan, & O’Neill, 2012).The Catholic Education Office in Sydney, for example, has developed a cycle of school review and evaluation which combines systematic self-evaluation and external audit. These measures provide a strong framework for school development, accountability and improvement (Turkington, 2009; Twelves, 2005). The subsequent Strategic Leadership and Management Plan, Sydney Catholic Review and Improvement 2010, committed Sydney Catholic schools to develop refined processes for school improvement. Nevertheless, a key recommendation from the external review was that school review procedures should be more firmly based upon agreed criteria and quality indicators so as to promote greater consistency, which would then form the basis for consistent evaluations, both within schools and from external reviewers (Turkington, 2009). In another example, Elkington (1997) describes the balanced score card and the triple bottom line accountability and sustainability frameworks which have emerged as processes to assist leaders with evaluating and planning strategic initiatives. As Bishop and Limerick (2006) acknowledge, however, there is a need for caution in using frameworks designed primarily to satisfy economic rational criteria. Norman and MacDonald (2004) criticise triple bottom line accountability and argue that academic analysis to support the enthusiasm with which governments have embraced triple bottom line principles is missing. Criticism also focuses on services offered to help firms measure, report on, or audit the additional bottom lines because of the vague nature of exactly what is to be measured; and what kinds of information stakeholders have a right to access (Hubbard, 2009).
As elaborated above, despite the importance of SSE for school improvement, it is not easy for schools and school boards or councils to decide on the appropriate and relevant self-evaluation framework. Nor is it simple to identify validated research tools to collect and analyse data from different aspects of school functioning that could lead to sustainable school improvement. In addition, relying solely on school stakeholders’ experiences can sometimes be limiting to school development and improvement (Britzman, 1991). There appears to be little evidence from published literature that assisting school stakeholders to engage in any improvement program, without providing them with a validated framework and appropriate tools to identify priorities for improvement, necessarily meets their needs or improves school effectiveness (Smith & Hatton, 1992). Such a framework and tools towards school self-evaluation have been developed by Independent Schools Victoria (ISV) in Australia.
ISV is a not-for-profit peak body representing around 210 independent (non-government, self-managed and self-governed) schools in the State of Victoria. It is a membership association which provides professional services rather than acting as an authority for independent schools. ISV provides a range of diverse services such as professional learning programs; representation on various government bodies; research; employment relations, school governance and government accountabilities advisory services. The LEAD School Effectiveness Surveys are one of the research services that ISV provides to member schools annually.
The theoretical framework of the study – The LEAD surveys
In 2006, ISV recognised that there was a paucity of useful, theory-driven survey tools available for schools to examine the perceptions of staff, parents, students and school boards of the quality and effectiveness of the educational services they were providing. As a result, ISV piloted a parent satisfaction survey tool in 2007 to learn what parents thought about the quality of their child’s educational experiences in order to help each participating school identify areas for improvement. The framework of school effectiveness domains that were developed, formed the basis and theoretical school effectiveness framework for ISV’s surveys. Between 2008 and 2011, surveys of students, school boards and staff were added to the suite of surveys, and it became known as The LEAD Project.
The LEAD Project – ‘Listen to our stakeholders, Evaluate what is said, Act on this knowledge and Deliver better outcomes’ – is a comprehensive suite of school stakeholder surveys and data analyses that provide longitudinal and benchmarked performance measures for school boards and senior leadership teams. The LEAD Surveys comprise diagnostic and reporting tools that enable school leadership teams to analyse their school’s performance against key school effectiveness indicators. School performance is also benchmarked against the results for all participating schools. There are four surveys in the LEAD Suite: (1) Parent Satisfaction Survey; (2) Staff Satisfaction Survey; (3) Student Satisfaction Survey; and (4) Year 12 Exit Student Satisfaction Survey for students in their final school year. There is a fifth survey in the suite, the Governance Survey, which is a qualitative self-assessment tool for school boards to examine their operations in a number of areas which relate to high-quality school governance principles. The survey is qualitative in nature, involves very small sample sizes (with the membership of school boards typically consisting of between 4 to 12 people), is generally conducted by schools every three or more years and (unlike the other four surveys in the suite) has not been developed psychometrically. For this reason, it is neither analysed nor discussed in this article. In addition, there is a sixth report, called The LEAD Report, which synthesises all data sets from the Parent, Student and Staff, Year 12 Exit Student surveys into one report. The LEAD Report provides feedback about performance from each of the key stakeholder groups, and aligns these perceptions within its framework of school effectiveness with other objective information, such as school financial data; teacher salaries; national student test scores (e.g., the National Assessment Program – Literacy and Numeracy (NAPLAN) scores for students in years 3, 5, 7 and 9) and Australian Tertiary Admissions Rankings (ATAR) scores for students completing year 12; student attendance and teacher retention rates; and post-school destinations collated from reliable sources.
Research aims
Taking into consideration the basic characteristics of the LEAD school stakeholder surveys, this article (a) explores the content and construct validity, reliability and internal consistency of the LEAD questionnaires; and (b) provides suggestions to schools aiming to engage in a self-evaluation process using a theory-driven and evidence-based approach towards improving their effectiveness.
Research methods and data analyses
Development of the LEAD Surveys
The LEAD School Stakeholder Surveys were developed by ISV between 2006 and 2011. A mixed-methods approach was utilised that consisted of qualitative and quantitative data collection phases. The qualitative phase was mainly based on symbolic interactionism (Blumer, 1969), according to which social actors who, while their perceptions are influenced by external factors (e.g., school policies, principal leadership), retain a sufficient sense of agency to collaborate and negotiate planned activities. Consistent with this framework, no concepts from the literature were employed a priori to direct data collection. Once the qualitative data had been collected, then additional questions/items, particularly pertaining to the quality of teaching, were sought from the existing literature, as suggested by Creemers and Kyriakides (2008). The second phase in developing the surveys was quantitative. Here, data were collected by the corresponding samples. Exploratory factor analysis, with Principal Axis Factoring and Oblique Rotation (Direct Oblimin with Kaiser Rotation) analysis relying on SPSS (Version 19), was used to analyse the data and to test the grouping consistency of each factor identified in the qualitative phase. A similar procedure was followed to develop all LEAD surveys.
Sample
Data were gathered from students, teaching staff, general (non-teaching) staff and parents taking the LEAD Surveys in 112 independent schools in Victoria, Australia, and followed a five-year longitudinal design from 2009 to 2013. The LEAD Project is on-going and as at May 2016; 199,038 parents, staff, students and board members from 165 schools have participated in 1,735 surveys. Whilst the majority of the schools involved have been independent schools, they represent a highly diverse set of schools in terms of their size, religious affiliation, gender, educational philosophy, socio-economic status and locality. Most schools participate in the surveys biennially (with some undertaking them annually), and many have used the longitudinal data to effect changes and address issues that have emerged from the results. To examine the reliability and validity parameters of each survey, de-identified data were gathered from 65,679 students in Years 5 to 12 (students aged from 10 to 18); 40,279 parents; 9,975 teaching staff and 3,816 general staff.
Data analysis procedure
To examine the reliability and validity parameters of the LEAD surveys, the data were analysed using the SPSS (v.22), AMOS and EQS software programs. The analyses were conducted separately for the following LEAD surveys: (a) General Student Satisfaction Survey; (b) Student Satisfaction with the Quality of Teaching; (c) Parent Satisfaction Survey; (d) Survey of Teaching and General Staff Satisfaction with their schools and educational services (school-based domains); and (e) Survey of Teaching and General Staff Satisfaction with the schools as workplaces (workplace domains).
To evaluate the construct validity of the LEAD surveys, data were analysed through confirmatory factor analysis (CFA) approaches. For each survey, separate CFA analyses were conducted to help identify the extent to which the theoretical models developed and used in the surveys came within acceptable fitting indices and parameters. To operationalise the various latent variables of the LEAD surveys, the questionnaire items (predictors) were used. Latent variables are not directly observable and hence they are inferred constructs, based on the observed variables that were selected to define each latent variable (Schumacker & Lomax, 2004, p. 196). Here we drew on structural equation modelling (SEM). In SEM analysis, cases with missing values pose an important challenge, because typical modelling procedures simply discard these cases from the analysis. When there are few missing values (very roughly, less than 5% of the total number of cases) and those values can be considered to be missing at random (i.e., when a missing value does not depend on other values), then the typical method of list-wise deletion is relatively safe (Sinharay, Stern, & Russell, 2001). The percentage of the missing values (system missing) was much higher, however, because respondents were able to answer “don’t know” and “not applicable” for each question on an 11-point Likert scale of agreement from 0 = no agreement to 10 = complete agreement to a series of questions. Thus, it was necessary to handle the missing values in the datasets using multiple imputation, a procedure that provides an analysis of patterns of missing data, geared toward eventual multiple imputation of missing values. Multiple versions of the dataset are produced, each containing its own set of imputed values. When statistical analyses are performed, the parameter estimates of the imputed datasets are pooled, providing estimates that are generally more accurate than they would be with only one imputation. This method of multiple imputation is generally considered to be superior to single imputation (Allison, 2002).
Given the high correlation coefficients found between the first-order factors (survey sub-domains), second-order CFA analyses were then performed. Second-order models are most typically applied in research contexts in which measurement instruments assess several related constructs, each of which is measured by multiple items. The second-order model represents the hypothesis that these seemingly distinct but related constructs can be accounted for by one or more common underlying higher order constructs (DeYoung, Peterson, & Higgins, 2002). Second-order models are potentially applicable when: (a) the lower order factors are substantially correlated with each other, and (b) there is a higher order factor that is hypothesized to account for the relations among the lower order factors. For example, to test whether there is a general student satisfaction factor that underlies a wide range of specific student-related satisfaction issues, we can assume that the specific issues (each assessed by multiple items) are lower order factors, and that general satisfaction is a higher order factor, which accounts for the commonality among the specific issues.
A second-order factor model has three potential advantages over a first-order factor model. First, the second-order model can test whether the hypothesized higher order factor actually accounts for the pattern of relations between the first-order factors. Second, a second-order model imposes a structure on the pattern of covariance between the first-order factors, and explains the covariance in a more parsimonious way with fewer parameters (Gustafsson & Balke, 1993). Third, a second-order model separates variance due to specific factors from measurement error, leading to a theoretically error-free estimate of the specific factors (Rindskopf & Rose, 1988). The unique variance of each first-order factor that is not shared by the common second-order factor represents the specific factors. These specific factors, in turn, are represented by the disturbance of each first-order factor.
For each survey, separate second-order CFA analyses were conducted to identify the extent to which the theoretical models developed and used in the LEAD surveys came within acceptable fitting indices and parameters. For each model several fit indices have been estimated (Shelby, 2011), such as the comparative fit index (CFI), normed fit index (NFI), goodness-of-fit index (GFI), root mean square residual (RMR) (Kline, 2011) and χ2/df (Marsh & Hocevar, 1985).
Results
Content and face validity
Content validity refers to the extent to which the content of the measuring instruments is appropriate and relevant to the survey purpose (DeVon et al., 2007). This kind of validity indicates whether the content reflects the complete range of the attributes under study and is usually undertaken by a number of experts (Antoniou & Kyriakides, 2011; Pilot & Hunger, 1999). The content validity of the surveys was evaluated in collaboration with two Faculty members at the Faculty of Education, University of Cambridge, both of whom are experienced researchers in the area of school improvement. The conceptual framework of the surveys was found to be comprehensive and satisfactory in relation to contemporary research findings on school effectiveness research and especially with reference to recently developed multilevel models (e.g., Creemers & Kyriakides, 2008; Scheerens, 1992; Stringfield & Slavin, 1992; Teddlie & Reynolds, 2000). Some suggestions relating to the extent to which the questionnaire sub-domains could be expanded were provided, such as the measurement of student and teacher behaviour outside classrooms (during break-time) as part of school ethos and culture; and the extent to which parents are given the opportunity to be involved in the teaching–learning process, when they have relevant expertise as part of a school collaboration policy.
Next, the face validity of the surveys was examined. Face validity indicates the extent to which questionnaires are appropriate to a survey’s purpose and content. It is the easiest validation process to undertake, but is the weakest form of validity (DeVon et al., 2007; Trochim, 2001). Five teachers, two school administrators, the two Faculty members mentioned previously and two research assistants were asked to evaluate the face validity of the surveys. All provided positive comments on the appearance of the questionnaires in terms of feasibility, readability, consistency of style and formatting, and the clarity of the language used.
Reliability and construct validity
To evaluate the reliability of the LEAD surveys, Cronbach’s alpha (α) was calculated for each survey as an entity and for each sub-domain with particularly satisfactory results based on the total distributions. In particular, all domains (constructs) and sub-domains were found to have a Cronbach α from 0.89 to 0.96, which indicated very high internal consistency of all scales. Further examination of “Cronbach’s Alpha if Item Deleted” suggested that all items should be retained. Thus, the instruments held together well as entities and as separate factors. To evaluate the construct validity of the LEAD Surveys, separate CFA analyses were conducted for each survey to help identify the extent to which the theoretical models developed and used in the surveys came within acceptable fitting indices and parameters.
First-order factors: Sub-domains
First-order CFA models were tested and compared to identify the final model with the optimum fit indices in every sub-domain of each survey. This procedure led to the development of 54 CFA models demonstrating the construct validity of the questionnaire items in each sub-domain. An example relating to the “Academic Program” sub-domain of the General Student Satisfaction Survey is provided in Figure 1.
CFA results for academic program sub-domain of the General Student Satisfaction Survey. CFA analysis results and factor loadings for students' general satisfaction survey. CFA analysis results and factor loadings for students’ satisfaction with quality of teaching survey. CFA analysis results and factor loadings for parents’ satisfaction survey.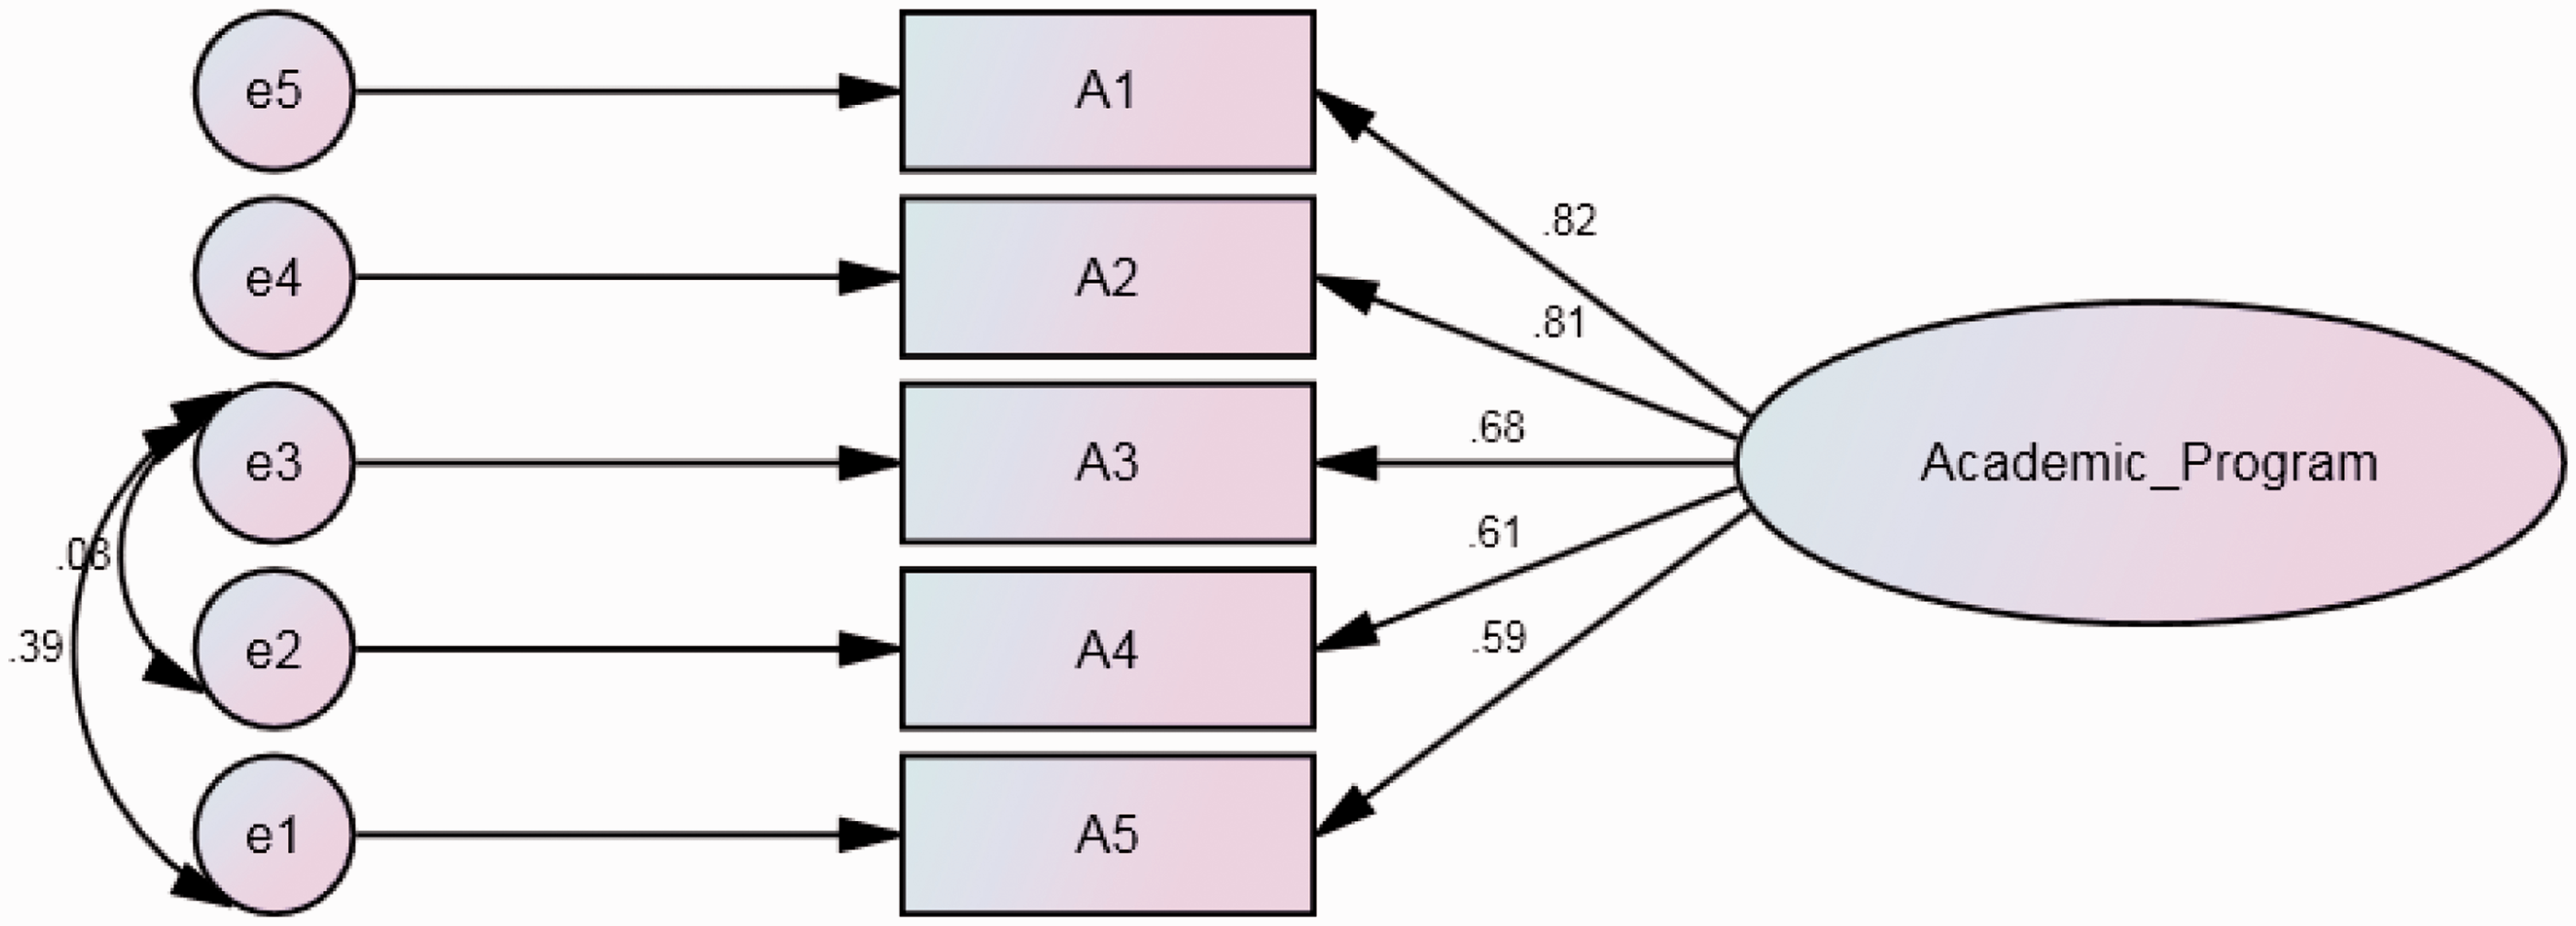
A CFA model designed to test the multidimensionality of the part of the General Student Satisfaction Survey measuring students’ perceptions of the academic programs at their school was used. The model hypothesised that the five variables (i.e., questionnaire items) could be explained by one factor and that each variable would have a non-zero loading on the factor that it was designed to measure, and zero loadings on other factors. The findings of the first-order factor SEM analysis generally affirmed the theory on which the questionnaire was developed. Although the chi-square value for the one factor structure (χ2 = 87.1, df = 3, p < 0.001) was statistically significant, the values of RMSEA (0.031) and CFI (0.969) met the criteria for acceptable level of fit.
CFA models developed per questionnaire and sub-domain.
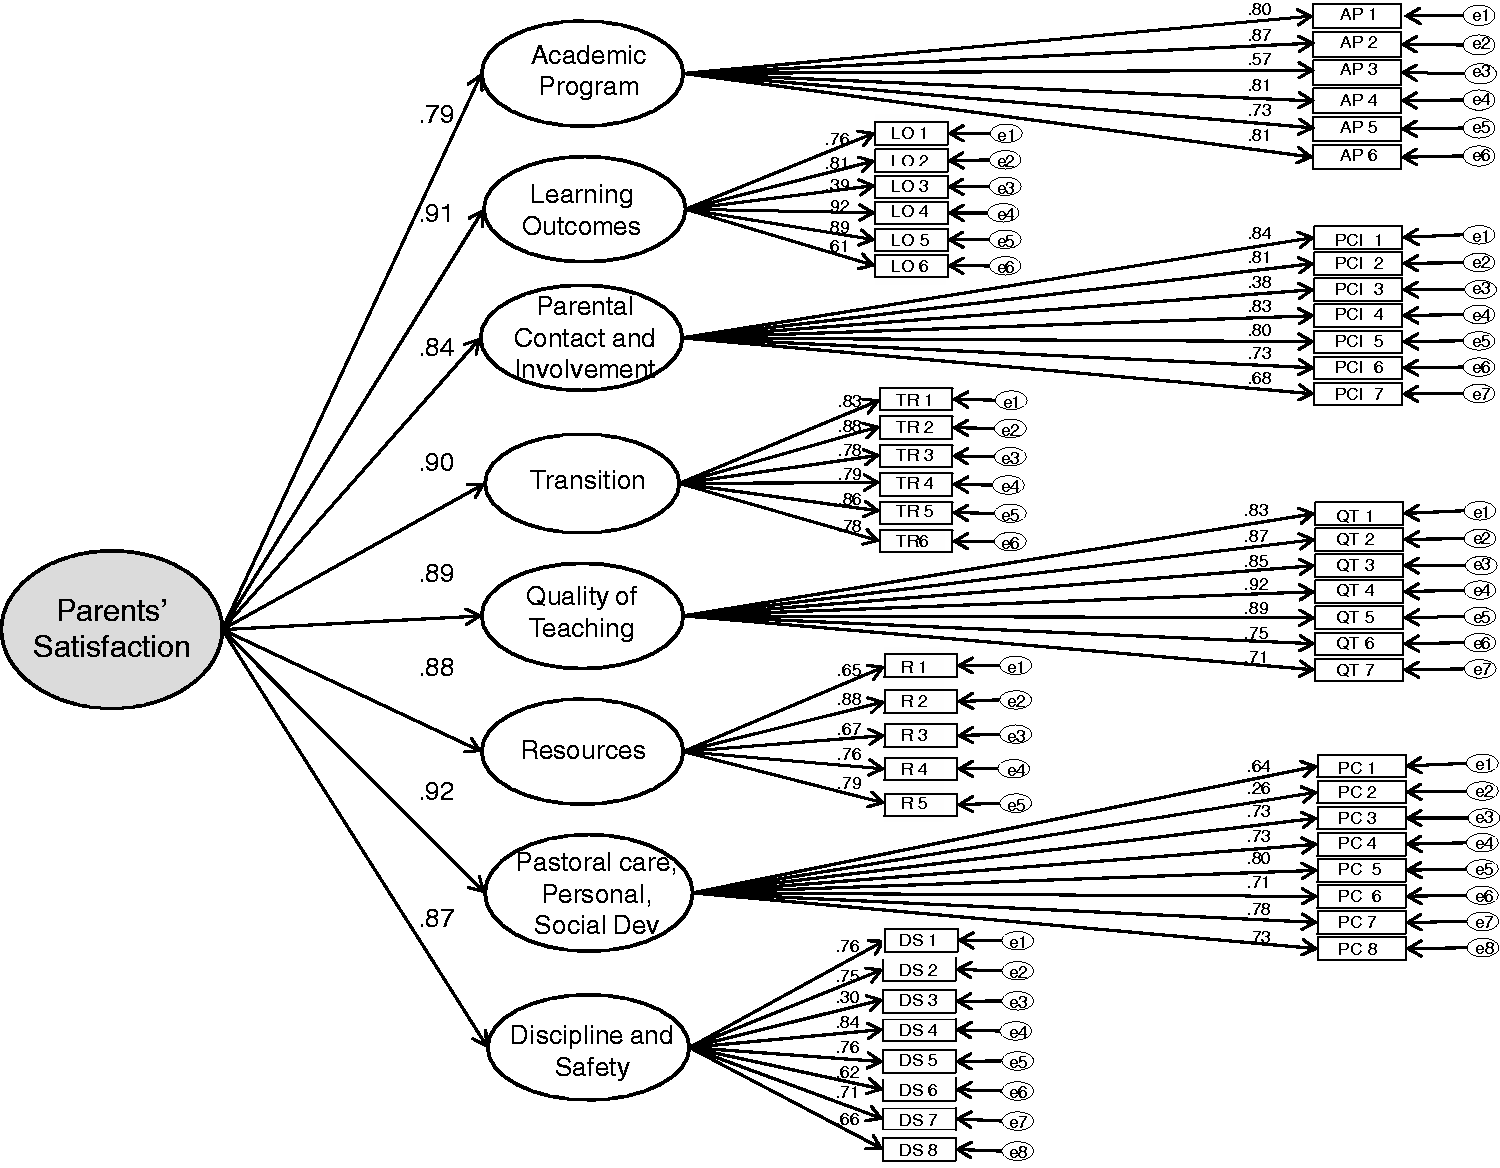
To evaluate the construct validity and the reliability of the questionnaire sub-domains, in each of the models in Table 1 several fit indices were estimated, such as the significance of χ2, the RMR, SRMR, GFI, CFI and RMSEA. In cases where the factor-loadings of questionnaire items were not found to be considerably high, alternative models which excluded the particular items were tested and compared with the original models. In all cases, however, it was found that the existing models yielded a better fit than alternative reduced models; thus, all questionnaire items were retained in the final CFA models. Such comparisons were made for several questionnaire items. In the Parent Satisfaction Survey, particularly, comparisons were made for the Learning Outcomes sub-domain, with and without item LO3 (i.e., “My child is motivated to learn at this school” – with a factor loading of 0.49). The results of the analyses provided empirical support for the construct validity, the reliability and the internal consistency of the questionnaires. The goodness-of-fit statistics, however, were found to be somewhat marginal for the “Quality of Teaching and Learning” sub-domain of the Teaching Staff Satisfaction Survey and for the “Leadership and Morale” sub-domain of the General Staff Satisfaction Survey but within acceptable margins.
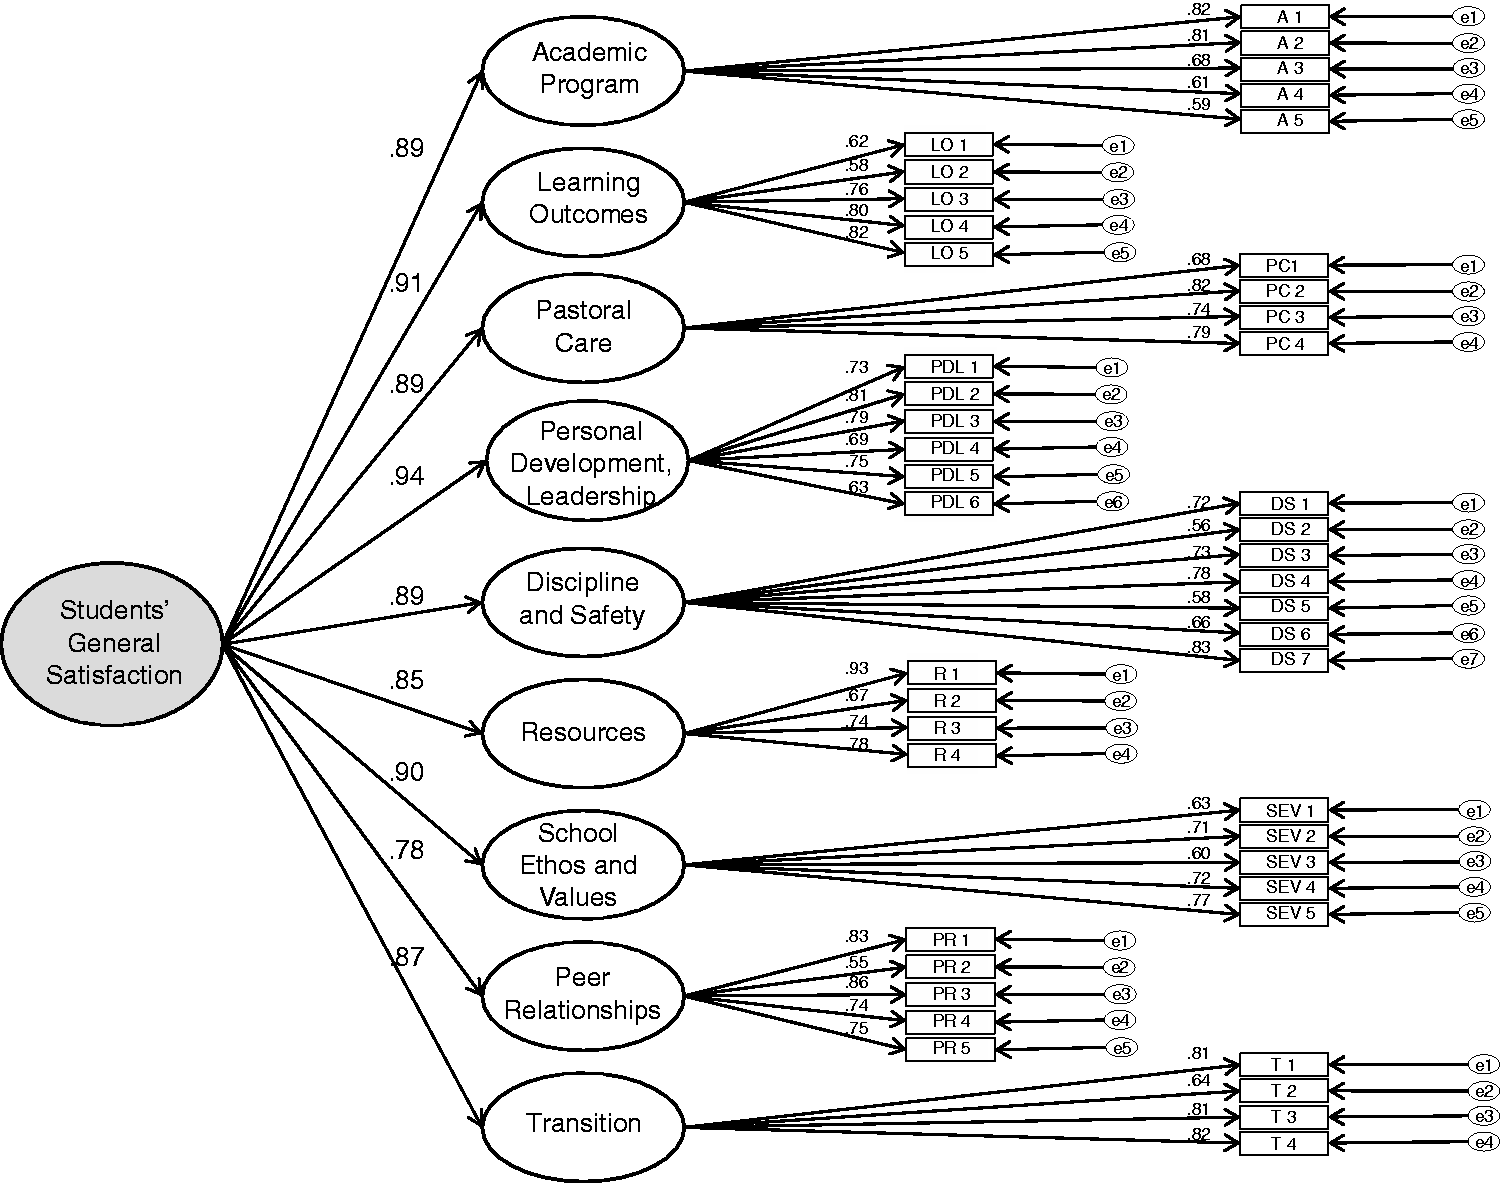
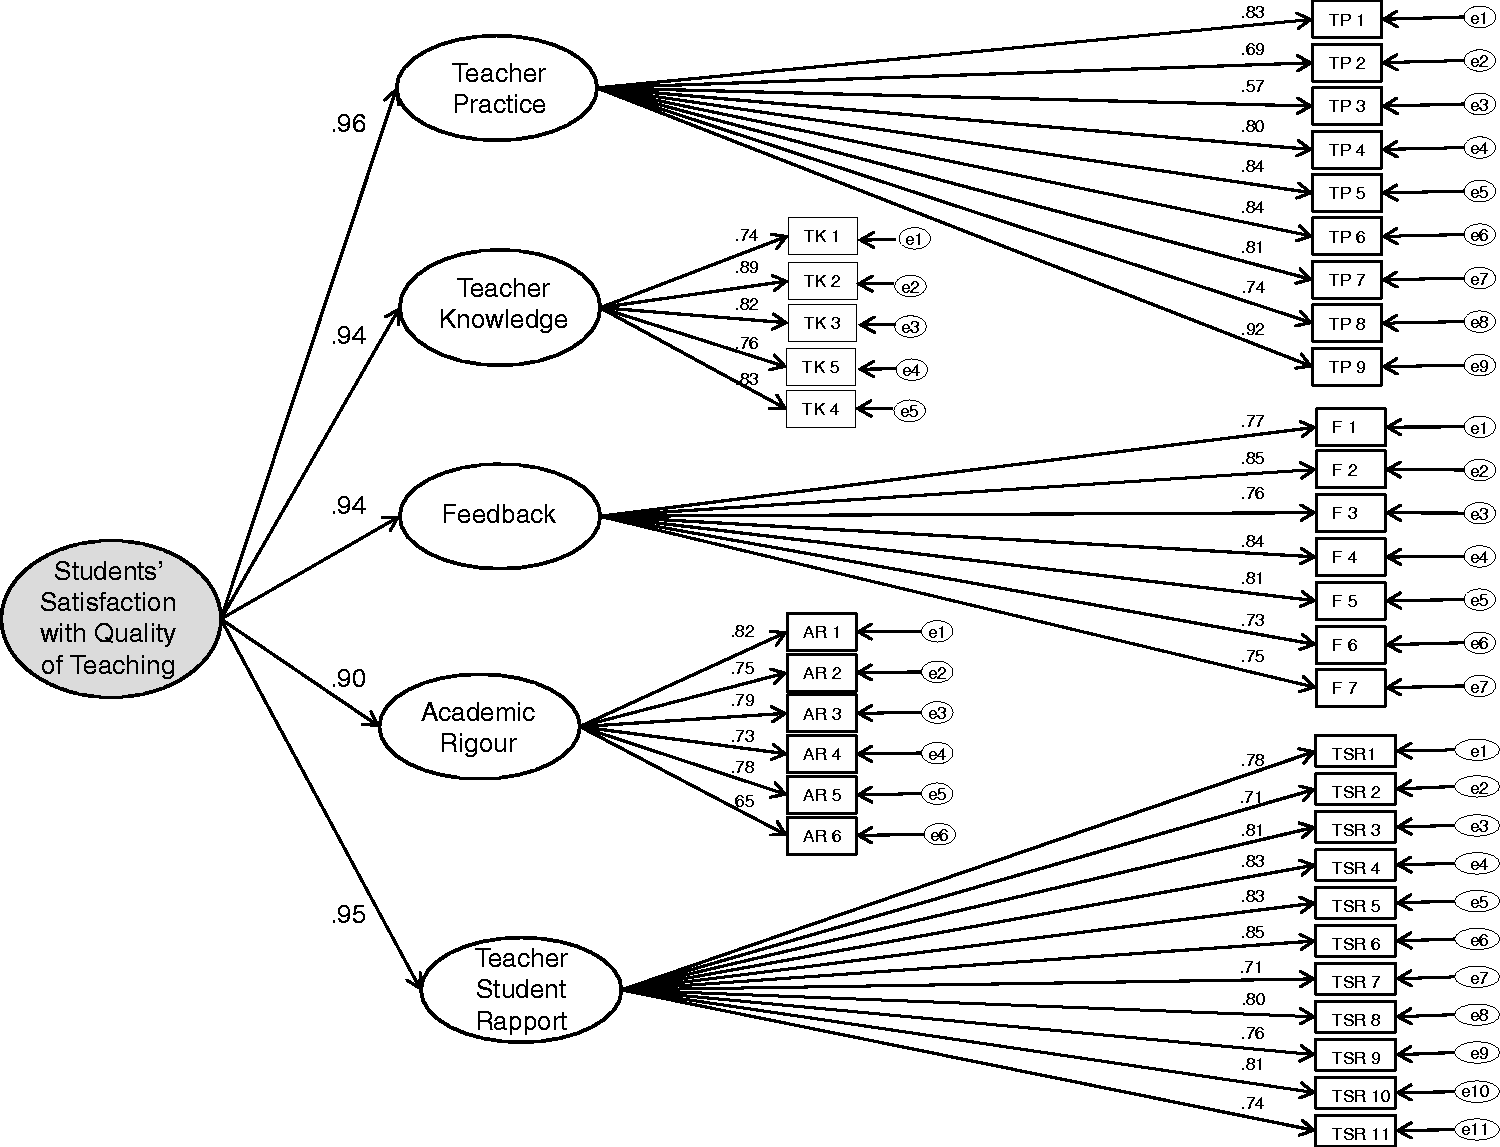
Second-order factors: Correlations of first-order factors
Given the high correlation coefficients between the first-order factors, i.e., sub-domains, for each survey ranging from 0.81 to 0.92, we also considered second-order factors, i.e., factors that may be determined from the correlations of the first-order factors. Second-order CFA analyses were performed for all five surveys. Figures 2 to 5 present the results and the factor loadings for (a) Students’ General Satisfaction Survey, (b) Students’ Satisfaction with Quality of Teaching Survey, (c) Parents’ Satisfaction Survey and finally for (d) Teaching Staff Satisfaction per Workplace Domain Survey.
CFA analysis results and factor loadings for teaching staff satisfaction per workplace domain survey.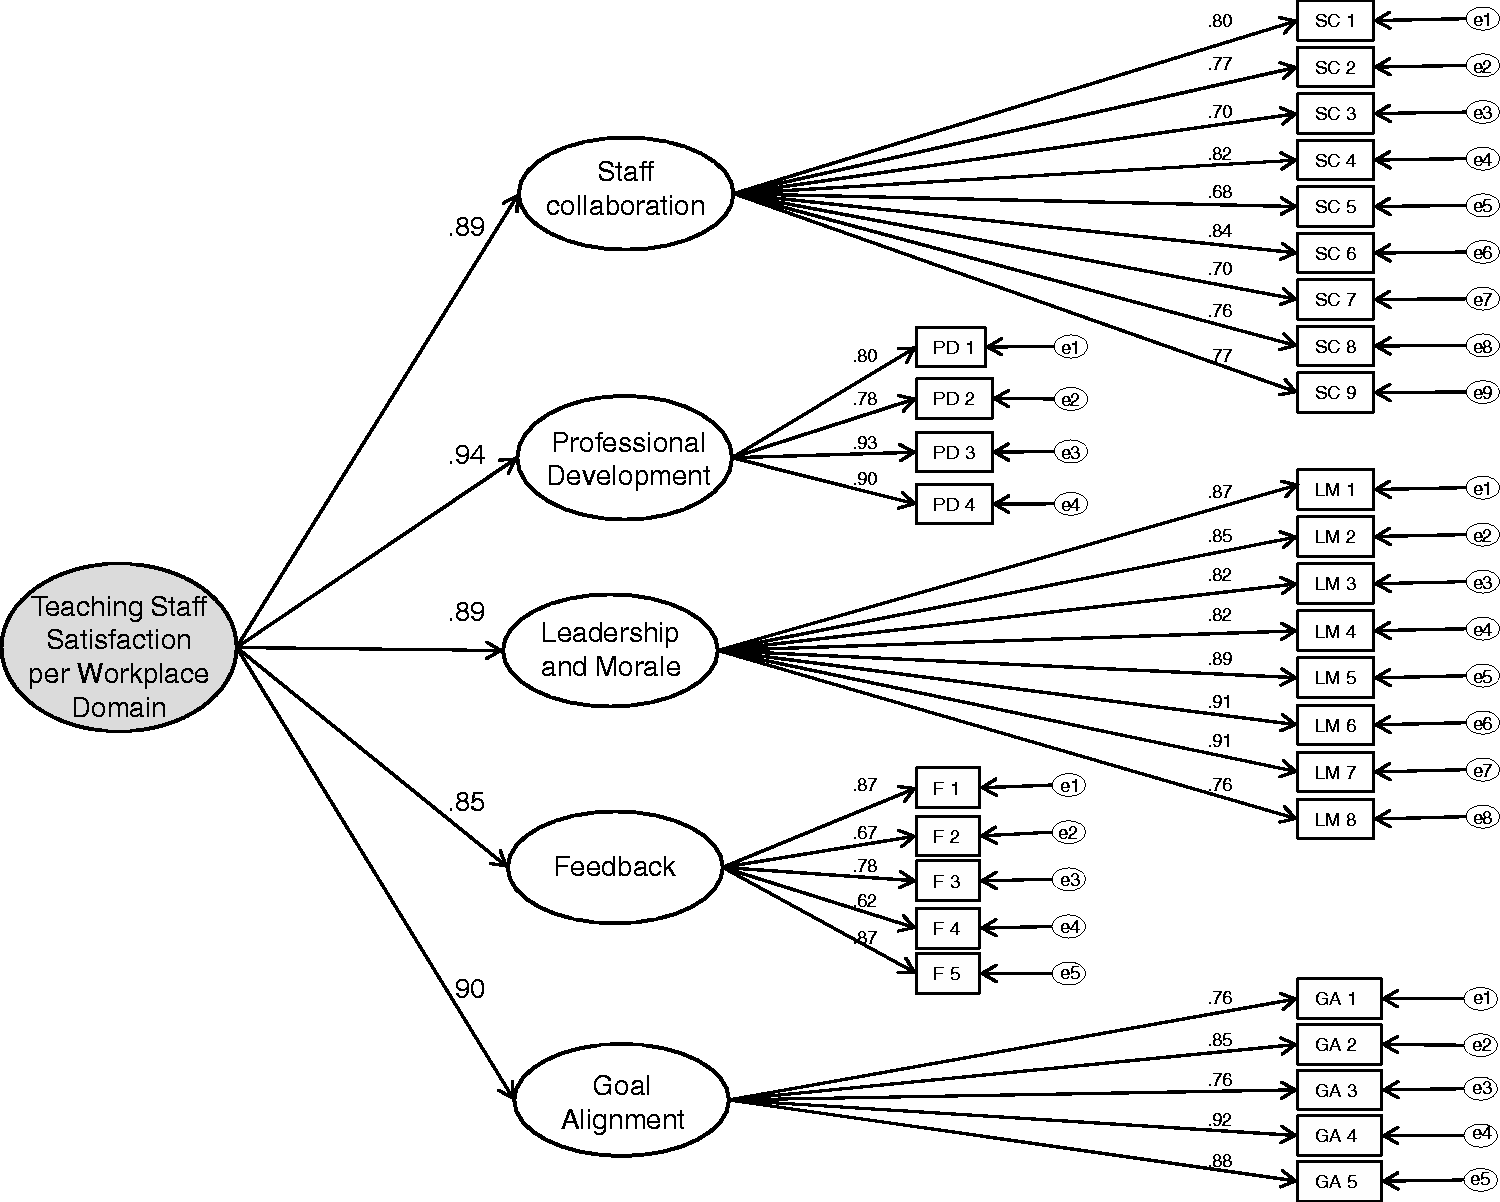
To test the fitting of each model presented above, several fit indices were estimated, such as the significance of χ2, the RMR, SRMR, GFI, CFI and RMSEA. It was found that the existing models yielded a better fit than alternative reduced models. The results of the analyses provided empirical support for the construct validity, the reliability and the internal consistency of the questionnaires. The findings of the second-order factor SEM analysis generally affirmed the theory upon which the questionnaires were developed. Although the scaled chi-square was statistically significant in all cases, the values of the RMSEA (0.012 to 0.031), the values of the RMR (0.06 to 0.10) and the values of NFI, GFI and CFI (0.955 to 0.969) met the criteria for acceptable level of fit.
Impact and value added for school improvement
This section provides information on the impact of the LEAD surveys in a number of domains towards school improvement. The survey results, data analyses and feedback provided to school leaders are intended primarily to encourage all school stakeholders to engage in focussed and structured discussions about their schools’ needs and priorities for improvement. This is important as schools could decide to allocate their resources and effort to issues which have not been effectively evaluated, and work needlessly on developing school-based policies which may not be empirically grounded. As Garvin (1993) argues, continuous improvement of work is highly reliant on data to diagnose problems and make decisions, and is a sound basis from which to improve schools.
The results from the LEAD surveys and reports are provided to the school principals only in the first instance and, if requested, ISV provides on-going support to principals and school management teams on how best to interpret the results. The support is provided in the form of consulting services within the schools themselves, or briefings, seminars and workshops on ISV premises to help schools respond to stakeholders’ concerns, develop school improvement plans, maintain high standards of governance and business management as a first level of support. A second level of support focuses on the wider school community and may involve teachers, students and parents to discuss constructively which school improvement priorities to consider. https://www.is.vic.edu.au/services/professional-learning/index.htm ISV offers professional learning opportunities and seminars relating to curriculum-pedagogy, employment relations, governance, languages, leadership, strategic management, student services and vocational services, for example. Over 40 participating schools have utilised the feedback from the LEAD suite of surveys to help them review individual pathway plans for students; initiate improvements in teaching quality, such as monitoring and providing prompt feedback to students of work submitted; and introduce improvements to the school environment, such as better management of bullying. In general, the LEAD surveys have been used to help participating member schools enhance their systematic thinking and improvement initiatives through the development of sound school strategic improvement plans.
There is evidence that schools and school systems which are best able to adapt to change and maintain improvement are those which are best able to evaluate their own performance (Hill, Crevola, & Tucker, 2003). As far as the LEAD surveys are concerned, there are many drivers for continuous improvement. These include clearly written indicators of quality for school use in rating their performance on selected areas for annual improvement. School leadership teams try to take a strategic approach to engage staff in improvements throughout each year. ISV conducts feedback surveys and consultations with school principals to determine how useful the results of the LEAD surveys have been in aiding school improvement initiatives. The feedback has shown that school principals and stakeholders are generally highly satisfied with the indicators and effectiveness measures used in the LEAD suite of surveys and with the detailed feedback provided to them after the data analyses, especially the student and parent opinion surveys, school environment for staff and options for teacher professional development. The LEAD Report is also viewed as being useful in providing a 360° view of all stakeholder opinions together with more objective data for each indicator for evaluating school performance. These data are also benchmarked against the aggregated results from all other participating schools to provide school leaders with some perspective as to whether they are under- or over-performing relative to other schools. The dataset is now large enough to provide benchmarks to similar schools in terms of school size, religious affiliation or educational philosophy, for example. In addition, The LEAD Report and each survey report provide school councils with annual progress information and reporting on unique aspects of their school charter, on a longitudinal basis.
Despite the fact that these surveys have, to date, only been implemented in independent schools, the generic nature of the questions and their content and construct validity imply that they can be applied to any type of school, such as government schools, Catholic schools, Australian interstate schools as well as overseas schools and systems. The independent sector in Victoria (and indeed Australia) is highly diverse with wide variations in their size (from 20 to over 3000 students); religious affiliations (e.g., Anglican, Presbyterian, Jewish, Islamic, some Catholic and many non-denominational schools); educational philosophies (such as Montessori, Steiner, International Baccalaureate, Indigenous and mainstream schools); single sex and co-educational schools; schools with large variations in their socio-economic status (i.e. some regional schools, schools for disadvantaged students and schools in high socio-economic areas). These surveys have been successfully implemented in all these types of schools in Victoria, as well as in some interstate and in an overseas school in China.
Conclusions
The study accords with current approaches that emphasise the importance of SSE and the use of validated research instruments to explore school stakeholders’ perspectives in identifying school needs and in developing evidence-based policies for school improvement. The LEAD Project is a comprehensive suite of school stakeholder surveys, data analyses, diagnostic and reporting tools that provide longitudinal and benchmarked performance measures for school leadership teams to analyse their school’s performance against key effectiveness indicators and facilitate the development of informed policy and actions towards school improvement.
Taking into consideration the fact that several researchers have questioned the reliability and validity of several SSE instruments (Bierman, Nix, Greenberg, Blair, & Domitrovich, 2008; Slavin, 2002), this study evaluated the measuring properties, namely, the face, content and construct validity as well as the reliability, of the LEAD surveys. Exploring the measuring properties of research tools is important and has implications for the research design, the quality of the data and the conclusions drawn (Lietz, 2010). The conceptual framework (content validity) of the surveys was found to be comprehensive and satisfactory in relation to contemporary research findings on school effectiveness research (e.g., Creemers & Kyriakides, 2008; Scheerens, 1992; Stringfield & Slavin, 1992; Teddlie & Reynolds, 2000). The CFA results also provided support of the construct validity of the LEAD surveys. This is important, because, although the importance of SSE has been reported extensively, the task of designing and developing instruments to collect data about each school factor is not an easy undertaking.
In relation to the sources of evaluation data, an important element of the LEAD surveys is that they take into consideration the perceptions of all school stakeholders and facilitate change towards school improvement on multiple levels. Although parents have traditionally been excluded from participating in schools (Millar, 2006), since the 1970s, a movement to foster and promote more parent involvement took off, particularly in Victoria (Gamage, 1996; Gurr et al., 2012). This is important and has been stressed by several studies (Fullan, 2001; Kyriakides et al., 2015; Turkington, 2009). For example, Eacott’s (2004) model recognises a number of stages for school improvement, namely a visionary stage; a strategic stage; an implementation stage; and an assessment stage. The whole school, including the wider school community, may be involved in creating the strategic vision. The whole school community may also be involved in the assessment of the strategic plan, and in the identification of its strengths and weaknesses. Similarly, Mulford and Grady (2001) and Mulford et al. (2007) argue that parents want to be involved in schools – and particularly in school decision making. Better appreciation of systems and of all stakeholders leads to more appropriate actions.
In relation to the evaluation framework, this study emphasised the need for promoting the design of school improvement projects that are based on a theoretical framework and instruments which have been systematically tested (Kyriakides et al., 2015; Mosteller & Boruch, 2002; Slavin, 2002). The basic assumption supporting such initiatives is that improvement strategies have to be based on evidence and, therefore, that data should be collected to identify the improvement priorities of each school (Levin, 2010). Researchers also need to acknowledge that relying solely on school stakeholders’ experiences to develop their own evaluation tools can be limiting in terms of their school development and improvement (Britzman, 1991). There appears to be little evidence from the research literature that assisting school stakeholders to engage in any developmental or improvement program, without providing them with a validated framework with which to meet their personal needs and identify priorities for improvement, necessarily improves school effectiveness (Smith & Hatton, 1992). Likewise, many studies highlight the need to provide a well-researched and theory-based framework to form the basis of the improvement effort (e.g., Bierman et al., 2008; Buczynski & Hansen, 2010; Domitrovich et al., 2008; Tutton & Wigg, 1990; Yoon, Garet, Birman, & Jacobson, 2007).
Many researchers (e.g. Creemers & Kyriakides, 2006; Robertson & Sammons, 1997; Teddlie & Reynolds, 2000) argue that an important constraint on the existing approaches of modelling and evaluating educational effectiveness is that the whole process may not contribute significantly to the improvement of education. Success here will usually depend on the extent to which school stakeholders appropriately utilise research findings and empirical knowledge. This is especially relevant to Australia, because, according to Gurr (2007), Australian accountability systems are lacking in their use of sophisticated evaluation measures and value-added analyses.
Suggestions for further studies could be drawn from the findings. In relation to the methodology used, the sampling methodology used in the LEAD Surveys could be expanded to facilitate further multilevel modelling analyses of the data. For example, the LEAD surveys tend to measure the same variables during the same period each year (Term 3), but there are variations from school to school. Multilevel analysis could be employed to model individual school growth patterns, for example, because of its flexibility and ability to deal with unbalanced data. Multilevel analysis does not require the same number of measurements for each case and can easily accommodate data with incomplete records. Further studies could also expand the research framework to identify links between the latent structures of the surveys and other factors such as school improvement over time; school and student socio-economic status; student achievement as well as other variables. Moreover, future studies could utilise a mixed methods approach, such as a qualitative / ethnographic research design to identify not only the ways through which schools make use of the provided information and analyses towards improvement, but also to identify barriers and constraints that schools may face in their efforts towards improvement.
Taking into consideration the basic characteristics of the surveys, the breadth of data gathered from parents, staff and students; the combined use of objective data (such as student tests and financial data); subjective data (i.e., stakeholders’ perceptions); and the longitudinal nature of the measurements, these analyses could have important implications for understanding the relationship between school stakeholders’ perceptions and school effectiveness as well as the day-to-day planning and policy development in individual schools or across systems . For the data gathered through the LEAD suite of surveys framework to continue to be valid and reliable, it is essential that the implementation and monitoring processes are of a high quality, transparent and genuinely open to discussion. Schools that are making a difference, understand the strengths of a professional learning community approach and realise that teachers and all school stakeholders must work collaboratively, draw on research and theory and reflect analytically on the outcomes of initiatives adopted if sustainable improvement is to be achieved.
Footnotes
Declaration of conflicting interests
The author(s) declared no potential conflicts of interest with respect to the research, authorship, and/or publication of this article.
Funding
The author(s) disclosed receipt of the following financial support for the research, authorship, and/or publication of this article: This study has been funded by the Independent Schools Victoria, as part of the project entitled “School Self-Evaluation: Extending the Methodology and Analysis of the LEAD longitudinal surveys”.