
Abstract
This paper presents a novel application of a discrete choice experiment that seeks to contribute to a more accurate understanding of international education flows. The discrete choice experiment method is employed to identify the key factors underlying students’ international education choices. The specific focus in the study is on China as the largest origin country of international students in the growing global education market. Data are collected from a sample of prospective Chinese outbound students. The findings suggest that university ranking and destination safety are key decision drivers for Chinese students. The results have policy implications for Australia, as one of the key higher education destination countries, for instance, in relation to recently changed student visa systems and the potential effects of planned government budget cuts to higher education on educational quality and reputation.
Keywords
Introduction
Cross-border movement of people for education purposes is one aspect of contemporary globalisation, and the numbers of international students has risen strongly over the last 10 to 15 years. For instance, a 60% increase was reported for the US, from 514,723 in 1999/1900 to 819,644 in 2012/2013 (Institute of International Education, 2014) while the increase in Australia was 180% (from 188,277 in 2000 to 526,932 in 2013) (Australian Department of Education and Training, 2014). In the context of those international education flows, China has become the top country of origin of international students. In 2012/2013, the 235,597 Chinese outbound students constituted nearly 29% of the global total of international students. The number of international students from the second-ranked country of origin, India, was less than half that of China’s.
International education has become an important export sector for Australia. In 2012, international education was the fourth largest Australian industry in terms of export revenue after iron, coal and gold (Department of Foreign Affairs and Trade, 2014). Yet, Australian export proceeds from international education have decreased in recent years. For instance, while total export revenue from international students was A$17.6 billion in 2009, it dropped to A$15 billion in 2012 (Australian Department of Education and Training, 2014). In the context of the exceedingly challenging internationally competitive environment, the Australian government commissioned the so-called Knight review to investigate how visa-related aspects might assist the international education sector (Knight, 2011). The ensuing recommendations were implemented as government policy in 2011. This included improved student visa approval systems, newly introduced post-study work visa options and changes to English language requirements. The new streamlined student visa process system significantly shortened the student visa processing time, and the post-study work visa – also referred to as the temporary graduate visa – offered international students the opportunity to gain work experience in Australia upon completion of a higher education degree.
Within the international education market in Australia, comprising the higher, vocational, secondary and primary education sectors, the higher education sector is the largest in terms of export earnings; it generated approximately 65% of the total of A$15 billion in international education export revenue in 2012 (Australian Department of Education and Training, 2014). As is the case globally, China is the largest origin country in terms of higher education for Australia. In 2012, the number of Chinese students was 94,309 or 41% of the 230,923 international students in the higher education sector (Australian Department of Education and Training, 2014). This clearly establishes China as a key source country for Australia’s higher education sector.
Australia is a relatively important higher education destination country for Chinese students. Figure 1 shows that Australia is the third largest destination with 12.5% outbound Chinese students in 2011, behind the US (24.7%) and Japan (13.1%).
Top higher education destination countries for Chinese students, 2011.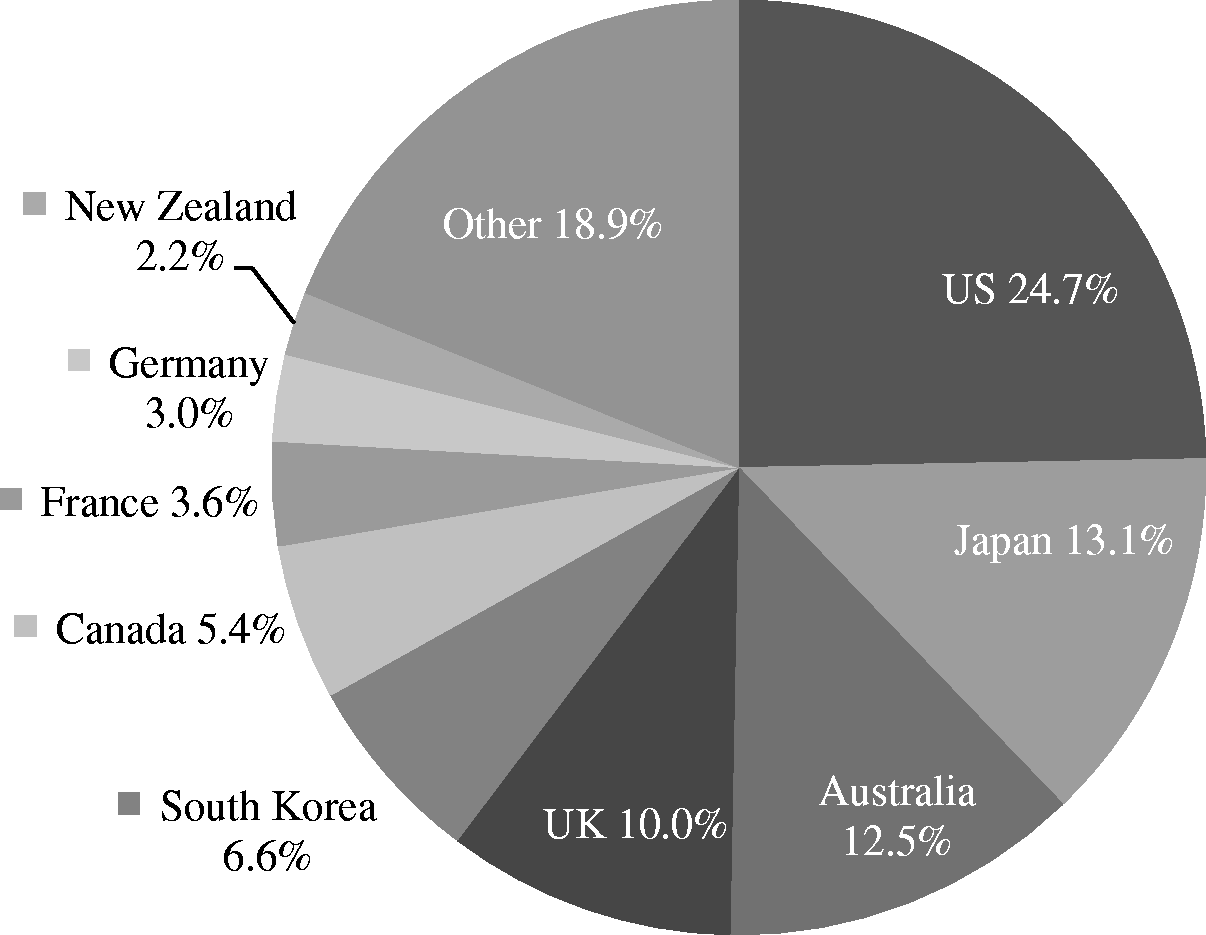
While improvements in student visa-related aspects may have a positive effect on Chinese demand for higher education in Australia, they alone cannot be expected to reverse the recent downturn in Australia’s international education market (Knight, 2011). Other factors also influence international students’ study destination decisions, some of which are affected by government policy. For instance, funding cuts to the education sector, due to budgetary concerns, may have an effect on the perceived quality of education and, hence, on the attractiveness of the country as a higher education study destination. Other factors, such as the level of, and expected changes in, the exchange rate may also play a role in the decision-making process underlying international study destination choices.
This paper introduces a novel application of the discrete choice experiment (DCE) method that seeks to contribute to a more accurate understanding of international education choices.
In the next section of this article, an overview is presented of prior research relevant to international higher education flows. This is followed by an outline of the DCE approach and details regarding survey design and data collection. As the next step, results of the study and government policy implications are discussed. The article concludes by acknowledging the study’s limitations and offering suggestions for future research.
International higher education destination choice
Parallels between international student flows and international mobility in terms of labour/migration and tourism can be observed. A number of conceptual frameworks discussed in the various strands of the respective literatures are relevant to a study of international education flows. Within the labour flows/migration literature, the concepts of brain drain and brain gain apply at the macro level of analysis (Bergerhoff, Borghans, Seegers, & Van Veen, 2013; De Haas, 2007). Brain drain implies that destination countries benefit from human capital from origin countries, at the expense of development in the origin countries. Brain gain, on the other hand, occurs when, with advanced education and/or skills gained in destination countries, return migrants have a positive effect on origin countries through their potential to promote sustainable development (Özden & Schiff, 2006), to accelerate modernisation and industrialisation (Kearney, 1986; Penninx, 1982) and to influence the education of next generations which is further conducive to sustainable development (Edwards & Ureta, 2003; Yang, 2006). Asian and Pacific countries consider international migration as an effective means to boost their economic development (Fraenkel, 2006; Song, 2003). With a view to higher education student flows, governments of many economically developing countries actively encourage domestic students to go abroad for their studies to accelerate national economic development. As will be discussed later, this includes the Chinese government which has scholarship programmes that fund students to pursue higher education abroad.
Another relevant conceptual framework in the labour/migration literature is that of cost–benefit analysis in relation to migrants’ decision-making (Sjaastad, 1962; Todaro, 1969; Todaro & Maruszko, 1987). In that framework, the gains from migrating are compared with the costs involved. Benefits include a higher income and better future prospects for the migrants themselves and their offspring, while costs include the expenditure in relation to migration application and travel as well as cultural costs such as new labour market adaption. The migration decision depends on the expected net return whereby a net positive benefit leads to a decision to migrate. Perkins and Neumayer (2014) use the cost–benefit framework in the context of a study of student flows between multiple paired education origin and destination countries.
In the tourism literature, the push–pull framework has been developed as a relevant conceptualisation of a tourist’s destination choice (see, for instance, Uysal, Li, & Sirakaya-Turk, 2008). The tourist’s choice resembles a higher education destination choice in the sense that, normally, a tourist returns to their home country at the end of their trip akin to the returning migrant. The initial drive of a tourism decision is a need (Gnoth, 1997). For instance, a need for leisure will result in a holiday, while a need for medical assistance will lead to a medical trip. These needs generate the motivation and further determine the choice process (Moutinho, 1987). In general terms, motivation consists of ‘need’ and ‘press’ factors (Murray, 1938) which are also referred to as ‘push’ and ‘pull’ factors, respectively (Dann, 1977).
Push factors are the internal drivers of a consumer to fulfil certain desires, while pull factors are generated by a consumer’s perceptions of choice alternatives which contain an expectation to satisfy the consumer’s desires. Applied to tourism, push and pull factors are the answers to two questions in a decision-making process: whether to go and where to go (Um & Crompton, 1990). Taking leisure tourism as an example, a tourist first needs to decide whether to travel for a holiday (the push factors) and then, after making that decision, the tourist can start the process of choosing a particular holiday destination (the pull factors). The internal push factors and the perceived pull factors may be affected by the tourist’s socio-economic and demographic characteristics such as age, gender, income, education, family lifecycle and size, race/ethnic group and occupation.
The push–pull framework is particularly relevant to structure an investigation of higher education destination choices at the level of individual students as is the purpose in the current study. This conceptualisation is not inconsistent with the cost–benefit framework. Indeed, push and pull factors both comprise features that can be classified as costs or benefits to the decision maker. In that respect, the push–pull framework may be seen as an alternative categorisation of the various factors involved, namely the considerations behind a desire to pursue foreign studies (i.e. the push factors) and those affecting the choice of a particular foreign study destination (i.e. the pull factors). In terms of the latter, students evaluate the various factors as they apply to a number of potential foreign destinations and decide on the destination that appears most attractive to them. It is this process that a DCE attempts to capture as will be discussed in more detail below.
Various push and pull factors in relation to international education choice have been identified in the literature. Push factors are the internal, domestic factors in the country of origin that drive students’ outward mobility for international higher education. Key push factors include the lack of opportunities for higher education at home, destination country immigration prospects and superior foreign course quality (Agarwal & Winkler, 1985; Bodycott, 2009; Mazzarol & Soutar, 2002; Yang, 2007).
Literature on pull factors regarding international higher education destination choice (chronological order).
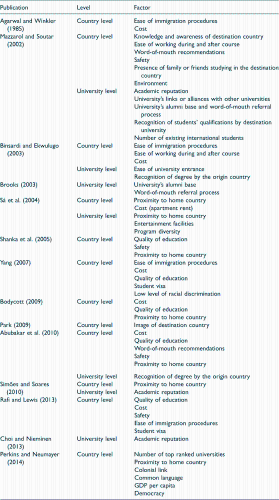
As Table 1 shows, ‘Safety’ is another major pull factor put forward in a number of previous studies. It indicates whether international students feel safe living and studying in the destination country. This factor was measured by the crime rate under the ‘social cost’ category in the study of Mazzarol and Soutar (2002) who found that Asian students took safety seriously in their international destination choices. This is consistent with Shanka, Quintal, and Taylor (2005) who reported that Asian students’ destination choices were affected by safety considerations. In the context of Australia as a destination country, perceived safety (or lack thereof) is found to be an important factor for Indian students, especially after incidents of violence against Indian students in Melbourne (Rafi & Lewis, 2013), and for international students in general (Abubakar, Shanka, & Muuka, 2010).
‘Cost’ is another frequently mentioned pull factor which includes items such as education fees, living costs, travel costs and job opportunities. Agarwal and Winkler (1985) found costs to have a large effect on higher education demand. In their study conducted in the UK, Binsardi and Ekwulugo (2003) pointed out that the best way to attract international students was to lower the tuition fee of UK universities. They also suggested that an alternative way to draw in international students was to offer scholarships. In their study of Indian students, Rafi and Lewis (2013) argued that the recent increase in the exchange rate of Australian dollar has reduced the attractiveness of the Australian higher education sector for Indian students.
A further pull factor identified in a number of studies outlined in Table 1 is the destination country’s proximity which is defined as the distance between the destination and the origin countries (Bodycott, 2009; Simões & Soares, 2010).
Table 1 comprises a number of immigration and visa-related factors. Immigration factors include the possibility of being granted permanent residency in the destination country and the degree of difficulty in obtaining such residency status. They are related to the immigration prospects push factor in the sense that the relative stringency of immigration rules in various countries may determine which international study destination is chosen. ‘Ease of immigration procedure’ was found to be important to international students who chose the UK for their higher education (Binsardi & Ekwulugo, 2003) and was also identified as a determining factor in other studies including Agarwal and Winkler (1985) and Rafi and Lewis (2013). The student visa-related factor pertains to the complexity of obtaining a student visa as well as the duration of the underlying process. The interview results reported by Yang (2007) suggested that an easy and fast visa application process was important to Chinese students. ‘Ease of working after study’ encompasses whether or not international students would be allowed to find work as well as whether work opportunities exist for them after graduation – another important factor identified by Mazzarol and Soutar (2002) as well as Binsardi and Ekwulugo (2003).
It should be noted that the factors summarised in Table 1 were not specifically identified with respect to Chinese students’ international higher education choices. At the same time, it is possible that factors relevant to Chinese students have not yet been identified in the literature. To investigate those issues further, focus groups were conducted in this study which will be addressed later in the article.
Discrete choice experiment
The research methods employed in the studies reported in Table 1 included qualitative and quantitative methods. Qualitative methods, for instance, were used by Brooks (2003) who conducted in-depth interviews to identify the factors influencing students’ destination choice. Quantitative methods included ordinal analysis (Binsardi & Ekwulugo, 2003; Simões & Soares, 2010), Likert-type rating scales (Abubakar et al., 2010; Bodycott, 2009) and the Maximum Difference Scaling (MaxDiff) technique (Yang, 2007) as well as gravity models (Alm & Winters, 2009; Sá, Florax, & Rietveld, 2004) and other regression analyses (Agarwal & Winkler, 1985).
A DCE is closest in approach to the MaxDiff technique. The latter presents survey respondents with various, experimentally designed, sets of decision attributes and elicits respondents’ perceived best/most (or worst/least) attributes which is why the technique is related to the Best–Worst Scaling approach (Finn & Louviere, 1992; Flynn, Louviere, Peters, & Coast, 2007). A DCE (Hensher, Rose, & Greene, 2005; Louviere, Hensher, & Swait, 2000) extends the approach by asking respondents to indicate their choices in the context of hypothetical scenarios. The scenarios are described in terms of relevant attributes – the levels of which differ across a series of choice sets. Modelling the choice data allows the estimation of the trade-offs inherent in respondents’ choices.
A DCE comprises four broad stages, namely the (a) determination of attributes and attribute levels, (b) experimental or survey design, (c) data collection and (d) data modelling. The objective of the first stage of a DCE is to determine the group of attributes that is relevant to the choice under investigation and to establish appropriate levels for those attributes. The approach is conceptually based on Lancaster’s (1966) characteristics theory of consumer choice which postulates that consumers derive utility (i.e. satisfaction) from the underlying characteristics of a good or a service. Accordingly, in a DCE, combinations of attributes and their respective levels represent a choice alternative as put forward to respondents. Determining the key decision attributes is not straightforward. Prior research findings primarily inform the initial selection of attributes. However, in order for the DCE to mimic as much as possible the actual decision situation at hand, further exploration of decision attributes is often necessary and undertaken by way of focus groups (Carlsson, Frykblom, & Liljenstolpe, 2003; Louvière & Timmermans, 1990; Morrison, Bennett, Blamey, & Louviere, 2002).
The attributes and attribute levels selected need to be combined systematically into choice sets for the experiment which is done using an appropriate experimental design. One feature of an experimental design is that of orthogonality which ensures that, across choices sets, attribute levels vary independently from each other which means that the attribute levels are uncorrelated (Hensher et al., 2005).
The next stage comprises the overall design of the survey instrument and collection of the choice data. While the DCE is the core of the survey instrument, other items are often included such as questions on respondent characteristics with a view to generating covariates for the modelling. Once the final survey instrument has been developed – usually after a pilot study of a draft instrument – an appropriate sample is selected, and data are collected.
The final stage of the DCE involves the modelling of the choice data. According to Lancaster’s characteristics approach to consumer choice theory, individuals rank bundles of goods in terms of their characteristics and choose their optimal bundle, i.e. the one that gives them highest utility within their constraints. This is reflected, in the context of choice modelling, in random utility theory. It assumes that every individual is a rational decision maker who chooses the one alternative, from a choice set of available options, that provides the highest utility (Hensher et al., 2005). Choice models differ depending on the assumptions made about the error term in the model specification. A basic member of the choice modelling family is the multinomial logit (MNL) model which requires the alternatives to be independent of irrelevant alternatives (IIA). The IIA property implies that the relevant choice probability of any two alternatives in a choice set is independent of any other alternative in the same choice set (Hausman & McFadden, 1984). While the IIA property is convenient with a view to MNL estimation, the assumption is generally unrealistic (McFadden, 1972). In addition to the IIA property, by estimating aggregate mean attributes parameters for all respondents, the MNL model assumes homogeneity. The random parameter logit (RPL) model, a statistically advanced choice model, adds a random component to the parameter estimation, i.e. RPL allows parameters to vary across sample respondents. In this way, the strict IIA assumption is relaxed, and heterogeneity of preferences can also be tested which makes the RPL model likely to reflect the data better.
DCEs are widely used in fields such as economics, marketing and transportation (Baltas & Doyle, 2001; Crouch & Louviere, 2004; Hess & Polak, 2005; Jones & Hensher, 2004; Pozsgay & Bhat, 2001). Still, the MNL model has been used to study choices of domestic students regarding their higher education destination (Fuller, Manski, & Wise, 1982; Kohn, Mansk, & Mundel, 1976). In that study, cost, characteristics of university and proximity to home, for example, were identified as important factors affecting university choices of domestic students. However, more (advanced) choice models have not yet been used in the context of international higher education destination choices as far as we are aware. Likewise, to our knowledge, the choice experiment approach has not been applied in the context of Chinese students’ destination choices.
Survey design and data collection
We used focus groups to explore the determining factors for Chinese students’ foreign education destination choices and to inform the development of the survey instrument. The objectives of the focus groups were to (a) determine whether the factors identified in the literature applied to Chinese students, (b) investigate whether there are additional relevant factors not identified in the literature and (c) discuss and establish the attributes and their levels to be used in the choice experiment.
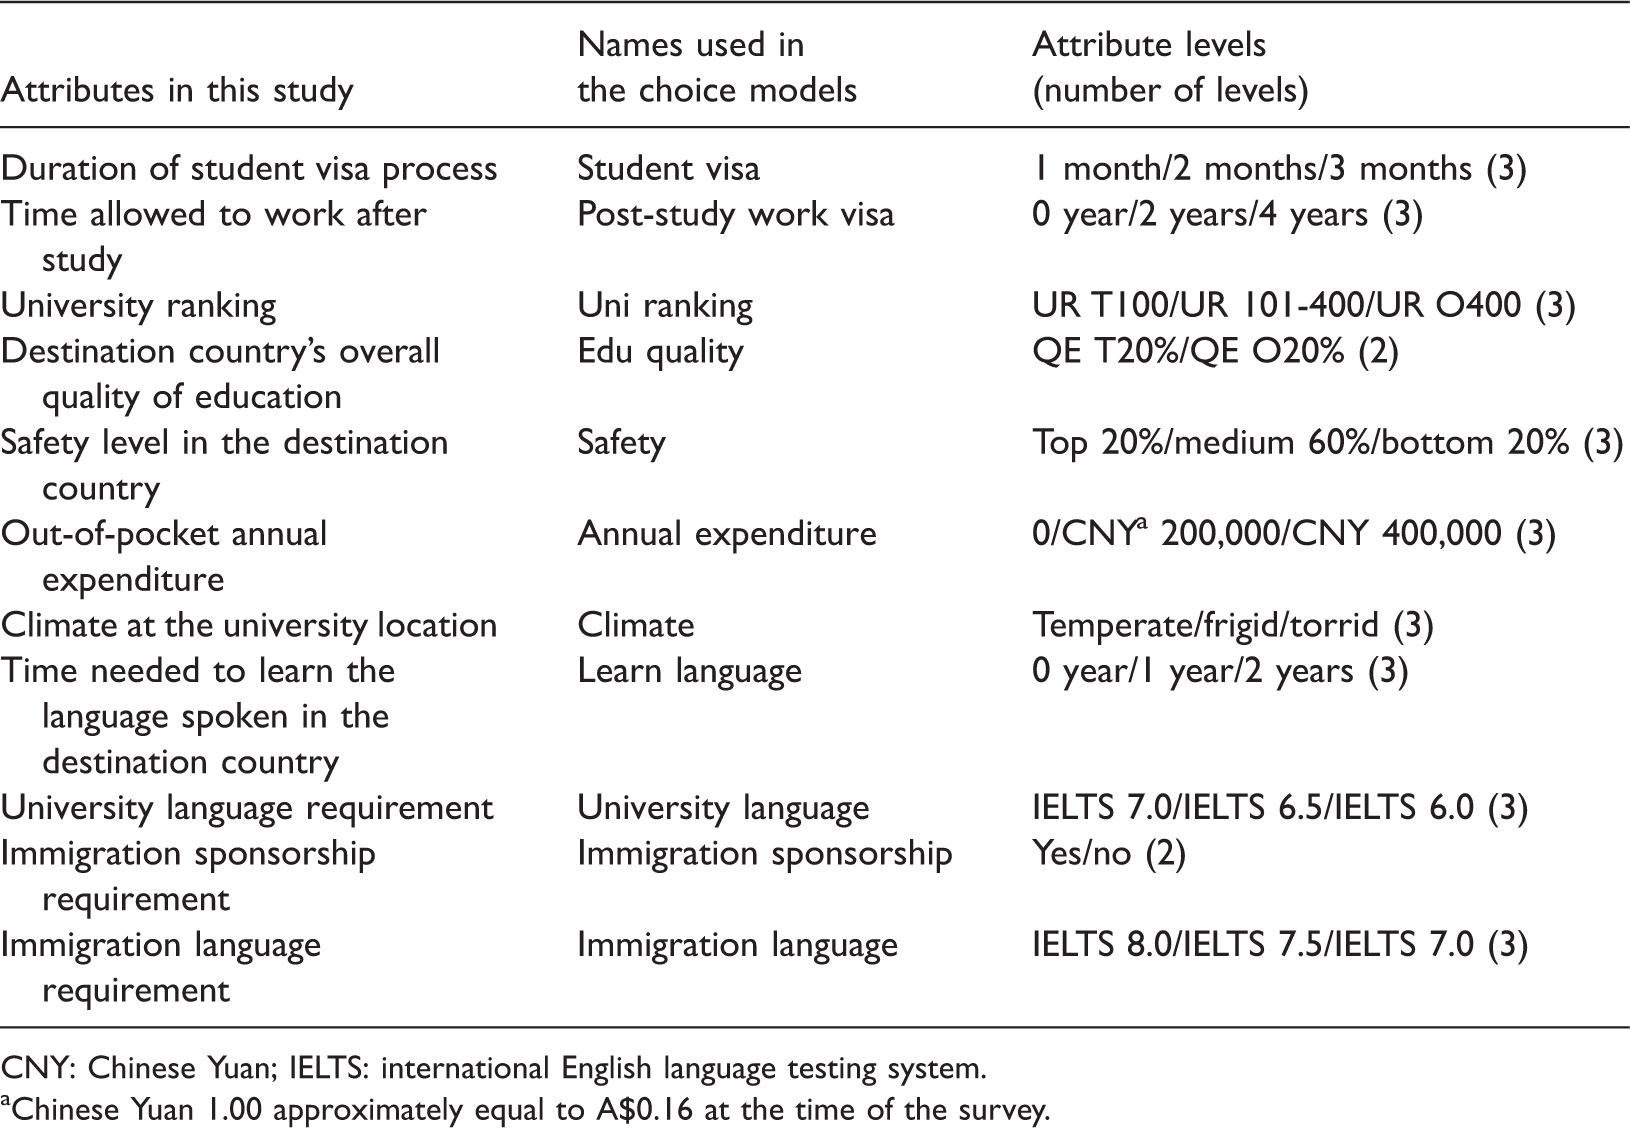
Attributes and levels used in the choice experiment.
CNY: Chinese Yuan; IELTS: international English language testing system.
Chinese Yuan 1.00 approximately equal to A$0.16 at the time of the survey.
Compared with the pull factors derived from the literature, focus group participants suggested that word-of-mouth referral and the destination’s proximity to home country were not really relevant to Chinese students. In contrast, the years needed to learn the language spoken in the destination country was a new attribute which had not yet been mentioned in the literature. As focus group participants explained, using Germany as an example, while university study programs may have been in English, students still had to live in the non-English speaking country which required skills in that country’s language. The other attributes in Table 2 broadly reflect the findings in the literature.
Time duration was used for the attributes regarding ‘Student visa’ and ‘post-study work visa’. The attribute levels of the former were based on focus group participants’ views of relevant durations while the levels of the latter are in line with the Australia’s new graduate visa scheme (Australian Department of Immigration and Citizenship, 2013).
University ranking represents the global academic reputation of the university at the foreign destination. Following suggestions in the focus groups, the levels were established with the top 100 and top 400 as thresholds in the context of the Times university ranking (Times Higher Education, 2011). The educational quality attribute represents the overall quality of education in the destination country. The levels are determined with a view to the Education Index of the Human Development Index (United Nations, 2010). Countries ranked in the top 20% include economically developed western countries such as Australia, Canada, France, Germany, the US and the UK whereas China is ranked outside the top 20%.
The levels of the destination safety attribute reflect the Global Peace Index (Institute for Economics and Peace, 2011) where the safety world top 20% includes countries such as Australia and Germany, while France and the US, for instance, are ranked in the middle 60%.
Annual expenditure is student’s annual expenditure at the study destination which takes into consideration tuition fees, accommodation, food, transportation and any compensation by way of a scholarship. The zero level of the attribute means that the student receives a scholarship which covers all tuition fees and living expenses. The middle level implies that half of total expenses is covered, for instance, by a tuition fee scholarship. The third level indicates that the student self-finances their international study.
The climate at the university location is chosen as the indicator of the environment in the destination country (Mazzarol & Soutar, 2002). The frigid zones are located outside the Arctic Circle and the Antarctic Circle. Torrid zones are located between the Tropical Circles. The rest of the globe falls within the temperate zones.
‘Learn language’ indicates the time needed for a Chinese student to learn the language spoken in the destination country. As mentioned before, this factor has not yet been identified in the literature. Focus group participants suggested setting the levels as zero years, one year and two years. The first level applies because English is a popular foreign language among Chinese students, and there is no perceived need for extra language preparation if they go to an English-speaking country. Japanese, for example, may take Chinese students one year to learn to a fair level while German and French require somewhat more time.
The university language requirement is an important part of the ease of university entrance for international students. Different countries may require different language tests. Following suggestions in the focus groups, the IELTS levels were suggested as the relevant indicators.
The immigration language and sponsorship requirements reflect the ease with which students can migrate to the destination country upon completion of their study. In Australia, an IELTS score of 7.0 or 8.0 is required under the skilled migration scheme for PhD graduates and Master’s graduates, respectively. In addition to such skill-based migration, students are also able to migrate through sponsorship by a relative (Australian Department of Immigration and Citizenship, 2011).
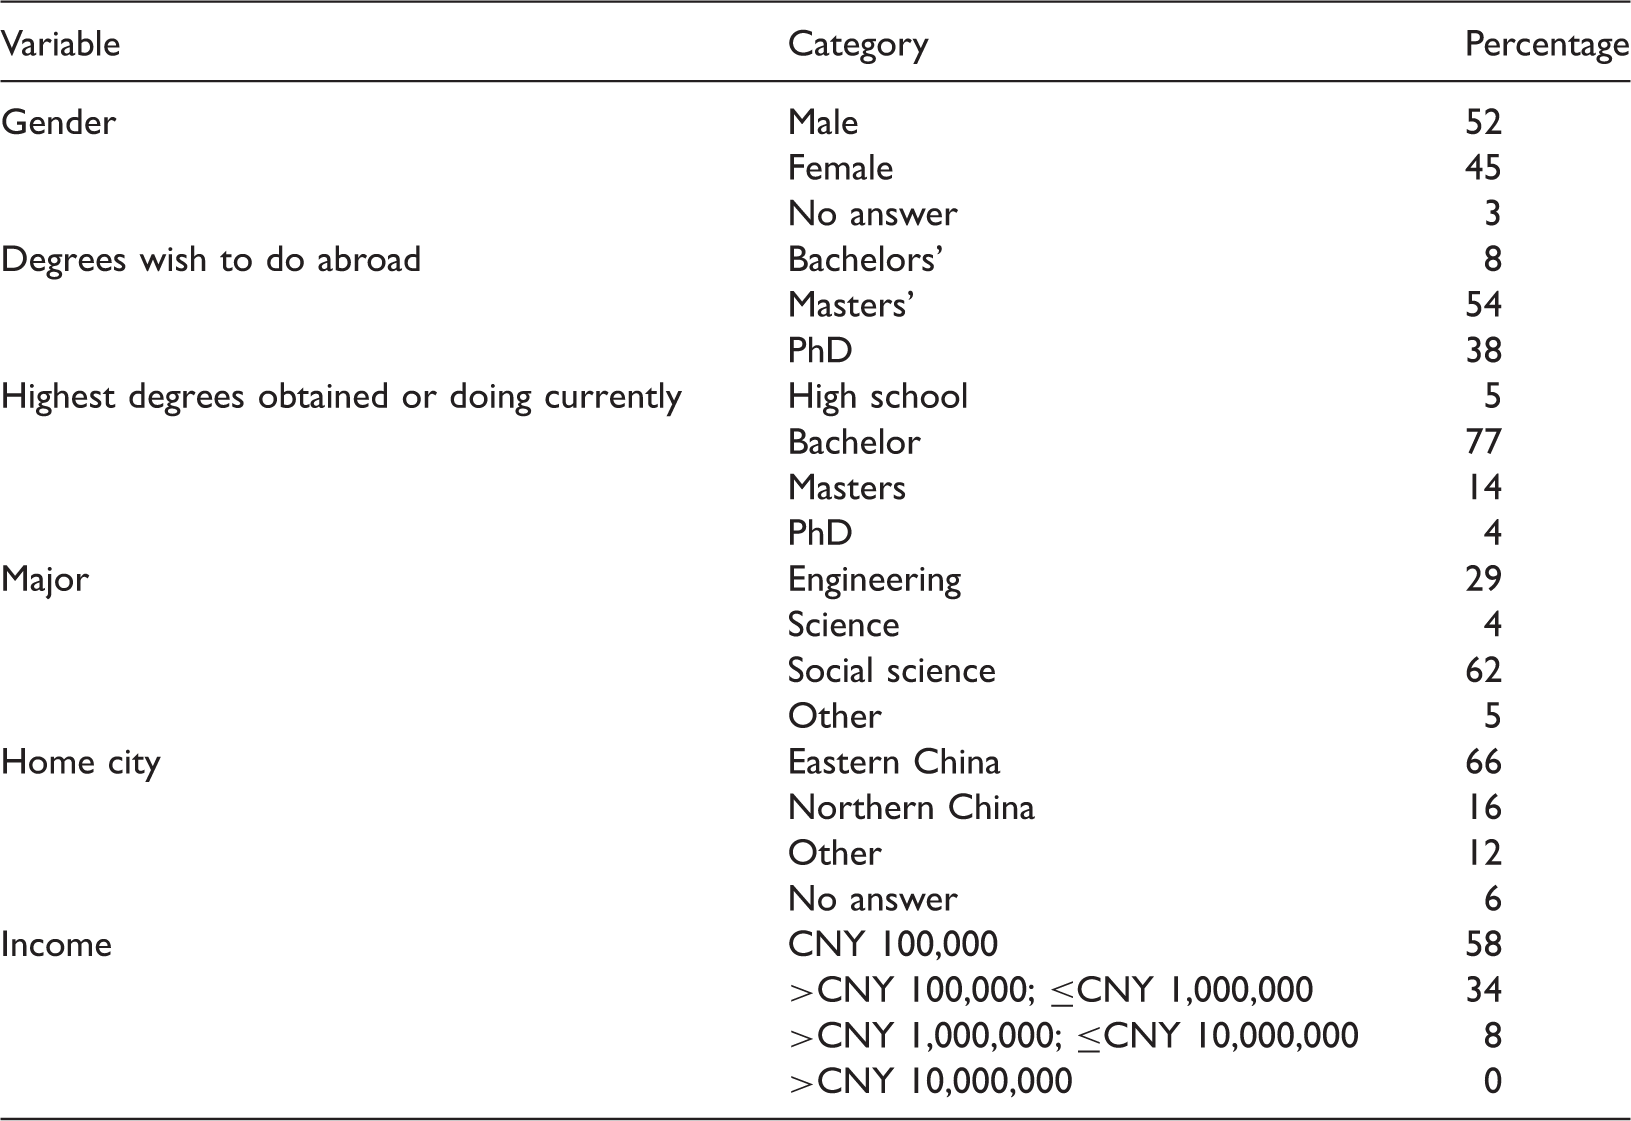
An orthogonal main effects plan (OMEP) to be used in the choice experiment was developed based on the definition of the attributes and attribute levels (in the last column of Table 2). As part of the OMEP, university ranking and educational quality were merged into a combined attribute with six levels. The attribute levels for the second choice alternative in the choice set were determined using the method set out by Street, Burgess, and Louviere (2005). The 36 comparison sets in the OMEP were blocked into four survey versions which generated nine choice sets for each survey respondent. An example of a choice set is in Appendix 1. To explain the choice attributes and their associated levels to study participants, an information sheet was created. Also, questions about survey participants were added regarding gender, current degree, intended degree, hometown and estimated annual family income.
A complete draft survey instrument was assessed in a pilot study of eight Chinese students. In addition to eliciting general feedback on the format and content of the survey, the students were asked to comment on the translation of the instrument into Chinese. After some adjustments, the final survey instrument was obtained (see Appendix 1 for the English version of a choice scenario example). In each choice question, two generic universities were described, and participants were asked to select the university they would choose as their international higher education destination.
The survey was conducted over 18 days in Qingdao and Zibo cities in Shandong Province, China, in 2011. To access students interested in studying abroad, data were collected during five information sessions for prospective international students at three universities and one IELTS training institute. The student attendees at these sessions came from various Chinese provinces. At the end of the sessions, the attendees were asked to complete the questionnaires. A total of 459 questionnaires were handed out, and 308 completed questionnaires were received which represents a 67% response rate. The reasons for the non-returned questionnaires could not be established and, hence, neither could the potential for any systematic non-response bias. However, the non-response rate was approximately even across the data collection locations.
Socio-demographic attribute, attribute levels and descriptive statistics.
Results
We modelled the choice data using both MNL and RPL approaches and considered various model specifications. In relation to the latter, we explored the interactions of socio-demographic student characteristics and choice attributes in the choice models. We found few significant coefficients and overall model comparisons showed that the models with interactions were inferior to those without interactions. Hence, we dropped the interactions from the model specifications.
Estimation results of discrete choice models. a
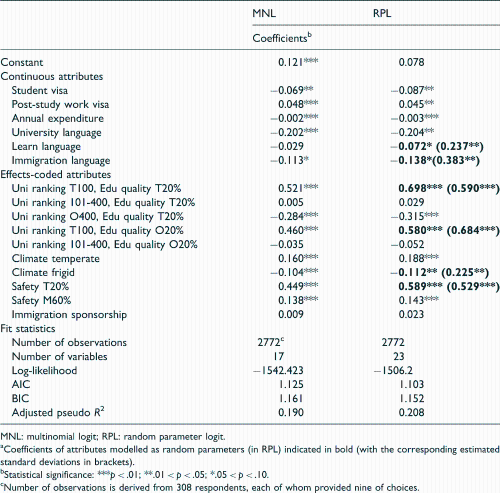
MNL: multinomial logit; RPL: random parameter logit.
Coefficients of attributes modelled as random parameters (in RPL) indicated in bold (with the corresponding estimated standard deviations in brackets).
Statistical significance: ***p < .01; **.01 < p < .05; *.05 < p < .10.
Number of observations is derived from 308 respondents, each of whom provided nine of choices.
The attributes in Table 4 are grouped into continuous and effects-coded attributes. Effects coding of attributes allows for non-linear contrasts between attribute levels (Hensher et al., 2005). For the effects-coded attributes, the (arbitrary) base level is the negative sum of all other levels estimated levels shown in Table 4. The random parameters estimated in the RPL model are indicated in bold in Table 4.
Overall, the coefficients for most attribute levels are broadly similar in the MNL and RPL models. One notable difference is that the constant in the RPL model is not significant which suggests that the inclusion of random components has dealt with some of the information captured by the constant in the MNL model. Because of the better fit of the RPL model, established above, we concentrate on the attribute parameter estimates in the RPL model in the remainder of the article.
Nearly all RPL attribute level effects are highly statistically significant with the exception of the middle university ranking levels (101–400) and the immigration sponsorship attribute which are not significant. To facilitate the interpretation of the signs and magnitudes of the RPL attribute effects in Table 4, they are visualised in Figure 2. Figure 2(a) to (f) shows the continuous attributes, and Figure 2(g) to (i) pertains to the effects-coded attributes. The horizontal axis represents the attribute levels. The vertical axis shows the marginal utility (or part-worth utility) of an attribute level, i.e. it is the amount of utility the attribute level adds to (or subtracts from) overall utility. The higher the marginal utility, the greater the effect of the corresponding attribute level on the probability of choice.
Attribute level effects (RPL model). (a) Student visa, (b) Post-study work visa, (c) Annual expenditure, (d) University language, (e) Learn language, (f) Immigration language.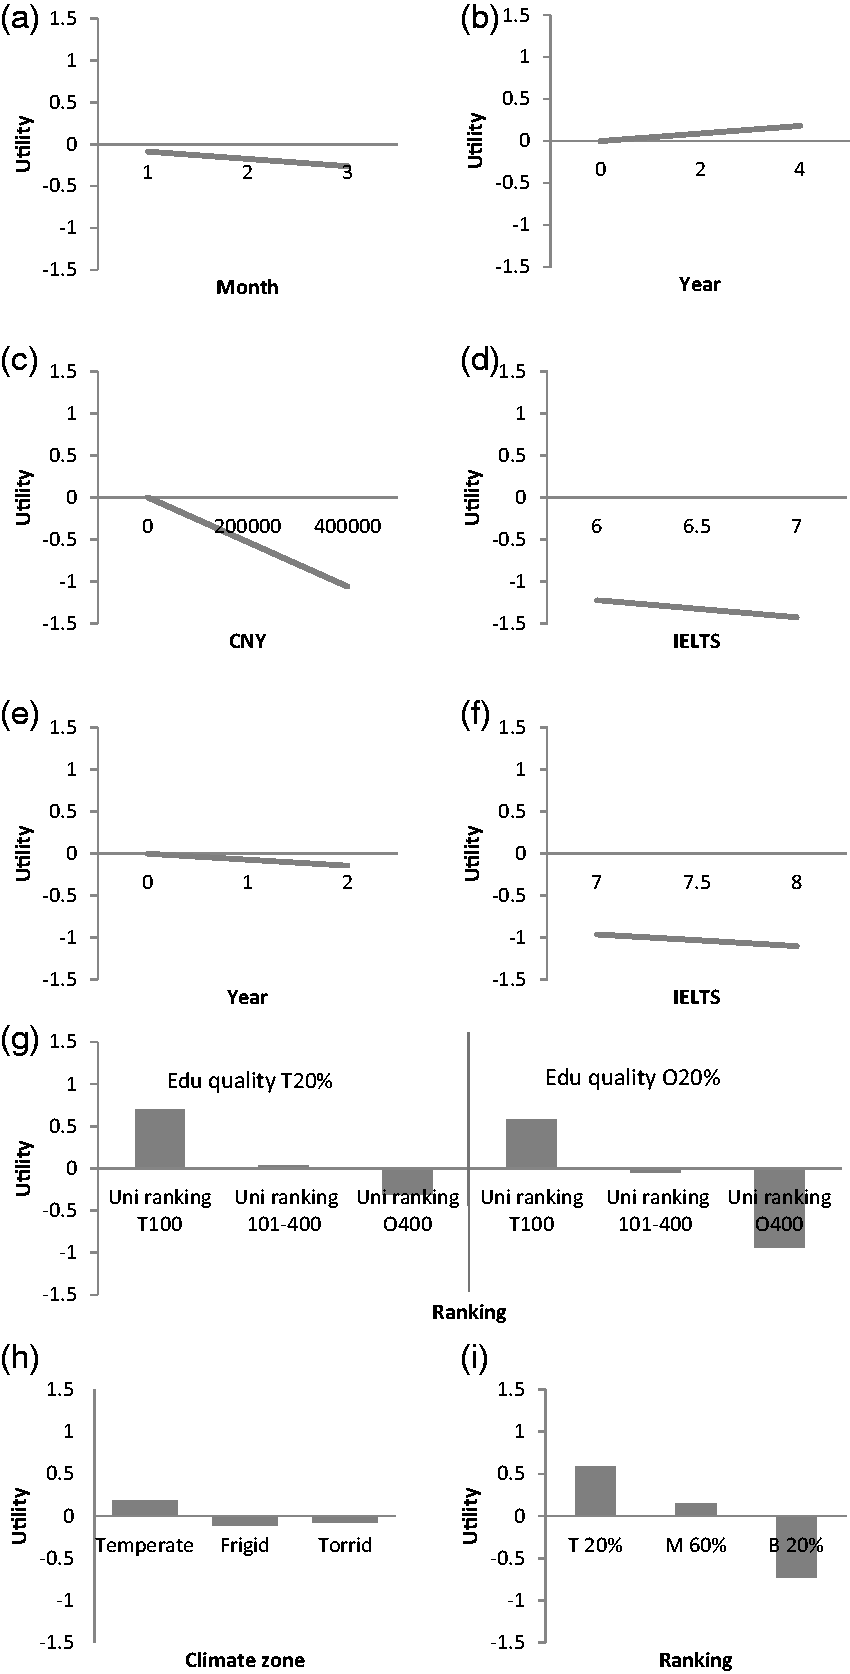
For the continuous attributes, the slope of the line is equal to the coefficient of the attribute. A steeper slope indicates that Chinese students are more sensitive to the change of levels in that attribute keeping in mind that this is relative to the attribute scale used (the horizontal axis). For instance, while the slope of the line for the annual expenditure’ attribute in Figure 2(c) appears relatively steep, the scale for this attribute (the range of expenditure levels) is quite wide which would be expected to produce a sharper effect. For the effects-coded attributes, the height of the column in the diagrams represents the marginal utility for each attribute level.
The parameters have the expected signs. For instance, the likelihood of choosing a university is lower with a longer duration of the student visa process (Figure 2(a); RPL coeff = −0.087) or with shorter post-study work opportunities (Figure 2(b); RPL coeff = 0.045). This likelihood also falls when Chinese students face higher annual expenditure for their studies and their overall stay in the foreign country (Figure 2(c); RPL coeff = −0.003). Similarly, the probability of choice reduces when language requirements are tougher at university level (Figure 2(d); RPL coeff = −0.204) and country level (Figure 2(f); RPL coeff = −0.138) when it takes longer to learn the language of the destination country (Figure 2(e); RPL coeff = −0.072). The part-worth utilities for the combined effects-coded attribute ‘University ranking & Educational quality’ (in Figure 2(g)) show that university ranking affects the likelihood of choice. In particular, attractiveness is enhanced if a university is ranked among the Top 100 (RPL coeff = 0.698 for Edu quality of T20% and 0.580 for Edu quality of O20%) and reduced if it is ranked outside the Top 400 (RPL coeff = 0.580 for Edu quality of T20% and −0.940 for Edu quality of O20%) while the attractiveness is not affected by a middle university ranking of between 101 and 400. 1 A similar pattern is apparent in relation to the marginal utilities for safety (Figure 2(i)) except that, in this case, the middle level has a significant positive effect (RPL coeff = 0.143). Finally, the effects of the climate at the university’s location are relatively small (RPL coeff = 0.188 for temperate climate and −0.112 for frigid climate, see Table 4 and Figure 2(h)).
Although the parameter estimates in Table 4 and the associated visualisation in Figure 2 provide insights into the effects of the various attributes and levels, assessing the relative importance of the attributes is not straightforward. For that purpose, the concept of willingness to pay (WTP) – a particular trade-off (or marginal rate of substitution) between attributes – is useful as it is based on a monetary attribute as the numeraire. WTP, also referred to as the implicit price, is the amount of money an individual is prepared to pay for a certain improvement of an attribute (Hensher et al., 2005). It is calculated as the ratio of the marginal utility of an attribute level to the marginal utility of a cost attribute (Louviere & Islam, 2008). WTPs are free from variance scales in choice model parameters which means that they can be compared between any two attribute levels across models and samples (Carlsson et al., 2003; Louviere & Islam, 2008).
Willingness to pay values for changes in attribute levels (in 1000 CNY).
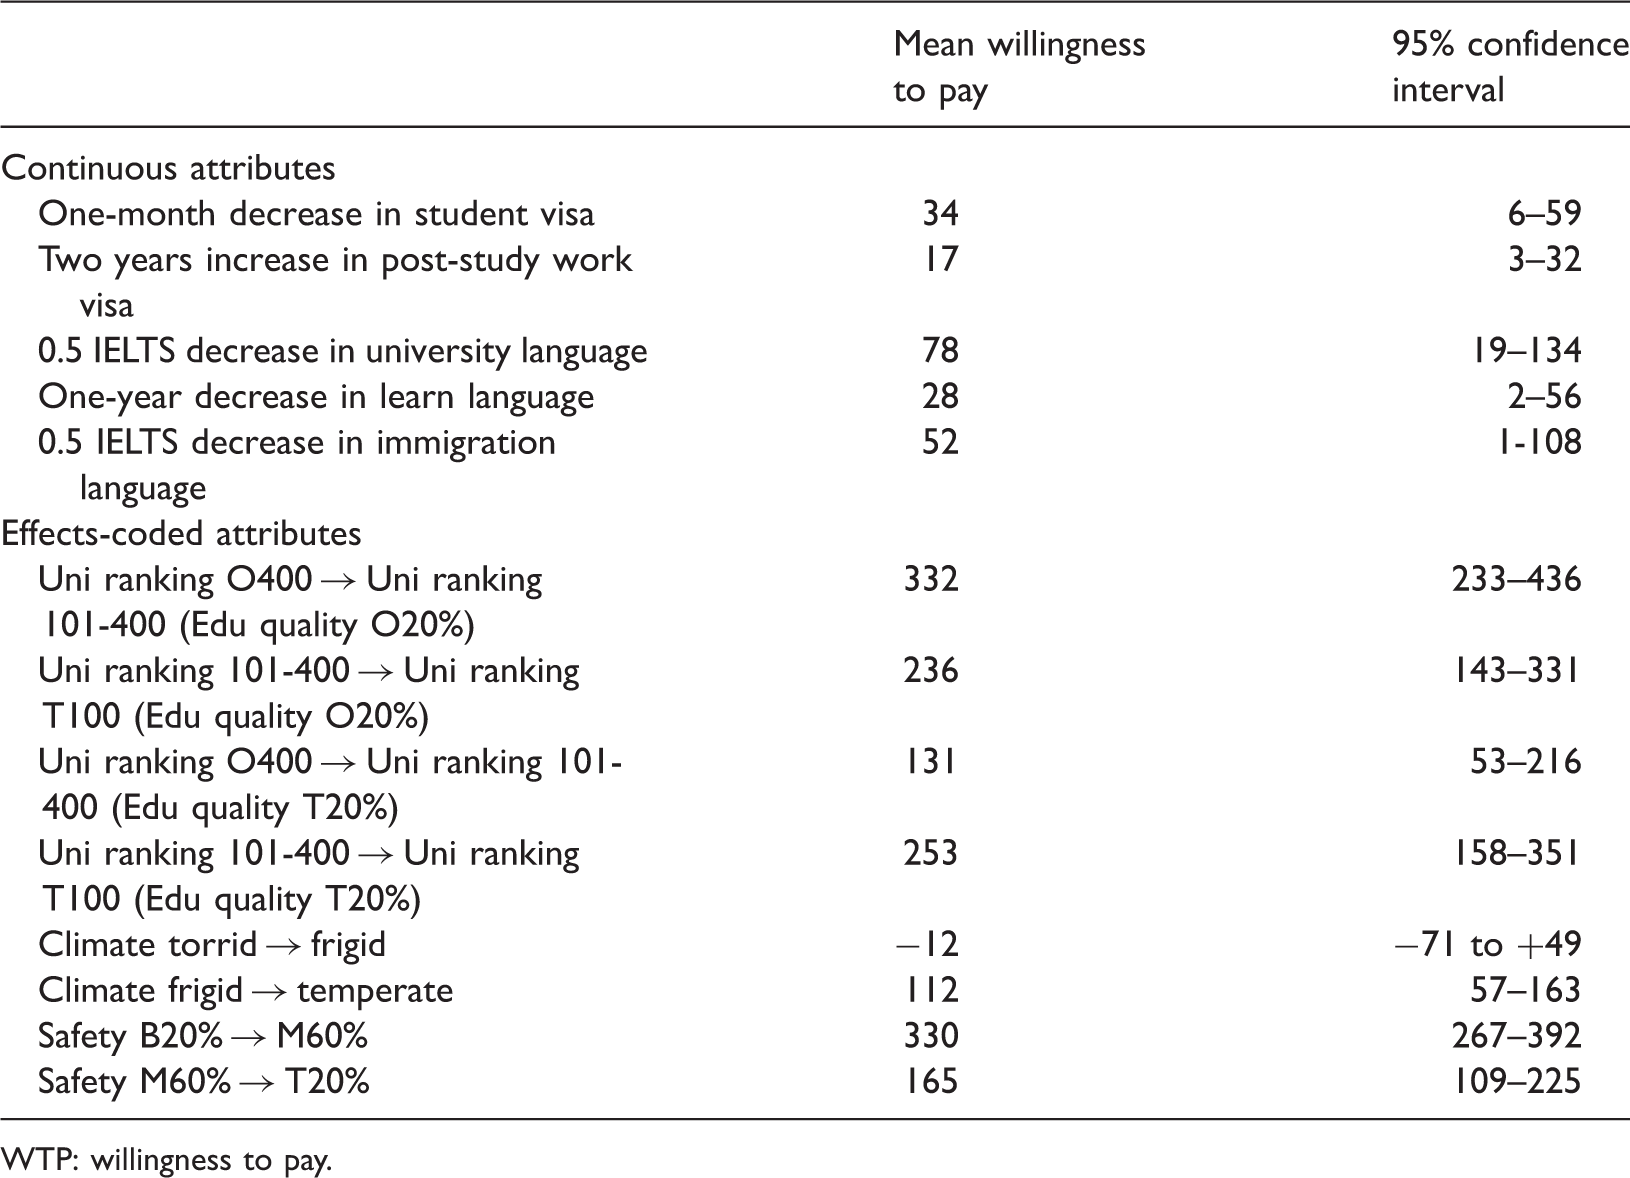
WTP: willingness to pay.
A positive WTP value indicates the value that Chinese students associate with the change in an attribute level. Conversely, a negative WTP reflects the negative value attached to an attribute change. For example, Chinese students value a 0.5 point fall in a university IELTS requirement at CNY 78,000 on average. The upper and lower bounds of the confidence intervals have the same signs within nearly all groups of attribute levels with the exception of the difference between torrid and frigid climates.
Irrespective of absolute levels, relative WTP values lend themselves to establishing substitution rates across attributes. For instance, Chinese students value a one-month decrease in student visa processing time (34,000 CYN) equally to an increase to four years in a post-study work visa (two times 17,000 CYN for a two-year increase) and about the same as a year’s decrease in the time needed to learn the language spoken in the destination country (28,000 CNY). Also, Chinese students value a 0.5 IELTS decrease in university language requirement (78,000 CNY) more than the same change in the immigration language requirement (52,000 CNY). This suggests that immediate concerns about university entrance are perceived to be more important than potential immigration issues in the future. As indicated by the larger WTP values for the changes in attribute levels of university ranking/quality of education and safety, these attributes are more important than others in the decision making process of Chinese students’ higher education destination choice.
Discussion
Results of the study have shown destination country safety to be an important choice determinant in line with findings in the studies of Abubakar et al. (2010), Mazzarol and Soutar (2002) and Shanka et al. (2005). Notably, Chinese students are not necessarily limiting themselves to countries whose safety is top ranked globally. However, Chinese students are unlikely to choose a country with a very low safety ranking. This suggests that it is important for a country that wants to attract Chinese students to maintain and/or enhance its perceived level of safety and to promote itself as much as possible as a safe place for Chinese students to study.
Another major factor in the decision-making process is the university ranking combined with the destination country’s general standard of education. Results presented in this article suggest that Chinese students assign a relatively larger value to higher levels of university ranking than to other factors. The estimation results of this attribute are in line with other studies that have found a preference of international students for universities with good academic reputations (Park, 2009; Simões & Soares, 2010), particularly of elite East Asian students (Choi & Nieminen, 2013). Although Perkins and Neumayer (2014) found that university quality of destination countries, measured as the number of universities ranked in the Top 200, was not important for students from some economically developing countries, they reported a significant effect for students from newly industrialising economies which include China. In the context of the release of the 2014 Times Higher Education rankings, funding cuts to Australia’s higher education sector were linked to a negative effect on university ranking (Belot, 2014). Given Chinese students’ focus on the Times Higher Education rankings amongst the various alternative ranking organisations, as established in the focus groups for this study, this may discourage Chinese students from pursuing higher education in Australia.
The choice model indicates a relatively large effect of students’ out-of-pocket expenditure on study destination choice which would suggest an effect of a change in the exchange rate. For instance, the recent depreciation of the Australian dollar may help attract foreign student into the international higher education sector. However, the range of annual expenditure used in this study is relatively wide. It is unlikely that exchange rate induced expenditure changes would be sufficiently large to result in major increases in Chinese student numbers. On the other hand, the provision of scholarships for university fees and living expenses may help reduce student expenditure substantially which may well have a major positive effect on demand from Chinese students. This result is consistent with findings reported by Binsardi and Ekwulugo (2003), who found that charging a lower cost or offering scholarships made universities more attractive to international students. In that respect, it is noteworthy that the Chinese government provides scholarships for high-achieving domestic students to pursue Masters and PhD degrees abroad through the China Scholarship Council (CSC). As an indication of the level of financial support, each CSC student enrolled at an Australian university receives a scholarship worth around A$20,000 per year to cover all expenses, including university fees and living expenses (China Scholarship Council, 2012). Hence, with a view to policy implications, building connections with the CSC in order to increase the number of available scholarships could be an alternative to increasing Australian country level or university level scholarships.
Estimation results of the newly identified attribute in the focus group component of the current study, namely years needed to learn the language spoken in the destination country, suggest that Chinese students are less attracted to a foreign education destination when the number of years needed to learn the language of the destination country increases. English language is a compulsory course from the third grade in public schools in China (Ministry of Education of the People’s Republic of China, 2001). This would suggest, contrary to the finding in Perkins and Neumayer (2014), that English speaking countries have an advantage over non-English speaking countries as competing higher education destinations for Chinese outbound students. As shown in Figure 1, five of the top nine higher education destination countries for Chinese students are English speaking and attract around 60% of Chinese students. The language proficiency factor may be one of the reasons for Australia having a relatively large share of Chinese students relative to its population size.
Overall, in the model tested in this study, the aspect of immigration sponsorship is the only attribute that is found not to have a significant effect on study destination choice. In addition, results reported in this study indicate positive effects of a reduction in (a) student visa processing time, (b) an increase in the post-study visa duration and (c) a fall in immigration language requirements. However, these effects are relatively small compared with other factors affecting Chinese students’ choice of foreign study destinations such as university ranking and safety in the destination country. Hence, while the recently implemented streamlined visa process and the post-study work visa policies in Australia may have some effect on attracting Chinese students, the statement in the Knight review (Knight, 2011) that ‘Australia’s student visa program cannot solve all of the problems facing the international education sector’ is supported by the study findings.
Limitations and future research
The results of the DCE approach adopted in this study are encouraging with a view to further research in the area of international education destination choice. Naturally, there are limitations to the findings reported here. Thus, for example, the focus group participants were recruited in Australia instead of China where the survey was conducted. This may have influenced the design and therefore the findings of the choice experiment. It also has to be kept in mind that although survey respondents came from different provinces in China, the sample may not be entirely representative of all Chinese outbound students. Therefore, future studies with larger samples of students with different geographical and other characteristics would be needed to corroborate our findings. Similarly, a further avenue of future research is the application of the DCE approach to higher education origin countries other than China to assess possible differences between origin countries, for instance, along the lines of the country categories in Perkins and Neumayer (2014). Finally, with a view to the DCE method, future research can be directed towards the use of labelled higher education destination options in the choice experiment instead of the generic approach adopted here.
Conclusion
International education choice is a complex issue which involves multiple determining factors. In the context of the push–pull conceptual framework, this study has sought to identify the contribution of various pull factors to the international higher education destination choices of Chinese students. For that purpose, we have used the novel application of a DCE to international education destination choice.
Results reported in this article suggest three major factors influencing the education destination choices of Chinese students, namely the safety conditions in the destination country, the global university rankings of the destination university combined with the overall education quality of the destination country, and students’ expected annual expenditure. Other factors affecting the education destination choices of Chinese students include the newly identified attribute in this study, namely the years needed to learn the language spoken in the destination country.
These results should also be of interest to policy makers. Efforts to increase the attractiveness of a destination country for higher education often seem to revolve around the ease and speed of obtaining a student visa and the duration of stay of post-study work visas. While these are shown in the current study to be important factors, our findings also point to the fact that visa policies would appear somewhat less relevant than other factors. The general level of safety in a country, for example, can have an even greater impact on students’ choices.
Footnotes
Acknowledgements
The authors are grateful to two anonymous reviewers for their valuable comments.
Declaration of conflicting interests
None declared.
Funding
This research received no specific grant from any funding agency in the public, commercial, or not-for-profit sectors.