
Abstract
Objective:
Occupational surveys of doctors consistently show higher rates of depression and anxiety than reported in general population surveys, findings replicated in all other occupational groups, suggesting potential selection bias. We evaluated the comparative mental health of different occupations in Australia from the same sampling frame over the past 6 years and assessed whether COVID-19 differentially affected different occupational groups.
Methods:
We analysed six annual data waves (2015–2020) from the nationally representative ‘Household, Income, and Labour Dynamics in Australia’ study. Mental health (Mental Health Inventory–5 from the 36-Item Short Form Survey) and life satisfaction scores of doctors over this period were compared with five other professions and all other employees. Regression models were adjusted for age, gender, income and work hours. Two-way analysis of variance examined the comparative changes in mental health among occupations between 2019 and after exposure to the COVID-19 pandemic in late 2020.
Results:
The sample of 15,174 employed respondents included 106 doctors. The 5-year mean mental health score for doctors (M = 78.7; SD = 13.1) was significantly higher than that for teachers (M = 75.6; SD = 14.9), nurses and midwives (M = 76.6; SD = 15.9), lawyers (M = 74.2; SD = 16.1), accountants (M = 74.2; SD = 16.5) and all other employed respondents (M = 73.1, SD = 16.7) (p < 0.001). Cognitive wellbeing comparisons were similar. There were no significant changes in professionals’ mental health over this period except for an improvement in engineers and a decline for teachers. From 2019 to 2020, all occupations suffered mental health declines without any significant inter-occupational differences.
Conclusion:
Australian doctors identified from a population-based sample rather than occupational surveys reported better levels of mental health and greater life satisfaction than most professions prior to COVID-19 without experiencing the worsening seen in the general employed population over the past 5 years. From 2020, there was a mental health decline in all of the employed population, not disproportionately affecting doctors. Although over-representing Australian trained general practitioners, the results from both this sample and other tentative findings challenge the discourse in medical advocacy, but need more formal comparative studies to confirm.
Introduction
There is growing concern about the mental health and wellbeing of doctors both worldwide and in Australia. Prioritising the mental health of doctors (and other healthcare workers) has been identified as an urgent global public health priority with concern about numerous work-related risk factors such as heavy workloads, long shifts, moral conflicts, perceived job security and workplace-related bullying (Sovold et al., 2021). Moreover, there have been recent high-profile suicide clusters of Australian junior physicians, with escalating concern among the medical profession (McCormack, 2018). The COVID-19 crisis has placed additional work-related stress and pressure on doctors internationally, with 42% of 6559 UK doctors reporting that their mental health in 2020 was worse than before the pandemic (and 21% reporting it was better) (Rimmer, 2020). Despite increasing interest and research efforts into physician mental health, uncertainty has remained regarding the actual levels of physician wellbeing in Australia (Harvey et al., 2021) and how this compares to pre-pandemic levels, due to surveys using retrospective recall of mental health, low or unknown response rates and/or samples of doctors already in distress (Adams et al., 2021).
A meta-analysis of 54 studies undertaken prior to COVID-19 involving 17,560 physicians in training demonstrated that between 20.9% and 43.2% of trainees (pooled estimate 28.8%) were considered to likely have case levels of depression during residency (Mata et al., 2015). In Australia, a survey of over 12,000 physicians in any career stage showed that an incredibly similar 27.2% (95% confidence interval [CI] = [26.4, 28.1]) reported symptoms of depression and anxiety above a predefined cut-off score that indicated a high likelihood of a minor psychiatric disorder, using the General Health Questionnaire–28 (GHQ-28) (Beyond Blue, 2013). These prevalence rates derived from occupational surveys have been compared to population prevalence rates derived from vastly different, nationally representative population-based surveys (where the prevalence rates are generally 30–50% lower) to conclude that doctors have poorer mental health than the general adult population (Dyrbye et al., 2014; Elliott et al., 2010; Shanafelt et al., 2012).
There are at least three reasons to treat the reported high point prevalence of mental ill-health in doctors sceptically: when making comparisons with the general population, and when subsequently drawing conclusions on the relative mental health of doctors. First, it is well-established that poor (Morris et al., 2021), unemployed (Australian Government Department of Health and Ageing, 2013) and disabled Australians (Australian Institute of Health and Welfare [AIHW], 2020) have higher rates of mental illness than employed people, so a priori it would be unusual that population-based samples with a high proportion of such people have lower rates of mental ill-health than a well-educated, well-paid workforce. Second, nearly every single-occupation study in many different professions reports higher estimates of depression and anxiety than population surveys in the same countries, so this is not a methodological problem unique to doctors’ surveys (Goodwin et al., 2013). This discrepancy is likely explained by sampling bias in single-occupation studies: self-selection of participants with higher symptoms during recruitment to studies of stress in that profession, which results in a response bias (Harvey et al., 2021). Even large supposedly ‘representative’ samples can over-represent mentally unhealthy respondents by 2.5 times, due to self-selection and/or financial incentives to participate in commercial surveys (Chauvenet et al., 2020). Third, the prevalence of mental ill-health in the general population has been increasing over the past few years, making comparisons between specific groups in different years difficult. For example, Beyond Blue (2013) compared the mental health of doctors in 2013 with the Australian general population in 2007, without adjusting for temporal changes in the base rate over the 6-year period. Similarly, reports of a 0.5% increase year-on-year in the prevalence of depression in resident doctors in the past three decades (Mata et al., 2015) may reflect changes in the wider population rather than as a specific effect in doctors.
The best way to address these sampling, response and temporal issues is to use multiple waves of a population-based survey large enough to include substantial sub-samples of different occupational groups that does not frame itself as a stress or mental health survey. The United Kingdom Annual Population Survey (APS), Germany The Socio-Economic Panel (SOEP) survey and Australia (Household, Income and Labour Dynamics in Australia [HILDA]) conduct such studies. Here, we use 6 years of data from the HILDA Survey:
To identify whether there are differences between the mental health of Australian doctors and:
Other professional groups, that is, lawyers, accountants, engineers, teachers, nurses and midwives;
Employed Australians overall.
To measure whether there have been changes in the mental health of Australian doctors over time, especially during the first year of the COVID pandemic.
To measure any differences in temporal trends in the mental health of doctors compared to other occupations.
Method
Sampling Frame ‘The Household, Income and Labour Dynamics in Australia (HILDA) Survey’ was funded by the Australian government – in which data were collected yearly from 2001 onward, and the last available wave was 2020. The HILDA study is a nationally representative longitudinal study of Australian households which collects information annually on a wide range of aspects of life in Australia, including health and wellbeing (Wilkins et al., 2019). In this survey, the same households and individuals were interviewed each year and the sample evolved over time adding children born to sample members and people who joined or shared a household with a sample member. The authors applied for and were granted access to the HILDA dataset.
For this study, we limited the sample to people who were (a) employed and (b) answered the questions about mental health in the survey. Information was available for 11,033 employed people in 2015, to 10,547 employed in 2020.
Occupation was ascertained from the self-reported current occupation response which was coded to the four-digit Australian Standard Classification of Occupation (ASCO). Doctors and other white-collar professionals with sample sizes of at least 100 respondents per wave were selected and included teachers, lawyers, accountants, nurses and midwives, and engineers. The ‘all other employed’ group consisted of all employed Australians excluding the aforementioned six occupational groups. Data on the variables of mental health outcome and life satisfaction, and potential confounders – hours worked per week, age, gender and gross yearly income and wages – were extracted for these groups.
Mental Health was measured using the Mental Health Inventory–5 (MHI-5) derived from the 36-item Short Form Health Survey (SF-36). This has five questions concerning nervousness, sadness, peacefulness, mood and happiness (Ware et al., 1993). Respondents rated the frequency of each item during the previous 4 weeks on a 6-point Likert-type response scale (1 = all of the time, 2 = most of the time, 3 = a good bit of the time, 4 = some of the time, 5 = a little of the time, 6 = none of the time), for example, ‘How much of the time, during the last month, have you felt downhearted and blue?’ A (total) MHI-5 score was computed by summing and transforming the five 6-point scores into a score between 0 and 100, with higher scores indicating better mental health. The MHI-5 scale had a high degree of internal consistency (Cronbach’s alpha = 0.844), and removal of any question in this sample resulted in a lower internal consistency, confirming its use as a single scale.
Life Satisfaction was studied as a secondary measure of cognitive wellbeing (Kettlewell et al., 2020) and measured by a one-item question ‘All things considered, how satisfied are you with your life?’ where the respondent chose a number between 0 (totally dissatisfied with life) and 10 (totally satisfied with life). This question enabled the ascertainment of generalisability as it has also been used in the large MABEL (Medicine in Australia: Balancing Employment and Life) study of Australian doctors (Joyce and Wang, 2015).
Prevalence of Mental Ill-health was defined by a binary variable indicating a mental health score below 54; this cut-off provided a specificity rate of 95% in the screening of major depressive disorders and/or dysthymia (Cuijpers et al., 2009).
Data analysis
We tested for non-response bias by conducting chi-square tests with pairwise Z-tests on each year of data to determine whether there were significant differences in levels of non-response between occupations.
We performed a one-way analysis of variance (ANOVA) with planned pairwise comparisons to compare the average level of life satisfaction between occupations over the 6-year period.
Comparative occupational mental health
We performed a one-way ANOVA with planned pairwise comparisons to compare the average level of mental health between occupations over the 5-year period prior to COVID-19. We mean aggregated each respondent’s MHI-5 score for each year they had responded to the survey. Doctors (n = 92) were compared against each of five other selected professional cohorts with more than 100 respondents (lawyers n = 151, nurses and midwives n = 380, teachers n = 628, accountants n = 196, engineers n = 187), as well as an ‘all other employed’ cohort (n = 13,378) in a set of planned pairwise comparisons with type 1 error adjustment using the Games-Howell test. We also compared mental health levels of these occupations in the most recent year of data (2020).
We performed a logistic regression with the mental ill-health binary indicator as the dependent variable, and time and occupation as independent variables over the 6-year period (2015–2020). Simple effects between each occupation and doctors were estimated to determine differences in overall prevalence, as well as any interactions with time.
Trends in mental health
To determine whether any changes in mental health occurred within occupations over 2015–2019, we conducted a multivariable linear regression (ordinary least squares [OLS]) on MHI-5 scores, examining the interaction between year and occupation. We also included covariates for age, gender, income and hours worked per week to adjust for the effects of these variables on mental health. This analysis was performed on all individuals (n = 15,174), and a follow-up repeated-measures analysis was performed on the subset of individuals who responded in each and all of the 5 years between 2015 and 2019 (n = 5805).
To assess changes between 2019 and 2020 (i.e. before and after the beginning of the COVID-19 pandemic), a two-way ANOVA including occupation and year compared whether different occupations suffered different changes in mental health pre and post COVID-19.
Results
Demographic variables of the occupational groups
The baseline characteristics of the respondents across the six waves from 2015 to 2020 are presented in Table 1. Over this period, the mean age of the doctors ranged from 42.2 to 43.3 years, the mean income ranged from $133,899 to AUS$165,013 and the average hours worked were 38.3–41.3 hours. On average, doctors were better paid than all other groups but did not work longer hours. Nurses and teachers were female-dominated and engineers male-dominated professions. Out of the 104 responding doctors, males and females were balanced. Median years worked in the profession ranged from 7 to 8 for doctors over 2015–2020, indicating that approximately 50% of the doctors report fewer than 7 years of experience. As such, a significant proportion of the doctors in our study would likely be considered ‘junior doctors’, that is, not specialists or general practitioners (GPs).
Baseline characteristics.
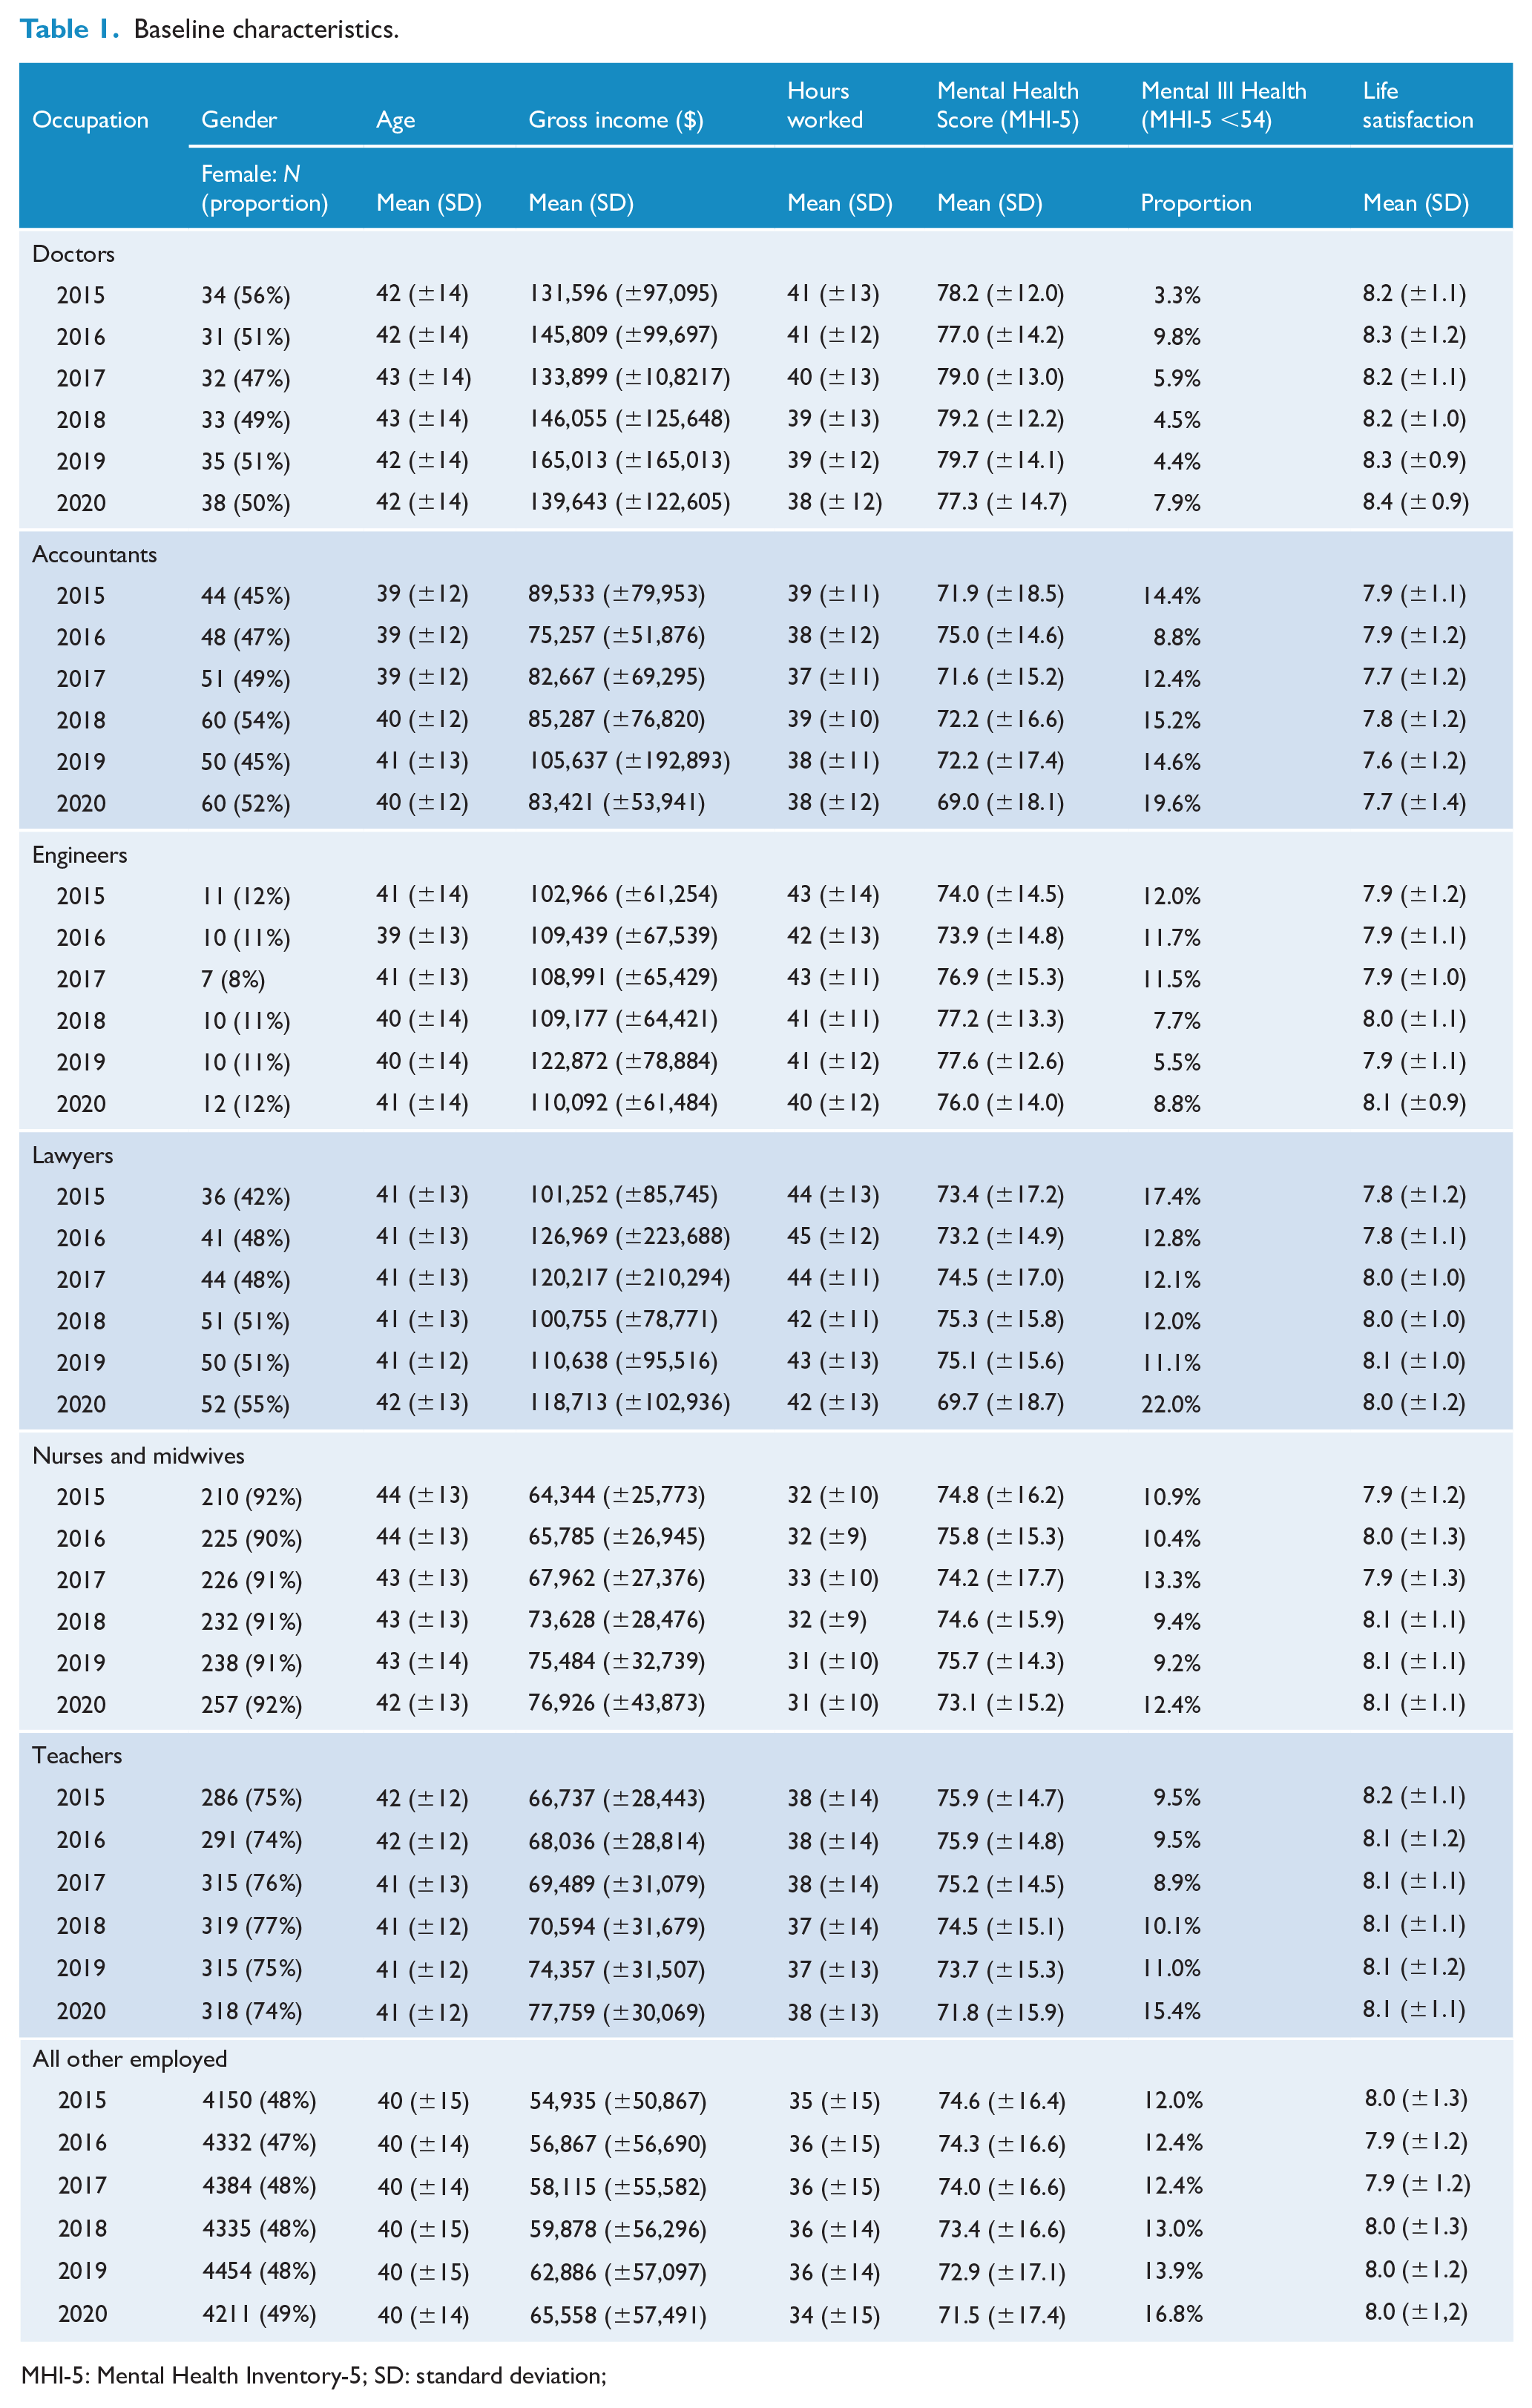
MHI-5: Mental Health Inventory-5; SD: standard deviation;
The non-response rates to the mental health questions among the six professions ranged from 3.5% (accountants) to 13.2% (lawyers). Chi-square tests with pairwise Z-tests conducted on each year of data among the six studied professions revealed there were significantly higher levels of non-response only among lawyers in 2017 (10.8%) and 2019 (13.2%) (p < 0.05). Doctors showed no response or attrition bias.
Comparative occupational mental health
Doctors had the highest mean mental health scores in each of the 6 years studied (Figure 1(a)); one-way ANOVA of overall MHI-5 score (2015–2019): F(6, 50299) = 8.75 (p < 0.001). Planned pairwise comparisons showed that the overall mental health of doctors (M = 78.7, SD = 13.1) from 2015–2019 was significantly higher than that of accountants (M = 72.6, SD = 16.5, MD [mean difference] = 6.1, p < 0.001, 95% CI = [3.06, 9.11]), teachers (M = 75.0, SD = 14.9, MD = 3.7, p < 0.001, 95% CI = [1.29, 6.02]), nurses and midwives (M = 75.1, SD = 15.9, MD = 3.6, p < 0.001, 95% CI = [1.07, 6.13]), lawyers (M = 74.4, SD = 16.1, MD = 4.3, p < 0.001, 95% CI = [1.23, 7.39]) and the ‘all other employed’ group (M = 73.8, SD = 16.7, MD = 4.8, p < 0.001, 95% CI: [2.66, 6.99]). The only professional group who did not have poorer mental health than doctors were engineers (M = 74.4, SD = 14.1, MD = 2.8, p = .075, 95% CI = [−0.14 to 5.67]).
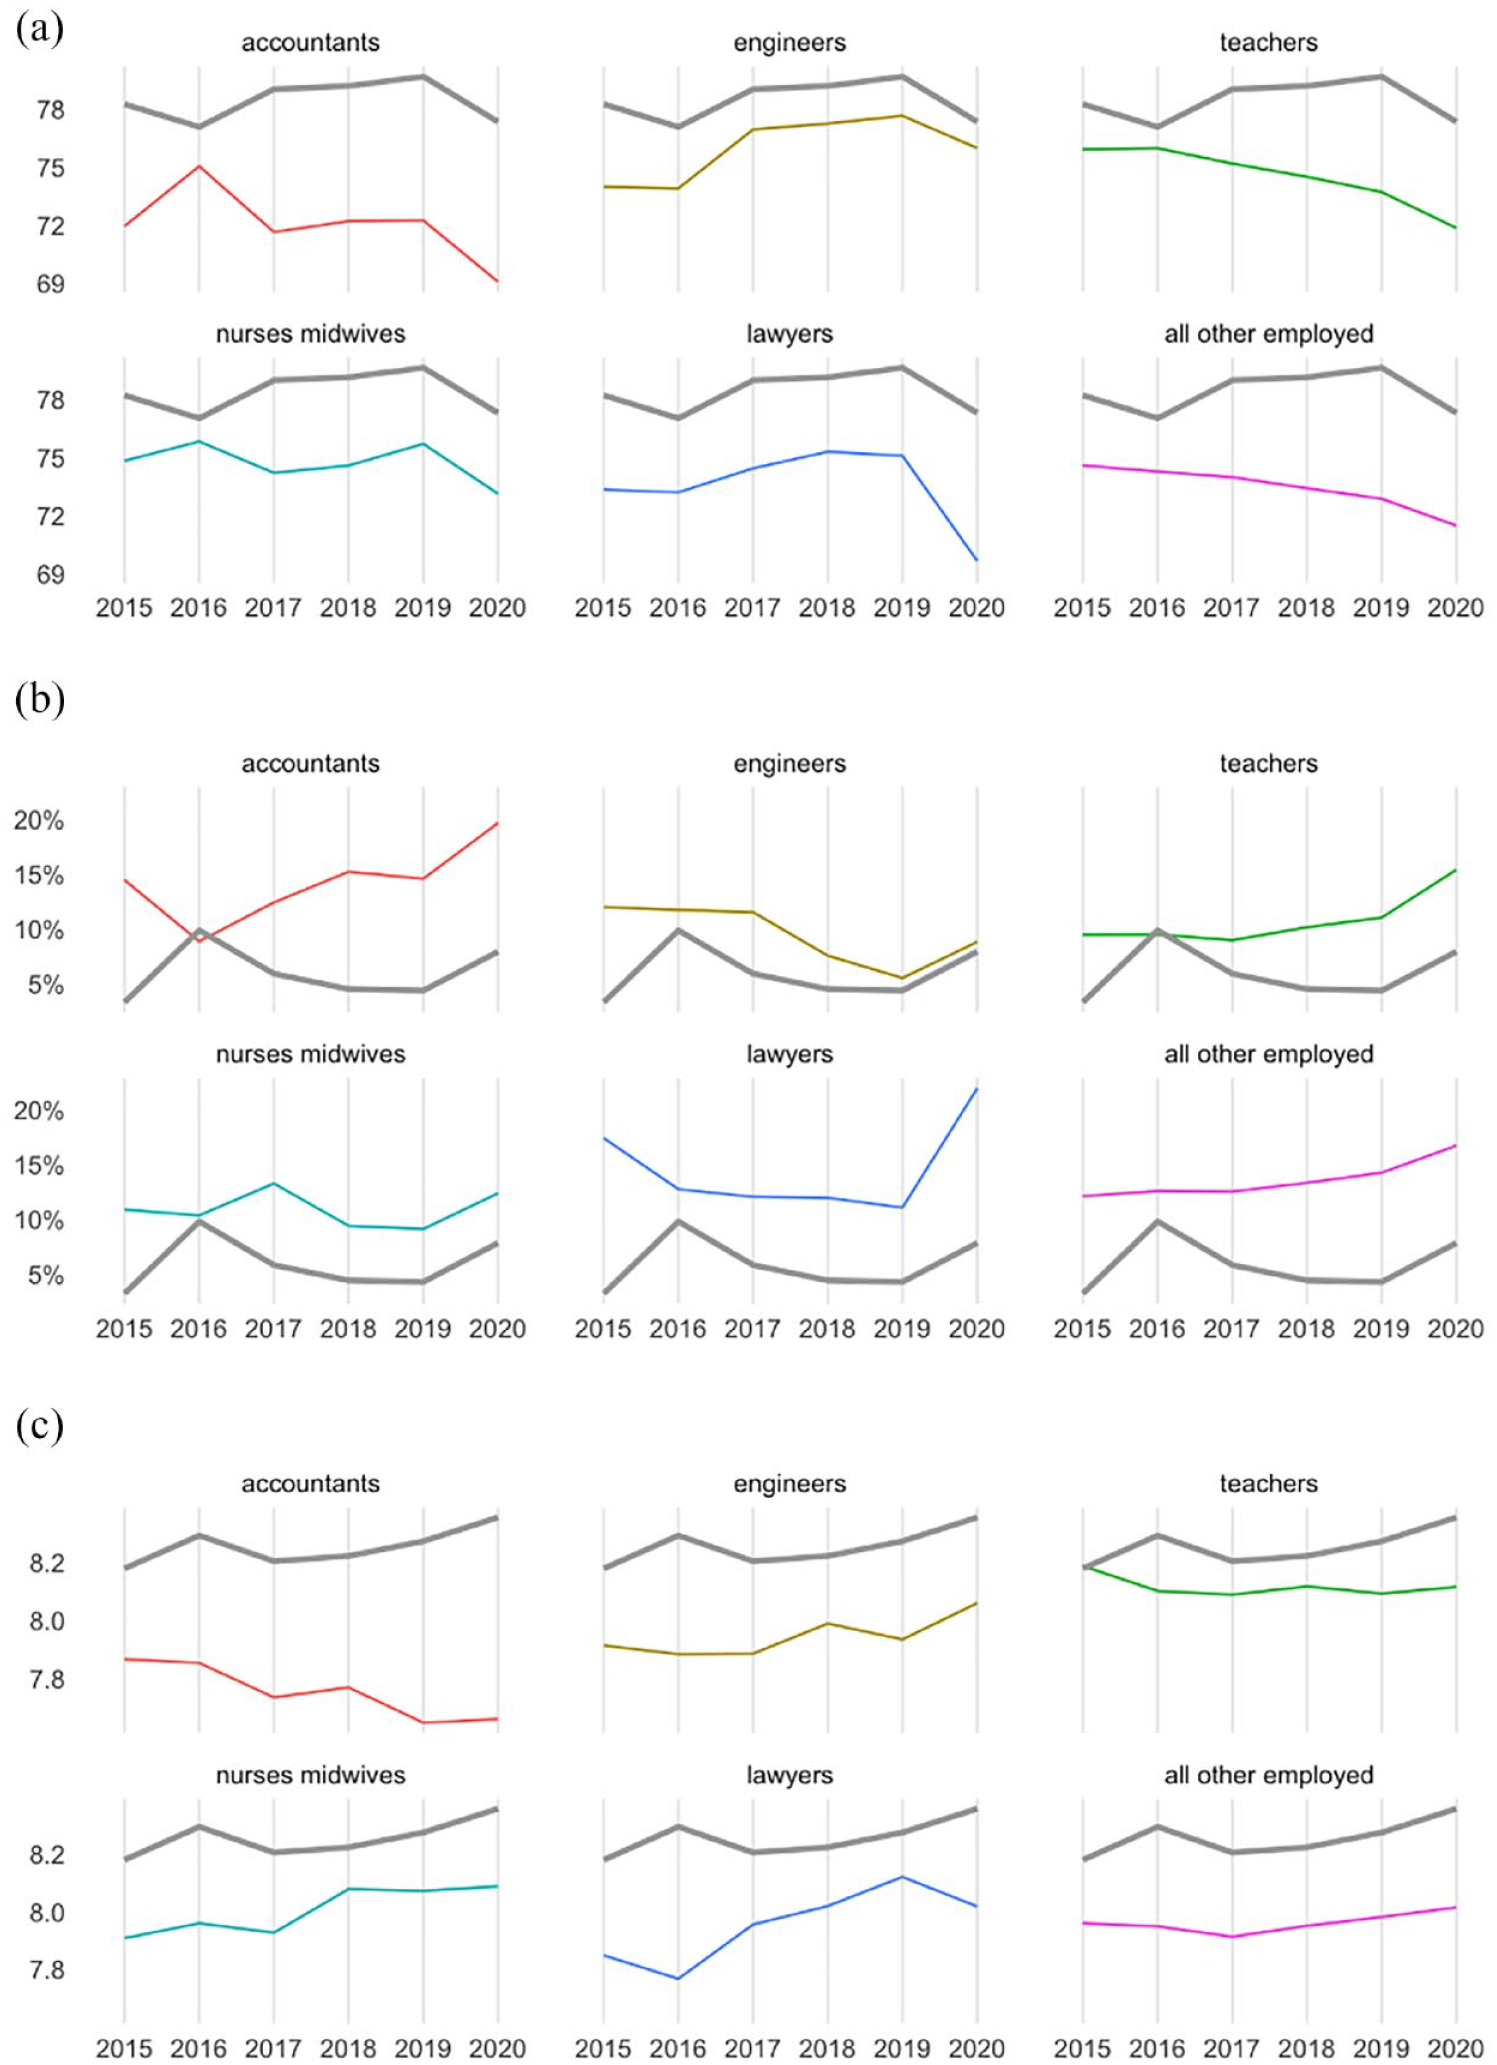
Mental health and life satisfaction by occupation over years (solid grey line: doctors). (a) Mean MHI-5 score (0–100). (b) Prevalence of mental ill-health (MHI-5 <54). (c) Mean life satisfaction rating (0–10).
Using a dichotomous cut-point to assess likely mental ill-health, over the 6-year period from 2015, the prevalence of mental ill-health was lower among doctors than any other profession studied with the exception of 2016 (see Figure 1(b)). However the logistic regression showed no evidence of a significant difference in the prevalence of mental ill-health of doctors and any single other profession. The only significant difference was against the ‘all other employed’ group, where the odds ratio (OR = 0.38, p < 0.001, 95% CI = [0.24–0.61]) indicated doctors were about only one-third as likely to experience mental ill-health as most of the employed population.
Trends in mental health over 2015–2019
The multivariable linear regression model (OLS) showed no significant change or trend in the mental health of doctors, accountants, lawyers, and nurses and midwives over this period (see Supplementary Table 1). However, engineers’ mental health improved (p = 0.049) over this period, while the mental health of teachers and ‘all other employed’ respondents deteriorated (ps = 0.023 and <0.001, respectively). For doctors specifically, there was no significant interaction between changes in mental health and years they had worked as doctors (β = 0.020, SE = 0.057, p = 0.724), indicating no change in junior doctors masked by an opposite change in senior doctors. Sensitivity analysis limiting this analysis to only respondents in each occupation who responded in all 5 years prior to COVID-19 did not change this pattern of results.
Changes in mental health during COVID-19
In 2020, all occupational groups experienced a decline in their unadjusted mean mental health score. Two-way ANOVA showed the main effect of decline was significant (F = 11.612, p < 0.001), and there were significant main effects of occupation (F = 7.222, p < 0.001). However there was no significant interaction effect between occupation and time, F(6, 19892) = 0.68, p = 0.667.
Post hoc comparisons between occupations in 2020 confirmed doctors continued to have significantly better mental health than accountants (MD = 7.8, p < 0.001, 95% CI = [2.38, 13.17]), teachers (MD = 5.7, p = 0.004, 95% CI = [1.14, 10.19]) and the ‘all other employed’ group (MD = 6.2, p < 0.001, 95% CI = [2.02, 10.40]).
Life satisfaction
The unadjusted mean life satisfaction scores (cognitive wellbeing) of each occupation over time are shown in Figure 1(c). A one-way ANOVA comparing the average life satisfaction over the entire period (2015–2020) confirmed doctors had the highest life satisfaction (M = 8.26, SD = 1.01), significantly greater than most other occupations. The largest difference was between doctors and accountants (MD = 0.51, p < 0.001, 95% CI = [0.28–0.74]). There was no significant difference between doctors and teachers (p = 0.31).
Discussion
When we used the same sampling frame to compare different occupations (a longitudinal population-based study not recruiting from only one occupation or specifically focusing upon mental health and life satisfaction), we found important, but counterintuitive differences in the mental health and life satisfaction of doctors compared to other professions and the workforce in general.
Our findings did not confirm the widely held perception that doctors as a profession have poorer mental health than other employed Australians (Beyond Blue, 2013), or that their mental health decreased over recent years prior to COVID-19. We actually found better mental health and lower prevalence rates in doctors than almost all other professions. Our findings held regardless of whether we used a continuous measure of mental health or when characterised as a prevalence rate – presence of mental ill-health with a predefined cut-off point of 54 on MHI-5. North American studies (Dyrbye et al., 2014; Shanafelt et al., 2012) did not find differences between physicians and matched employees but found incredibly high rates of mental ill-health (>40% in both physician and population samples), suggesting significant bias. The rates of mental ill-health in this large population-based sample (between 4% and 15% in 2019, and 7% and 20% in 2020) were closer to those reported by ABS studies (Australian Bureau of Statistics, 2021).
The prevalence of mental ill-health seen in our study is lower than the range reported by single-occupation studies and in Elliot et al.’s (2010) Australian systematic literature review where point prevalence of depression and anxiety among studies was 14%–60% and 18%–55% respectively. However, our measure, the MHI-5, has been widely validated, and cut-points of the MHI-5 for prevalence rate have been used in many studies evaluating the prevalence and course (Crowe et al., 2016), risk factors (Daly et al., 2019) and prediction models of workplace mental health in Australia (Fernandez et al., 2017). The use of the MHI-5 does preclude direct comparison with Australian occupational cohort studies of doctor’s mental health which tend to use the Kessler Psychological Distress Scale K10 or the 12-item General Health Questionnaire GHQ-12 (Beyond Blue, 2013). Nevertheless, a cross-walk evaluation of eight mental health measures in Australia (including both K10 and GHQ-12) has previously found that for detecting any Diagnostic and Statistical Manual of Mental Disorders, Fifth Edition (DSM-5) mental disorder, the MHI-5 had sensitivity and specificity not significantly worse than the 20-item Self-Reporting Questionnaire (SRQ-20) and the Distress Questionnaire-5 (DQ5), which, respectively, were the highest performing scales on these metrics (Batterham et al., 2017). Even using the higher value of MHI-5 <64 as the cut-point for mental ill-health suggested in this paper would provide a point prevalence of only 11.3% of doctors with mental ill-health from 2015 to 2019 and 14.5% during 2020.
Our findings are consistent with our earlier hypothesis that single-occupation studies and reports suffer from selection and/or response bias, especially by an ‘unhealthy responder effect’, leading to misleading findings. Specifically, we know that studies aiming to explore the mental ill-health of occupations may be subject to systematic bias due to the context in which the study was framed and administered. And such study results may indeed be more of a reflection of job dissatisfaction as opposed to reflecting the actual prevalence of illness (Goodwin et al., 2013).
Almost all (>93%) of the respondents in 2020 were surveyed from August to late October, and as expected, the average health of all professions declined during the COVID-19 pandemic. Despite the health impact of the pandemic, the superior mental health and life satisfaction of doctors remained, and they (and nurses and midwives) showed no greater decline than other professions. This may reflect the widespread economic and employment effects seen across occupations, while those in the health service, even if subject to greater work stressors, retained their jobs and income. While we know income is consistently correlated with better mental health (Morris et al., 2021) and life satisfaction (Masuda et al., 2020), the mental health of the physician group was significantly higher than that of accountants, teachers and other employed respondents after controlling for income (as well as age, gender and work hours). In the United Kingdom, collegial support, supportive leadership and access to appropriate professional care were identified as buffers against psychological distress for doctors (Riley et al., 2021). Whether these were similar buffers in Australia is up for debate.
Strengths and limitations
Our study had several strengths, the first of which was low, non-differential levels of non-response bias; the response rate to the MHI-5 questions was greater than 90% both in the doctors and in the group of ‘all other employed’ Australians. Another strength was comparatively low attrition rates, with doctors having the lowest attrition rates among occupations studied; by 2020, only 23% of the 2015 doctor’s cohort had not responded. However, the main limitation of using the MHI-5 – which measures overall mental health – is that we have no information on suicide rates, nor can we ascertain whether doctors have experienced increases in specific types of mental health problems such as burnout or post-traumatic stress disorder (PTSD), especially during the COVID-19 pandemic.
Another key critique could be that this sample of 104 doctors was biased in selecting a group with better mental health. However, we can think of no a priori reason why this very well validated ‘Household Income and Labour Dynamics’ study would select happy doctors but miserable workers in other professions. Confirming the low likelihood of bias, the same measure of life satisfaction has also been used in the large MABEL study of Australian doctors. The life satisfaction by doctors in our six waves was at least 8 (scale 1–10) in each wave and very similar to both the most recent MABEL wave in 2018 of 7.6 (scale 1–10) (SD = 1.59, n = 8472) and Joyce and Wang’s (2015) findings from the MABEL 2011 wave that 74% of doctors have moderate to high job satisfaction.
The other main limitation of the sampling approach within the HILDA data is that it was likely to include less foreign-trained doctors. Although some foreign-trained doctors may have been captured when the sample was topped up in 2011 by ~2000 households, those coming to Australia later would have been missed if they did not join the initial ~8000 households recruited in 2001 or the households in the 2011 top-up sample. As such, 14% of our 2019 wave of doctors completed their highest qualification overseas compared to 33% of ~97,000 doctors recorded as foreign-trained on the Organisation for Economic Co-operation and Development (OECD) 2019 dataset (OECD, 2022). We also do not have information about whether our sample of doctors worked in the public, private sector or both.
The random sampling strategy used by HILDA to cover all census geographical areas, however, was likely to capture an unbiased geographical representative sample of doctors. We compared the baseline characteristics of the HILDA doctors in 2020 to data from the ~105,000 registered doctors in 2020 in the National Health Workforce Dataset (Health Workforce, 2022). In these two datasets, the mean age of doctors (42 [HILDA] and 46 [NHWD] years), gender ratio (50% male and 56% male, respectively), mean hours per week worked (38 and 41, respectively) and mean years in practice (14 and 17, respectively) were all similar, although there was a higher proportion of doctors aged 20–34 years (41% and 20%, respectively) and GPs in the HILDA study (66% and 41%, respectively). We further compared mean income against the MABEL wave of ~8300 doctors in 2015 (unpublished data) and found large differences between our 2015 wave (mean income of ~$132k) and the MABEL 2015 wave (~$192k). In summary, the HILDA doctors were more likely to be junior doctors (given how few become specialists before 34), earn less, be GPs and have completed their highest qualification in Australia. As such, they had selection biases for better mental health as it has been shown that GPs have higher job satisfaction than other specialists (Hills et al., 2011) and the HILDA doctors may have fewer of the reported stressors of overseas-trained doctors. However, equally, the HILDA doctors had contrasting risk factors for poorer mental health and wellbeing by earning nearly 30% less (Morris et al., 2021) and over-representing junior doctors. Beyond Blue (2013) identified that junior doctors had worse mental health than specialists and GPs. The media and others who focus on doctor’s mental health often fail to make this distinction, yet with career bottlenecks, college pressures and recent trainee psychiatrist exam challenges, it would be reasonable to focus more effort on this group rather than older, well-established highly paid professionals in secure jobs.
Doctors are not alone in having single-occupation reports lamenting their profession’s mental health. All of the professions analysed in our study had at least one such report in the past 10 years, as have others such as police officers and firefighters (Kyron et al., 2021). Studies such as ours highlight not only which professions really seem to be suffering in relation to other professions, but identify which are deteriorating over time. In this case, it would seem that the teaching profession, and in fact the workforce in general, experienced year-on-year declines in mental health and so may be diverging from other white-collar professions (see trend analysis results). Exploring why engineers were the only occupational group to have improving mental health over time in this study might help inform others. Income for all professions increased over time, so this seems an unlikely source.
Overall, our study challenges the general opinion – at least in the medical community – that doctors have poorer mental health than other workers. This corresponds well with the paradox that more attention in the media and public is given to misery and unhappiness, but when people are questioned directly, they report a high degree of happiness (Myers, 2000).
Conclusion
This sample of Australian doctors appear to have had stable and higher levels of mental health and life satisfaction than other professional contemporaries, while many of Australia’s employed population have had declining mental health during the period 2015—2019. The large Lancet review (Harvey et al., 2021) also suggested that doctors showed no worse mental health than other employees, and likely lower levels of common mental disorders such as depression and anxiety. There were similar declines in mental health during the first year of the COVID-19 pandemic among all occupations studied. The impact of COVID-19 in 2021 and onwards and the much greater health service demands may of course change this.
While this should not dissuade us from making our working conditions better and reducing risks for mental ill-health, we may well consider how our inward focus might be seen by those with potentially less rewarding careers, lower incomes and poorer mental health.
Supplemental Material
sj-png-1-anp-10.1177_00048674221106677 – Supplemental material for The comparative mental health of Australian doctors before and during COVID-19: A population-based approach
Supplemental material, sj-png-1-anp-10.1177_00048674221106677 for The comparative mental health of Australian doctors before and during COVID-19: A population-based approach by Kevin Thien Anh Hoang, Richard W Morris, Diana Nicole Naehrig and Nick Glozier in Australian & New Zealand Journal of Psychiatry
Footnotes
Declaration of Conflicting Interests
The author(s) declared no potential conflicts of interest with respect to the research, authorship and/or publication of this article.
Funding
The author(s) received no financial support for the research, authorship and/or publication of this article.
Supplemental Material
Supplemental material for this article is available online.
References
Supplementary Material
Please find the following supplemental material available below.
For Open Access articles published under a Creative Commons License, all supplemental material carries the same license as the article it is associated with.
For non-Open Access articles published, all supplemental material carries a non-exclusive license, and permission requests for re-use of supplemental material or any part of supplemental material shall be sent directly to the copyright owner as specified in the copyright notice associated with the article.