
Abstract
Objective:
Clinical heterogeneity in major depressive disorder likely reflects the range of etiology and contributing factors in the disorder, such as genetic risk. Identification of more refined subgroups based on biomarkers such as white matter integrity and lipid-related metabolites could facilitate precision medicine in major depressive disorder.
Methods:
A total of 148 participants (15 genetic high-risk participants, 57 patients with first-episode major depressive disorder and 76 healthy controls) underwent diffusion tensor imaging and plasma lipid profiling. Alterations in white matter integrity and lipid metabolites were identified in genetic high-risk participants and patients with first-episode major depressive disorder. Then, shared alterations between genetic high-risk and first-episode major depressive disorder were used to develop an imaging x metabolite diagnostic panel for genetically based major depressive disorder via factor analysis and logistic regression. A fivefold cross-validation test was performed to evaluate the diagnostic panel.
Results:
Alterations of white matter integrity in corona radiata, superior longitudinal fasciculus and the body of corpus callosum and dysregulated unsaturated fatty acid metabolism were identified in both genetic high-risk participants and patients with first-episode major depressive disorder. An imaging x metabolite diagnostic panel, consisting of measures for white matter integrity and unsaturated fatty acid metabolism, was identified that achieved an area under the receiver operating characteristic curve of 0.86 and had a significantly higher diagnostic performance than that using either measure alone. And cross-validation confirmed the adequate reliability and accuracy of the diagnostic panel.
Conclusion:
Combining white matter integrity in corpus callosum, superior longitudinal fasciculus and corona radiata, and unsaturated fatty acid profile may improve the identification of genetically based endophenotypes in major depressive disorder to advance precision medicine strategies.
Keywords
Introduction
Major depressive disorder (MDD), a leading cause of disability worldwide, is a heterogeneous psychiatric disorder with a moderate heritability of 40% (Uhl and Grow, 2004; World Health Organization, 2017). Currently, MDD diagnosis is mainly based on measuring a patient’s core symptoms, as there are no established biological indicators. The heterogeneity of depressive symptoms and subjective assessments make accurate diagnosis difficult (Sanchez-Villegas et al., 2008). Identifying biological markers for objective diagnosis remains a pressing need and priority in MDD research (Ferenchick et al., 2019; Gadad et al., 2018).
A wide array of biosignatures, including neuroimaging in particular and biochemical markers, have been reported. However, none of them are sufficiently reliable for MDD diagnosis due to the complex biopsychosocial etiology of MDD, which includes abnormalities in various biological areas (neuroanatomic, genetic, epigenetic, neuroendocrine and biochemical) and its interactions with environmental factors (Schneider and Prvulovic, 2013). Therefore, a well-defined biological diagnostic tool requires a combination of diverse trait markers that cover different biological dimensions (Papakostas et al., 2013; Schneider and Prvulovic, 2013). Endophenotypes are heritable and measurable characteristics shared by patients and their first-degree relatives. They have been proposed as biomarkers in MDD diagnosis because they are stable and close to the pathophysiology of illness (Gould and Gottesman, 2006; Leboyer et al., 1999). For this reason, the discernment of trait endophenotypic markers in first-degree relatives with genetic high-risk (GHR) for MDD may be a promising advancement in biological marker studies of MDD.
Abnormalities of brain structure and function are putative endophenotypic traits in depression (Hasler and Northoff, 2011). Previous studies showed white matter (WM) deficits in the GHR population and patients with depression, suggesting that WM alteration is a robust marker in illness etiology (Gong, 2017; Huang et al., 2011). WM’s integrity can be detected with the diffusion tensor imaging (DTI) technique. Fractional anisotropy (FA), a commonly used parameter derived from DTI, describes the degree of water diffusion anisotropy (Taylor et al., 2004). FA can quantitatively measure and visualize WM microstructural alterations that occurred in heavily myelinated WM tracts (Horsfield and Jones, 2002). Several DTI studies have reported that depressive patients and their high-risk relatives shared the decreased FA value in similar brain regions, particularly splenium of the corpus callosum (CC), superior longitudinal fasciculus (SLF), uncinate fasciculus and cingulum (Huang et al., 2011; Wu et al., 2020; Xu et al., 2013). Moreover, one study found a link between polygenic risk for MDD and reduced FA values in SLF (Whalley et al., 2013). These findings suggest that decreased FA value may serve as an endophenotypic marker and a stable candidate to assist MDD diagnosis.
The findings mentioned above highlight the involvement of WM deficits in MDD onset and the importance of understanding the molecular mechanism of WM deficits in the etiology of MDD. The myelin sheath is a multilayer oligodendrocyte plasma membrane wrapped around the axons of neurons in the central nervous system (CNS). The degree of myelination is one of the main indicators of WM integrity (Aggarwal et al., 2011). Lipids make up more than 70% of myelin, and lipid metabolism regulation could enhance oligodendrocyte maturation and myelination (Marangon et al., 2020; Rajkowska et al., 2015). There was no detectable diffusion anisotropy or tissue contrast in the FA map when lipids were removed from the mouse brain (Leuze et al., 2017). Thus, it is conceivable that lipid metabolism has a critical role in maintaining WM integrity. In addition, a number of studies reported altered single lipid signatures both in peripheral blood samples and postmortem brain tissue samples from patients with MDD (Hamazaki et al., 2013; Walther et al., 2018; Wei et al., 2020b). Our previous meta-analysis on lipid disturbance in patients in their first depressive episode showed that cholesterol and triglycerides are strongly related to MDD (Wei et al., 2020b).
Furthermore, high-throughput metabolomics technology in MDD research has resulted in groundbreaking findings that lipid perturbations are associated with MDD. Combinatorial lipid markers have been proposed for MDD diagnosis (Walther et al., 2018). As WM abnormalities and lipid alterations contribute to the pathophysiology of MDD, combining them may yield a reliable marker panel for accurate MDD diagnosis. This is a promising direction in our understanding of the etiology of MDD from genetic-related brain structure abnormalities and biological changes.
In this study, we combined the DTI and lipid profile data in GHR participants, first-episode major depressive disorder (FE-MDD) patients and healthy controls (HCs). The study has two purposes: first, to get a deep insight into the pathophysiology of illness from aspects of the central brain structure and peripheral lipid metabolism; second, to build a combinatorial diagnostic panel with endophenotypic features identified from DTI data and lipid profile data for early diagnosis of MDD.
Methods and materials
Participants
All FE-MDD and GHR participants were recruited from Shenyang Mental Health Center and the Department of Psychiatry, First Affiliated Hospital of China Medical University in Shenyang, China. HCs were recruited from the community via advertisement. Two trained psychiatrists interviewed all participants to confirm the presence or absence of Axis I psychiatric diagnoses using the Structured Clinical Interview for Diagnostic and Statistical Manual of Mental Disorders, Fourth Edition (DSM-IV) for Axis I Disorders (SCID). The inclusion criteria for MDD participants met the following conditions: (1) aged 18 or above; (2) fulfilled the DSM-IV diagnostic criteria for MDD, first depressive episode; and (3) no comorbid diagnosis of other Axis I disorders. The GHR groups were healthy participants who have at least one parent with MDD. HCs were participants having no current or history of Axis I disorder and no family histories of Axis I disorders in first- or second-degree relatives. Age, sex and body mass index (BMI) were mean-matched among groups. All participants completed the 17-item Hamilton Depression Rating Scale (HAMD-17) to assess depressive symptoms. The exclusion criteria included the following conditions: (1) history of drug/alcohol abuse or dependence, diabetes mellitus, hypertension, vascular and infectious diseases and other major medical or neurological comorbidities; (2) contraindications for magnetic resonance imaging (MRI); and (3) history of head injury with loss of consciousness for ⩾5 minutes. Informed consent was obtained from all participants after the detailed description of the study was provided. This study was approved by the Institutional Review Board of China Medical University.
A total of 148 participants between 18 and 48 years old were recruited, including 15 GHR participants, 76 HCs and 57 FE-MDD patients (20 without medication treatment and 37 taking medications currently). Detailed demographic characteristics of all participants are presented in Table 1.
Demographic characteristics of the participants.
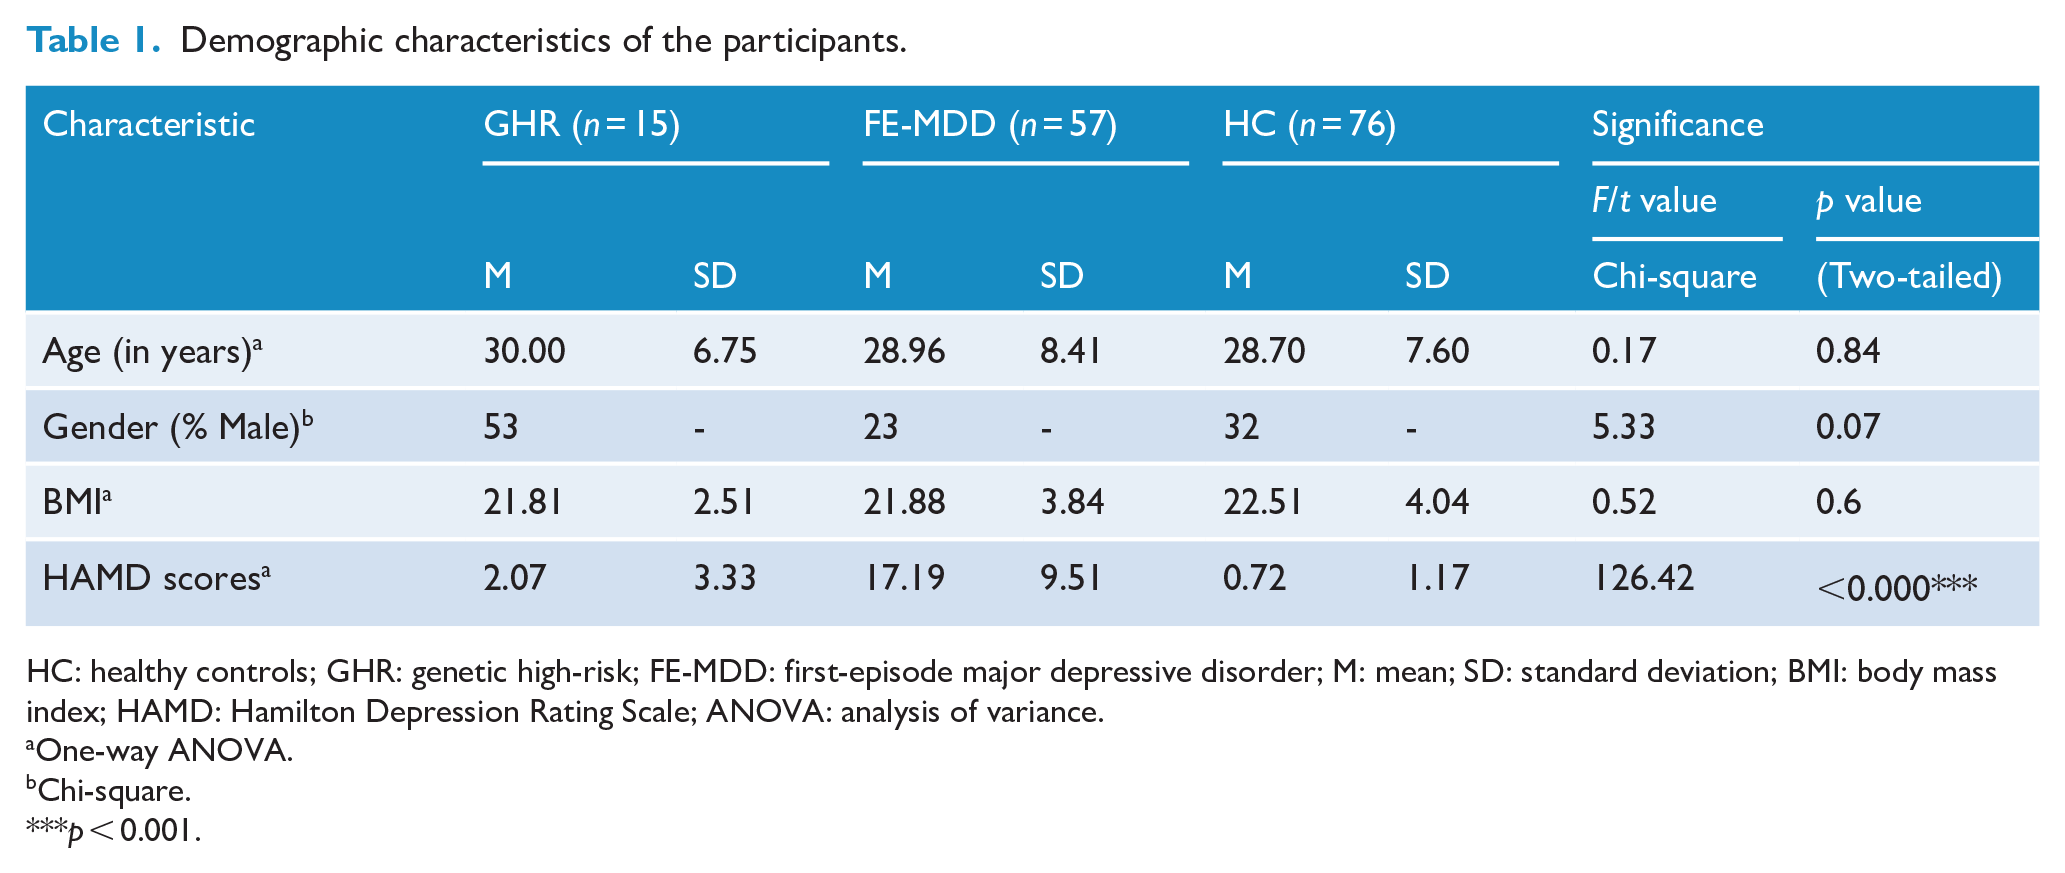
HC: healthy controls; GHR: genetic high-risk; FE-MDD: first-episode major depressive disorder; M: mean; SD: standard deviation; BMI: body mass index; HAMD: Hamilton Depression Rating Scale; ANOVA: analysis of variance.
One-way ANOVA.
Chi-square.
p < 0.001.
Image acquisition and processing
DTI acquisition
DTI data were acquired from all participants using a GE Signa HDX 3.0 T MRI scanner with a standard 8-channel head coil at the First Affiliated Hospital of China Medical University, Shenyang, China. The scanning parameters were set as follows: TR/TE = 17,000/85.4 ms, image matrix = 120 × 120, FOV = 240 × 240 mm2, 65 contiguous slices of 2 mm without gap, 25 noncollinear directions (b = 1000 s/mm2), together with axial acquisition without diffusion weighting (b = 0), and voxel size = 2.0 mm3.
DTI processing
Pipeline for Analyzing braiN Diffusion imAges (PANDA) (www.nitrc.org/projects/panda) (Cui et al., 2013), a MATLAB toolbox, was applied to preprocess DTI data with the following steps: (1) converting DICOM files into NIfTI images, (2) brain extraction, (3) correction for eddy-current distortion and head motion, (4) correction for b-matrix and (5) computation for diffusion tensor metrics. FA was calculated based on the three eigenvalues and eigenvectors estimated by the diagonalization algorithm. Then, individual FA images of native space were nonlinearly registered to the FMRIB58_FA template in MNI (Montreal Neurological Institute) space with 2 mm3 voxels. The normalized FA was overlaid with image edges that were derived from the FA template. Finally, each FA map was smoothed with a 6-mm Gaussian kernel to reduce noise and misalignment.
Untargeted metabolomics
Plasma samples were obtained and stored at −80°C. Untargeted metabolomic and lipidomic analyses were performed on Ultimate 3000 ultra-high-performance liquid chromatography coupled with Q Exactive quadrupole-Orbitrap high-resolution mass spectrometer (UPLC-HRMS). Then, metabolomic data were processed using Compound Discoverer version 2.1 and TraceFinder software version 4.1 (Thermo Scientific, USA). A detailed procedure was described in Supplementary Materials and Methods.
Statistical analysis
DTI data analysis
Voxel-based analysis of FA was performed using analysis of covariance (ANCOVA) among GHR, FE-MDD and HCs with age and sex as covariates in SPM12 (www.fil.ion.ucl.ac.uk/spm/). Statistical significance was determined using Gaussian random field (GRF) correction with a threshold of p < 0.01 at voxel level and a threshold of p < 0.05 at cluster level. FA values of significantly different clusters were extracted for post hoc comparisons between groups. Significance level was set at p < 0.05 (least significant difference test; LSD).
Metabolomics data analysis
Lipids and lipid-related metabolites were selected from untargeted metabolomic and lipidomic data to conduct subsequent statistical analysis. Data normal distributions were checked by Kolmogorov–Smirnov tests. Analysis of variance (ANOVA) test was applied to screen differential metabolites if most variables were normally distributed and Kruskal–Wallis nonparametric test applied if not. Differences were considered significant when p values were less than 0.05. Pathway analysis based on the significantly altered metabolites was conducted for further biological interpretation via MetaboAnalyst 4.0 (www.metaboanalyst.ca/). Pathways with false discovery rate (FDR)-corrected p values less than 0.1 were considered significant.
Factor analysis and logistic regression analysis
In order to discriminate FE-MDD from HCs, factor analysis and logistic regression analysis of data from FE-MDD and HC participants were performed.
Factor analyses were undertaken for significantly different FA values and metabolites separately using principal component analysis (PCA). The Kaiser–Meyer–Olkin (KMO) test (Kaiser, 1970) and the Bartlett test of Sphericity (Burt, 2011) were applied to confirm the sample adequacy and data homogeneity. The number of common factors to extract was determined by comprehensively considering factor eigenvalue greater than 1, the scree test and interpretability criteria (Gaskin and Happell, 2014). Both varimax rotation and direct oblimin rotation were performed to generate the rotated factor pattern matrix. Variables with factor loading more than 0.5 were used to interpret and name the corresponding common factor. Standardized factor scores with a mean of 0 and a standard deviation of 1.0 were calculated for each subject.
Univariate logistic regression analyses with possible confounding factors (age, sex, BMI) and common factors as independent variables were carried out separately to identify potential predictive factors. Significant variables found related to FE-MDD in the univariate analyses were included in the following three multivariate logistic regression models: Model 1 using significant common factors representing altered FA values and confounders as independent variables, Model 2 using significant common factors representing altered metabolites and confounders as independent variables and Model 3 using significant common factors and confounders as independent variables. Furthermore, subgroup analysis stratified by medication was performed. Areas under the receiver operating characteristic (ROC) curve (AUC) were further computed to evaluate the model’s predictive power. AUC differences among the three logistic regression models were tested by a nonparametric method introduced by DeLong et al. (1988). In addition, Hosmer–Lemeshow test was performed to evaluate the goodness of fit of the three models. Model performance was validated using a fivefold cross-validation analysis. A p-value < 0.05 was regarded as statistically significant.
Results
Comparison of DTI measures
Significant differences were found in two clusters within bilateral superior corona radiata, the left posterior corona radiata, bilateral SLF and the body of CC among the three groups via one-way ANOVA. Post hoc comparison revealed that FE-MDD group showed significantly decreased FA values (p < 0.05, LSD test) in the two clusters compared to HCs. FA values of GHR were found significantly decreased in cluster 2 (p < 0.05, LSD test), decreased but not significantly in cluster 1 (p = 0.054, LSD test), when compared with HCs (Figure 1). No significance was found in GHR vs FE-MDD.
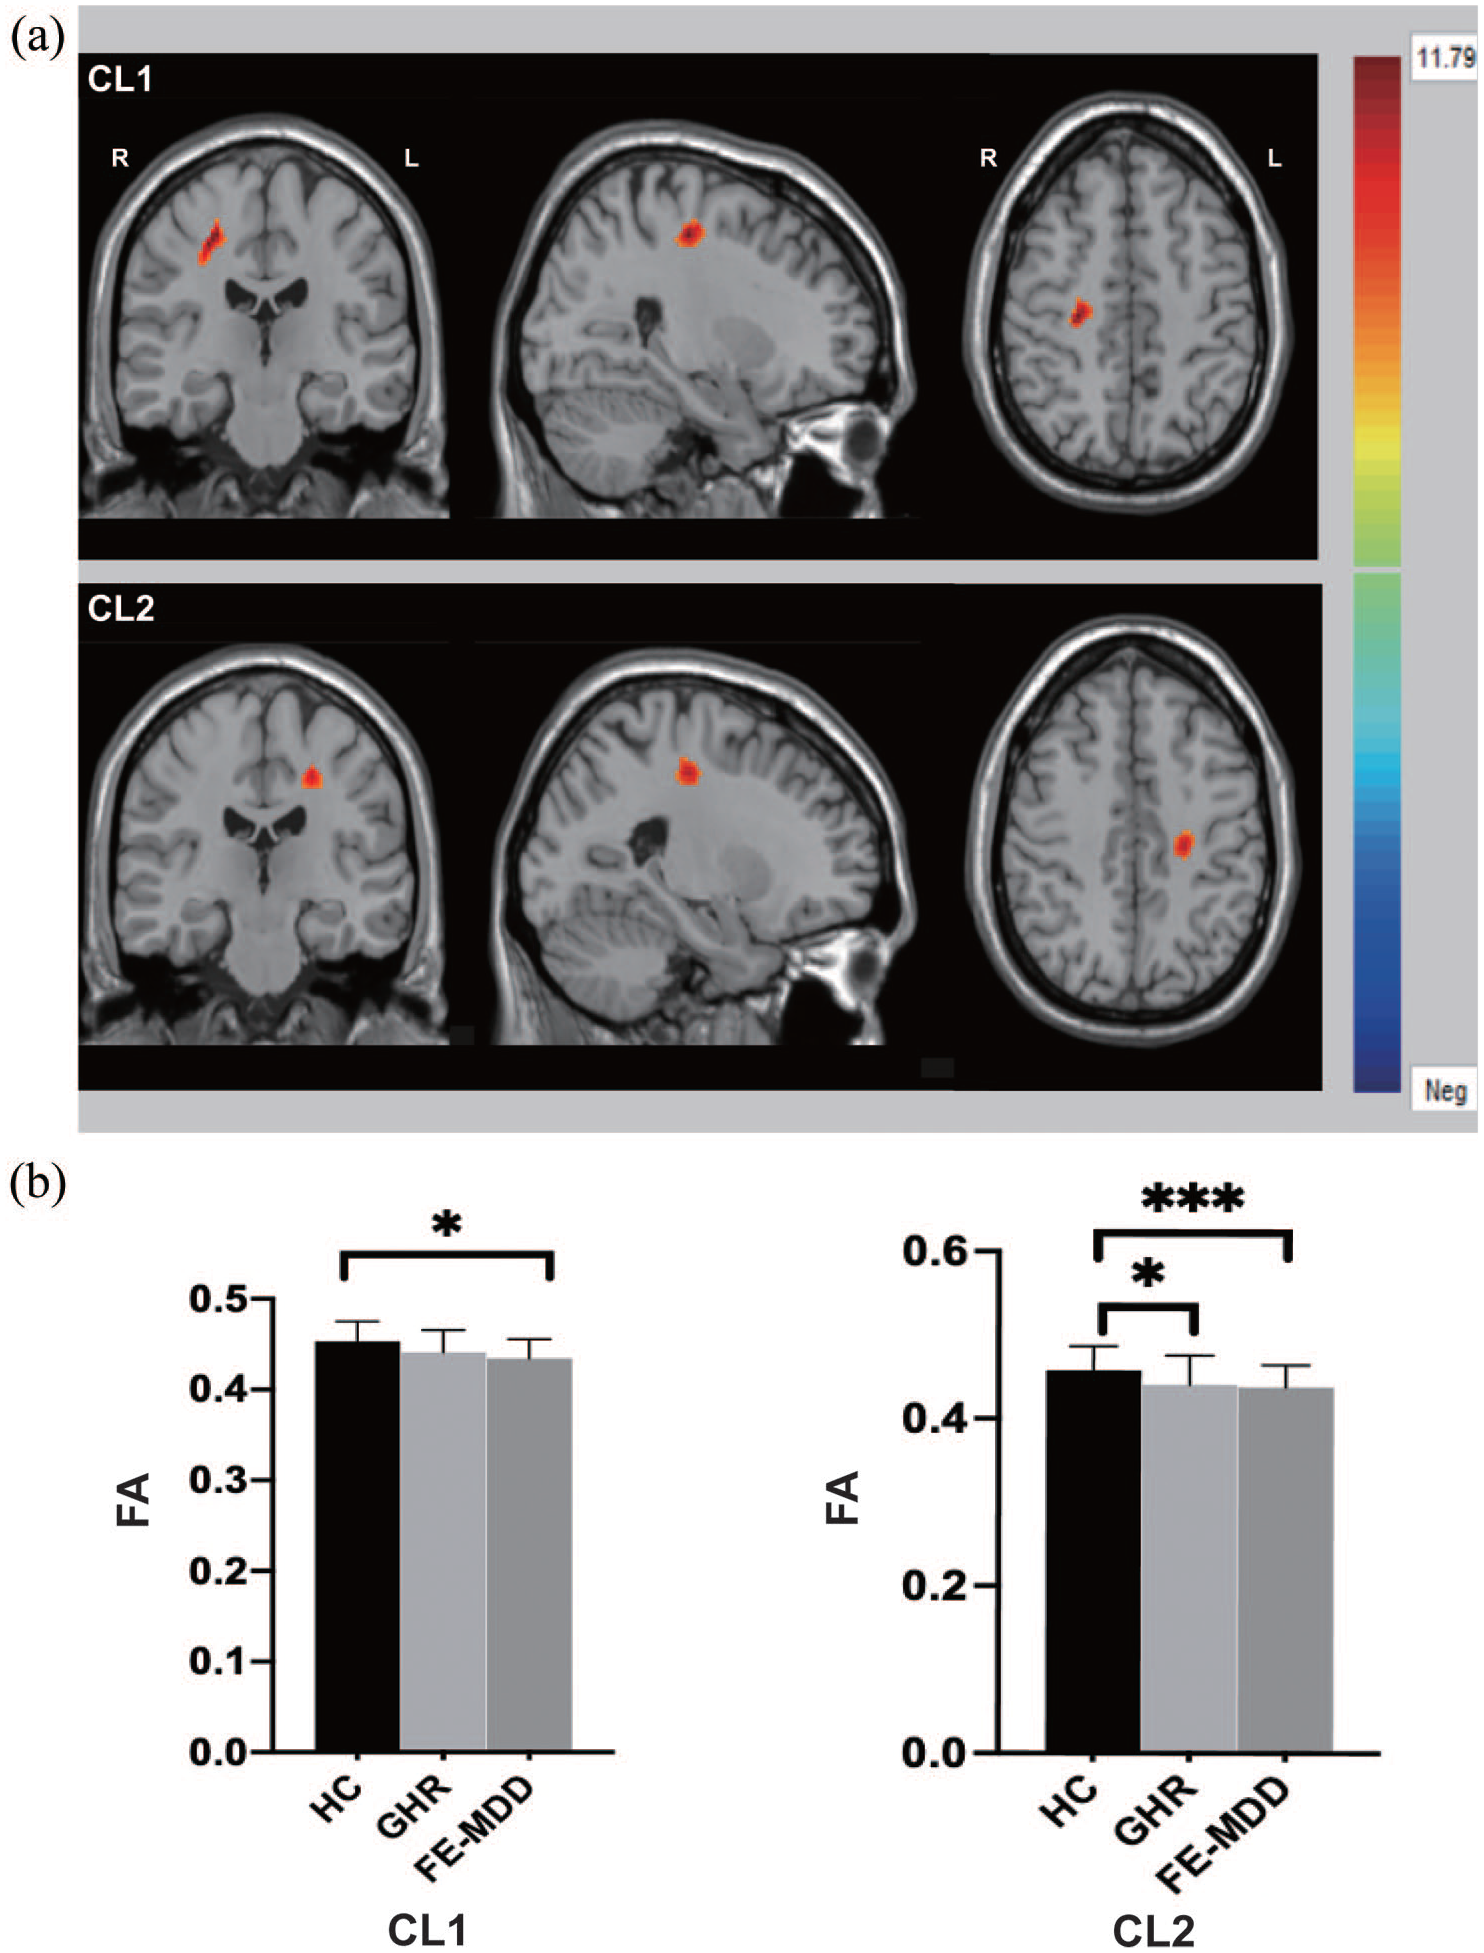
CL1: the right superior longitudinal fasciculus (SLF) and the right superior corona radiata. CL2: the left superior corona radiata, the left posterior corona radiata, the body of corpus callosum (CC) and the left SLF. (a) Significant differences in fractional anisotropy values among GHR, FE-MDD and healthy controls. Significant at p < 0.01 after GRF correction. (b) Post hoc analysis of fractional anisotropy values with significant differences among the three groups.
Comparison of metabolomics
Of 669 metabolic features that were detected from 148 subjects in our initial dataset, 474 lipids and lipid-related metabolites were selected for subsequent analyses. A total of 91 metabolites were significantly different among the three groups as determined by Kruskal–Wallis nonparametric test for the non-normal distributed metabolomics data. Further post hoc analysis revealed that 79 metabolites were altered in the FE-MDD group (Supplemental Table S1) and 27 in the GHR group (Supplemental Table S2) compared with HCs. Particularly, unsaturated fatty acids were found, accounting for the biggest proportion (22% and 44%) of the significantly altered metabolites both in the FE-MDD and GHR groups (Figure 2). In addition, only one metabolite, SM(d42:2(OH)), was significantly decreased in GHR in comparison to FE-MDD. The number of significant differential unsaturated fatty acids in FE-MDD group (FE-MDD vs HC) or in GHR group (GHR vs HC) sums up to 22, including 9 monounsaturated fatty acids (MUFAs), 8 polyunsaturated fatty acids (PUFAs) and 5 lipid peroxides (Table 2). The pathway analyses indicated that unsaturated fatty acid biosynthesis was significantly altered both in GHR and FE-MDD groups.
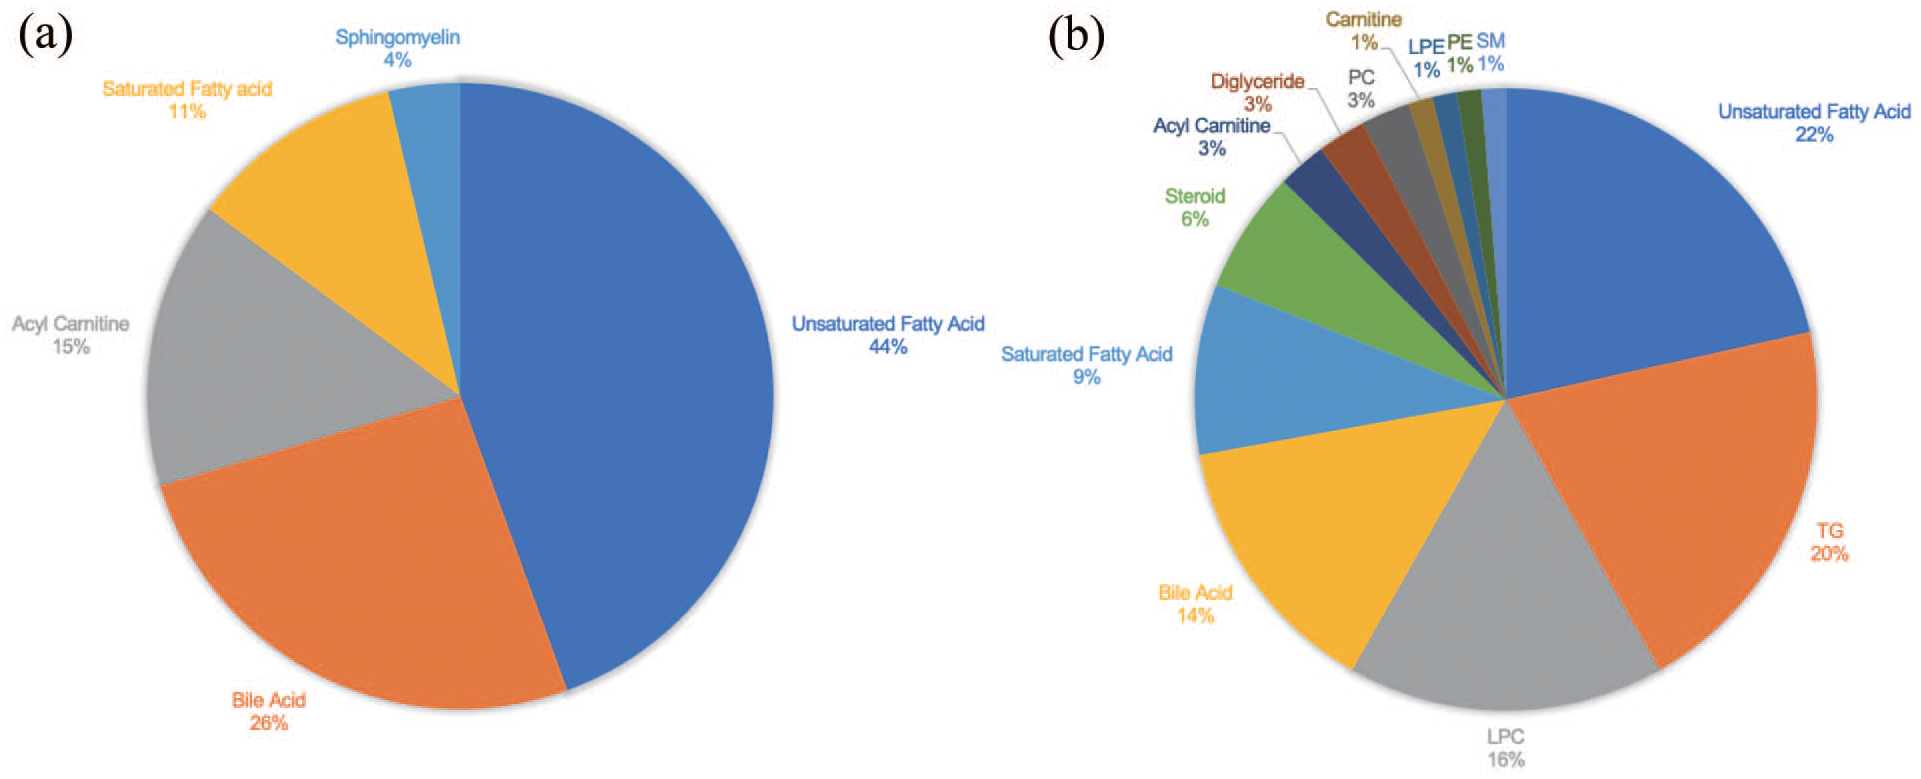
Unsaturated fatty acids took the biggest portions of metabolites significantly altered both in GHR vs HCs and in FE-MDD vs HCs. (a) Categories of 27 significantly altered lipids and lipid-related metabolites in GHR vs HCs. (b) Categories of significantly altered 79 lipids and lipid-related metabolites in FE-MDD vs HCs.
Twenty-two unsaturated fatty acids altered in GHR or FE-MDD group and their factor loadings after varimax rotation.
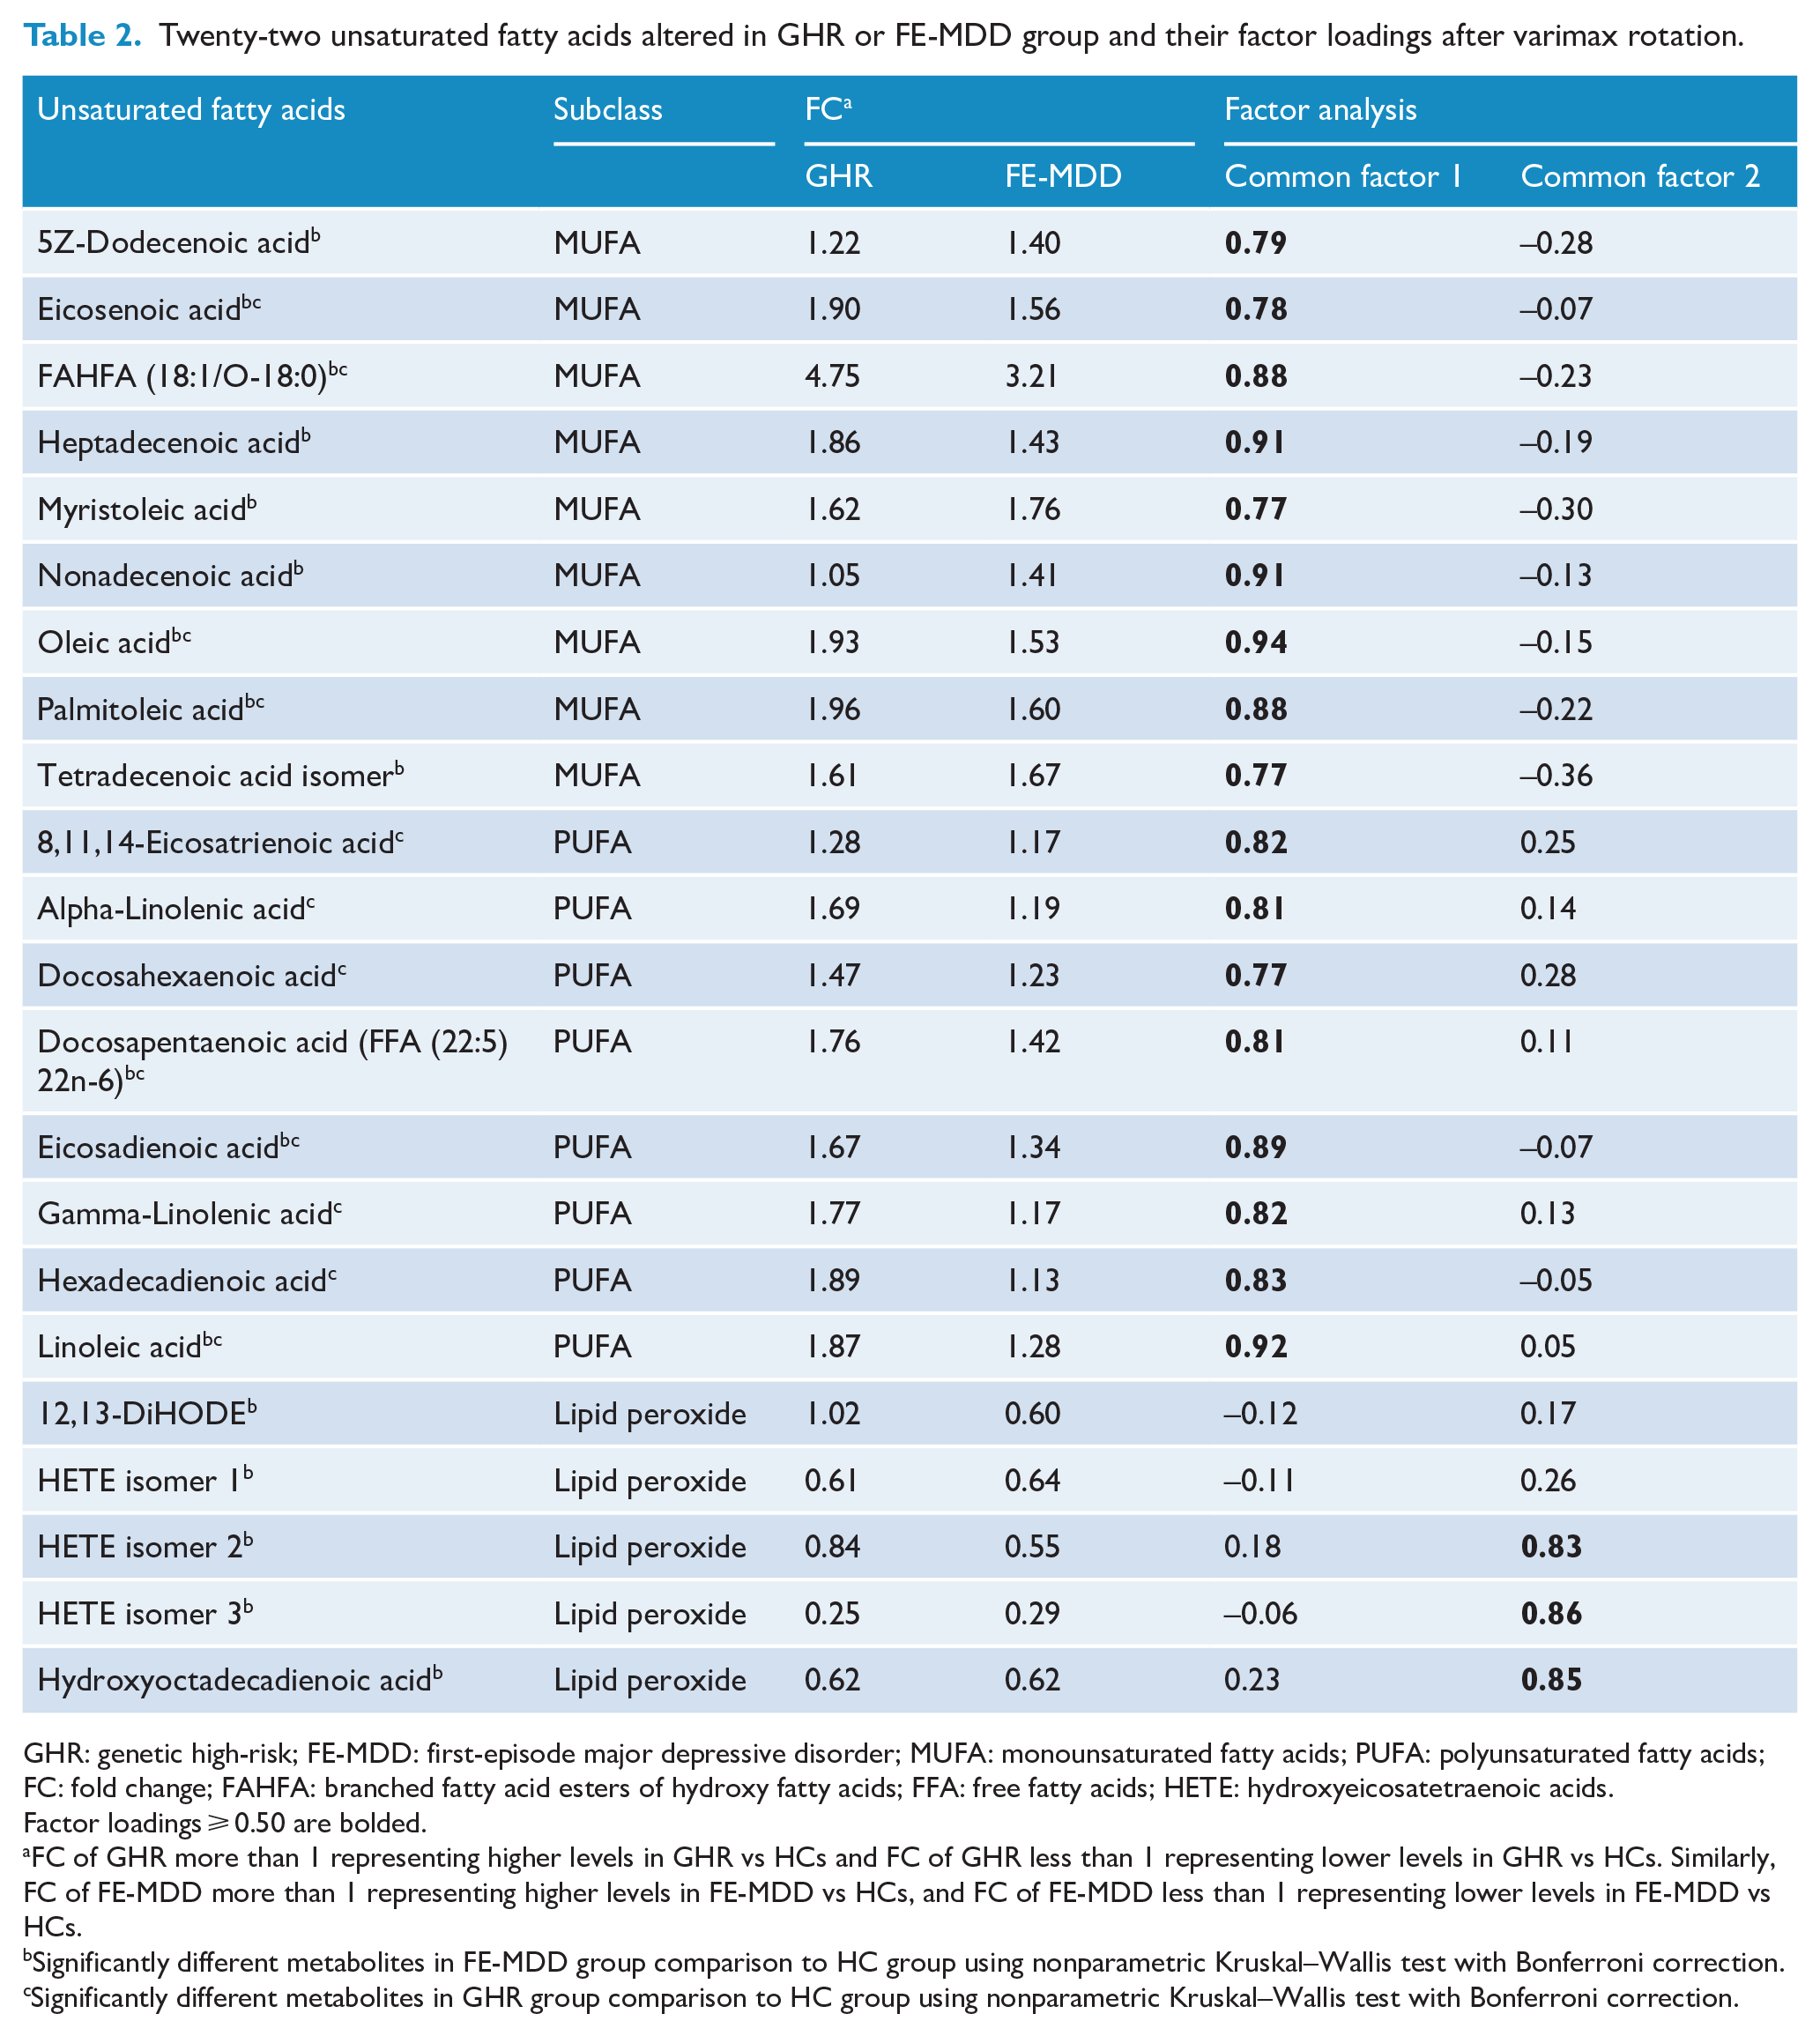
GHR: genetic high-risk; FE-MDD: first-episode major depressive disorder; MUFA: monounsaturated fatty acids; PUFA: polyunsaturated fatty acids; FC: fold change; FAHFA: branched fatty acid esters of hydroxy fatty acids; FFA: free fatty acids; HETE: hydroxyeicosatetraenoic acids.
Factor loadings ⩾ 0.50 are bolded.
FC of GHR more than 1 representing higher levels in GHR vs HCs and FC of GHR less than 1 representing lower levels in GHR vs HCs. Similarly, FC of FE-MDD more than 1 representing higher levels in FE-MDD vs HCs, and FC of FE-MDD less than 1 representing lower levels in FE-MDD vs HCs.
Significantly different metabolites in FE-MDD group comparison to HC group using nonparametric Kruskal–Wallis test with Bonferroni correction.
Significantly different metabolites in GHR group comparison to HC group using nonparametric Kruskal–Wallis test with Bonferroni correction.
Logistic regression analysis
Factor analyses were conducted separately for 2 FA values and 22 altered unsaturated fatty acids. Because results from two rotation methods are similar, we presented rotation results by varimax. Finally, 1 common factor for FA values and 2 common factors for 22 metabolites were extracted, explaining 81.63% and 68.61% of the variance, respectively. In terms of metabolites, the first common factor was interpreted by 17 unsaturated fatty acids (9 MUFA and 8 PUFA) and was named UFA. The second common factor was interpreted by three lipid peroxides and was named LPO (Table 2). For FA values, we named the common factor as DTI.
Common factors DTI (odds ratio, OR = 0.35), UFA (OR = 2.27) and LPO (OR = 0.41) were shown to be significantly related to FE-MDD in univariate logistic regression, but possible confounders showed no significance. Furthermore, these common factors were included in three logistic regression models as independent variables. In detail, Model 1 was established with common factor DTI (representing neuroimaging data) as independent variables, Model 2 with common factor UFA and LPO (representing lipid metabolite data), and Model 3 with common factor DTI, UFA and LPO (representing a combination of neuroimaging and lipid metabolite data). All independent variables in the three models were significantly related to FE-MDD, indicating the three common factors were independent predictors of depression. The AUC of Models 1, 2 and 3 were 0.74 (95% confidence interval [CI] = [0.66, 0.83]), 0.80 (95% CI = [0.73, 0.88]) and 0.86 (95% CI = [0.79, 0.92]), respectively. The optimal cut-off value (determined by the maximal Youden index) of Model 1 was 0.41 with a sensitivity of 0.68 and a specificity of 0.72, the cut-off value of Model 2 was 0.50 with a sensitivity of 0.79 and a specificity of 0.71, and Model 3 showed a relatively high diagnostic power (the cut-off value was 0.58 with a sensitivity of 0.79 and a specificity of 0.79) (Figure 3). Results from comparisons of AUCs indicated that Model 3 combining DTI and unsaturated fatty acids showed significantly greater AUC than Model 1 (p = 0.0009) and Model 2 (p = 0.03). AUCs between Model 1 and Model 2 showed no significant difference (p = 0.26). In addition, results from goodness-of-fit test showed the three models adequately fit the data. The results of cross-validation analysis demonstrated that logistic regression Model 3 combining differential DTI values and unsaturated fatty acids (Model 3, Accuracy = 0.75) showed better classification accuracy than Model 1 based on DTI (Model 1, Accuracy = 0.68) and Model 2 based on unsaturated fatty acid alone (Model 2, Accuracy = 0.69), verifying the reliability and accuracy of the combined diagnostic panel. Results from subsequent subgroup analysis indicated diagnostic potentials of DTI, UFA and LPO were not affected by medication. Table 3 represents the ORs and corresponding 95% CIs of the three factors.
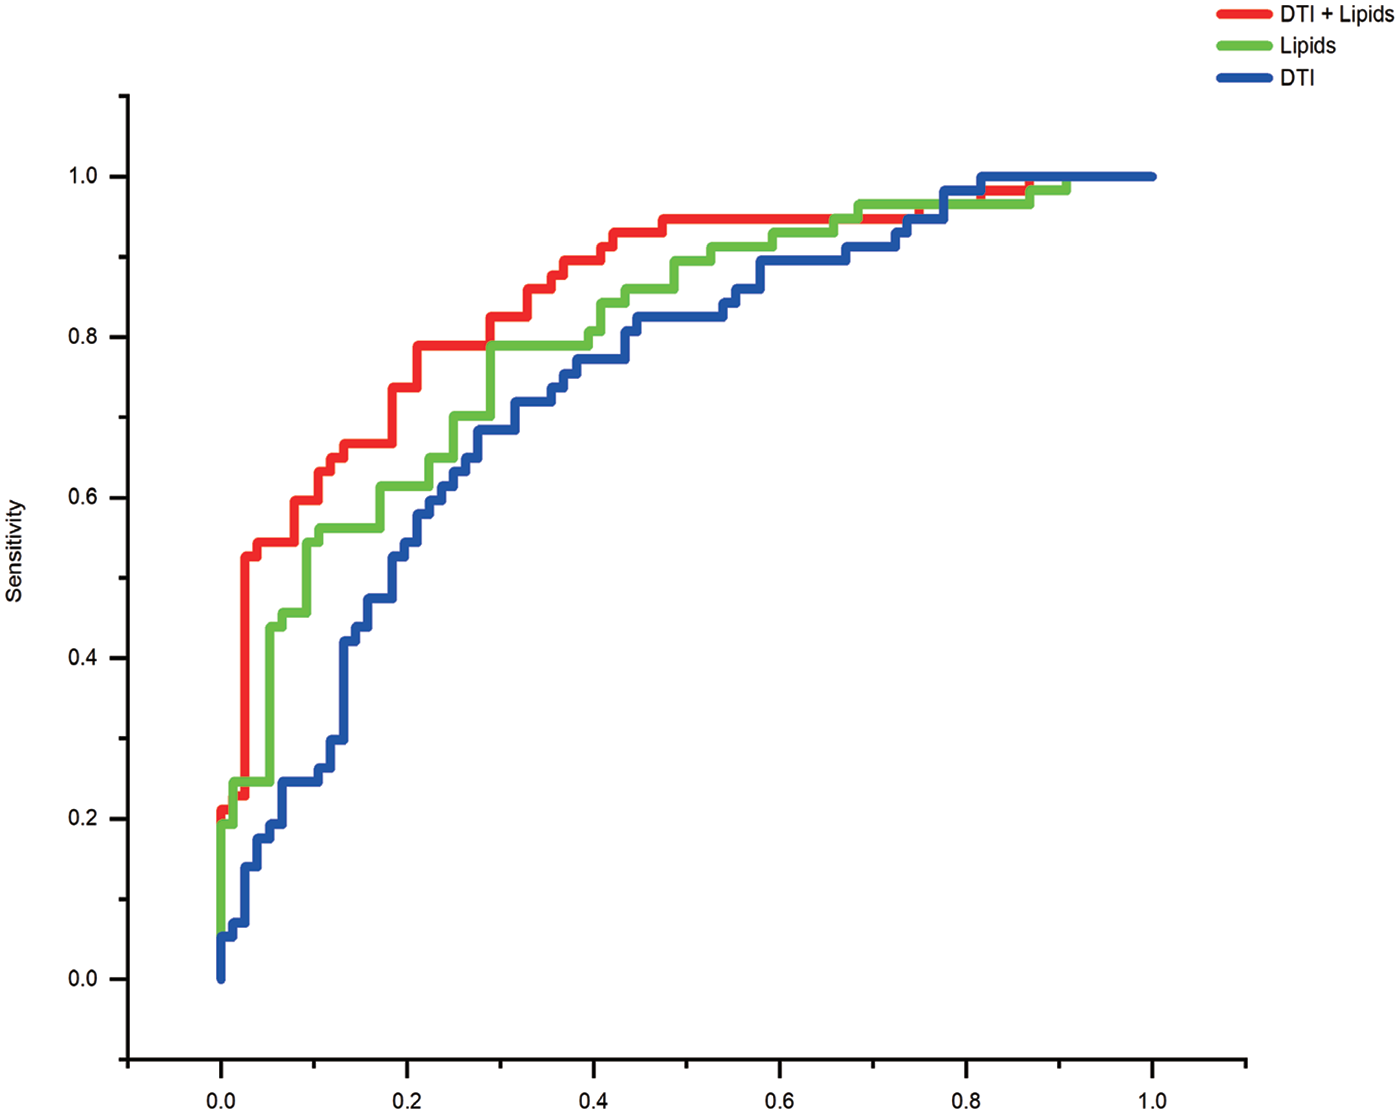
ROC curve of logistic regression models created using only DTI data (blue), only lipid data (green) and DTI data combined lipid data (red). A combined panel using DTI data and lipid data showed a higher diagnostic performance with an AUC of 0.86 than that only using DTI data with an AUC of 0.74 or that only using lipid data with an AUC of 0.80.
ORs and 95% CIs for FE-MDD risk based on logistic regression analyses.
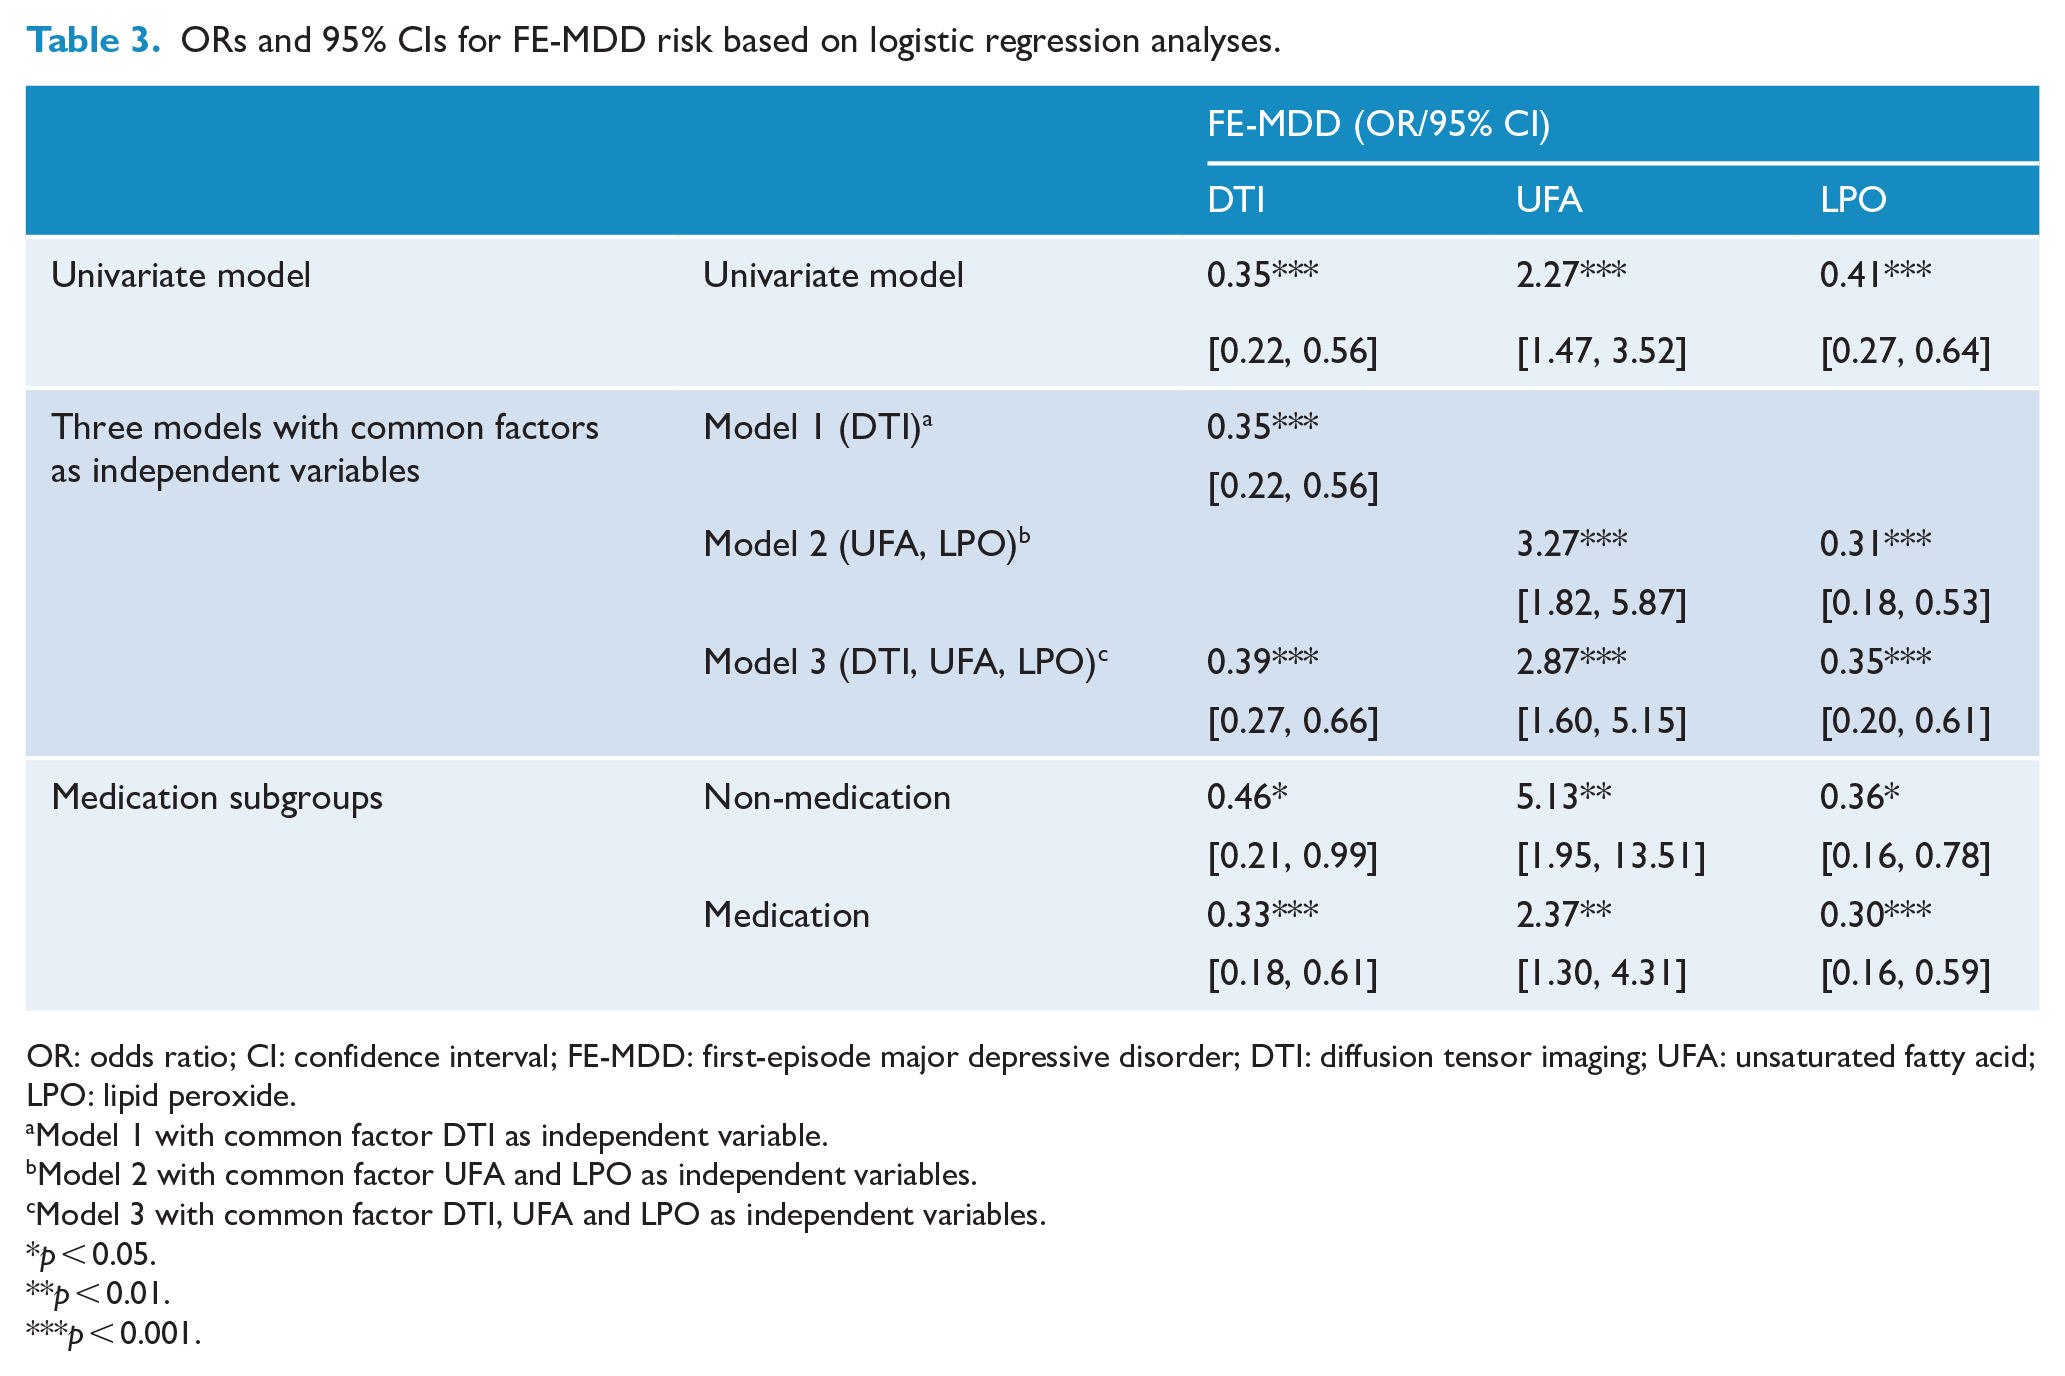
OR: odds ratio; CI: confidence interval; FE-MDD: first-episode major depressive disorder; DTI: diffusion tensor imaging; UFA: unsaturated fatty acid; LPO: lipid peroxide.
Model 1 with common factor DTI as independent variable.
Model 2 with common factor UFA and LPO as independent variables.
Model 3 with common factor DTI, UFA and LPO as independent variables.
p < 0.05.
p < 0.01.
p < 0.001.
Discussion
To the best of our knowledge, this is the first study to combine DTI imaging and global plasma lipid data in GHR individuals and FE-MDD patients, which focused on those in the earliest stage of depression. FE-MDD showed disturbed WM tracts within bilateral superior corona radiata, the left posterior corona radiata, bilateral SLF and the CC body. That disturbance was also found in GHR, but the difference was more subtle and restricted to left corona radiata. Regarding lipid metabolism, similar dysregulation of unsaturated fatty acid metabolism was observed both in GHR and in FE-MDD subjects. Furthermore, the combinatorial biological marker panel of DTI and unsaturated fatty acids showed potential for early MDD identification, with significantly greater classification power than that using either measure alone. These findings indicate that decreased WM integrity, especially in left corona radiata, and elevated unsaturated fatty acids may be endophenotypes of genetic susceptibility and represent trait-related features of the illness. Including endophenotypic markers and integrating data from neuroimaging and biochemistry may be a promising direction for aiding in depression diagnosis.
Alterations of WM and unsaturated fatty acid metabolism are related to the etiology of depression
In line with findings of major DTI studies and our previous findings on MDD subjects (Liang et al., 2019; Wei et al., 2020a), abnormalities of WM integrity within bilateral superior corona radiata, the left posterior corona radiata, bilateral SLF and the CC body were observed in FE-MDD. A similar disturbance in these tracts was also found in GHR but was more subtle and restricted to left corona radiata. Investigation of GHR has important implications for elucidating endophenotypic features associated with a genetic vulnerability to MDD. Genetic factors explain about 50–90% of FA’s variance in a large portion of the WM (Chiang et al., 2009). However, to date, little attention has been paid to alterations of WM integrity in individuals with a genetic predisposition to MDD. A study by Huang and colleagues reported lower FA values in CC and SLF in adolescents at GHR for MDD, which is different from our GHR group (decreased but not significant FA values in CC and SLF, significantly decreased FA values in left corona radiata). Huang included adolescents with an age range from 13 to 18 years, and the age difference with participants in the present study might account for the discrepancy in results. A follow-up study reported WM abnormalities in MDD patients and their unaffected offspring and theorized such abnormalities to be a brain-based endophenotype (Peterson and Weissman, 2011). CC abnormalities may be associated with aberrant interhemispheric synchrony, impaired working memory capacity and speed (Fling et al., 2011; Knott et al., 2001). The corona radiata is a key structural component of the limbic-thalamocortical circuitry that plays a major role in cognitive and emotional regulation involved in the pathophysiology of MDD (Drevets et al., 2008; Ping et al., 2019). A prior DTI study reported WM abnormalities in the CC and SLF associated with increased depressive symptom severity (Cole et al., 2012). Collectively, the above evidence in conjunction with our results indicates that disrupted WM tracts, especially in left corona radiata, might be an endophenotype related to genetic liability for depression and involved in the etiological process of illness.
Another similar change observed in the GHR and FE-MDD groups was the dysregulation of unsaturated fatty acid metabolism. Unsaturated fatty acids (UFAs) are vital for brain structure and function, especially for the myelin sheath. Chemically, UFAs can be classified into MUFAs (with one double bond) and PUFAs (with multiple double bonds), and the latter ones are mainly classed into n–3 PUFAs and n–6 PUFAs. Approximately one-third of the lipids in the CNS are long-chain PUFAs (Bogie et al., 2020). As far as we know, the present study was the first to report altered UFAs in individuals with high genetic risk for MDD. Both GHR and FE-MDD groups were observed to have significantly elevated UFAs, suggesting this might also be a stable endophenotypic feature related to illness onset. MUFAs demonstrated reduced neuroinflammation both in vitro and in vivo. Particularly, MUFA palmitoleic acid and oleic acid were widely scrutinized for their neuroprotective effects (Song et al., 2019; Suzuki et al., 2012). PUFA alterations are well known both in MDD and in other neuropsychiatric disorders (Messamore et al., 2017). There is clear evidence that n–3 PUFA acts as an antioxidant, anti-inflammatory and neurogenesis promoter. Furthermore, epidemiological evidence suggested that greater habitual dietary n–3 PUFA intake is associated with reduced prevalence rates for MDD and reduces the depression symptom severity (Su et al., 2003).
In contrast, the pro-inflammatory and anti-inflammatory properties of n–6 PUFAs remain controversial in the neuropsychiatric disorder field. It is possible that n–6 PUFAs are neurotoxic in excess but necessary for early brain development (Bogie et al., 2020). In addition to elevated MUFA and PUFA, the FE-MDD group showed decreased lipid peroxides. Lipid peroxides, which are peroxidation byproducts of PUFA metabolism, promote the generation of reactive oxygen species (ROS), boost neuroinflammation and induce cell death (Gaschler and Stockwell, 2017). Distinct from our result in first-episode adult MDD subjects, most other MDD studies reported low oleic acid, palmitoleic acid and linoleic acid, and high levels of lipid peroxides (Pu et al., 2020). However, our study selected first-episode MDD participants, targeting primary neuropathological processes nearest the initial symptom onset. That may be the reason our results were inconsistent with other MDD studies. Other methodological approaches, including current treatment, medication history and heterogeneity of biological samples (plasma, serum and the cellular components), may have contributed to the discrepancy. A recent study by Zhou et al. reported low palmitoleic acid, oleic acid, linoleic acid and alpha-linolenic acids in children with a first depressive episode (Zhou et al., 2019). These conflicting results probably derive from a pathophysiological difference of MDD between children and adults. Collectively, it appears that changes to UFA metabolism (elevation of neuroprotective MUFA and PUFA and reduction of neurotoxic lipid peroxides) manifest in the earliest stage of illness. Considering our results and explanation above, we propose a hypothesis that altered UFA metabolism acts as a protective factor during the transition to depression onset.
DTI combined with unsaturated fatty acids for early identification of MDD
Our results from logistic regression analysis indicated that reduction of WM integrity in CC, SLF and corona radiata, decreased lipid peroxides, and elevated unsaturated fatty acids might be independent predictors for FE-MDD. The predictive potential of these common factors was not substantially affected by medication, which suggests these three features were relatively reliable and robust. Endophenotype is more proximal to underlying pathophysiological mechanisms than behavior and symptoms, which provide a concrete bridge going from transient clinical phenotypes to genetics. Recently, endophenotypes have been suggested as an aid to illness diagnosis. As mentioned above, deficits of WM integrity in CC, SLF and corona radiata and altered unsaturated fatty acid metabolism might be endophenotypic features manifesting irrespective of illness stages. Our results suggest these endophenotypes could be stable enough to serve as a candidate for differentiating MDD. There is overwhelming evidence in the biomarker literature suggesting that WM deficits and lipids appear to link with MDD and be utilized as potential biomarkers, respectively (Parekh et al., 2017; Schneider et al., 2011). Regrettably, so far, no emphasis has been put on integrating single biosignatures of neuroimaging and lipid profiles into a combinatorial panel for MDD diagnosis. In the present results, we found that a combination of DTI data and lipid metabolite data achieved significantly greater diagnostic performance than using either alone, which was demonstrated by cross-validation test. Biomarker panels involving these endophenotypes showed strong discriminative power, indicating that a good biomarker panel could mirror the underlying key etiological process and reading the illness pathophysiology from various aspects. Both neuroimaging and metabolite information can be easily obtained with minimal invasiveness (Parekh et al., 2017). Our biological marker panel might be applied for assisting in the accurate and efficient diagnosis of MDD in daily clinical practice.
Limitations
There are several limitations in our study. First, the findings depend upon the cross-sectional design. We cannot confirm that the pattern of alterations of WM and unsaturated fatty acid metabolism is progressive in the transition from the GHR to the onset of MDD. Further longitudinal studies could help in tracking the dynamic change of WM integrity and lipid metabolism. Second, regarding alterations of unsaturated fatty acid metabolism, it remains unclear where the dysfunction occurs in the pathway. Further integrated analysis, including proteomics and genomics and other system-level data, is required to scrutinize this pathway’s critical role in the biological underpinnings of MDD. Third, the relatively small sample size in the GHR group imposes some restrictions on our potential conclusions. Thus, our results of GHR require replication by further studies with a sufficiently large GHR cohort. Finally, considering no independent sets, we assessed our diagnostic panel within the sample by a fivefold cross-validation test. To improve accuracy and precision, corresponding investigations should be undertaken based on MDD animal models or another independent patient group.
Conclusion
Trait-related deficits of WM integrity within specific brain regions and altered unsaturated fatty acid metabolism have the potential to be reliable predictors for MDD. A combinatorial biological marker panel derived from DTI data and global lipid data may help identify early depressive patients. Our preliminary study creates an opportunity for future studies to integrate stable endophenotypic markers into the diagnosis process of MDD. Further studies are warranted to confirm our findings and demonstrate the current diagnostic panel’s accuracy and clinical usage.
Supplemental Material
sj-docx-1-anp-10.1177_00048674211031477 – Supplemental material for Combinatorial panel with endophenotypes from multilevel information of diffusion tensor imaging and lipid profile as predictors for depression
Supplemental material, sj-docx-1-anp-10.1177_00048674211031477 for Combinatorial panel with endophenotypes from multilevel information of diffusion tensor imaging and lipid profile as predictors for depression by Juan Liu, Zhuang Liu, Yange Wei, Yanbo Zhang, Fay Y Womer, Duan Jia, Shengnan Wei, Feng Wu, Lingtao Kong, Xiaowei Jiang, Luheng Zhang, Yanqing Tang, Xizhe Zhang and Fei Wang in Australian & New Zealand Journal of Psychiatry
Footnotes
Author Contributions
F.W. designed, conceptualized and supervised the study. J.L., Z.L. and X.Z. participated in the statistical analyses, data interpretation and the manuscript preparation. F.Wu., L.K., Y.W., J.D., S.W., X.J., L.Z. and Y.T. have participated in the data acquisition and analyses. Y.Z. and F.Y.W. took part in the data interpretation and the manuscript preparation. All authors contributed to the article and approved the manuscript submission.
Declaration of Conflicting Interests
The author(s) declared no potential conflicts of interest with respect to the research, authorship and/or publication of this article.
Funding
The author(s) disclosed receipt of the following financial support for the research, authorship and/or publication of this article: This work was supported by National Science Fund for Distinguished Young Scholars (81725005 to F.W.), Liaoning Education Foundation (Pandeng Scholar to F.W.), Innovation Team Support Plan of Higher Education of Liaoning Province (LT2017007 to F.W.), Major Special Construction Plan of China Medical University (3110117059 and 3110118055 to F.W.), National Natural Science Foundation Regional Innovation and Development Joint Fund (U20A6005 to F.W.), National Key R&D Program of China (2018YFC1311600 and 2016YFC1306900 to Y.T.), Liaoning Revitalization Talents Program (XLYC1808036 to Y.T.), Science and Technology Plan Program of Liaoning Province (2015225018 to Y.T.), Joint Fund of National Natural Science Foundation of China (U1808204 to F.W.) and Natural Science Foundation of Liaoning Province (2019-MS-05 to F.W.).
Supplemental Material
Supplemental material for this article is available online.
References
Supplementary Material
Please find the following supplemental material available below.
For Open Access articles published under a Creative Commons License, all supplemental material carries the same license as the article it is associated with.
For non-Open Access articles published, all supplemental material carries a non-exclusive license, and permission requests for re-use of supplemental material or any part of supplemental material shall be sent directly to the copyright owner as specified in the copyright notice associated with the article.