
Abstract
Background:
Working memory deficits are a common feature in major depressive disorder and are associated with poor functional outcomes. Intact working memory performance requires the recruitment of large-scale brain networks. However, it is unknown how the disrupted recruitment of distributed regions belonging to these large-scale networks at the whole-brain level brings about working memory impairment seen in major depressive disorder.
Methods:
We used graph theory to examine the functional connectomic metrics (local and global efficiency) at the whole-brain and large-scale network levels in 38 patients with major depressive disorder and 41 healthy controls during a working memory task. Altered connectomic metrics were studied in a moderation model relating to clinical symptoms and working memory accuracy in patients, and a machine learning method was employed to assess whether these metrics carry enough illness-specific information to discriminate patients from controls.
Results:
Global efficiency of the frontoparietal network was reduced in major depressive disorder (false discovery rate corrected, p = 0.014); this reduction predicted worse working memory performance in patients with less severe illness burden indexed by Brief Psychiatric Rating Scale (β =–0.43, p = 0.035, t =–2.2, 95% confidence interval = [–0.043,–0.002]). We achieved a classification accuracy and area under the curve of 73.42% and 0.734, respectively, to discriminate patients from controls based on connectomic metrics, and the global efficiency of the frontoparietal network contributed most to the diagnostic classification.
Conclusions:
We report a putative mechanistic link between the global efficiency of the frontoparietal network and impaired n-back performance in major depressive disorder. This relationship is more pronounced at lower levels of symptom burden, indicating the possibility of multiple pathways to cognitive deficits in severe major depressive disorder.
Introduction
Major depressive disorder (MDD), characterized by low self-esteem, loss of interest in normally enjoyable activities and low energy, is the second largest cause of disability worldwide. In addition to mood changes, notable neurocognitive impairments also occur in patients with MDD (Ahern and Semkovska, 2017), affecting a large number of cognitive domains including processing speed, learning and memory. Neurocognitive impairments predict poor response to treatment (Roiser et al., 2011), and ‘cognitive remission’ is increasingly discussed as a therapeutic target to improve functioning and prevent relapses in MDD (Bortolato et al., 2016).
Of the various neurocognitive deficits, working memory (WM) deficits, the failure to represent, maintain and update information in a short term (Baddeley, 1992), have been observed both in acute depression and in a proportion of patients after remission from psychopathological symptoms (Reppermund et al., 2009). Patients with MDD exhibit delayed reaction time accompanied by reduced accuracy of WM performance when compared with healthy controls (HCs) (Rose and Ebmeier, 2006). Such WM deficits significantly correlate with the number of hospitalizations and the longitudinal course of the depressive illness (Harvey et al., 2004).
Previous studies investigating the neurobiological mechanism of impaired WM in MDD implicate extensive brain regions. Patients with MDD display abnormal prefrontal, parietal, temporal, occipital and subcortical activation during WM tasks (Wang et al., 2015; Yuksel et al., 2018). This pattern indicates an aberration in the co-activations of diverse regions, related to aberrant pattern of large-scale information-processing networks that underwrite task performance. For example, the failure to suppress the default-mode network (DMN) (Bartova et al., 2015) and the hypoconnectivity of the frontoparietal network (FPN) has been observed in patients with MDD during WM processing (Vasic et al., 2009). As a flexible hub of cognitive control (Zanto and Gazzaley, 2013), FPN plays a crucial role in the top-down modulation of attention preparation and orientation during WM processing (Wallis et al., 2015), and the integrity of its microstructural connectivity seems to predict WM performance (Burzynska et al., 2011). Relevant to this work, mounting evidence suggests a prominent role for both cingulo-opercular (Huang et al., 2020) and FPN abnormalities in the WM deficits of MDD (Vasic et al., 2009; Yuksel et al., 2018).
Many previous studies that explored the neuroimaging correlates of the WM deficits in MDD have failed to study task-related disruptions that occur at a more systemically organized connectomic level. Nevertheless, the functional connectome topology has been acknowledged to be critical for understanding clinical symptoms (Gong and He, 2015), on one hand, and cognitive impairment (Sheffield et al., 2017), on the other, as system-level disruptions are more sensitive markers of emergent functions such as cognition and behavior (Bullmore and Sporns, 2012). We have previously employed graph theory and reported a mechanistic link between connectome topology and impaired n-back performance in schizophrenia and bipolar disorder (Yang et al., 2020a, 2020b), and further found the moderating effect of connectome properties on the relationship between clinical symptoms and WM performance. In fact, irrespective of the diagnosis, the severity of certain psychiatric symptoms such as lack of motivation, apathy and anhedonia (negative symptoms as determined by Brief Psychiatric Rating Scale [BPRS]) relates to cognitive dysfunction (Zhu et al., 2019). In other words, lack of effort may occur in the presence of high symptom severity, affecting WM performance, while in the presence of low symptom burden, an extensive connectomic disruption may be required to produce the same degree of WM deficits. We tested the hypothesis that the relationship between clinical symptom burden and WM performance in MDD is moderated by task-related connectome properties.
The human brain appears to possess a high efficiency for information transfer to adapt to a complicated and changeable environment (Bullmore and Sporns, 2012). We assess whether putative measures of this information transfer efficiency are altered in patients with MDD during WM processing. In network science, ‘local efficiency’ and ‘global efficiency’ are the most intuitive network properties to measure the information transfer efficiency. Local efficiency denotes the mean local efficiency of information transfer in the immediate neighborhood of each node or the fault tolerance of a network in terms of local information processing (Latora and Marchiori, 2001), and global efficiency denotes the overall capacity for parallel information transfer and integrated processing (Bullmore and Sporns, 2012). The associations between global and local efficiency with cognition have been highlighted in previous studies (Sheffield et al., 2015), and it has been reported that patients with MDD showed altered global and local efficiency of the whole-brain and large-scale networks in both resting-state studies (Meng et al., 2014; Wang et al., 2017) and when performing tasks involving emotion processing (Park et al., 2014). However, it is unclear whether the functional connectomic metrics are aberrant when performing a WM task in patients with MDD.
This study aimed to investigate the functional connectome of patients with MDD during WM performance. To this end, we constructed weighted networks from 2-back WM functional magnetic resonance imaging (fMRI) data. Given our prior observation of bipolar depression and the prior reports from other groups using resting-state fMRI studies (Meng et al., 2014; Wang et al., 2017), we expected reduced global but increased local efficiency in MDD. This pattern would indicate a reduced connectome-level integration but an increased network-level segregation affecting task performance. Given the critical role of frontoparietal and cingulo-opercular networks in the n-back task, we also hypothesized that the changes in connectomic properties will specifically involve these networks. We also explored whether clinical symptoms were associated with WM performance and whether this relationship will be influenced by altered global and local efficiency of brain networks. Finally, we employed a Support Vector Machine (SVM) approach to test whether the topological metrics from WM fMRI data carry sufficient illness-specific information to discriminate the patterns observed in a patient with MDD from that of controls.
Methods and materials
Participants
All study procedures were approved by the medical ethics committee of the Second Xiangya Hospital, Central South University. Before obtaining consent, the capacity to provide informed consent of all potential participants was ascertained by two licensed psychiatrists. All participants were right-handed native Chinese speakers and they were provided written informed consent for the protocols approved by the Department of Psychiatry, the Second Xiangya Hospital of Central South University, China. All study procedures were conducted in strict accordance with the Declaration of Helsinki.
The study cohort comprised 48 patients with MDD and 48 HCs matched for age and gender. Patients were confirmed to meet the DSM-IV (Diagnostic and Statistical Manual of Mental Disorders, 4th edition) criteria for MDD (First et al., 1995). Diagnostic procedures include medical history information collected from patients and their families, as well as careful medical, neurological and psychiatric examinations performed by a clinical psychiatrist. Clinical symptoms were assessed with the 17-item Hamilton Depression Rating Scale (HAMD) (Hamilton, 1960), Hamilton Anxiety Rating Scale (HAMA) (Hamilton, 1959), and the BPRS (John and Overall, 1962) for patients with MDD. Details are presented in Table 1. Patients with MDD were excluded if they met the following criteria: (1) aged less than 18 years or greater than 45 years; (2) previous electroconvulsive therapy and any other contraindications to magnetic resonance imaging (MRI); (3) history of alcohol or substance abuse except nicotine; (4) chronic neurological disorders or debilitating physical illness; and (5) benzodiazepine treatment, if any, stopped less than 24 hours before scanning.
Demographic, neuropsychological and behavioral data.
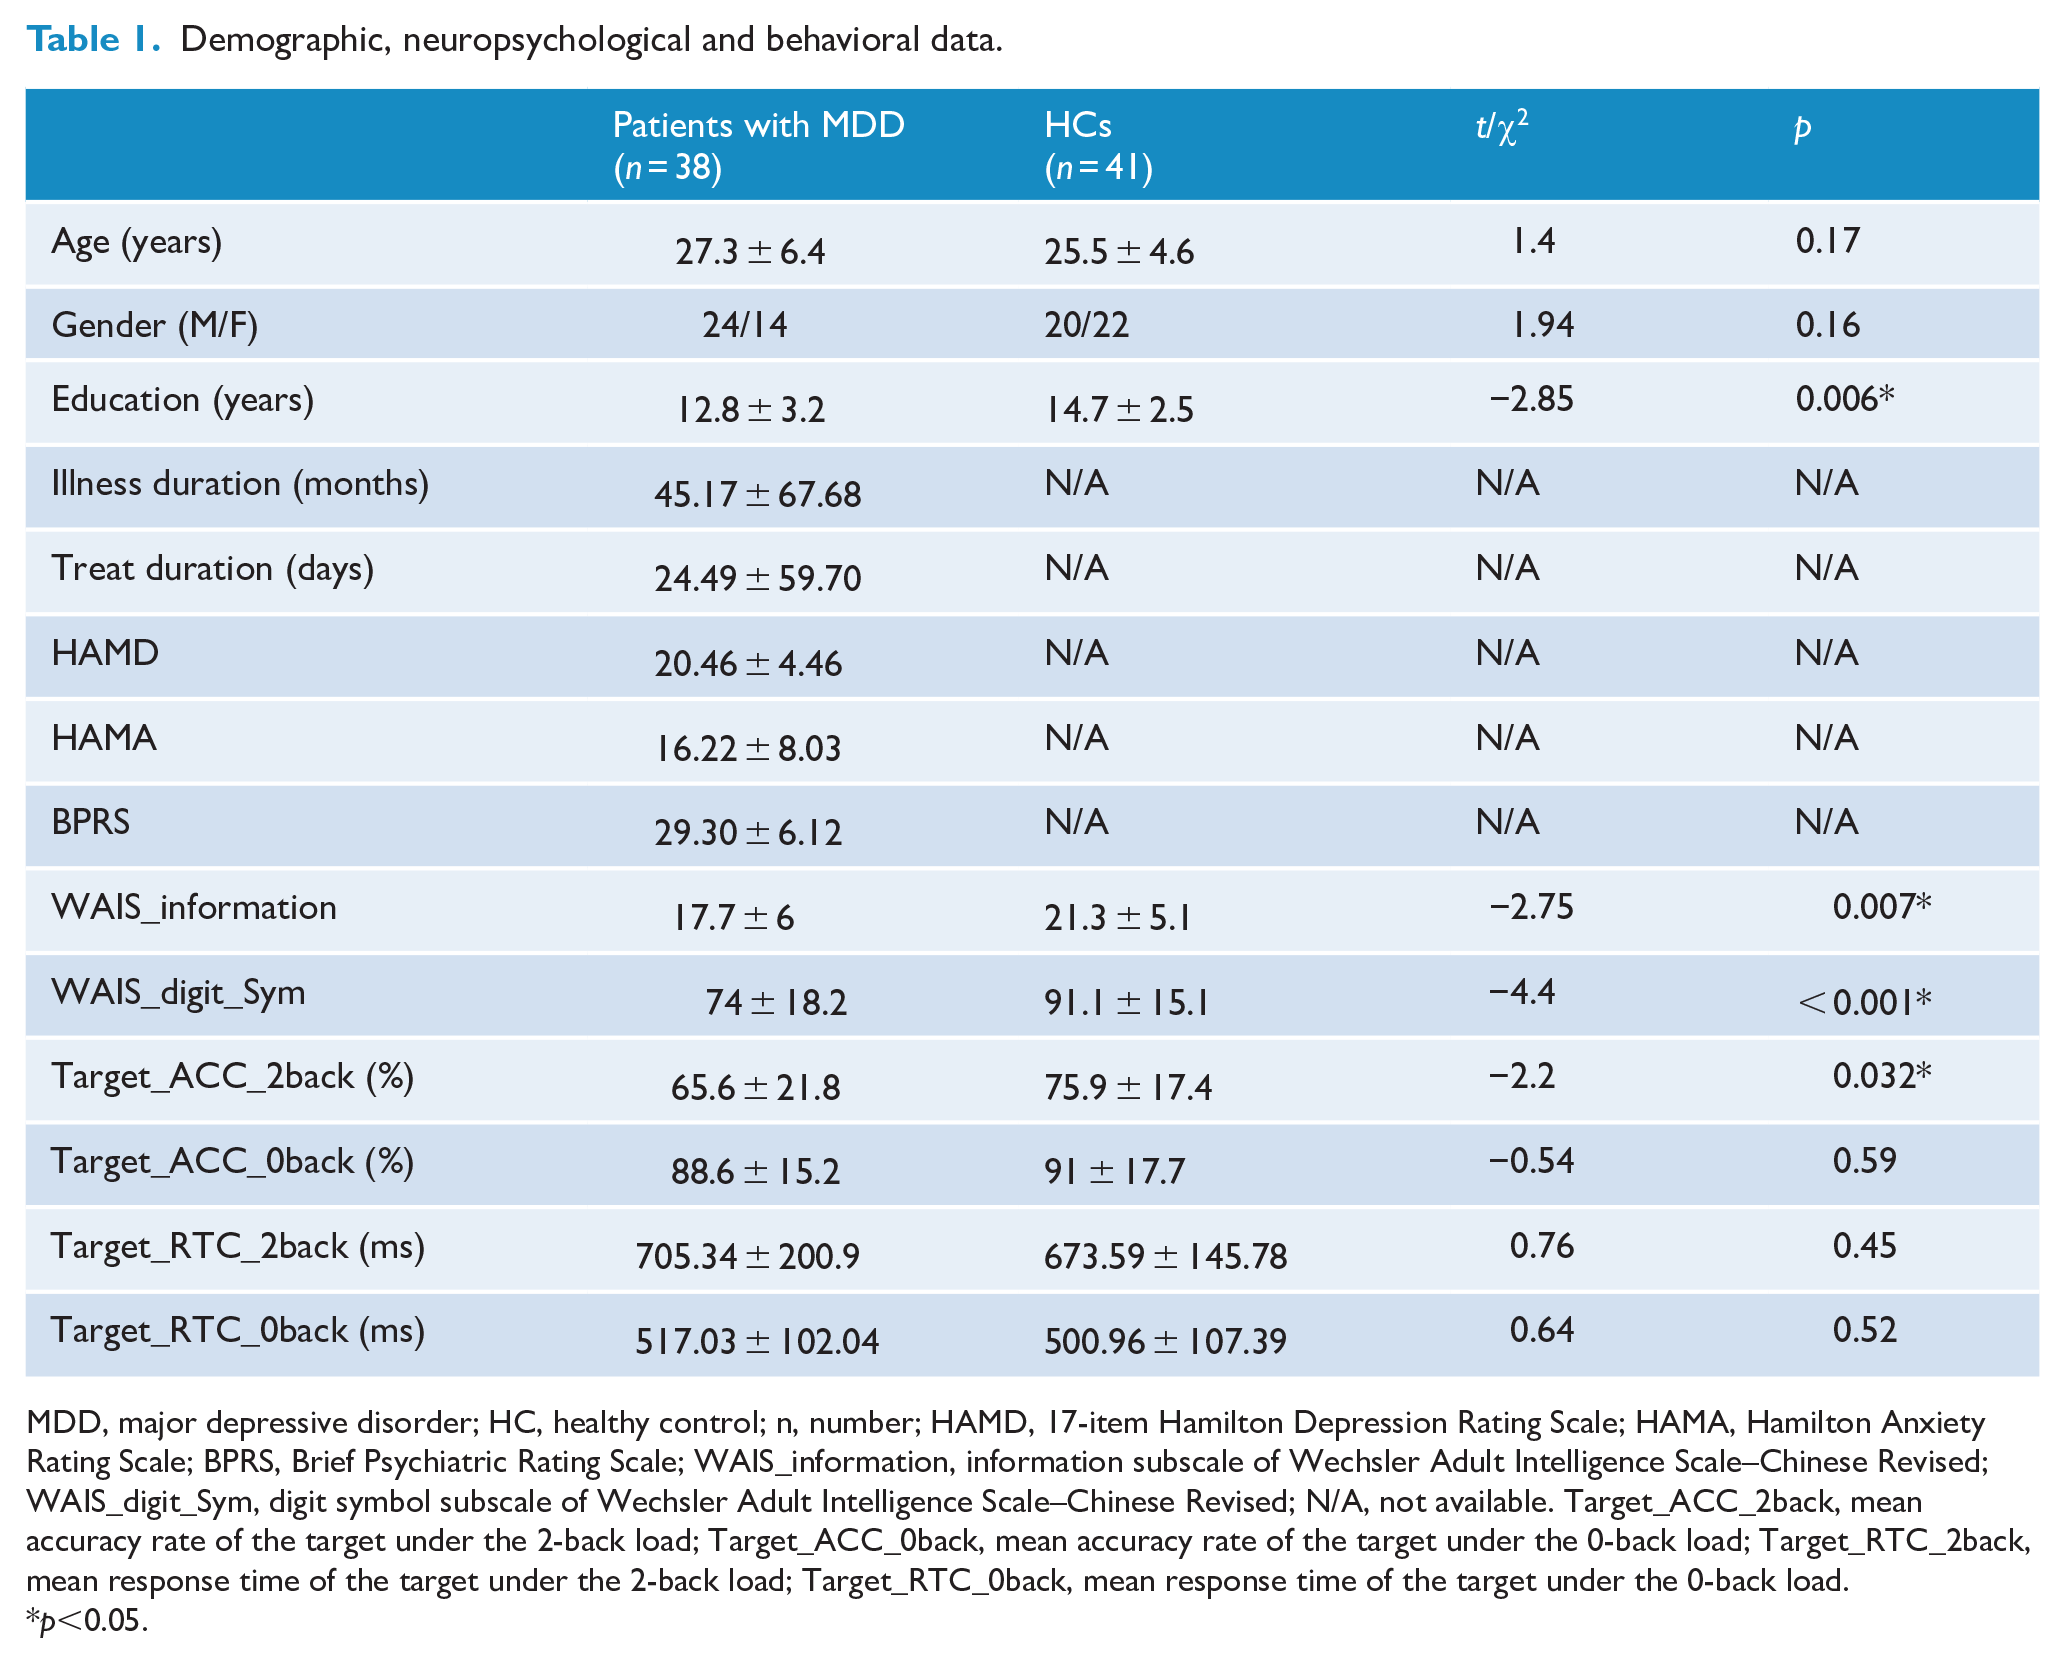
MDD, major depressive disorder; HC, healthy control; n, number; HAMD, 17-item Hamilton Depression Rating Scale; HAMA, Hamilton Anxiety Rating Scale; BPRS, Brief Psychiatric Rating Scale; WAIS_information, information subscale of Wechsler Adult Intelligence Scale–Chinese Revised; WAIS_digit_Sym, digit symbol subscale of Wechsler Adult Intelligence Scale–Chinese Revised; N/A, not available. Target_ACC_2back, mean accuracy rate of the target under the 2-back load; Target_ACC_0back, mean accuracy rate of the target under the 0-back load; Target_RTC_2back, mean response time of the target under the 2-back load; Target_RTC_0back, mean response time of the target under the 0-back load.
p<0.05.
HCs were recruited using the Structured Clinical Interview for DSM-IV Axis I Disorders, Research Version, Non-patient Edition (SCID-I/NP). The inclusion and exclusion criteria for HCs were the same as those for patients except that they did not meet the Diagnostic and Statistical Manual of Mental Disorders, 5th edition (DSM-5) criteria for any mental disorders, and their first-degree relatives had no history of any psychiatric disorders.
All subjects were assessed for cognitive functions with information and digit symbol subscales of Wechsler Adult Intelligence Scale–Chinese Revised (WAIS-CR) (Gong, 1983) to measure verbal comprehension and processing speed, respectively. Details are presented in Table 1.
MRI data acquisition and preprocessing
All imaging scans were performed on a Philips Achieva 3T scanner with an 8-channel head coil using gradient-recalled echo-planar imaging (EPI) pulse sequence. The parameters are as follows: repetition time (TR) = 2000 ms, echo time (TE) = 30 ms, flip angle = 90°, field of view (FOV) = 240×240 mm2, matrix = 64 × 64, slices = 36, slice thickness = 4 mm, gap = 0 mm, and total volumes = 250.
Data preprocessing was carried out using the DPABI toolbox (Yan et al., 2016). We discarded the first two images to adjust for magnetic saturation delay, and the remaining 248 volumes were obtained for further analyses. The preprocessing procedure includes the following steps: slice timing correction, head motion realignment, spatial normalization with the brain template of Montreal Neurologic Institute (MNI) and smoothing (full width at half maximum [FWHM] = 8 mm). Nuisance covariates including 12 head motion parameters, white matter, ventricle signals and temporal derivatives were regressed out. The global signal was not removed as recent studies have shown illness-related variance in global signals (Yang et al., 2014). Displaced volumes (framewise displacement >0.5 mm) were interpolated by nearest-neighbor interpolation (Power et al., 2012). The exclusion criteria for sample selection included the following: (1) head motions larger than a 2.5-mm translation or 2.5° rotation in any direction, and (2) fMRI data failed to normalize to MNI space, which is visually inspected by an experienced data analyst. After quality control, a total of 38 patients with MDD and 41 HCs were included in the final analysis. We did not detect any difference in the total number of displaced volumes that were interpolated in two groups: patients group, mean (SD) = 17 (21.3); HCs, mean (SD) = 11.6 (13.2); p = 0.18.
Network construction
The WM paradigm adopted in this study comprised ‘0-back’ and ‘2-back’ load conditions: the ‘0-back’ condition, in which participants pressed a button each time when they saw the letter ‘x’, and the ‘2-back’ condition, in which participants pressed a button when the letter presented was identical to what they saw two letters prior. Each letter was displayed for 500 ms with an interstimulus interval of 1500 ms. Each block comprised 20 stimuli containing seven targets and was preceded by an instruction shown for 2 seconds. During resting periods, subjects were instructed to fixate on a cross in the center of the screen for 20 seconds. Stimulation blocks and resting periods alternated within the experiment with a total of four 2-back and four 0-back blocks. Each block contains 20 volumes, and therefore, the 2-back and 0-back conditions consist of 80 volumes, respectively. A detailed description of this paradigm is given in Supplemental S1.
In the construction process of functional connection matrix, we only concatenated the 80 fMRI volumes obtained under the four blocks of 2-back performance (He et al., 2012) in line with our prior works (Yang et al., 2020a, 2020b), for the 0-back is not considered to be a real WM task. The mean time series was extracted from each of the 264 nodes using 6 mm spheres defined by the Power atlas (Power et al., 2011). A 264 × 264 symmetric matrix was generated for each participant by computing the Pearson’s correlation coefficients between the time series for each pair of regions of interest (ROIs). The resultant matrix was converted to normally distributed scores using the Fisher z transformation, and the variance due to the linear effects of age, gender and education years was removed to derive the corrected symmetric matrix. Global and local efficiency were calculated on a series of weighted adjacency matrices with different densities, ranging from top 10% to 50% of all connections, with 2% increments, using scripts from the Brain Connectivity Toolbox (www.brain-connectivity-toolbox.net/).
We further parcellated the 264 nodes of the whole brain into 14 large-scale networks, including ‘auditory’, ‘visual’, ‘cingulo-opercular’, ‘default mode’, ‘dorsal attention’, ‘frontoparietal’, ‘salience network’, ‘sensory/somatomotor hand’, ‘subcortical network’, ‘ventral attention’, ‘sensory/somatomotor mouth’, ‘cerebellar’, ‘uncertain’ and ‘memory retrieval’ (Power et al., 2011). The nodes of each large-scale networks were isolated, and their global and local efficiency were separately calculated on a series of weighted adjacency matrices with different densities. The density range was the same as that used in the whole-brain analysis (i.e. 0.1:0.02:0.5). A series of weighted adjacency matrices corresponding to each network were reconstructed by the nodes only belonging to that network. Four large-scale networks, ‘sensory/somatomotor mouth’, ‘cerebellar’, ‘uncertain’ and ‘memory retrieval’ network, had insufficient number of nodes to meaningfully calculate sub-graph properties and thus were excluded from further analysis.
Statistical analysis
Analyses were conducted using SPSS statistical software, version 22. Group-related differences in demographics, clinical characteristics, WM performances and network properties were analyzed using a two-sample t-test and χ2 tests. As network properties were calculated across densities, we first used functional data analysis (FDA) (Bassett et al., 2012) to synthesize values across densities. In the FDA, each network metric curve is treated as a function (y = f (x)), and the sum of differences in y-values is calculated across densities. It should be noted that statistical maps of network metrics calculated on all large-scale networks were generated after multiple-comparison analysis correction (false discovery rate [FDR] corrected using the Benjamini–Hochberg method with p < 0.05).
Exploratory analysis
Moderation analysis
We conducted linear regression analyses to test the association of clinical symptoms, WM performance and network properties. In the linear regression model, we defined the accuracy of 2-back as the dependent variable; clinical symptoms including HAMD, HAMA and BPRS as the predictor; and altered network properties as the moderator variable.
Machine learning
We extracted all calculated network properties, including global and local efficiency of the whole brain and all large-scale networks (a total of 22 features) for the subsequent pattern recognition. We used Least Absolute Shrinkage and Selection Operator (LASSO) as the feature selection algorithm and then used the Akaike information criterion (AIC) to find the best fitting model. Notably, the feature selection procedure was performed only on the training dataset. Features with non-zero regression coefficients of the best fitting model were retrieved for the subsequent classification using the SVM toolkit libsvm (www.csie.ntu.edu.tw/~cjlin/libsvm/). The kernel function of the SVM was set as the sigmoid type, cost c = 10, and other all related parameters were set as default to trade off learning and extensibility (g = 1/number of all features and coef = 0). We used the Leave-One-Out Cross-Validation to evaluate the general performance. The average prediction accuracy, area under the curve (AUC), true positive rate for MDD and true positive rate for HCs were calculated to evaluate the performance. The absolute values of the regression coefficient of the best fitting model in each round were summed to evaluate the discriminating ability of the corresponding features for classification.
Results
Participant characteristics and WM performance
The demographic and clinical variables are presented in Table 1. No significant group differences were detected in age and gender. The patients group was undereducated in comparison with HCs: patients group, mean (SD) = 12.8 (3.2); HCs, mean (SD) = 14.7 (2.5); p = 0.006. The performance of the patients group was worse than that of the HCs in terms of the WAIS-CR information—patients group, mean (SD) = 17.7 (6); HCs, mean (SD) = 21.3 (5.1); p = 0.007; WAIS-CR digit symbol—patients group, mean (SD) = 74 (18.2); HCs, mean (SD) = 91.1 (15.1); p < 0.001; and accuracy of 2-back—patients group, mean (SD) = 65.6 (21.8); HCs, mean (SD) = 75.9 (17.4); p = 0.032.
Network properties
At the whole-brain level, there were no significant differences in global efficiency—patients group, mean (SD) = 0.558 (0.021); HCs, mean (SD) = 0.565 (0.012); p = 0.065—and local efficiency—patients group, mean (SD) = 0.757 (0.015); HCs, mean (SD) = 0.756 (0.013); p = 0.61—between patients with MDD and HCs (see Figure 1 and Table 2).
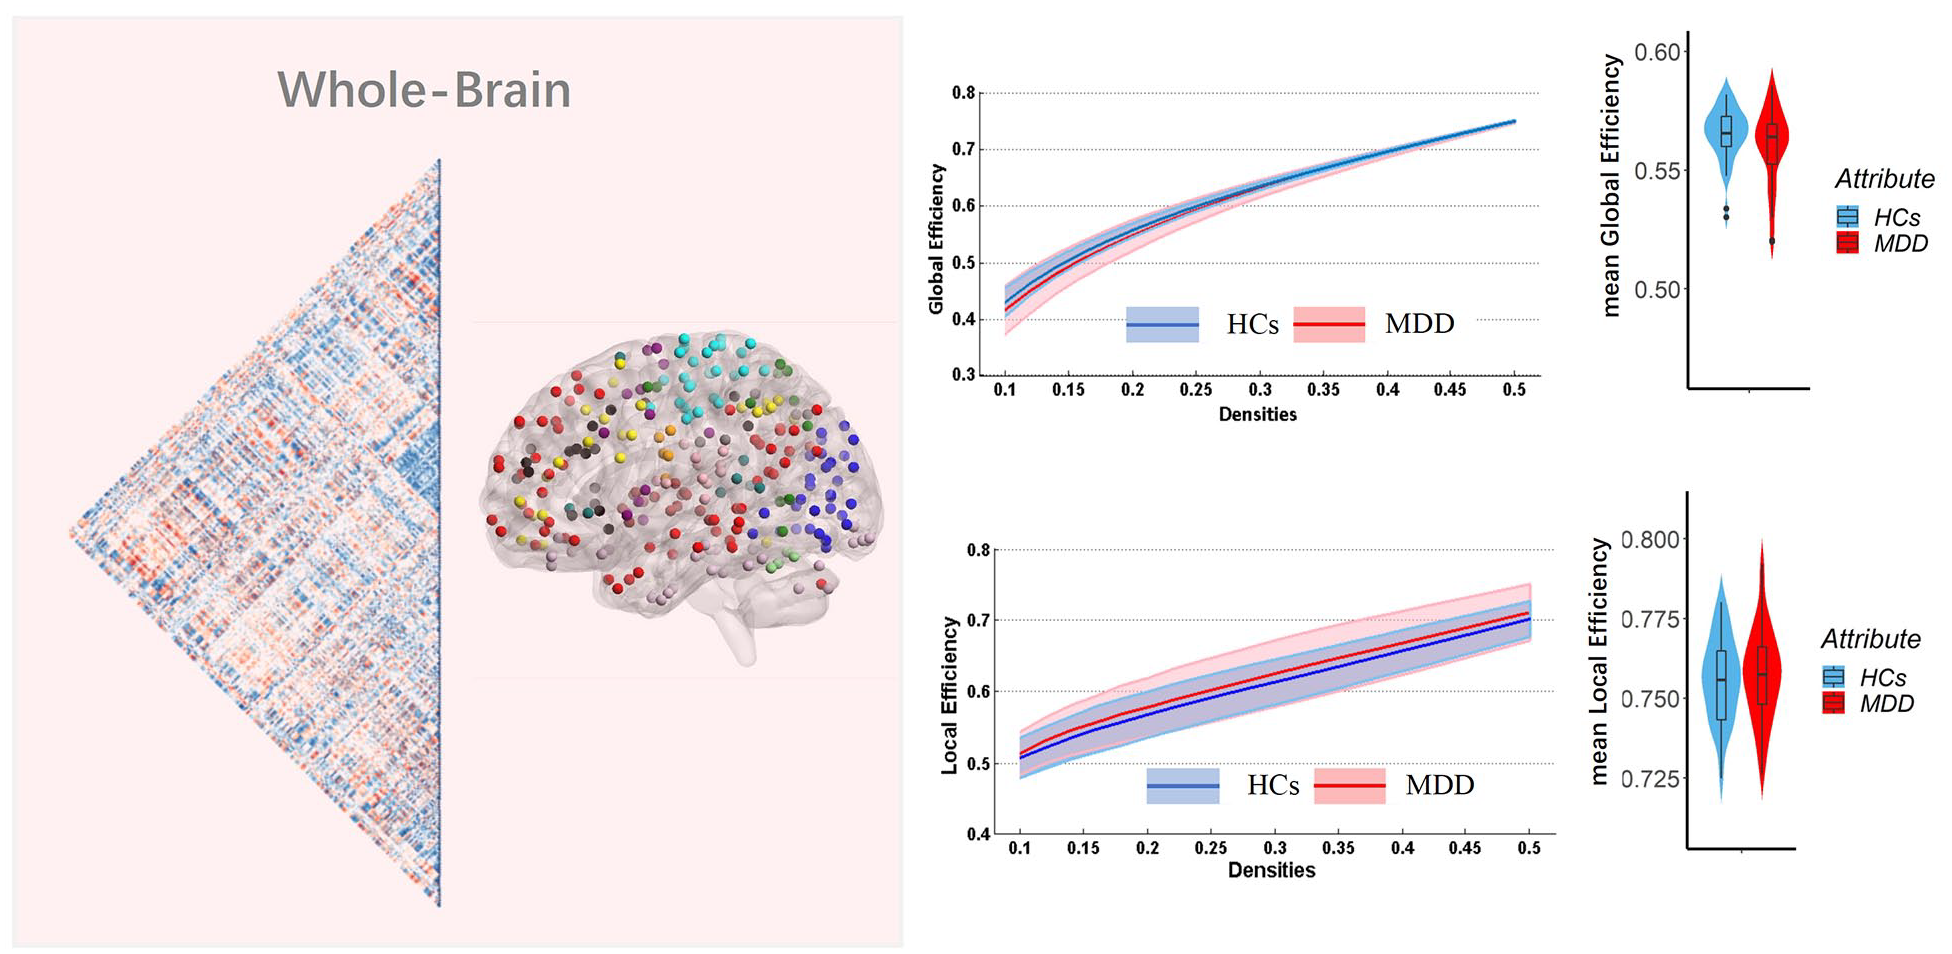
Global and local efficiency of the whole-brain functional connectome calculated on Power atlas in all groups.
Topology properties of functional connectome under the 2-back condition.
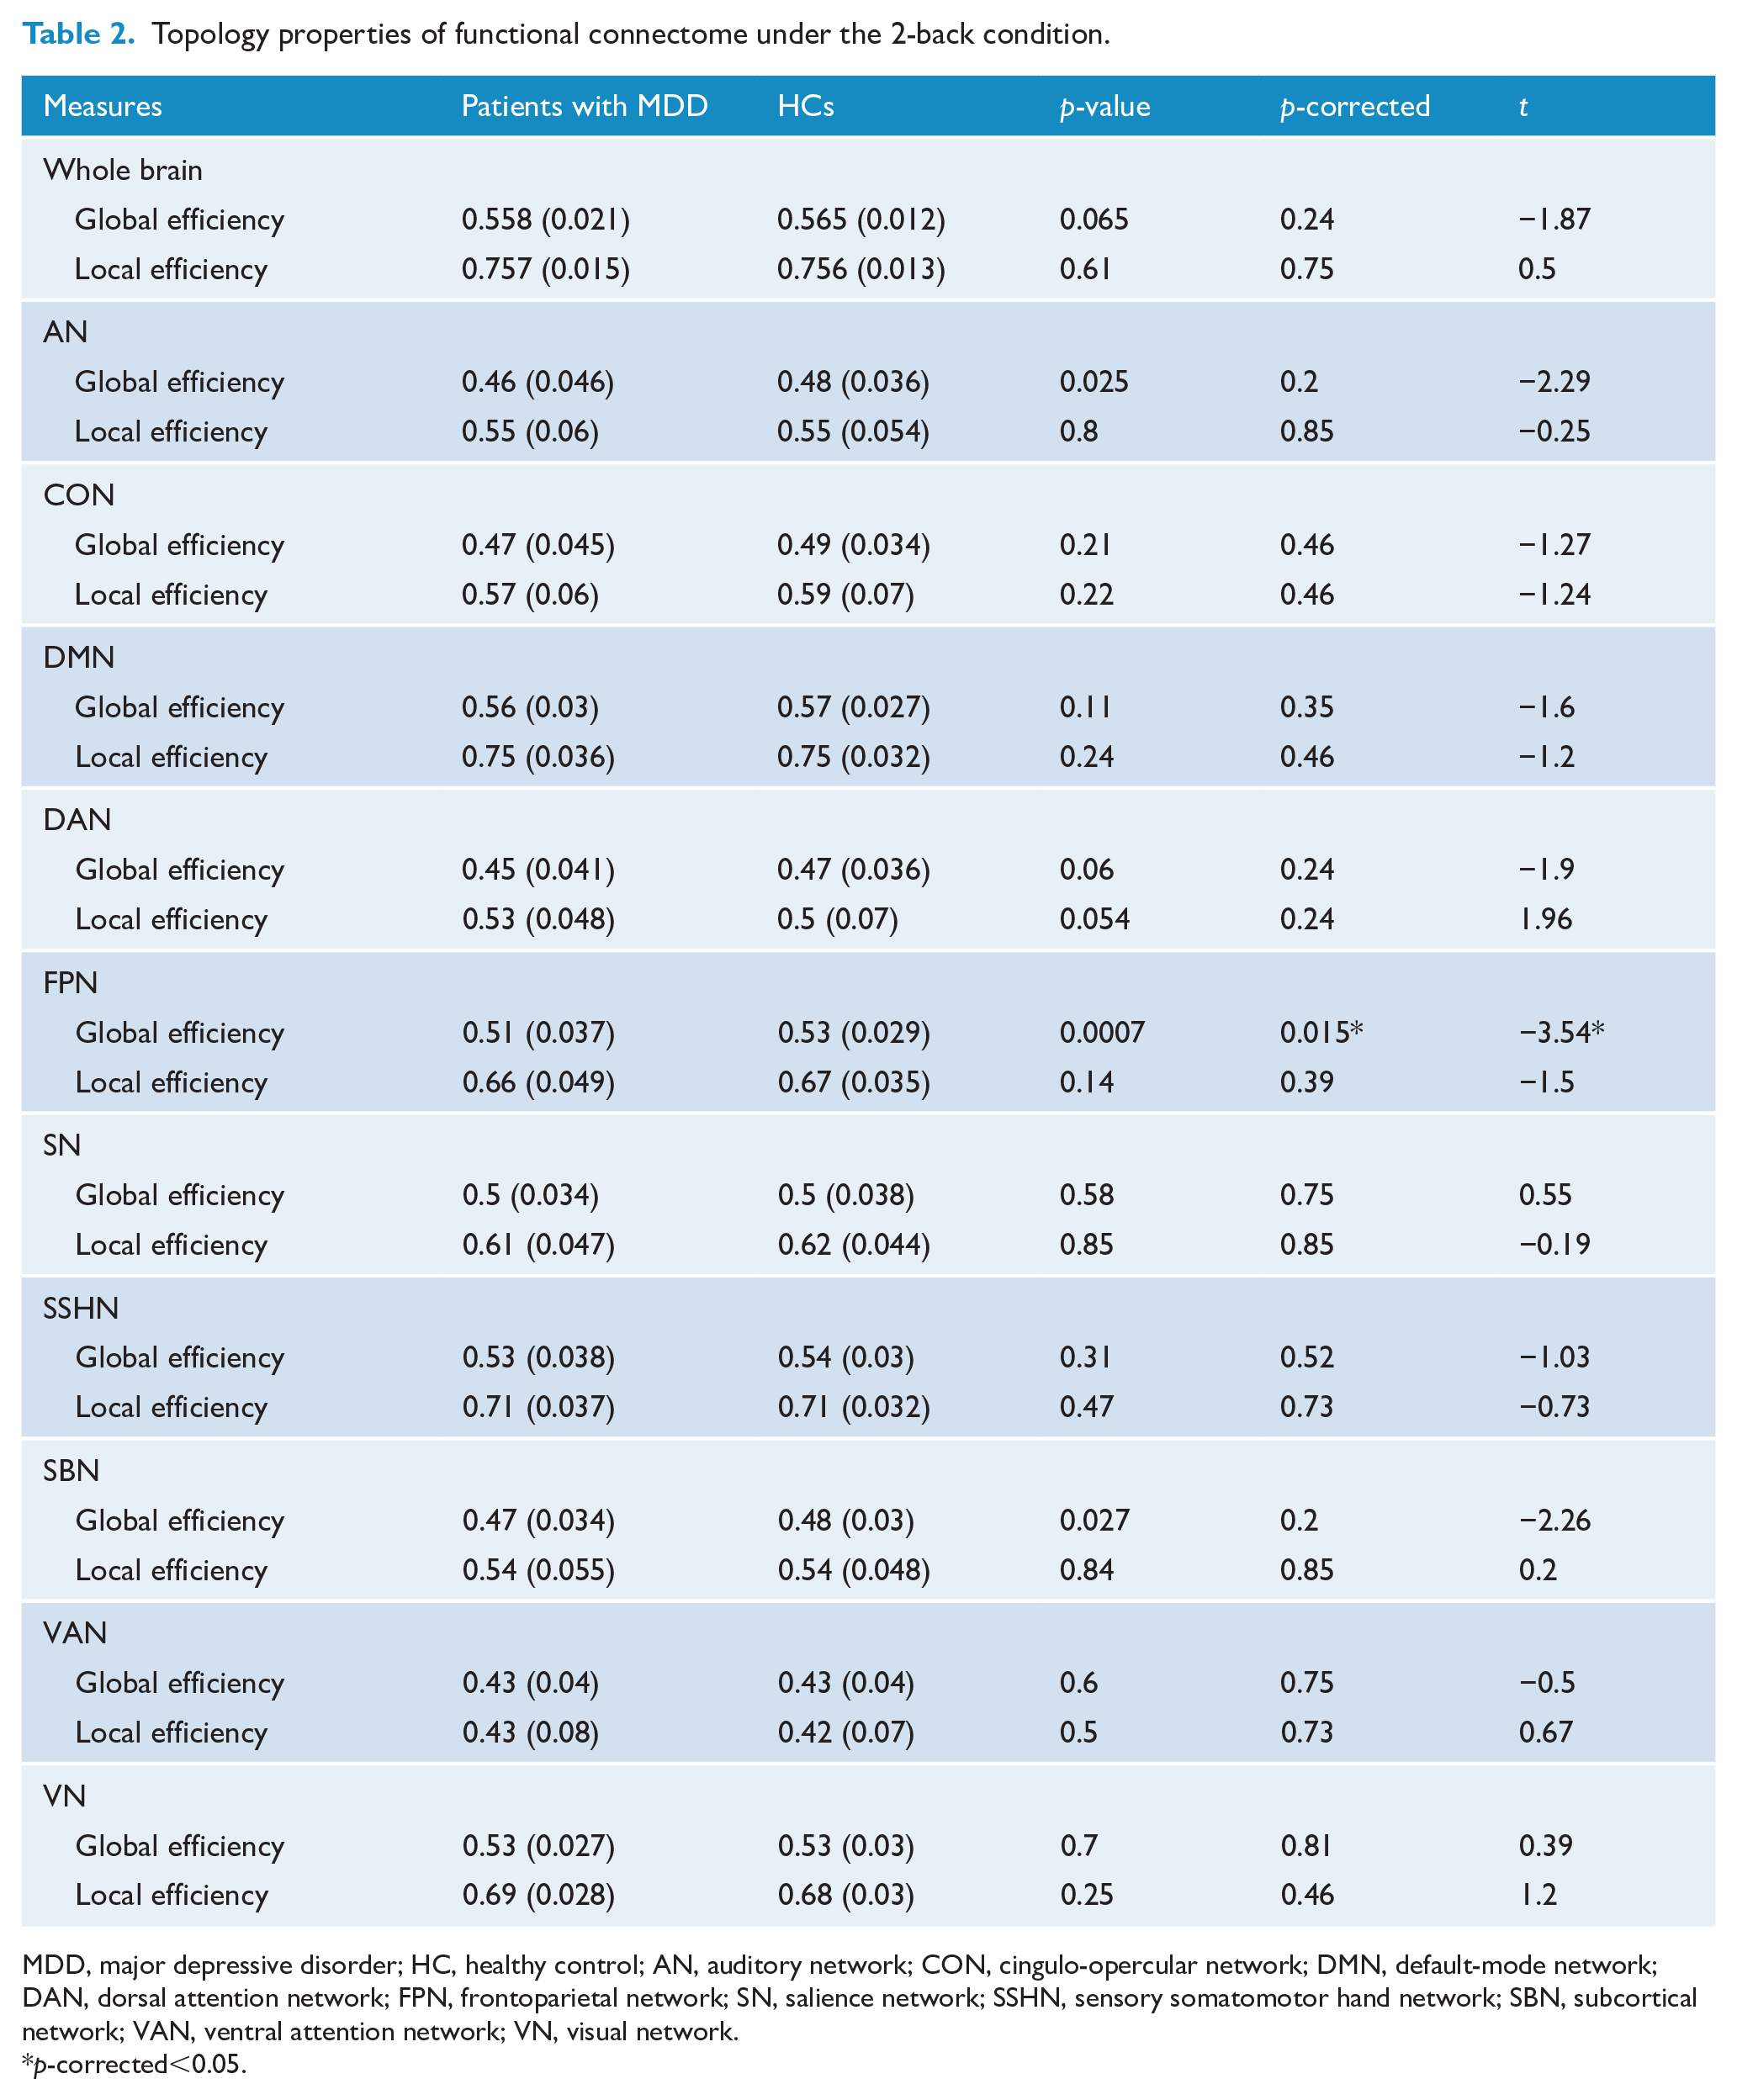
MDD, major depressive disorder; HC, healthy control; AN, auditory network; CON, cingulo-opercular network; DMN, default-mode network; DAN, dorsal attention network; FPN, frontoparietal network; SN, salience network; SSHN, sensory somatomotor hand network; SBN, subcortical network; VAN, ventral attention network; VN, visual network.
p-corrected<0.05.
At the large-scale network level, patients with MDD showed significant decreased global efficiency in the FPN under 2-back—patients group, mean (SD) = 0.51 (0.037); HCs, mean (SD) = 0.53 (0.029); p = 0.0007; p-corrected = 0.014—in comparison with HCs. We did not detect any group difference in other large-scale networks after FDR correction (for detailed information about network metrics of all large-scale networks, see Figure 2 and Table 2) for global efficiency. None of the examined networks (including FPN) had significant changes in local efficiency when compared with HCs.
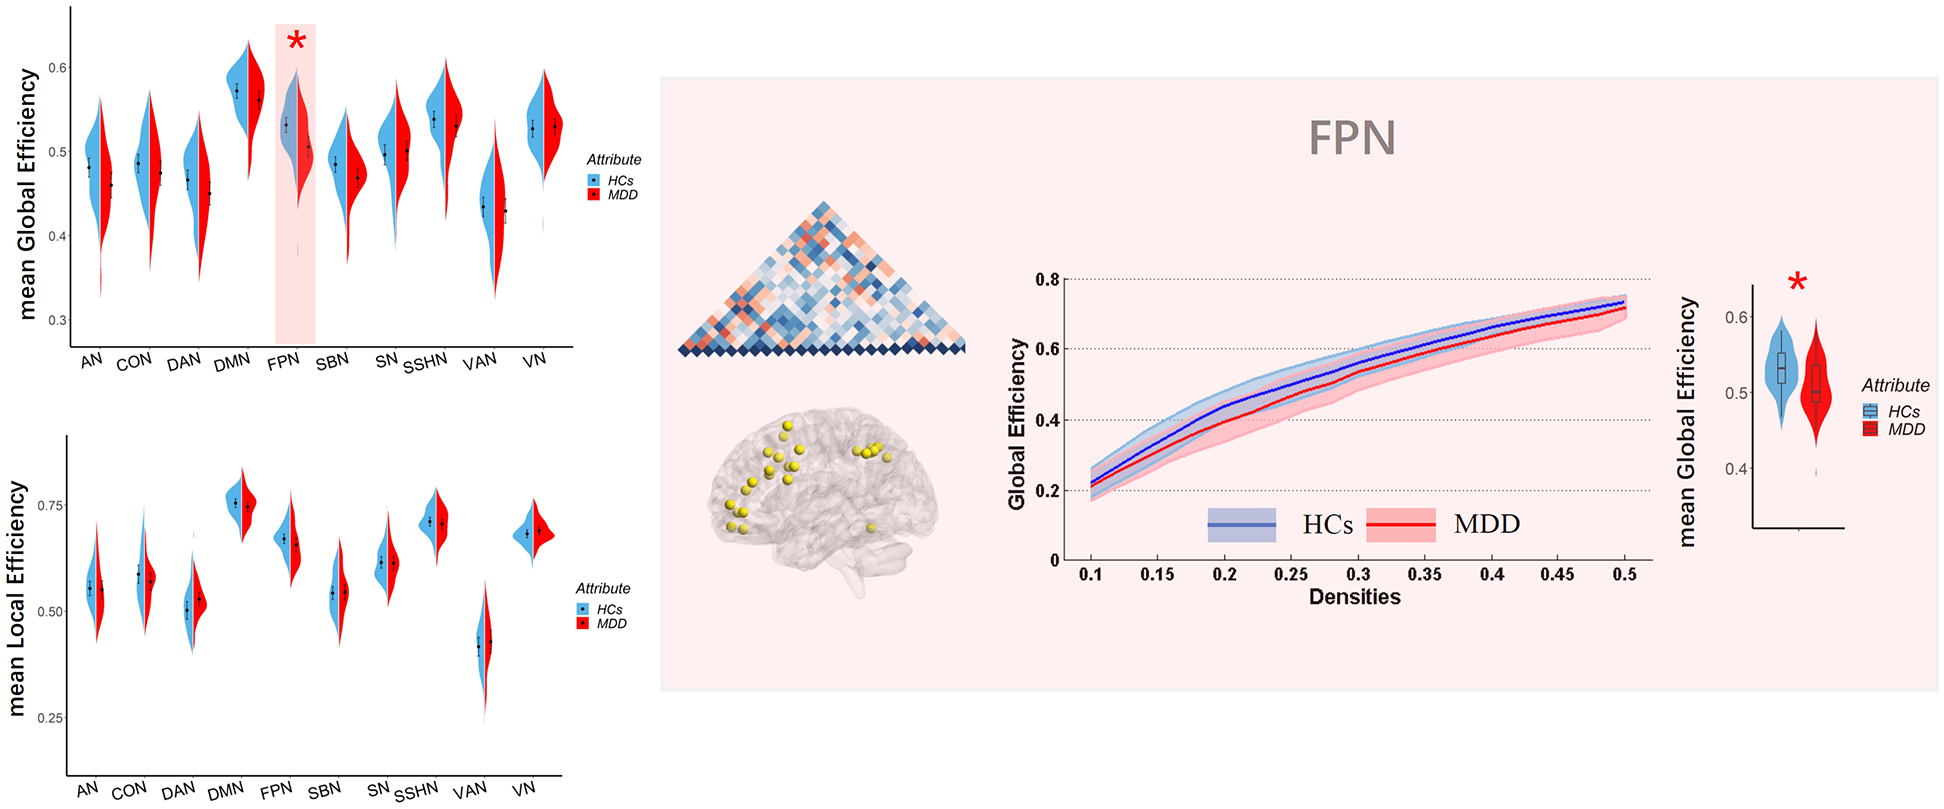
Global and local efficiency of large-scale networks calculated on Power atlas in all groups. The range of densities is 0.1:0.02:0.5, and symbol ‘*’ represents p-corrected <0.05.
Furthermore, examination of the 0-back control condition revealed that topological changes attributable to simple attention and motor function during the WM task are relatively small and insignificant (more information in Supplemental S2 and Table S1).
Exploratory analysis
Moderation analysis
We further assessed whether the altered global efficiency of the FPN can moderate the impact of clinical symptoms on WM performance or not. As shown in Figure 3, the global efficiency of FPN moderated the relationship between BPRS and WM performance (β =–0.43, p = 0.035, t =–2.2, 95% confidence interval [CI] = [–0.043, –0.002]). The subscale scores of the BPRS are presented in Supplemental Table S2. We did not find similar effect for HAMD and HAMA scores.
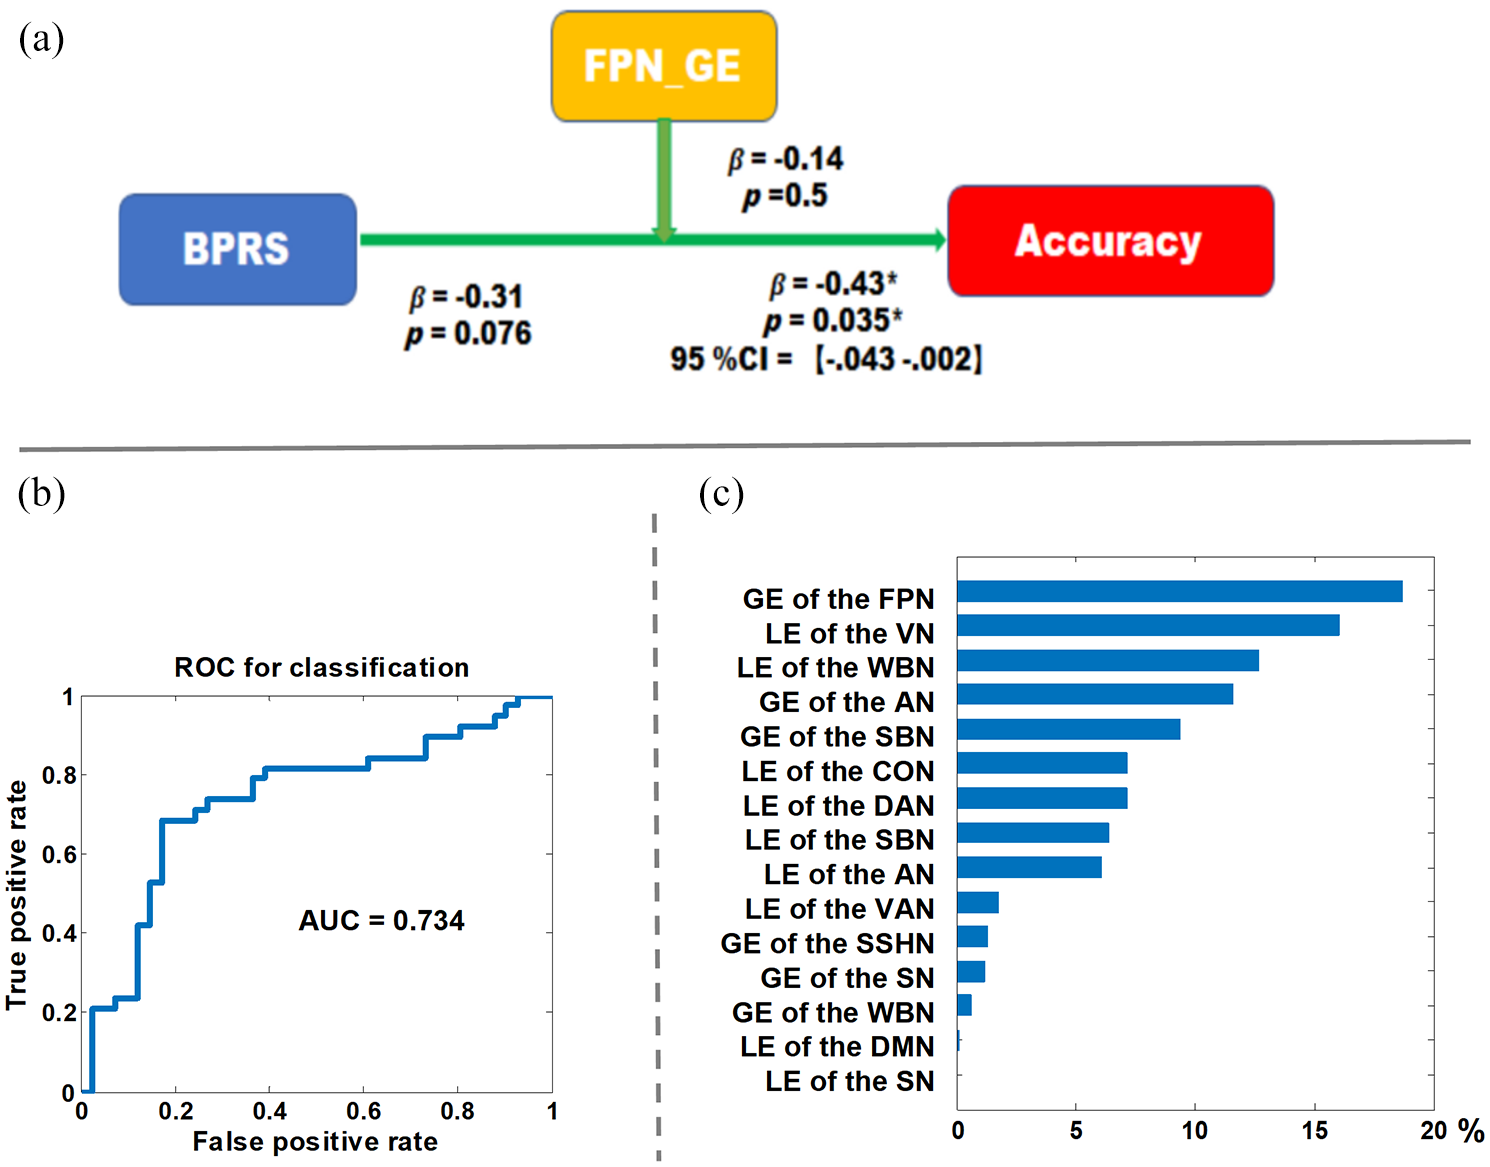
Exploratory analysis results. (A) The moderating model of the FPN global efficiency on the relation of BPRS and WM performance. (B) The receiver operating characteristics of the machine learning analysis. (C) The contribution ratio of all features to the diagnostic classification. There were seven features that did not involve in the diagnostic clarification as their contribution ratio was zero: GE of the CON, GE of the DMN, GE of the DAN, LE of the FPN; LE of the SSHN, GE of the VAN and GE of the VN.
Machine learning
We achieved classification results with average accuracy, AUC, true positive rate for MDD and true positive rate for HCs of 73.42%, 0.734, 73.7% and 73.2%, respectively. We found that the global efficiency of the FPN contributed most to the diagnostic classification. The receiver operating characteristics and the contribution ratio of each feature in the diagnostic classification are displayed in Figure 3 and Supplemental Table S3.
Discussion
To our knowledge, this is the first study to measure the topology properties of the whole-brain and large-scale networks in patients with MDD during WM performance. We report two key observations. First, compared with HCs, there is a diminished global efficiency of the FPN in patients with MDD. Second, in the presence of less severe illness burden as indexed by BPRS, a decrease in global efficiency of the FPN is associated with decreased WM accuracy. The results from SVM analysis also indicate that the interplay between various levels of topological parameters carries sufficient illness-specific information relevant to MDD, and the global efficiency of the FPN contributed most to the diagnostic classification. Nevertheless, with the modest classification accuracy, we urge caution in using the reported connectomic pattern to predict depression at a single-subject level.
This study denotes a diminished global efficiency of the FPN in patients with MDD, but no whole-brain topology alteration was observed. Prior studies have suggested that WM deficits are common to affective and psychotic illnesses (Lewandowski et al., 2014), and we have reported altered whole-brain topology in schizophrenia and bipolar depression during WM processing in our prior work (Yang et al., 2020a, 2020b). The absence of the whole-brain connectomic deficits in MDD during task performance may underlie the smaller effect sizes of WM impairments in MDD compared with the other two mental disorders. Partially consistent with this study, our prior work has also reported that the nodes located in FPN showed altered nodal network metrics in schizophrenia (Yang et al., 2020b). Combined evidence from the current and our previous research may suggest that the neurobiological mechanism related to WM impairment across affective and psychotic illnesses has some overlap at the global level, with bipolar illness and schizophrenia showing increased local efficiency (segregation) at the whole-brain level, though in MDD subjects the topological changes were restricted to FPN.
In addition to our findings, empirical evidence from resting-state neuroimaging research has highlighted FPN dysfunction involved in the pathophysiological mechanisms of MDD. A meta-analysis has denoted that MDD was characterized by hypoconnectivity within the FPN (Kaiser et al., 2015), and a prior study extended this notion and suggested that the graded disruptions of FPN connectivity were associated with the presence of affective and psychotic illnesses (Baker et al., 2019). As the flexible hub of cognitive control (Zanto and Gazzaley, 2013), FPN plays a crucial role in WM processing, and its microstructure connections can predict the WM performance (Burzynska et al., 2011). Neural components that composed the FPN, such as dorsolateral prefrontal cortex (DLPFC), parietal cortex and anterior cingulate cortex (ACC), have shown their WM-related abnormal activation (Fitzgerald et al., 2008; Harvey et al., 2005; Matsuo et al., 2007), and the hypoconnectivity within the FPN has also been observed in MDD during WM processing (Vasic et al., 2009). This study adds to this literature by revealing significantly reduced global efficiency of FPN in MDD during WM performance.
There is a theory suggesting that transient, flexible coordination across distal brain regions and networks (i.e. network integration) is necessary for complex cognition (Fries, 2005). Consistent with this theory, previous studies have revealed that integration across distinct regions is critical for the higher order cognitive functions, such as WM (Cohen and D’Esposito, 2016), whereas the increased segregation appears critical for motor execution (Cohen and D’Esposito, 2016). Healthy individuals showed increased integration during WM processing (Cohen and D’Esposito, 2016) and increased integration associated with better behavioral performance. Furthermore, previous associations have been found between FPN efficiency and cognition (Sheffield et al., 2015). The decreased global efficiency observed in patients with MDD may indicate that a portion of distal connections are broken down, which may follow with previous studies documenting the hypoconnectivity of distal regions (e.g. the inferior parietal cortex and superior prefrontal areas) of the FPN network in patients with MDD during WM performance (Vasic et al., 2009). This hypoconnectivity may arise due to failure of co-activation of distal regions. WM-related abnormal activation of the neural components within FPN has a considerable heterogeneous pattern (Wang et al., 2015); in other words, frontal hyperactivation may relate to parietal hypoactivation. Therefore, these constellations may form a chain of evidence that highlights WM-related aberrant activation, connectivity and altered connectomic properties of the FPN in the MDD.
The global efficiency of FPN moderated the relationship between BPRS and WM performance. In the presence of lower BPRS scores, we observed an association between decreased global efficiency of the FPN and decreased WM accuracy. We did not see the same effect with HAMD scores, indicating that the distinct features such as psychotic symptoms captured by BPRS may mediate this relationship. This observation speaks to two important mechanistic inferences. First, if global efficiency is considered the physiological index of effortful integration underwriting WM accuracy, then patients with lower symptom burden (i.e. non-psychotic MDD) could increase WM accuracy to near-normal levels by making more physiological effort. On the contrary, this may not be possible in those who are more severely unwell, especially with psychotic symptom burden. Second, when there are more severe symptoms, especially of psychotic nature, multiple networks in addition to FPN may operate to affect cognition in MDD.
Brain stimulation tools, including repetitive transcranial magnetic stimulation (rTMS) and transcranial direct current stimulation (tDCS), have documented their effect on brain network regulation and can interfere with WM performance (Lee and D’Esposito, 2012; Sandrini et al., 2012). Selection of target location is also a knotty issue in brain stimulation treatment; our findings suggest that the FPN is a promising candidate network target. However, it must be noted that the FPN covers extensive regions of the brain; choosing a single node such as the DLPFC may bring about the desired changes in all cases. Connectivity-guided target selection within FPN may help personalize non-invasive approaches for cognitive remission in MDD (Iwabuchi et al., 2019).
This study has several limitations. First, the total number of included subjects was relatively small, which might limit the general applicability of our findings. Further research with larger sample size is needed to probe the relationship between WM performance and network properties. Second, although the n-back paradigm strongly recruits WM, the version used in our study did not contain different WM loads for us to examine the distinctive reorganization of brain networks in patients with MDD and HCs with load increased. Future investigations using more sophisticated paradigm are needed to parse the network structure of patients with MDD under different WM loads. Third, the education level was not matched between patients with MDD and HCs. Nevertheless, we have treated education years as a covariance factor to exclude its effect, and all network properties were generated on the corrected symmetric matrix.
In this study, we report the decreased integration of the FPN in patients with MDD during WM, and the findings of our moderation model revealed that in the presence of less illness burden, increases in integration may be a viable precognition option. In this sense, the treatment strategies toward WM deficits should be precisely designed on the current clinical symptom status of patients with MDD. For patients with less illness burden, cognitive strategies that increase global efficiency may be a feasible precognitive option. Brain stimulation tools that affect global efficiency need to be evaluated for precognitive benefits in MDD with less illness burden. Encouraging preliminary results have been achieved in this regard (Oliveira et al., 2013).
Supplemental Material
sj-pdf-1-anp-10.1177_0004867420978284 – Supplemental material for Decreased integration of the frontoparietal network during a working memory task in major depressive disorder
Supplemental material, sj-pdf-1-anp-10.1177_0004867420978284 for Decreased integration of the frontoparietal network during a working memory task in major depressive disorder by Wenjian Tan, Zhening Liu, Chang Xi, Mengjie Deng, Yicheng Long, Lena Palaniyappan and Jie Yang in Australian & New Zealand Journal of Psychiatry
Footnotes
Author Contributions
W.T. drafted the article. Z.L. helped with the conception and design, and revised the article. C.X., M.D. and Y.L. helped with acquisition of data. L.P. interpreted the results and drafted and revised the article. J.Y. analyzed the data and drafted and revised the article.
Data Availability Statement
The data that support the findings of this study are available on request from the corresponding author. The data are not publicly available due to privacy or ethical restrictions.
Declaration of Conflicting Interests
The author(s) declared the following potential conflicts of interest with respect to the research, authorship and/or publication of this article: L.P. reports personal fees from Otsuka Canada, SPMM Course Limited, UK, Canadian Psychiatric Association; book royalties from Oxford University Press; and investigator-initiated educational grants from Janssen Canada, Sunovion and Otsuka Canada outside the submitted work. All authors report no biomedical financial interests or potential conflicts of interest.
Funding
The author(s) disclosed receipt of the following financial support for the research, authorship and/or publication of this article: This work was supported by the China Precision Medicine Initiative (2016YFC0906300 to Z.L.), the National Natural Science Foundation of China (81561168021 to Z.L.) and the Fundamental Research Funds for the Central Universities of Central South University (2019zzts813 to W.T.). L.P. acknowledges the support of Tanna Schulich endowment.
Supplemental Material
Supplemental material for this article is available online.
References
Supplementary Material
Please find the following supplemental material available below.
For Open Access articles published under a Creative Commons License, all supplemental material carries the same license as the article it is associated with.
For non-Open Access articles published, all supplemental material carries a non-exclusive license, and permission requests for re-use of supplemental material or any part of supplemental material shall be sent directly to the copyright owner as specified in the copyright notice associated with the article.