
Abstract
Objective:
Patients with major depressive disorder tend to exhibit poorer decision-making capacity than the general population, but neurobiological evidence is lacking. Functional near-infrared spectroscopy monitors changes in oxy-haemoglobin concentration in the cerebral cortex. It may provide an objective assessment of neurophysiological responses during decision-making processes. Thus, this study investigated the effect of major depressive disorder diagnosis and severity on prefrontal cortex activity during the Iowa gambling task.
Methods:
Right-handed healthy controls (n = 25) and patients with major depressive disorder (n = 25) were matched for age, gender, ethnicity and years of education in this cross-sectional study. Functional near-infrared spectroscopy signals and the responses made during a computerised Iowa gambling task were recorded. In addition, demographics, clinical history and symptom severity were noted.
Results:
Compared to healthy controls, patients with major depressive disorder had reduced haemodynamic response in several cortical regions of the frontal lobe (Hedge’s g range from 0.71 to 1.52; p values range from ⩽0.001 to 0.041). Among patients, mean oxy-haemoglobin declined with major depressive disorder severity in the right orbitofrontal cortex (Pearson’s r = −0.423; p = 0.024).
Conclusion:
Haemodynamic dysfunction of the prefrontal cortex during decision-making processes is associated with major depressive disorder diagnosis and severity. These neurophysiological alterations may have a role in the decision-making capacity of patients with major depressive disorder.
Keywords
Introduction
Major depressive disorder (MDD) is a debilitating psychiatric disorder with significant personal and societal costs worldwide (Ho et al., 2013). The core symptoms are low mood and anhedonia for almost every day over a fortnight, and these are usually accompanied by several other somatic, biological and cognitive symptoms (American Psychiatric Association, 2013). Although MDD is treatable, cognitive symptoms tend to persist after remission, affecting one or more domains of executive function, learning and memory, processing speed and attention and concentration (Zuckerman et al., 2018). No one cognitive domain is selectively affected in MDD, but executive impairment is thought to be the main hurdle towards functional recovery (Knight and Baune, 2018). Domains within executive function include planning and problem-solving, inhibition and semantic fluency, decision-making and memory processes (Must et al., 2013). Among these domains, decision-making ability may affect social skills, coping strategies, vulnerabilities, depressive symptoms and MDD recurrence (Kendler, 2013). Therefore, deficits in decision-making capacity may have a role in the course of MDD and warrants further study.
The Iowa gambling task (IGT) is a well-known test used to assess the complex nature of decision-making (Bechara et al., 1997). Designed to mimic real-life decision-making processes through rewards, penalties and uncertainty, the task requires problem-solving, attention and executive function (Gansler et al., 2011). According to the professional manual, the IGT may be used to infer the decision-making capacity of an individual relative to the general population and obtain information supporting a diagnosis (Bechara, 2007). Following its first use on patients with prefrontal cortex damage and decision-making deficits (Bechara et al., 1997), it has been applied to several psychiatric disorders, including substance abuse, pathological gambling, obsessive compulsive disorder, schizophrenia, attention deficit hyperactivity disorder and mood disorders (Buelow and Suhr, 2009). Still, the IGT is a behavioural measure which cannot be interpreted without several other neuropsychological tests and patient history (Buelow and Suhr, 2009). However, such cognitive complaints by patients are subjective, and supporting evidence relating MDD severity to neurocognitive measures is limited (Evans et al., 2014). Hence, research efforts utilising both neurocognitive and biological measures, such as functional neuroimaging techniques, are needed to study decision-making capacity in MDD (Husain et al., 2020).
Functional magnetic resonance imaging (fMRI) studies of healthy adults have consistently reported activation of the prefrontal cortex during the IGT (Fukui et al., 2005; Lawrence et al., 2009; Li et al., 2010; Lin et al., 2008). Among patients with MDD, an fMRI study showed differences in activation during the IGT between suicide attempters and non-attempters in the dorsolateral prefrontal cortex and right orbitofrontal cortex (Olie et al., 2015). Using magnetic resonance spectroscopy, high prefrontal inositol was associated with lower IGT scores in both healthy individuals and patients with MDD (Jollant et al., 2016). While these reports suggest abnormal brain activity and biochemistry associated with the IGT in patients with MDD, such investigations are few and far between. Other functional neuroimaging modalities, including functional near-infrared spectroscopy (fNIRS), may improve our knowledge of decision-making capacity in patients with MDD.
fNIRS enables the study of neurophysiology as it measures haemodynamic changes in the cerebral cortex over time using near-infrared light (Lai et al., 2017). Near-infrared light has the unique property of passing through tissues until it reaches the cortex, where it is mainly absorbed by oxy-haemoglobin and deoxy-haemoglobin (Ho et al., 2016). In a phenomenon known as neurovascular coupling, fNIRS signals are believed to reflect the underlying neuronal activity (Gsell et al., 2000). Upon regional neuronal activity, the increase in blood flow and volume is several times higher than the metabolic demands. Thus, at the onset of a stimulus, there is in a net increase in oxy-haemoglobin and a simultaneous slight decrease in deoxy-haemoglobin (Scholkmann et al., 2014). The utility of functional neuroimaging modalities may be based on the spatial and temporal resolution, possible tasks and participants, robustness to motion, sound and cost. Although fNIRS only measures haemodynamic response in the cerebral cortex, it has other advantages which make it suitable for studying cognitive function in patients. Compared to conventional techniques such as fMRI and electroencephalography (EEG), a wider range of cognitive tasks can be used during fNIRS measurements because it is tolerant to motion. Furthermore, fNIRS has higher spatial resolution than EEG, and in contrast to fMRI, fNIRS is quiet, non-restrictive, inexpensive and has higher temporal resolution (Pinti et al., 2020). Hence, fNIRS is often used for psychiatric research (Ehlis et al., 2014), and it is suitable for monitoring the cortical haemodynamic response of patients with MDD as they perform the IGT.
The first aim of this study was to compare fNIRS signals during the IGT from the frontal, temporal and parietal cortex of healthy controls (HCs) and patients with MDD. The second aim was to examine the relationship between fNIRS signals during the IGT and several behavioural and clinical variables, including IGT performance and depression severity. We hypothesise that patients with MDD have diminished haemodynamic response primarily in the prefrontal cortex, and that cortical activity declines with major depression severity.
Methods
Participants
A total of 25 patients with MDD and 25 HCs who were right-handed and between 21 and 50 years old were included. Groups were matched for gender, age, ethnicity and years of education. Patients were recruited from the outpatient psychiatric clinic at the National University Hospital, Singapore. Each patient had been diagnosed by a psychiatrist, according to the criteria in the fifth edition of the Diagnostic and Statistical Manual of Mental Disorders (DSM-5) (American Psychiatric Association, 2013). Individuals were excluded if they had conditions that could affect the central nervous system, including cerebrovascular diseases, respiratory diseases, hepatic diseases, kidney diseases, cancer, epilepsy or intellectual disability. HCs who reported past psychiatric history and participants who received psychotherapy, reported drowsiness on the day of participation, had poor fNIRS data quality or had fewer than 70 responses during the IGT were excluded. Depressive symptoms were evaluated using the 17-item Hamilton Rating Scale for Depression (HAM-D) (Hamilton, 1960) and HCs with a HAM-D score of 8 or higher were excluded (Zimmerman et al., 2013).
Study details were fully explained to participants, and their written informed consent was obtained. This study was performed according to the Declaration of Helsinki and the ethical principles in the Belmont Report. It was approved by the Domain Specific Review Board of the National Healthcare Group, Singapore (protocols 2017/00807 and 2019/00141) and the National University of Singapore Institutional Review Board (protocol H-17-054).
IGT
The original IGT (Bechara et al., 1997) was modified into alternating blocks of six control periods and five task periods (Supplementary Figure 1). Task periods were 60 seconds long, with 20 trials each. Every trial began with a 1-second display of four decks of cards. Participants selected a card from any deck by pressing a keyboard with their right index finger. Keys 1–4 corresponded to decks A–D, respectively. After a choice was made, the score for the current trial and the cumulative score appeared for 2 seconds. A card may carry a reward or penalty, but participants can neither predict when a penalty will occur nor determine the net gain or loss for each deck. Rewards for decks A and B are the same, but double that of decks C and D. Penalties are large in decks A and B, but small in decks C and D. Hence, the task performance is determined by subtracting the number of times cards from disadvantageous decks (A and B) were chosen, from the number of times cards from advantageous decks (C and D) were chosen. The total number of responses during task periods and the final cumulative scores at the end of all trials were recorded. Control periods were 70 seconds long, with decks appearing for 1 second followed by a fixation cross for 2 seconds. Cards were selected sequentially from decks during control periods. Participants practised the task beforehand, with rewards and penalties that differed from the actual trials.
NIRS measurement
A 52-channel NIRS system (ETG-4000; Hitachi Medical Co., Tokyo, Japan) measured relative oxy-haemoglobin and deoxy-haemoglobin changes using two NIR light wavelengths (695 and 830 nm) at a sampling rate of 0.1 second (Yamashita et al., 1996); emitter and detector optodes were arranged 3 cm apart. The area between each emitter and detector pair is called a channel. Anatomically, channels correspond to cortical regions 2–3 cm beneath the skin and scalp surface (Okada and Delpy, 2003). Optodes were placed on the forehead and scalp, with the lowest optodes placed along the T4-Fpz-T3 line, defined by the 10/20 system. This arrangement allowed for haemoglobin changes in the bilateral prefrontal cortex, frontopolar cortex and the anterior regions of the superior and middle temporal cortices to be measured. These approximate channel locations are based on the anatomical craniocerebral correction of the international 10/20 system.
NIRS signal analysis
The modified Beer–Lambert law was used to derive changes in oxy-haemoglobin, deoxy-haemoglobin and total haemoglobin from optical densities. Haemoglobin changes during task periods were normalised by linear fitting between a 10-second baseline at the end of the pre-task periods, and a 5-second post-task baseline period that is 50 seconds into the post-task periods. A moving average factor of 5 was applied to remove short-term motion artefacts. Channels with body movement artefacts or high- and low-frequency noise were removed from further analysis (Ono et al., 2015; Takizawa et al., 2008). An average waveform of the five IGT blocks was generated for the remaining channels for each participant. Thereafter, the mean oxy-haemoglobin and deoxy-haemoglobin changes during the pre-task baseline and the task period per channel was determined for each participant.
Statistical analysis
To determine whether activation during the task periods occurred at each channel for each diagnostic group, Student’s paired t test was used to compare mean oxy-haemoglobin and mean deoxy-haemoglobin during the pre-task baseline and the task period. The effect of diagnostic group on continuous and categorical variables was determined using Student’s t test and Pearson’s chi-square test, respectively. Continuous variables are age, years of education, number of responses, final cumulative score, task performance, number of available channels, HAM-D score and mean oxy-haemoglobin and mean deoxy-haemoglobin during the task periods. Categorical variables are gender, ethnicity and family psychiatric history. Investigating the interrelationship between oxy-haemoglobin and deoxy-haemoglobin allows for more accurate conclusions about functional brain activity (Pinti et al., 2020). Hence, a simultaneous increase in oxy-haemoglobin and decrease in deoxy-haemoglobin from the pre-task baseline to the task period is indicative of a typical haemodynamic response. Furthermore, decreased oxy-haemoglobin and increased deoxy-haemoglobin during the task period relative to HCs would suggest abnormal haemodynamic response in patients with MDD (Scholkmann et al., 2014).
Oxy-haemoglobin is typically used as a marker of cortical activity (Ferreri et al., 2014). Hence, mean oxy-haemoglobin at channels that were significantly different between patients with MDD and HCs were used in further statistical analysis. Clinical and behavioural variables associated with mean oxy-haemoglobin during task periods within diagnostic groups were determined using Student’s t test for dichotomous variables and Pearson’s correlation for continuous variables. Additional variables for patients with MDD were age at onset, illness duration, past admission in psychiatric ward, pharmacotherapy status and equivalent doses. Reference drugs for each class are fluoxetine, diazepam and chlorpromazine, respectively. For patients receiving more than one drug in each class, the combined equivalent dose was calculated (Hayasaka et al., 2015; Inada and Inagaki, 2015). Medication naïve patients with MDD did not receive any drugs before participating in this study. Any associations between clinical or behavioural variables with mean oxy-haemoglobin during task periods was verified with multiple linear regression.
All tests were two-tailed, with a significance level of p ⩽ 0.05. Data are expressed as mean and standard deviation. Wherever a difference in mean oxy-haemoglobin was observed between diagnostic groups and between the pre-task baseline and the task period, the effect size (Hedge’s g) was reported or used in figures. To correct for multiple comparisons, the false discovery rate (FDR) method defined by Benjamini and Hochberg (Singh and Dan, 2006) was used for t tests that compared mean oxy-haemoglobin and mean deoxy-haemoglobin between diagnostic groups and between the pre-task baseline and the task period. Statistical analysis was done on SPSS Statistics 21.0 (IBM, Armonk, NY, USA). Channel positions were plotted using NFRI functions toolbox (Jurcak et al., 2007).
Results
Sample characteristics
HCs and patients with MDD did not differ in any of the demographic, behavioural and clinical variables studied (p > 0.05; Table 1), except HAM-D scores. Patients with MDD had markedly higher mean HAM-D scores than HCs (t = 0.196; p ⩽ 0.001). Among patients with MDD, 66.7% had no past admission into a psychiatric ward, and 36% were medication naïve. Among those receiving pharmacotherapy, all were on antidepressants, and a fraction were on combination anxiolytics and sedatives, antipsychotics or mood stabiliser (Supplementary Table 1).
Demographic, behavioural and clinical characteristics.
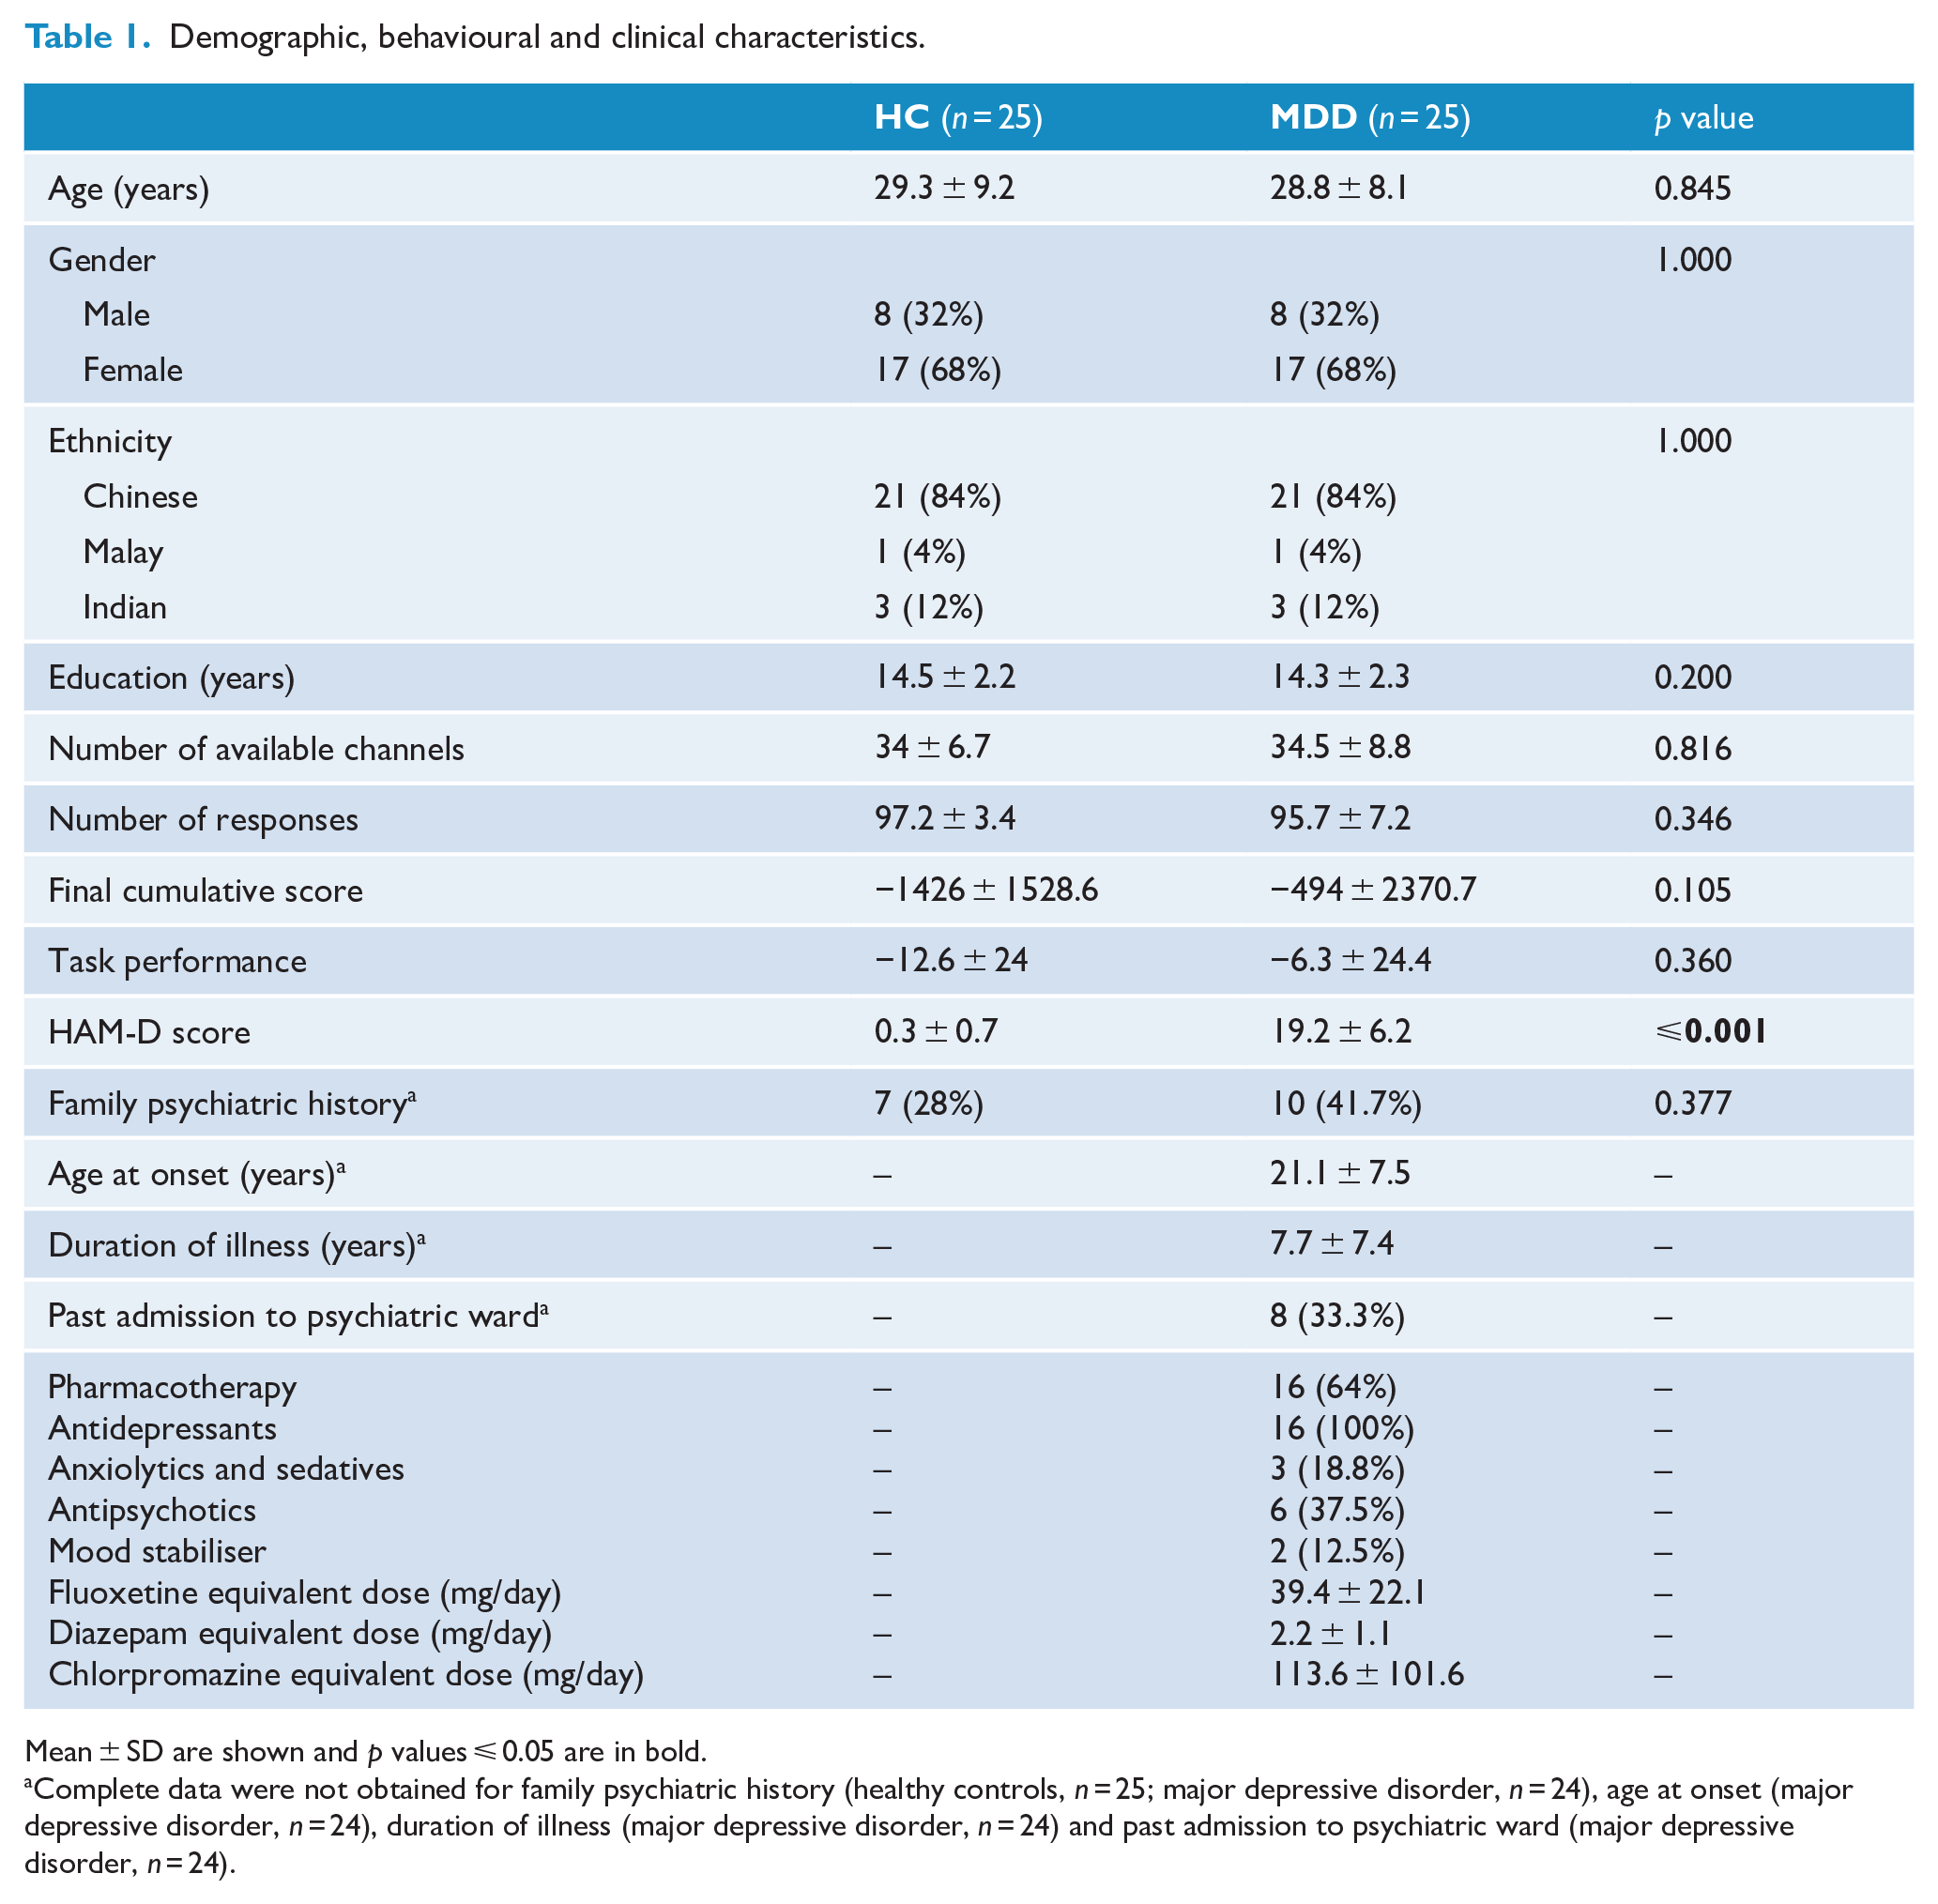
Mean ± SD are shown and p values ⩽ 0.05 are in bold.
Complete data were not obtained for family psychiatric history (healthy controls, n = 25; major depressive disorder, n = 24), age at onset (major depressive disorder, n = 24), duration of illness (major depressive disorder, n = 24) and past admission to psychiatric ward (major depressive disorder, n = 24).
Haemodynamic response during the IGT
HCs and patients with MDD did not differ in the number of available channels (p > 0.05). In HCs, mean oxy-haemoglobin during the task period was higher than the pre-task baseline in 10 channels located at the left and right middle frontal gyri, the left and right inferior frontal gyri and the right precentral gyrus (unadjusted p values from ⩽0.001 to 0.05; Figure 1). Five of these channels survived FDR correction (channels 1, 13, 24, 45 and 46; adjusted p values from 0.026 to 0.048). Mean deoxy-haemoglobin during the task period was lower than the pre-task baseline in seven channels located at the left and right middle frontal gyri and the left and right inferior frontal gyri (unadjusted p values from 0.001 to 0.38; Supplementary Figure 2), but these channels did not survive FDR correction.
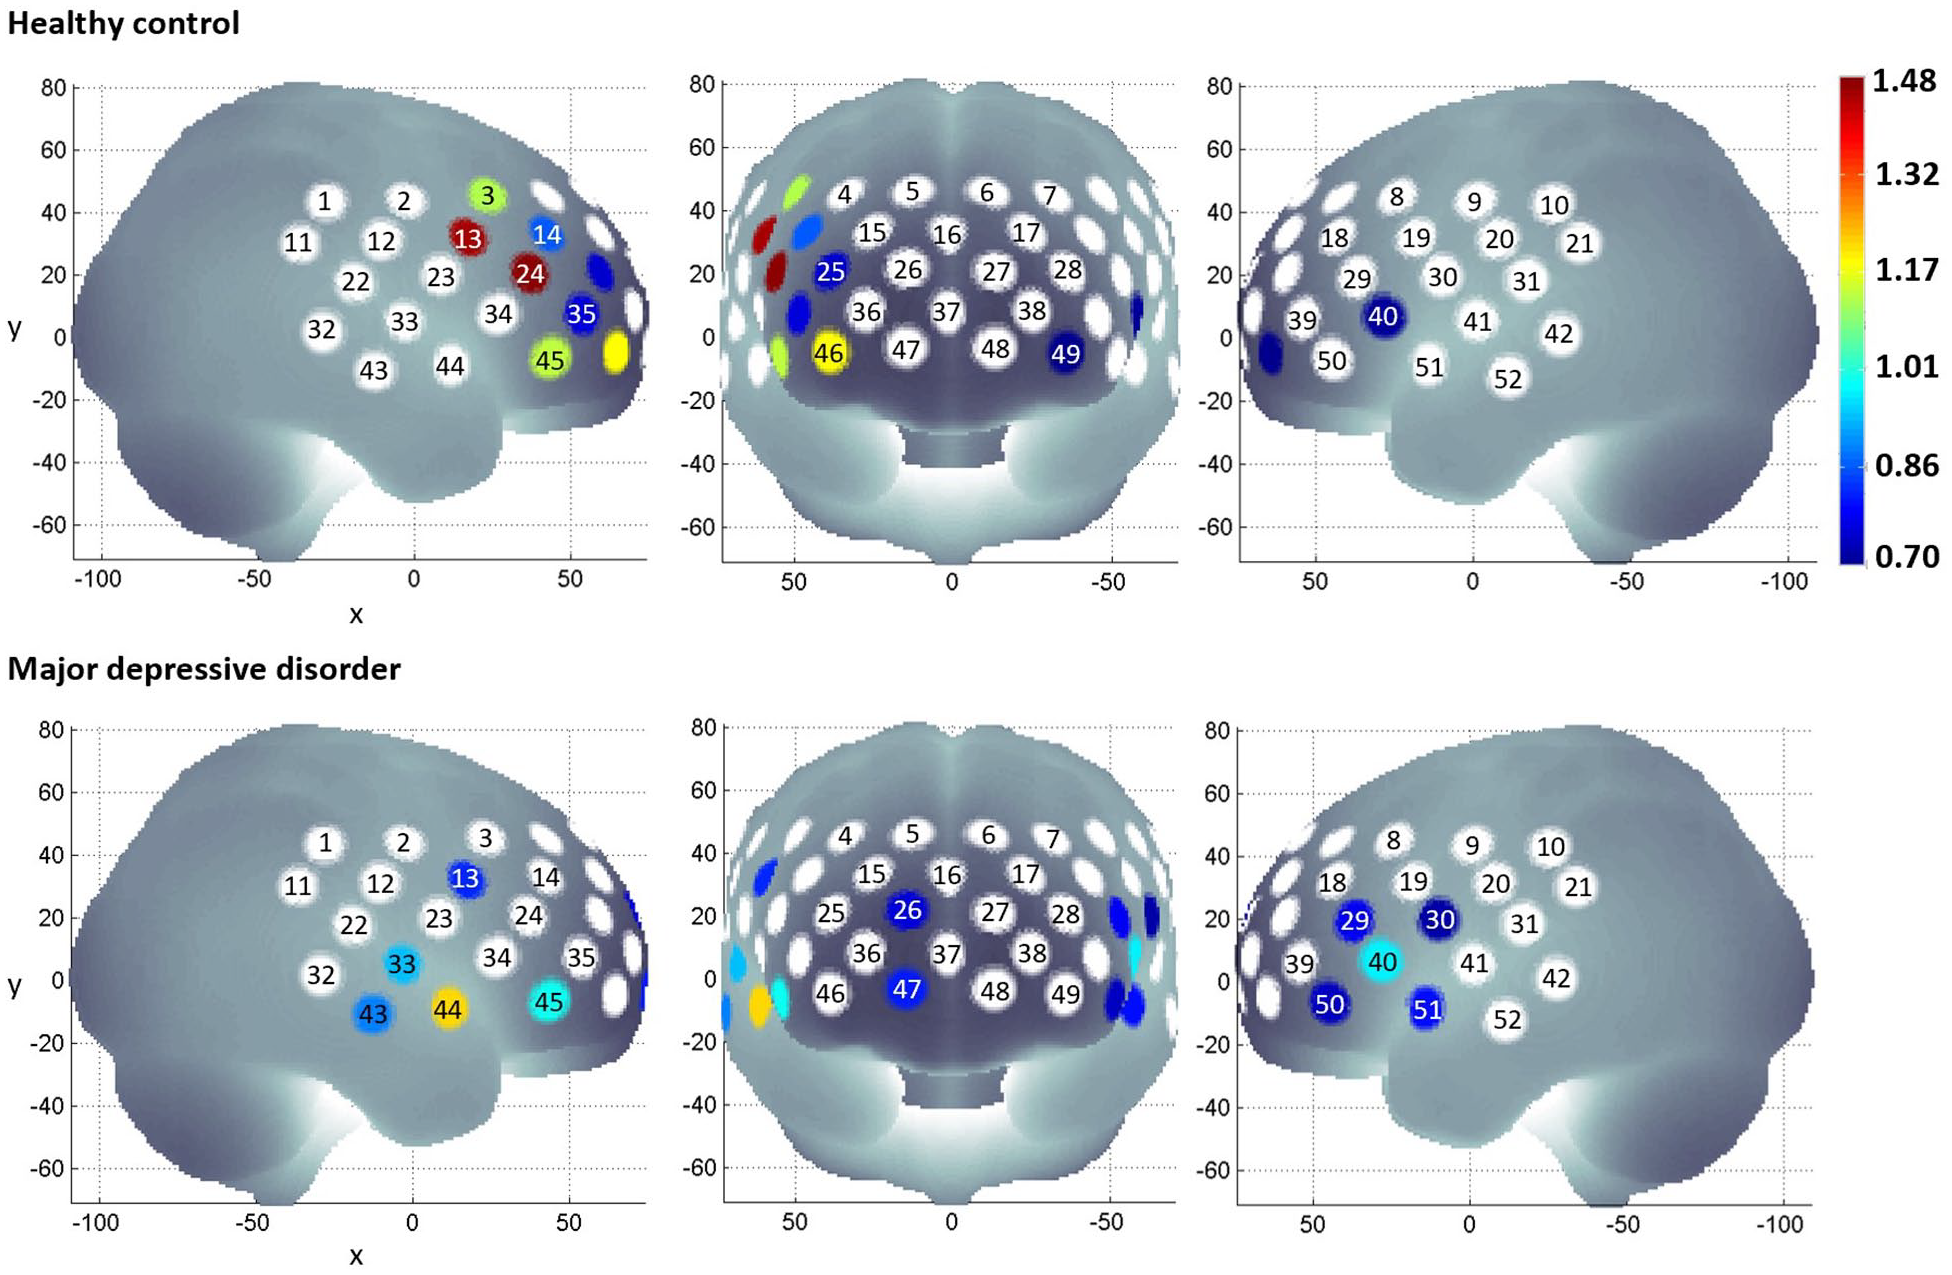
Mean oxy-haemoglobin during the pre-task baseline period and the task period was compared using paired sample t test per diagnostic group. Channels that did not show a statistically significant difference are white. The colour gradient indicates the effect size of oxy-haemoglobin increase from the pre-task baseline to the task period.
In patients with MDD, mean oxy-haemoglobin during the task period was higher than the pre-task baseline in 12 channels located at the right middle frontal gyrus, the left and right inferior frontal gyri, the left and right precentral gyri and the left and right superior temporal gyri (unadjusted p values from ⩽0.001 to 0.047; Figure 1). One of these channels survived FDR correction (channel 44; adjusted p value = 0.044). Mean deoxy-haemoglobin during the task period was lower than the pre-task baseline in one channel located at the left superior temporal gyrus (unadjusted p = 0.011; Supplementary Figure 2), but this channel did not survive FDR correction.
When diagnostic groups were compared, patients with MDD had lower mean oxy-haemoglobin during the task period than HCs in 17 channels located at the left and right middle frontal gyri, the left and right inferior frontal gyri, the left and right precentral gyri and the left and right superior temporal gyri (unadjusted p values from ⩽0.001 to 0.031; Figure 2). Seven channels survived FDR correction (channels 13, 24, 29, 40, 45, 46 and 49; adjusted p values from 0.003 to 0.05). Patients with MDD had higher mean deoxy-haemoglobin during the task period compared to HCs in four channels located at the left and right middle frontal gyri, the right inferior gyrus and the right middle temporal gyrus (unadjusted p values from 0.007 to 0.046; Supplementary Figure 3) but these channels did not survive FDR correction. These results suggest diminished haemodynamic response in the prefrontal cortex of patients with MDD during the IGT.
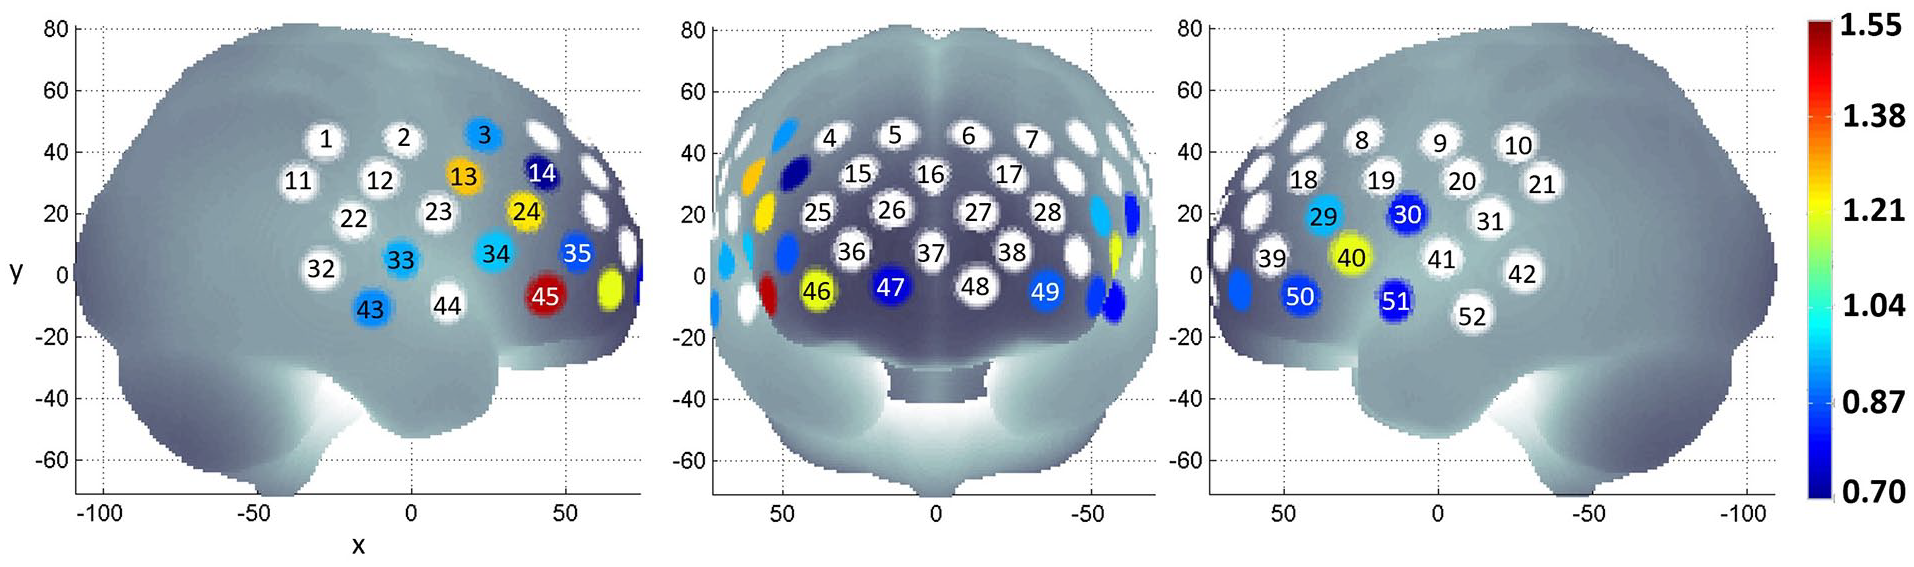
Differences in mean oxy-haemoglobin during the task periods between HCs and patients with MDD were determined by Student’s t test. Channels that did not show a statistically significant difference between groups are white. The colour gradient indicates the effect size of diminished oxy-haemoglobin in patients with MDD relative to HCs.
Oxy-haemoglobin and depression severity
Among the behavioural variables, clinical variables and cortical regions studied, HAM-D score negatively correlated with mean oxy-haemoglobin during the task period at channel 46 in patients with MDD (Pearson’s r = −0.423; p = 0.024; Figure 3). None of the behavioural and clinical variables were associated with mean oxy-haemoglobin during the task period at channel 46 for HCs (p > 0.05, Supplementary Table 2).
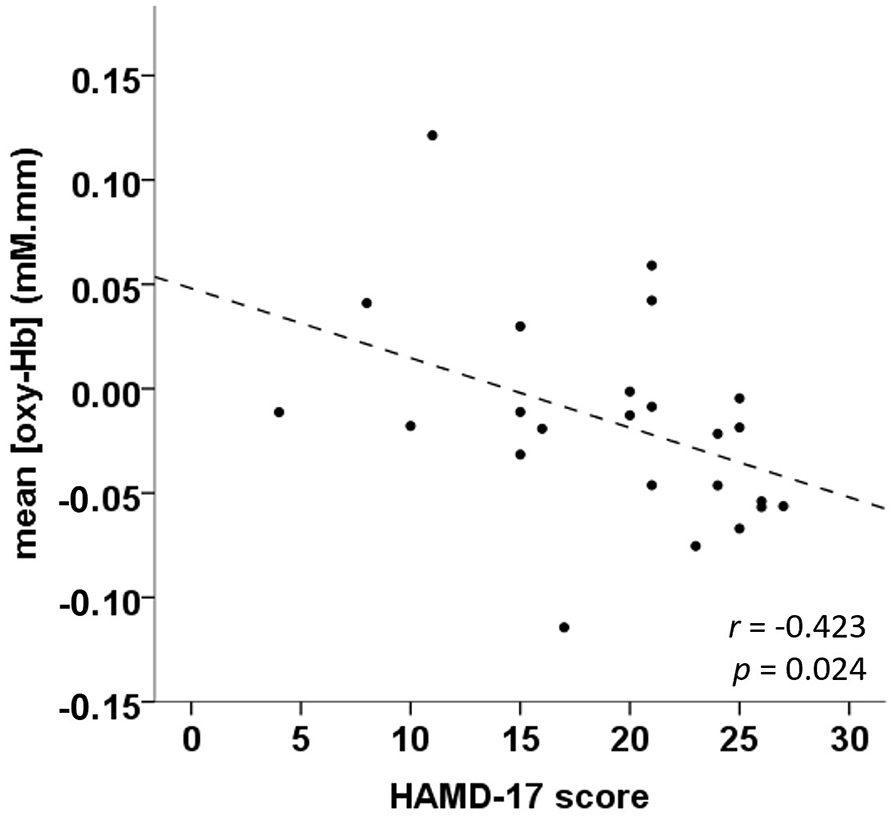
Correlation of haemodynamic response and MDD severity at channel 46.
The association between haemodynamic response and MDD severity was confirmed using multiple linear regression (adjusted R2 = 0.234), where mean oxy-haemoglobin at channel 46 was the dependent variable, while HAM-D score (β = −0.003; SE= 0.002; p = 0.042), number of responses (β = −0.003; SE = 0.001; p = 0.066), cumulative score (β < 0.001; SE < 0.001; p = 0.117), task performance (β = −0.001; SE < 0.001; p = 0.072) and pharmacotherapy status (β = −0.010; SE = 0.021; p = 0.628) were independent variables.
Channel 46 is located at the right inferior frontal gyrus, which corresponds to Broadman’s area number 11, known as the orbitofrontal area (Wang et al., 2017). Average waveforms in this area (Figure 4) show a typical haemodynamic response in HCs. However, in patients with MDD, oxy-haemoglobin declines shortly after the onset of task periods, while deoxy-haemoglobin increased halfway into task periods. These findings suggest that haemodynamic dysfunction occurs at the orbitofrontal cortex of patients with MDD during the IGT, and the decline in haemodynamic response may be associated with depression severity.
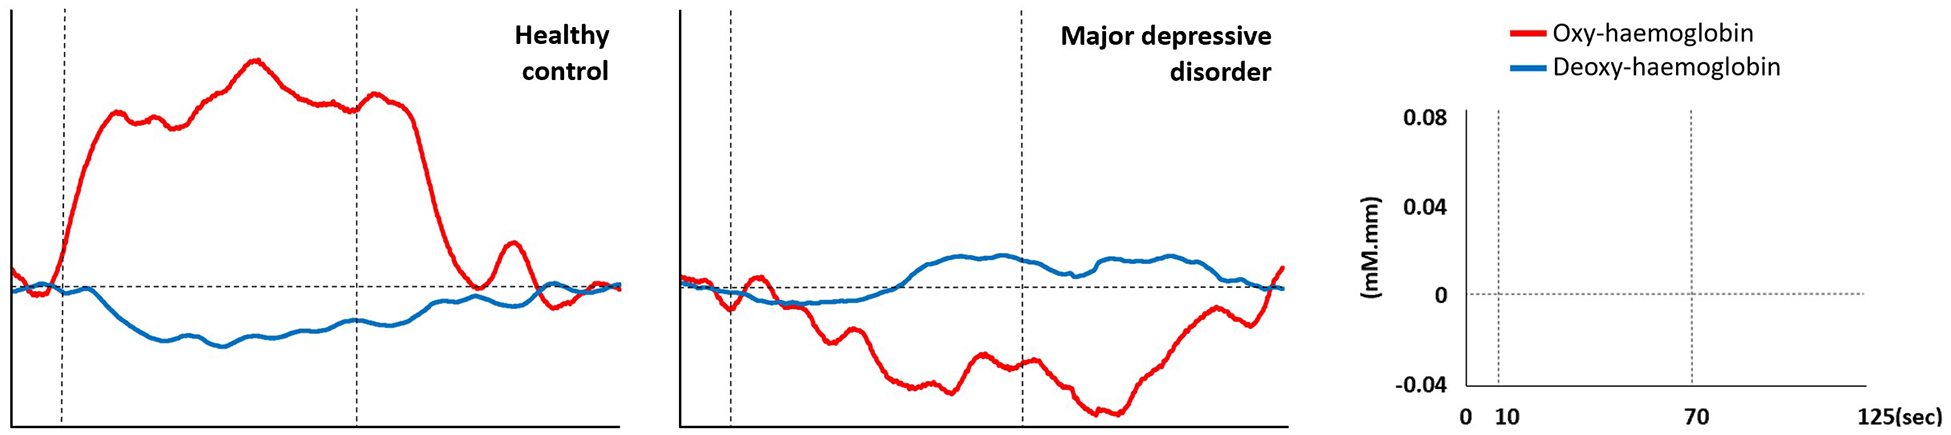
Average oxy-haemoglobin and deoxy-haemoglobin waveforms at channel 46. Vertical dotted lines indicate the start and end of the task period.
Discussion
This study lends further support for the role of the prefrontal cortex in decision-making. Similar to fMRI reports (Fukui et al., 2005; Lawrence et al., 2009; Li et al., 2010; Lin et al., 2008), fNIRS shows activation of the prefrontal cortex in HCs during the IGT. Interestingly, among the channels where activation occurred in HCs, the majority were located at the right prefrontal cortex. This may be explained by an EEG study of HCs, where higher alpha activity at rest in the right frontal brain compared to the left side was associated with disadvantageous strategy in the IGT (Schutter et al., 2004). Likewise, fMRI of HCs revealed higher activity in the right prefrontal cortex compared to the corresponding left region in the early stages of the IGT (Li et al., 2019). Interestingly, HCs performed poorer on the IGT than patients with MDD in this study. Even though this difference was not statistically significant, HCs are expected to perform better than patients with MDD (Buelow and Suhr, 2009). In their analysis of multiple IGT data sets, Steingroever et al. (2013) concluded that HCs prefer decks with infrequent losses, their choices are idiosyncratic and the number of switches between decks remain constant over trials. Simply put, HCs may not always adopt an advantageous strategy during the IGT. Nevertheless, HCs have higher prefrontal cortex activity than patients with MDD during the IGT shown by both fNIRS and fMRI (Olie et al., 2015).
More importantly, this study provides objective evidence relating MDD diagnosis with diminished prefrontal cortex activity during decision-making processes. It is the first report of fNIRS signals in patients with MDD during the IGT, and it is in line with an earlier fNIRS study that showed reduced oxy-haemoglobin during the IGT in the prefrontal cortex of patients with bipolar disorder (BD) compared to HCs (Ono et al., 2015). While the IGT demonstrates impaired decision-making in both MDD and BD, these patient groups do not differ in their IGT performance (Gu et al., 2020). In contrast, fNIRS studies have shown differential prefrontal cortex activity between MDD and BD during other cognitive tasks, such as the verbal fluency task (Takizawa et al., 2014) and one-back task (Zhu et al., 2018). Hence, it is conceivable that future fNIRS investigations may identify differences in brain activity during the IGT between these two mood disorders.
Another significant finding in this study was the negative correlation between HAM-D scores and mean oxy-haemoglobin at the right orbitofrontal cortex. This association was also found in patients with BD (Ono et al., 2015). The orbitofrontal cortex is critical for individuals to predict the consequences of potential outcomes, which in turn enables one to make optimal decisions (Rudebeck and Rich, 2018). Thus, the cognitive symptoms of MDD may be related to reduced orbitofrontal cortex function. Apart from lower brain activity, reductions in grey matter (Lacerda et al., 2004), cellular proliferation (Miguel-Hidalgo et al., 2014), fatty acid composition (McNamara et al., 2007) and cell signalling (Yamada et al., 2003) have been observed in the orbitofrontal cortex. In other words, functional neuroimaging results are supported by structural neuroimaging, tissue analysis and molecular methods. Furthermore, the orbitofrontal cortex may be a promising site for non-invasive brain stimulation therapy. For example, preliminary evidence from Feffer et al. (2018) identified the right orbitofrontal cortex as an effective site for repetitive transcranial magnetic stimulation in the treatment of MDD. In addition, in a study on HCs, Ouellet et al. (2015) observed improvements in IGT scores after transcranial direct current stimulation of the orbitofrontal cortex. Still, the mechanism behind the clinical efficacy of these treatments remains elusive (Liu et al., 2017). Therefore, future research efforts may utilise fNIRS signals during the IGT to better understand the neurophysiological changes that occur after non-invasive brain stimulation therapies.
There are several limitations to this study, starting with the small sample size. Consequently, cortical activity of MDD subtypes could not be compared. Likewise, the relationship between fNIRS signals and individual HAM-D items, such as suicidal thought, could not be determined. Second, pharmacotherapy varied greatly between patients and the effects of each drug on haemodynamic response is not clear. Finally, the cross-sectional design of this study cannot establish a causal relationship between reduced haemodynamic response and MDD onset or severity. Despite these limitations, this study provides new information on cortical function in patients with MDD as they perform a decision-making task.
In conclusion, haemodynamic response during the IGT in the prefrontal cortex of patients with MDD is altered, and the extent of such changes may be related to disorder severity. These fNIRS findings provide preliminary biological evidence that may be linked to reduced decision-making capacity typically observed in MDD during clinical interviews and neurocognitive tests.
Supplemental Material
sj-pdf-1-anp-10.1177_0004867420976856 – Supplemental material for Functional near-infrared spectroscopy during a decision-making task in patients with major depressive disorder
Supplemental material, sj-pdf-1-anp-10.1177_0004867420976856 for Functional near-infrared spectroscopy during a decision-making task in patients with major depressive disorder by Syeda F Husain, Samantha K Ong, Liu Cuizhen, Bach Tran, Roger C Ho and Cyrus S Ho in Australian & New Zealand Journal of Psychiatry
Footnotes
Acknowledgements
The authors would like to thank all study participants and Hitachi Medical Systems Singapore for their in-kind contribution of the ETG-4000 system.
Data Availability
The data that support the findings of this study are available on request from the corresponding author. The data are not publicly available due to privacy or ethical restrictions.
Declaration of Conflicting Interests
The author(s) declared no potential conflicts of interest with respect to the research, authorship and/or publication of this article.
Funding
The author(s) disclosed receipt of the following financial support for the research, authorship and/or publication of this article: This study was supported by the National University Health System, Singapore (NUHS; Seed grant), the Centre for Family and Population Research (CFPR; Seed grant) and the Institute for Health Innovation & Technology (iHealthTech; OOE grant) at the National University of Singapore, as well as the Vingroup Innovation Foundation (VINIF, project code VINIF.2019.DA14).
Role of Funders
Funders did not participate in the design of the study; the collection, management, management, analysis and interpretation of the data; preparation, review or approval of the manuscript; and decision to submit the manuscript for publication.
Supplemental Material
Supplemental material for this article is available online.
References
Supplementary Material
Please find the following supplemental material available below.
For Open Access articles published under a Creative Commons License, all supplemental material carries the same license as the article it is associated with.
For non-Open Access articles published, all supplemental material carries a non-exclusive license, and permission requests for re-use of supplemental material or any part of supplemental material shall be sent directly to the copyright owner as specified in the copyright notice associated with the article.