
Abstract
Introduction:
Poor sleep and depressive symptoms are common throughout the perinatal period, but little is known about the extended time course of depression and the sleep dimensions associated with these trajectories.
Objective:
This study investigated different depression trajectories in New Zealand Māori and non-Māori women from late pregnancy to 3 years postnatal. Relationships between multiple dimensions of sleep and these depression trajectories were also investigated.
Methods:
Data from 856 women (30.6% Māori and 69.4% non-Māori) from the longitudinal Moe Kura cohort study were used. Depressive symptoms and multiple dimensions of sleep (quality, duration, latency, continuity and daytime sleepiness) were collected at 36 weeks’ gestation, 12 weeks postnatal and 3 years postnatal. Trajectory analysis was completed using latent class analysis.
Results:
Latent class analysis revealed two distinct groups of depressive symptom trajectories: ‘chronic high’ and ‘stable mild’ for both Māori and non-Māori women. Māori women in both trajectories were more likely than non-Māori women to have clinically significant depressive symptoms at every time point. Poorer sleep quality, latency, continuity and greater daytime sleepiness were consistently associated with the chronic high depressive symptom trajectory at all three time points, after controlling for sociodemographic factors.
Conclusion:
A significant proportion of Māori and non-Māori women experience chronically high depressive symptoms during the perinatal period and the following years. Across this extended time frame, Māori women have a higher probability of experiencing clinically significant depressive symptoms compared to non-Māori women. These persistent patterns of depressive symptoms occur concurrently with multiple dimensions of poor sleep. Given the well-described impact of maternal depression on the mother, child, family and community, this highlights the importance of healthcare professionals asking about mothers’ sleep quality, continuity, latency and daytime sleepiness as potential indicators of long-term mood outcomes.
Introduction
There is clear evidence that maternal depression can have severe and enduring adverse consequences for both the mother and the child, as well as the extended family (Letourneau et al., 2012). Depression in pregnancy can lead to inadequate uptake of antenatal care; adverse obstetric outcomes; poor family functioning; poor infant bonding, feeding and sleeping (Chuang et al., 2011); and deficits in children’s social, behavioural, learning and cognition development (Burke, 2003). Mothers experiencing perinatal depression are more likely to experience future episodes (McMahon et al., 2008), while their children, partners and grandchildren are also at greater risk of experiencing depression (Weissman et al., 2005). In New Zealand, suicide is the leading single cause of maternal death, with rates higher than those seen in the United Kingdom and Australia (Perinatal and Maternal Mortality Review Committee, 2015).
Ethnic inequities in maternal mental health exist (Watson et al., 2019). In New Zealand, Māori women are at higher risk of experiencing symptoms of perinatal depression (22%) compared to non-Māori women (15%) (Signal et al., 2016). These reported rates may be conservative, due to inequities in access to care and the quality of care received, resulting in Māori women being less likely to be detected or treated for depression by maternal care providers (Oakley Browne et al., 2006). Māori women also have higher overall maternal mortality and suicide rates (Perinatal and Maternal Mortality Review Committee, 2018), often experience earlier onset of mental health conditions, have depressive symptoms of greater severity and are more likely to have simultaneous risk factors, such as younger age, lower socioeconomic status, poorer access to services and less partner support (New Zealand Ministry of Health, 2008).
Prolonged or recurrent episodes of maternal depression are likely to have long-term physical and psychological effects on the mother and child (Slomian et al., 2019). Importantly, recent studies have shown that depression is not uniform and trajectories differ between individual women (Nandi et al., 2009). In a systematic review of longitudinal depression studies, Vliegen et al. (2014) identified two community-based studies that included women with depression at 3–4 months postnatal, of whom 17–62% experienced depressive symptoms 3 years later. Furthermore, this review showed that in two clinical samples, 39–58% of mothers with early postnatal depression continued to experience it 3–3.5 years later. Since this review, an increasing number of studies have utilised trajectory analysis to examine the time course of perinatal depression. Analyses of this type are valuable because they could reveal variability and patterns in the development and/or persistence of depression (Tomfohr et al., 2015).
Poor or insufficient sleep is linked to depression (Peterson and Benca, 2008), and it appears that a proportion of women are unable to consistently achieve healthy sleep throughout pregnancy (Ross et al., 2005). Early pregnancy sleep disturbances have been linked to later pregnancy depressive symptoms (Skouteris et al., 2009) and late pregnancy poor sleep is independently associated with postnatal depression (Tomfohr et al., 2015). The few studies that have examined trajectories of sleep and depression across the perinatal period show that poor sleep patterns are associated with depressive symptoms (Tzeng et al., 2015; Wang et al., 2018), or conversely, trajectories of depressive symptoms are associated with poor sleep (Kuo et al., 2012). These studies have typically only examined one dimension of sleep, such as sleep duration or sleep quality. To our knowledge, no study to date has investigated whether multiple dimensions of sleep are associated with depressive symptom trajectories. Sleep is a series of complex physiological processes that are not easily portrayed by a single measure, and it may be that various sleep dimensions, or more importantly combinations of dimensions, are more predictive of mood changes at particular time points throughout the perinatal period (Paulson and Miller-Graff, 2019).
Investigating how sleep and depressive symptoms are related could provide the basis for early detection and interventions. Sleep is a critical health behaviour and is necessary to maintain and improve mental and physical health outcomes. It is also one of the few potentially modifiable risk factors for depression. In New Zealand, the prevalence of sleep problems and disorders is higher among Māori compared with non-Māori (Paine and Gander, 2013). Recognising and treating poor sleep health as a vital aspect of a mother’s overall health could be a novel intervention to reduce inequities in maternal mental health.
This study investigates the trajectories of depressive symptoms from late pregnancy to 3 years after birth in a large community-based sample of Māori and non-Māori women and the different dimensions of sleep associated with those trajectories. Buysse’s ‘Sleep Health’ conceptual model (Buysse, 2014) underpinned the selection of measures used to assess sleep. This approach considers sleep as a multidimensional model that ‘promotes physical and mental well-being’. We investigated four of Buysse’s five sleep health dimensions: quality, quantity, continuity and daytime sleepiness. The fifth sleep dimension, sleep timing, was not available, and instead data on sleep latency (onset insomnia) were included in analyses.
Methods
Participants
Data for this analysis were drawn from the Moe Kura prospective observational cohort study, collected between October 2009 and April 2015. Details of the recruitment process for Moe Kura are described elsewhere (Signal et al., 2016). Questionnaires were completed by women at 35–37 weeks of gestation (T1), at 12 weeks postnatal (T2) and at 3 years postnatal (T3). Women provided demographic and lifestyle information as well as responding to items on their sleep, and prior and current health and mood. Inclusion criteria for participation in the study included carrying a single foetus, 16 years of age or older, and being between 35 and 37 weeks of gestation. The Moe Kura study was designed to investigate ethnic inequities in maternal sleep and health between Māori and non-Māori in New Zealand, with Kaupapa Māori epidemiological research principles informing the study design, analysis and reporting (Paine and Gander, 2013; Simmonds et al., 2008). The Kaupapa Māori principles employed in the Moe Kura study are aligned with the CONSIDER criteria (CONSolIDated critERtia for strengthening the reporting of health research involving Indigenous Peoples) and broadly meet the same expectations (Huria et al., 2019).
Ethical approval for the study was obtained from the Central Region Health and Disability Ethics Committee (protocol CEN 09/09/070), and written informed consent was obtained from all participants. Prior to statistical analysis, any outliers in the database (data not possible within the scale limits) were checked and either removed or corrected by referring back to the original questionnaire.
Measures
Demography, health and lifestyle
The following measures were collected: maternal age; ethnicity (categorised as Māori [anyone who identified as Māori either alone or in combination with another ethnic group(s)] or non-Māori [all others]) (Statistics New Zealand, 2017); currently pregnant; having an additional child younger than their Moe Kura child; relationship satisfaction using an 8-point Likert-type scale (range, 0–7; where <3 signifies greater satisfaction and ⩾3 signifies less satisfaction or not applicable); history of diagnosed depression; stressful life events (using the 13-item Pregnancy Risk Monitoring System [PRAMS] where low stress was considered <2 stressors and high stress was considered ⩾2 stressors) (Mukherjee et al., 2017); and an area-level measure of socioeconomic deprivation. Women were assigned to a socioeconomic deprivation decile based on their residential address using the 2006 New Zealand Index of Deprivation (NZDep 2006) at T1 and T2 and the 2013 New Zealand Index of Deprivation (NZDep2013) at T3, which are based on the respective 2006 and 2013 population census (decile 1 = 10% of small areas with lowest levels of deprivation to decile 10 = 10% of small areas with highest levels of deprivation). In analyses, these were utilised as quintiles (i.e. five levels, each representing 20% of small areas) (Atkinson et al., 2014).
Sleep measures
Sleep duration was measured at each time point by the question ‘How many hours of sleep do you usually get in 24 hours, including naps?’ Sleep quality, latency and continuity were assessed using the relevant General Sleep Disturbance Scale (GSDS) subscales (Lee and Gay, 2004). Each item in the GSDS was rated from 0 (never) to 7 (every day), and if a subscale comprises two or more items, the mean was calculated. Sleep quality was assessed using the GSDS Quality Subscale items: ‘How often in the last week did you feel rested upon awakening at the end of a sleep period?’ ‘How often in the last week did you feel satisfied with the quality of your sleep?’ and ‘How often in the last week did you sleep poorly?’ The first and last items are reverse-scored. Sleep latency was assessed using the GSDS Onset Insomnia Subscale item: ‘How often in the last week did you have difficulty getting to sleep?’ Sleep continuity was measured by the GSDS Maintenance Insomnia Subscale items: ‘How often in the last week did you wake up during your sleep period?’ and ‘How often in the last week did you wake up too early at the end of your sleep period?’ Validity and reliability of the GSDS have been demonstrated in childbearing women (Lee and Gay, 2004). Daytime sleepiness was measured by the Epworth Sleepiness Scale (ESS). The ESS assesses daytime sleepiness in eight everyday situations using the question ‘How likely are you to doze off in the following situations, in contrast to feeling just tired . . .?’ The ESS has been demonstrated to be reliable and valid for use in pregnant populations (Baumgartel et al., 2013), and excessive daytime sleepiness is typically defined as a total score ⩾10 (Johns, 1991).
Mental health measures
Depressive symptoms were measured by the 10-item Edinburgh Postnatal Depression Scale (EPDS) at T1 and T2, with scores at or above 13 considered clinically significant (Cox et al., 1987; National Collaborating Centre for Mental Health, 2014). The EPDS is a screening tool used internationally to detect depressive symptomatology in women during pregnancy and postnatal periods. While validated for use in pregnancy and postnatally (Kozinszky and Dudas, 2015), the EPDS has not been used extensively beyond 1 year after birth. For this reason, the 10-item Kessler (K-10, using a 0–4 Likert-type scale) was used to identify psychological distress at T3. The K-10 was developed for use in the US National Health Interview Survey and has been used in the annual New Zealand Health Survey since 2006/2007 and in the New Zealand Mental Health Survey since 2003/2004, with scores of 12 or more strongly associated with having a depressive disorder in the previous month and in the previous year (Oakley Browne et al., 2010).
Although depressive symptoms were assessed using different scales, both the EDPS and K-10 cut-offs are recognised as indicating clinically significant depressive symptoms. In the trajectory analysis described below, a binary variable (having clinically significant depressive symptoms or not) was used.
Statistical analysis
Latent class analysis (LCA) is an advanced statistical approach for identifying discrete subgroups of participants within a study cohort. Classes (or groups) are not directly observable, they are dormant, hence the term latent (Roeder et al., 1999). LCA is similar to factor or cluster analysis, in that it classifies participants into mutually exclusive and exhaustive subgroups based on observed patterns in the data. Furthermore, LCA is person-oriented rather than variable-oriented. While variable-oriented approaches focus on identifying relationships between variables, with the assumption that the relationships are stable across the sample, person-oriented approaches identify groups of people who exhibit similar trajectories or characteristics with the number and type of classes not known a priori. Although group and individual trajectories cannot be exactly identical, individuals follow approximately the same course as other individuals in their group (Nagin and Tremblay, 2005). In line with the Kaupapa Māori epidemiological research principles applied in the Moe Kura cohort (Paine and Gander, 2013), LCAs were conducted for Māori and non-Māori women separately to determine whether the number of classes and shape of trajectories differed between these populations.
A two-step statistical approach was taken. First, patterns of clinically significant depressive symptoms were modelled at three time points using LCA (T1, T2 and T3) and subgroups of women with specific trajectories were identified. Two- and three-group LCA models were fit and compared and included both linear and quadratic terms (given there were only three time points, no further orders beyond quadratic were included in models). Where the model could not be fit, due to a paucity of data, the models were condensed either to two groups and/or to include only linear terms. The optimal model was chosen using the Bayesian information criteria (BIC), with greater (less negative) absolute BIC values indicating a better model fit. Parsimony and clinical interpretability were also taken into account (Zhou et al., 2017). Class (trajectory group) prevalences and posterior probabilities were used to interpret the model, with prevalences providing the proportion of people belonging to a class and posterior probabilities reflecting the chance that an individual is correctly classified. Individuals were assigned to each latent class with the highest posterior probability, with a figure above 0.80 suggesting a good fit (Nagin and Tremblay, 2005). Kruskal–Wallis rank-sum test (for proportions) and analysis of variance (ANOVA) (for means) were used to test for differences between the depressive symptom variables in each of the latent classes at each time point.
Complete case logistic regression was used to investigate the association between each sleep variable and the likelihood of membership in the trajectory groups at each time point. We conducted univariate analysis between potential covariates and the outcome variable. Being currently pregnant and having a younger child had no significant relationship with the outcome and were not included in the final models, which were adjusted for maternal ethnicity, maternal age, stressful life events, prior history of depression, NZDep and relationship with the partner. Further adjusting for parity made no material difference to the results. Data are reported as odds ratios (ORs) and 95% confidence intervals (CIs). Analyses were performed in STATA (version 15).
Results
Sample characteristics
The study included 856 women (n = 262 Māori women and n = 594 non-Māori women) who completed questionnaires at each of the three times points, representing 75% of the baseline cohort. Women who did not complete all data collection time points and were not included in the analysis were more likely to be younger (p = 0.000), identify as Māori (p = 0.000), live in a more deprived area (p = 0.000), have more life stress (p = 0.000), be unhappy with their partner relationship (p = 0.004) and have higher depressive symptom scores (p = 0.030) than women with complete data sets at T1. No difference was seen for parity, a prior history of depression, or scoring at or above a cut-off of 13 on the EPDS.
Sample characteristics are summarised in Table 1. There was a significant difference (p = 0.020) between Māori and non-Māori for parity, with 45.5% of Māori and 53.8% of non-Māori women being nulliparous (51.3% of the total cohort). At T3, 35.1% of Māori and 38.7% of non-Māori had a child younger than their Moe Kura child, and 10.7% of Māori and 9.7% of non-Māori were currently pregnant (there were no statistical differences between these proportions). As illustrated in Table 1, Māori women were younger, lived in more deprived areas, experienced more stressful life events and had a less happy relationship with their partner.
Sample characteristics.
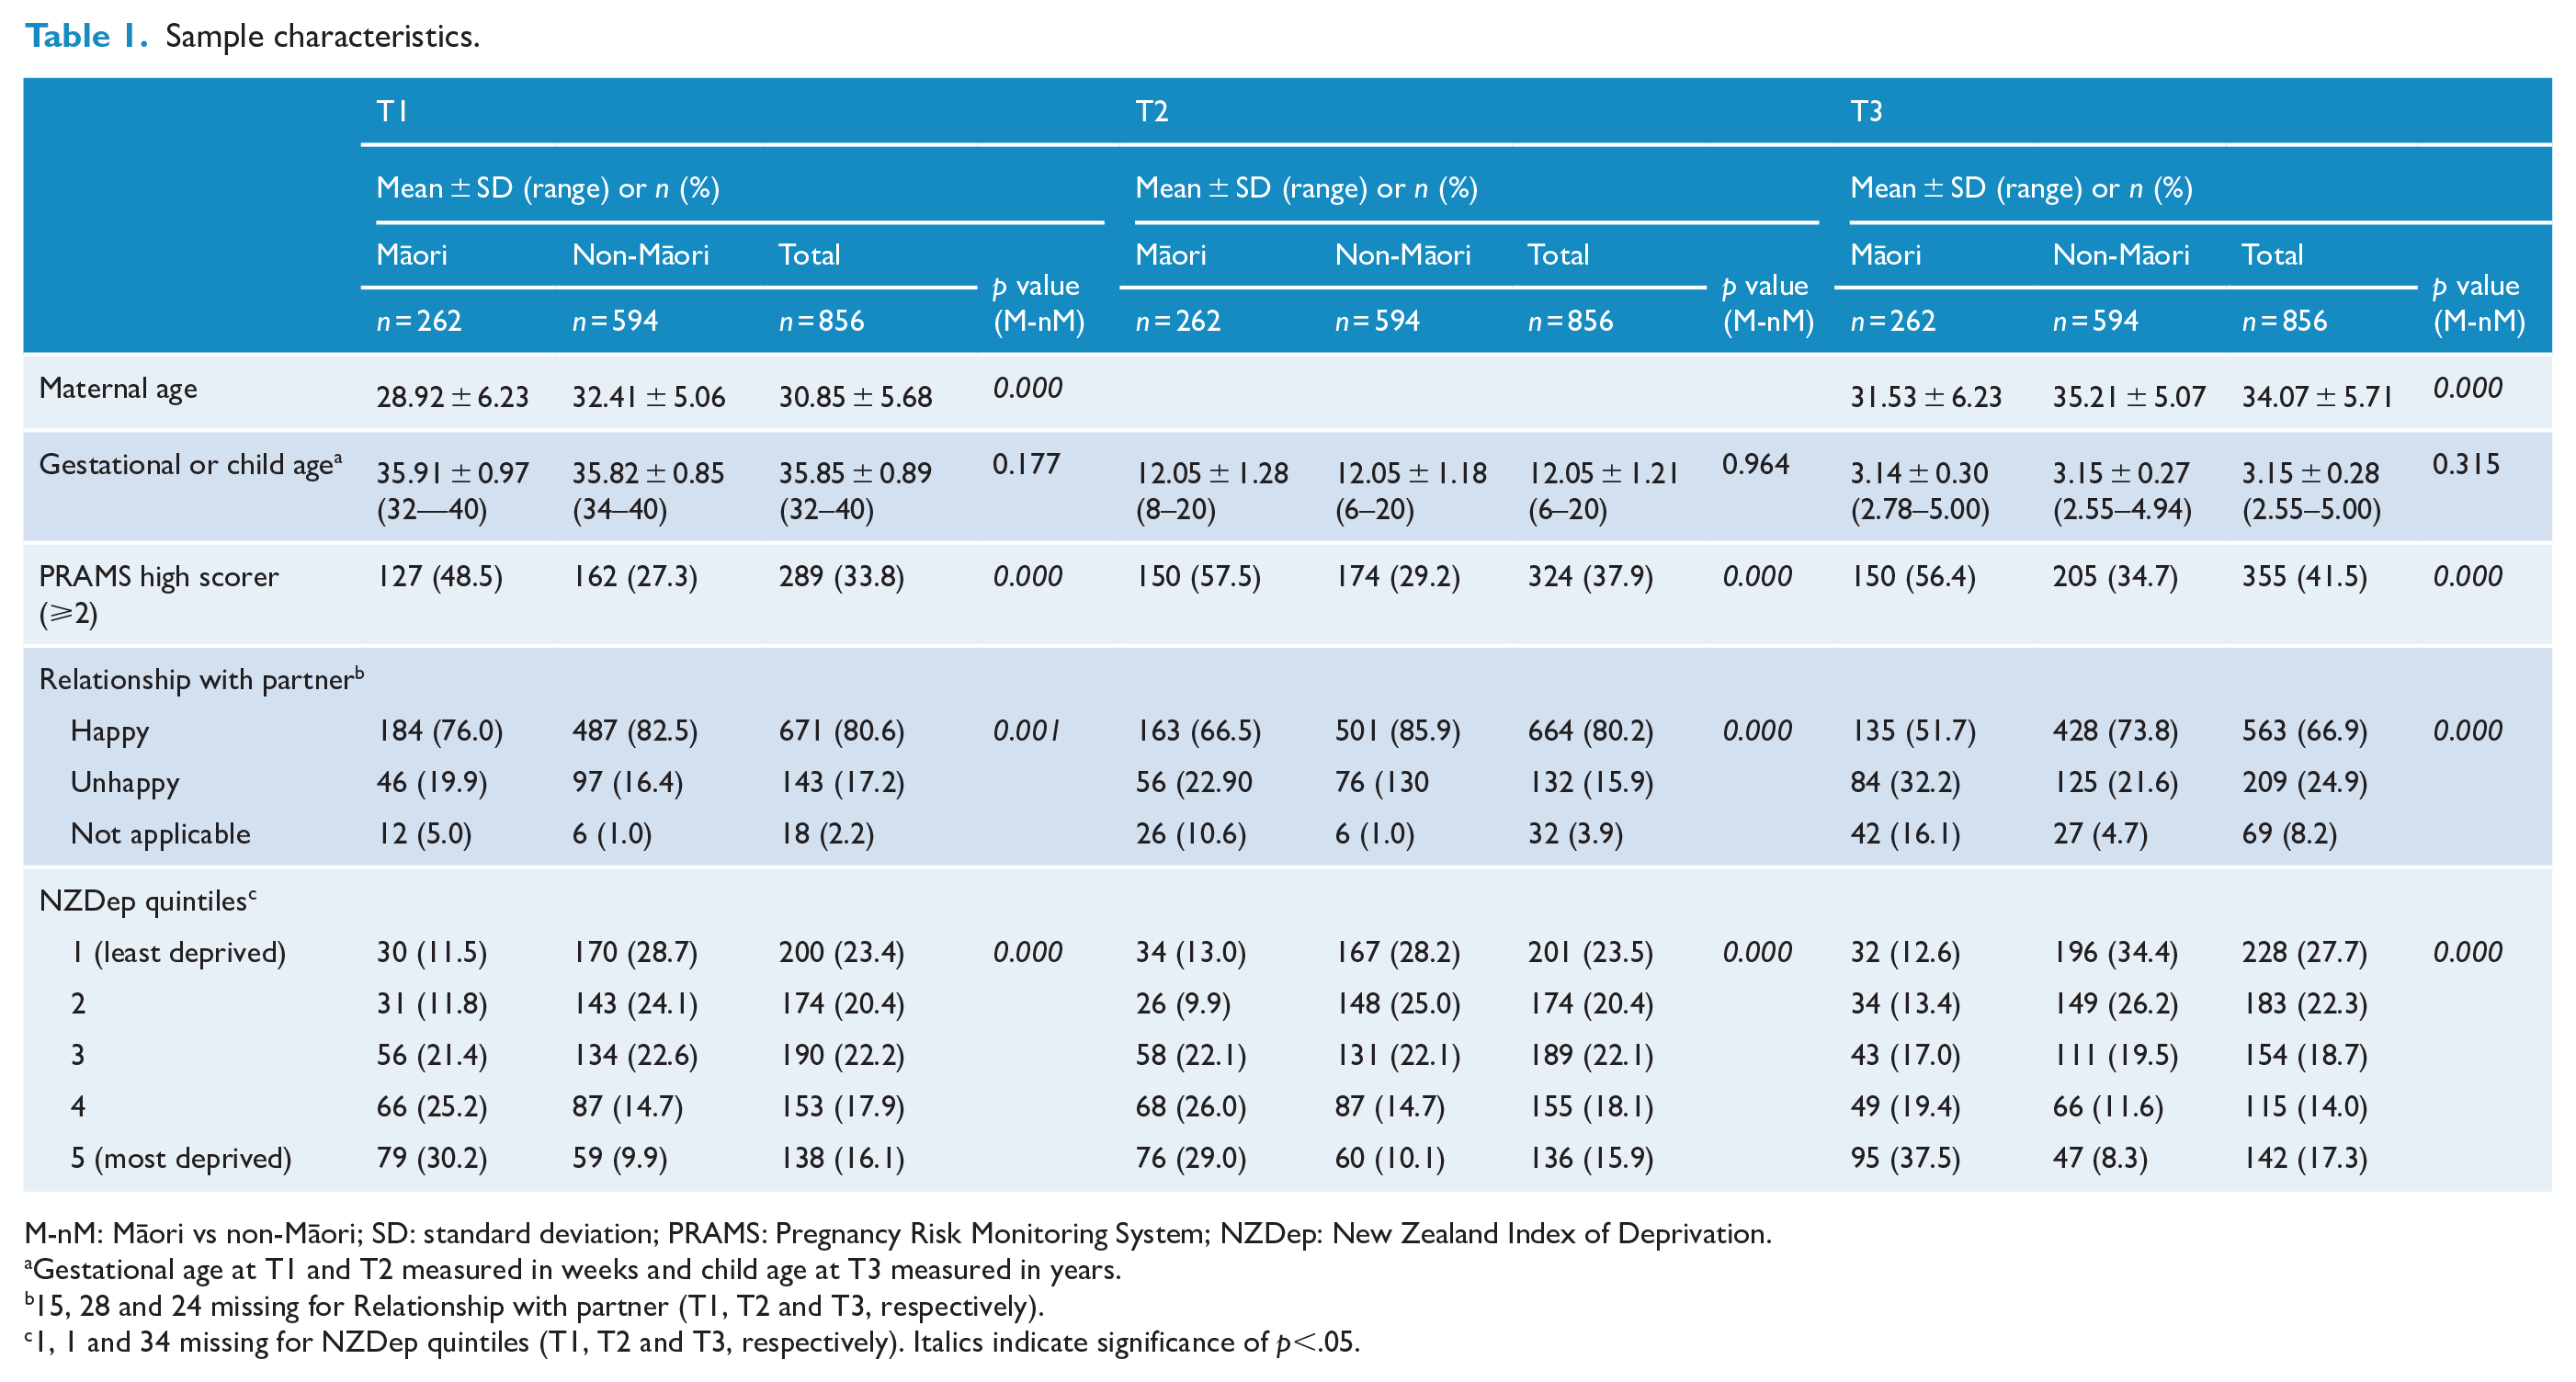
M-nM: Māori vs non-Māori; SD: standard deviation; PRAMS: Pregnancy Risk Monitoring System; NZDep: New Zealand Index of Deprivation.
Gestational age at T1 and T2 measured in weeks and child age at T3 measured in years.
15, 28 and 24 missing for Relationship with partner (T1, T2 and T3, respectively).
1, 1 and 34 missing for NZDep quintiles (T1, T2 and T3, respectively). Italics indicate significance of p <.05.
Sleep and depression results
Sleep and depressive symptom scores for Māori and non-Māori women are shown in Table 2. Twenty-two percent of Māori women had clinically significant EPDS scores at T1 compared with 14.5% of non-Māori women, a statistically significant difference. This difference continued at T2 (11.9% Māori vs 6.8% non-Māori) and with K-10 scores at T3 (21.8% Māori vs 13.0% non-Māori). Mean scores on the EPDS were significantly different at T1 and T2 and with K-10 at T3 (p = 0.001, p = 0.047 and p = 0.000) between Māori and non-Māori as was the proportion of women with a clinically significant EPDS (T1 and T2) and K-10 score (T3) (p = 0.007, p = 0.015 and p = 0.002). Sleep duration was significantly longer for Māori women compared to non-Māori women at each time point score (p = 0.050, p = 0.001 and p = 0.000). Māori women also experienced more nights per week where they had difficulty falling asleep at T1 (p = 0.000) and T3 (p = 0.001) and greater daytime sleepiness at T1 (p = 0.003).
Sleep and depressive symptom scores for Māori and non-Māori at each time point.
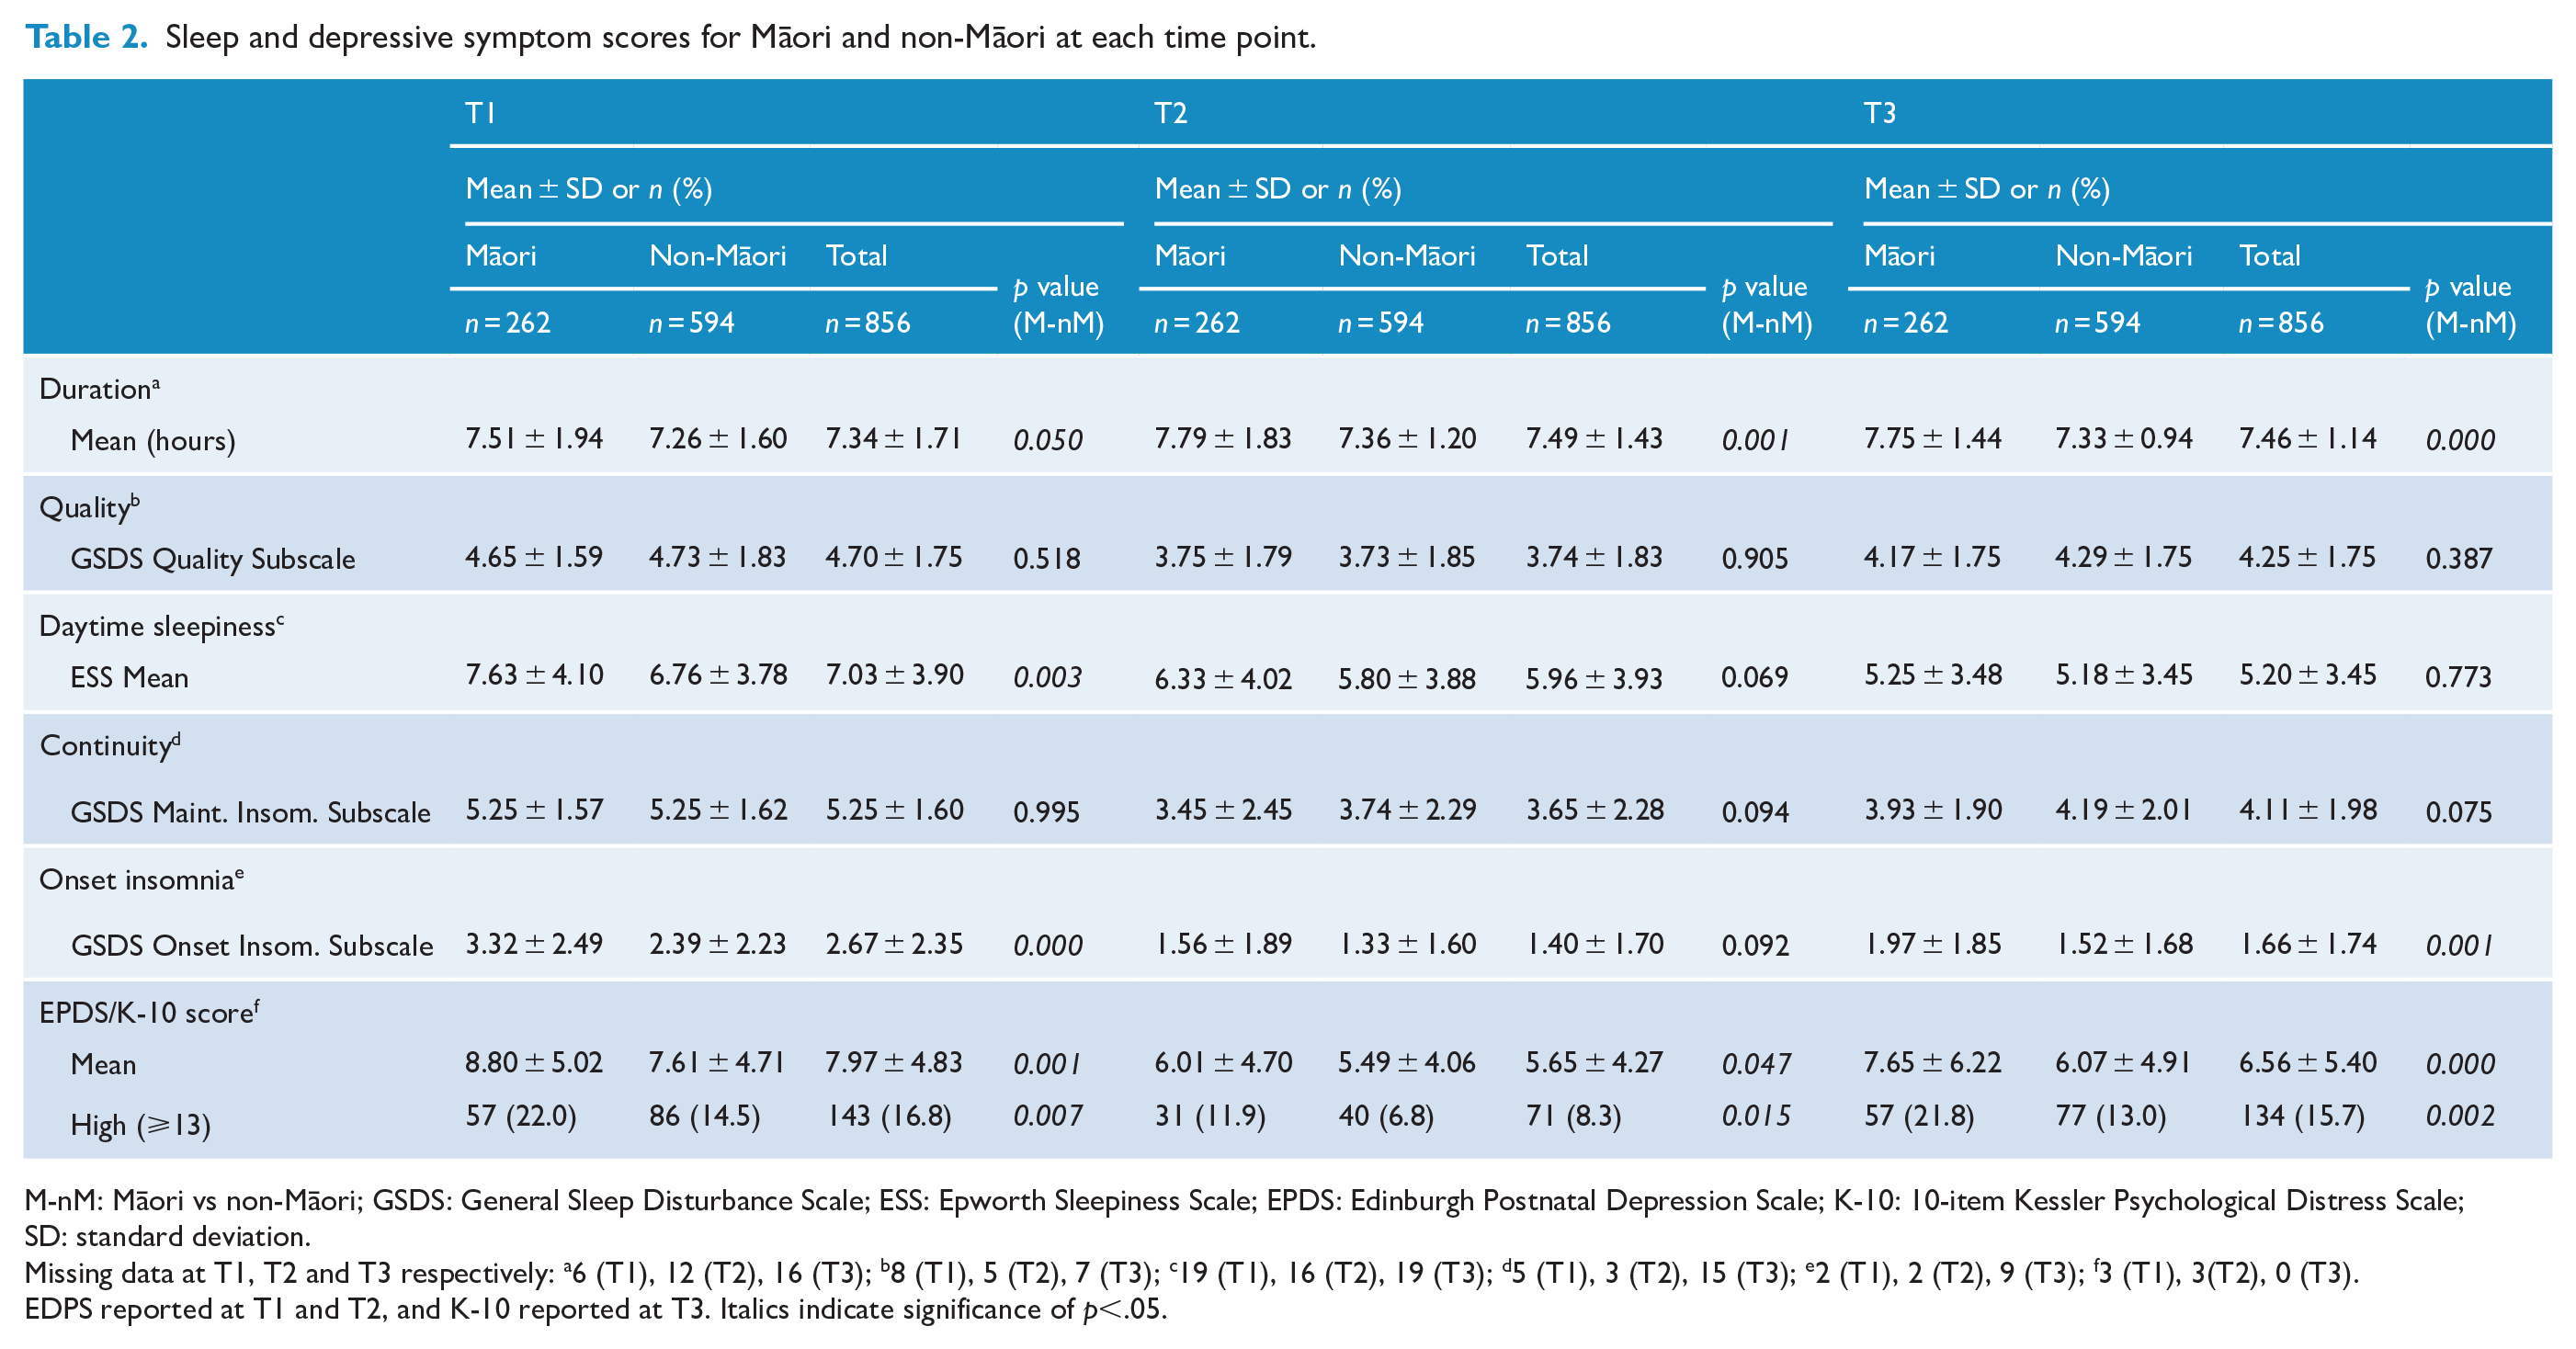
M-nM: Māori vs non-Māori; GSDS: General Sleep Disturbance Scale; ESS: Epworth Sleepiness Scale; EPDS: Edinburgh Postnatal Depression Scale; K-10: 10-item Kessler Psychological Distress Scale; SD: standard deviation.
Missing data at T1, T2 and T3 respectively: a6 (T1), 12 (T2), 16 (T3); b8 (T1), 5 (T2), 7 (T3); c19 (T1), 16 (T2), 19 (T3); d5 (T1), 3 (T2), 15 (T3); e2 (T1), 2 (T2), 9 (T3); f3 (T1), 3(T2), 0 (T3).
EDPS reported at T1 and T2, and K-10 reported at T3. Italics indicate significance of p<.05.
Identification of depressive symptom trajectories
Across the entire sample, two distinct depressive symptom groups, stable mild (SM) and chronic high (CH), were identified using LCA (Figure 1(C)). The two-class model was selected for use due to statistical instability in fitting the three-class model, which is likely due to sparse data. A quadratic term model had better fit and better mean posterior membership compared to a model with one linear and one quadratic group. In the chosen model, the average posterior probability (the chance of being correctly assigned to the trajectory group) for the CH group was 0.98 and for the SM group was 0.81. In the model including the entire sample, 91.5% of women belonged to the SM group and 8.5% of women followed the CH trajectory. Plots describe time across the horizontal axis, while the probability of experiencing clinically significant depressive symptoms is presented on the vertical axis. Results for the total sample showed that the probability of experiencing clinically significant depressive symptoms in the CH group was 80.4% at T1, 51.9% at T2% and 84.2% at T3 and in the SM group was 10.8% at T1, 4.2% at T2% and 9.3% at T3.
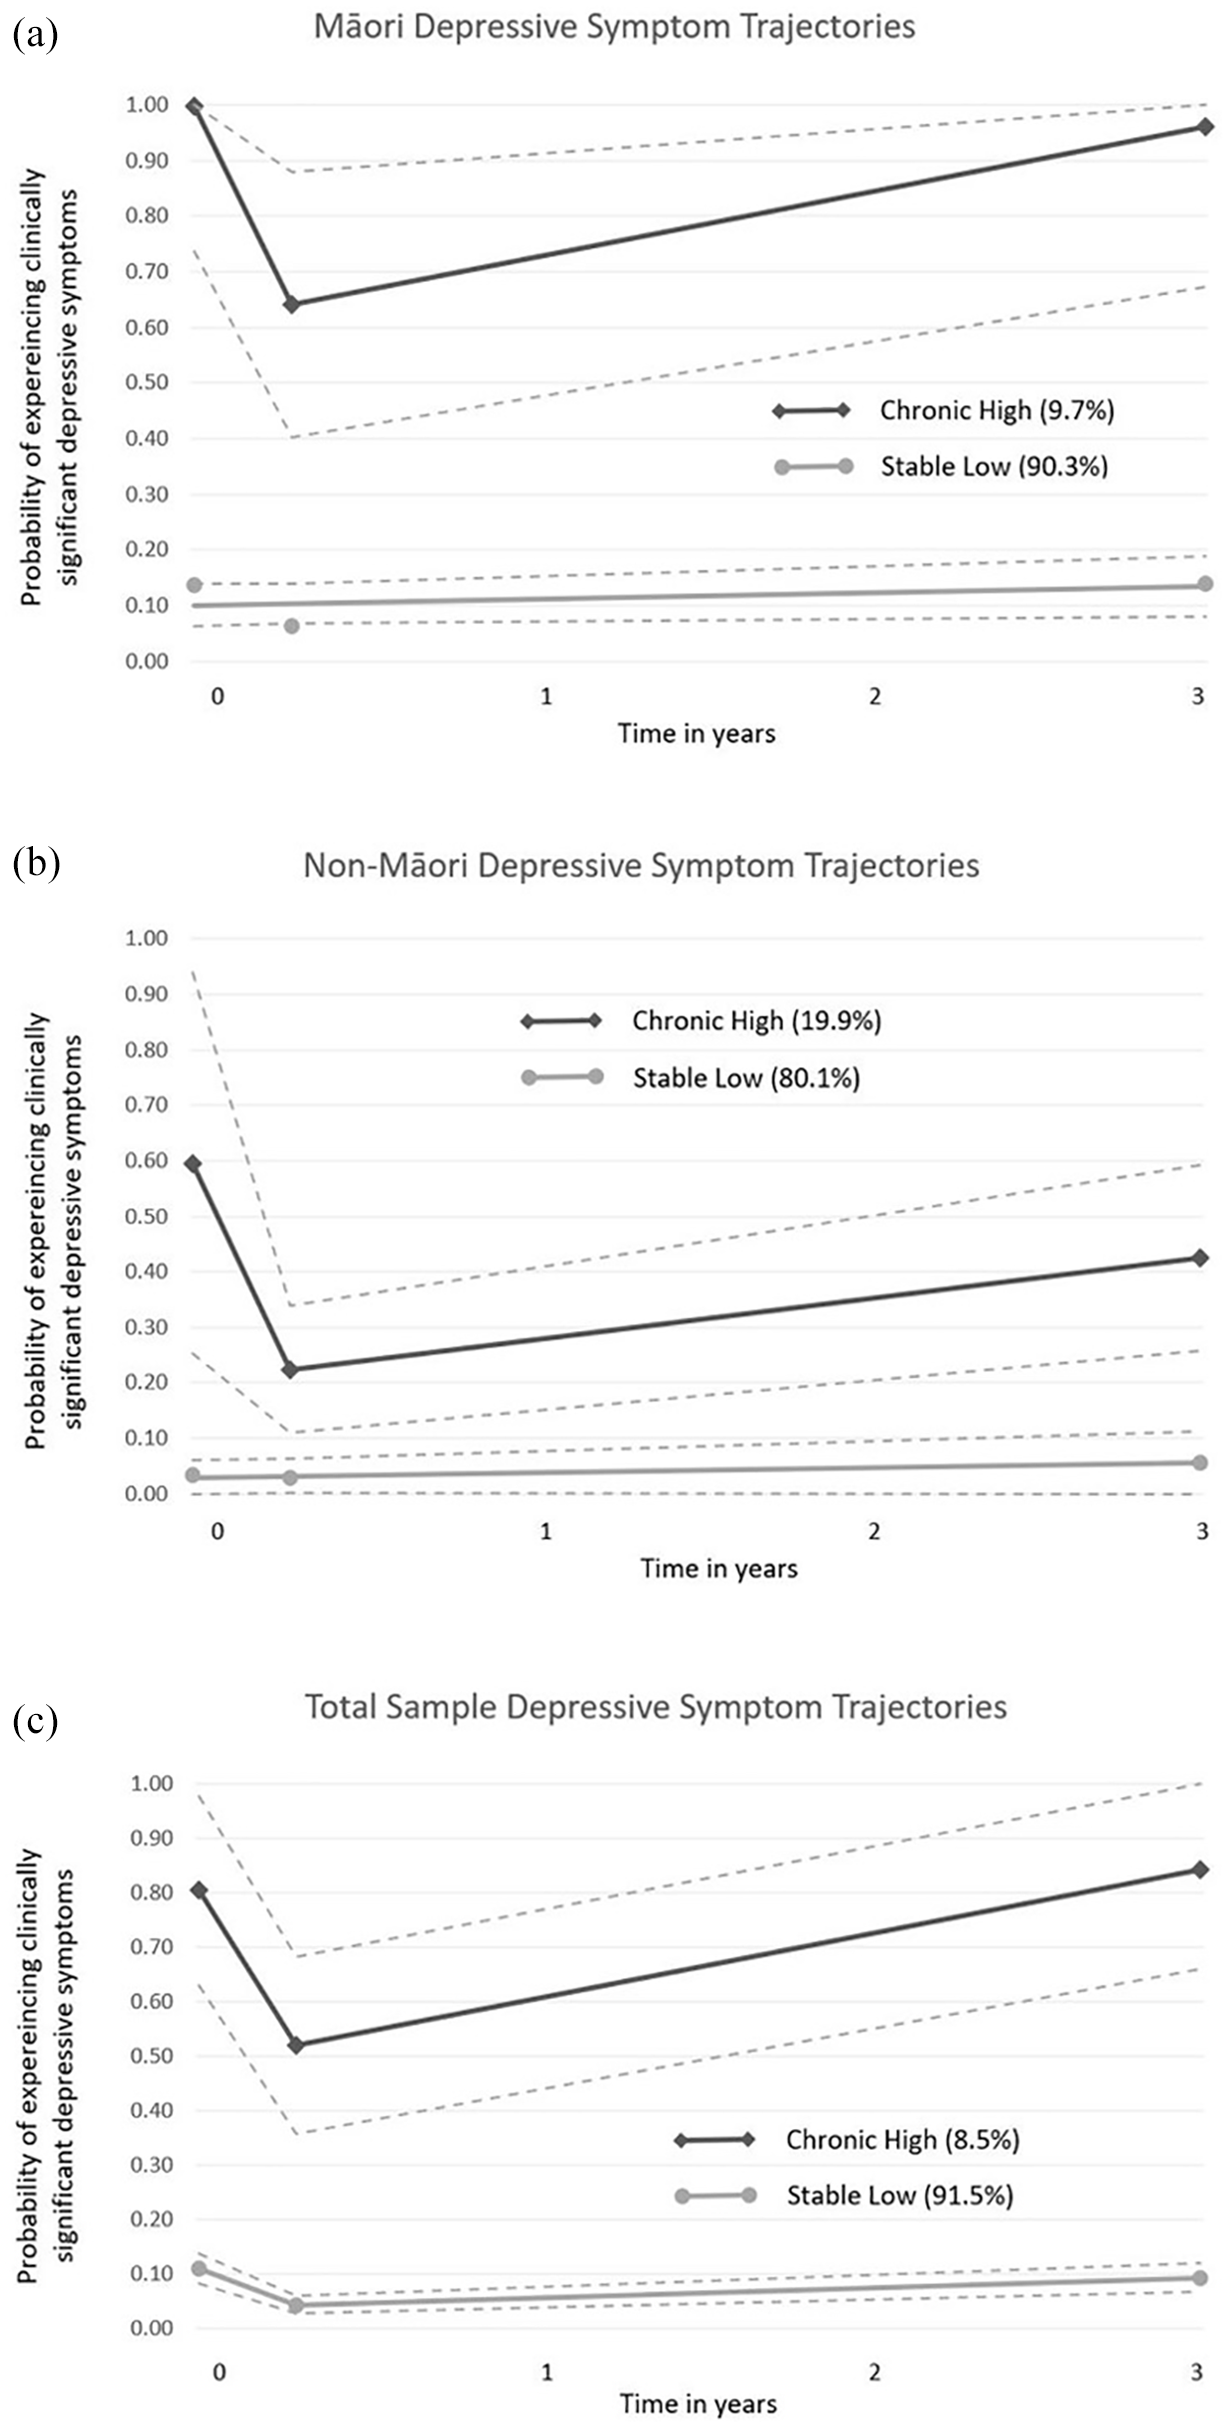
Data points measured at mean 36 weeks’ gestation, 12 weeks postnatal and 3 years after birth. (a)=Māori depressive symptom trajectories; (b)=non-Māori depressive symptom trajectories; (c)=Total sample depressive symptom trajectories.
Table 3 details the median and interquartile range for the EPDS and K-10 scores for the total sample at the three time points, which shows significant between-group differences at all time points. There were also within-group differences found between T1 and T2 (SM p < 0.001; CH p < 0.001) and T2 and T3 (SM p < 0.001; CH p < 0.001) but not between T1 and T3 (SM p = 0.360; CH p = 0.810).
Median and interquartile range for the EPDS (T1 and T2) and K-10 (T3) for the total sample and separately for Māori and non-Māori.
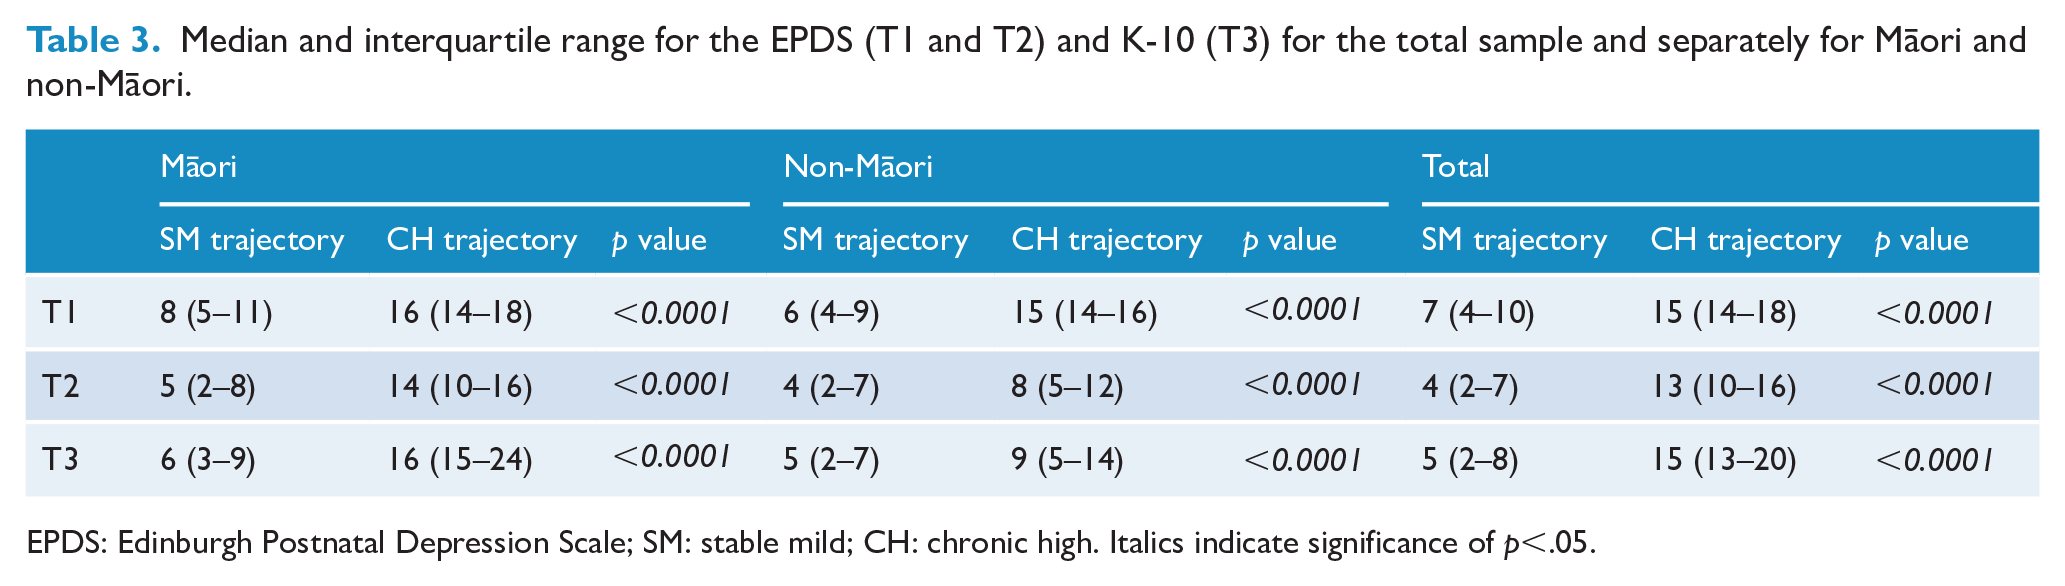
EPDS: Edinburgh Postnatal Depression Scale; SM: stable mild; CH: chronic high. Italics indicate significance of p<.05.
Depressive symptom trajectories for Māori and non-Māori
LCA was applied to Māori and non-Māori women’s data separately. Similar to the model for the total sample, two depressive symptom groups were revealed for each population, SM and CH, as illustrated in Figure 1A and B. Linear terms for the SM group and quadratic terms for the CH group proved a better fit than quadratic terms for both trajectories for Māori. Quadratic terms for both groups were only slightly better for non-Māori (−614.5 vs −616.1), so for consistency, models with a quadratic term for the CH group and a linear term for the SM group were selected for use. For Māori women, 90.3% belonged to the SM group and 9.7% followed the CH trajectory. The probability of Māori women experiencing clinically significant depressive symptoms in the CH group was 99.6% at T1, 64.0% at T2% and 95.9% at T3 and for the SM group was 13.6% at T1, 6.3% at T2% and 13.8% at T3. For non-Māori women, 80.1% of women belonged to the SM group and 19.9% of women followed the CH trajectory. The probability of non-Māori women experiencing clinically significant depressive symptoms in the CH group was 59.5% at T1, 22.4% at T2% and 42.5% at T3 and for the SM group was 3.3% at T1, 2.9% at T2% and 5.6% at T3.
Table 3 provides the median and interquartile ranges of EPDS and K-10 scores for both Māori and non-Māori at the three time points. These also show significant between-group differences at all time points. Māori within-group differences were seen between T1 and T2 (SM p = 0.019; CH p = 0.001) and T2 and T3 (SM p = 0.016; CH p = 0.001) but not between T1 and T3 (SM p = 0.900; CH p = 0.990). Non-Māori intragroup differences were seen between T1 and T2 (SM p< 0.001; CH p < 0.001), T2 and T3 (SM p = 0.003; CH p = 0.006) and T1 and T3 for the SM group (SM p < 0.001) but not between T1 and T3 for the CH group (CH p = 0.900).
Sleep variables associated with chronic high trajectory group
The association between sleep dimensions and trajectory group membership was also investigated. In these models, the sleep dimensions were modelled as continuous variables, so the ORs are interpreted as the likelihood of being in the CH group, per unit change in the sleep subscale (e.g., at T1, every additional night per week a woman reported difficulty getting to sleep increased the odds of being in the CH group by 21%). As can be seen in Table 4, at all three time points, poorer sleep quality, reduced sleep continuity and latency, and greater daytime sleepiness increased the odds of being in the CH group. After adjusting for age, ethnicity, partner relationship, history of depression, NZDep and stressful life events, all associations remained significant, with the exception of daytime sleepiness at T3. No association was found between sleep duration and depression trajectory group in either the crude or adjusted models.
Sleep variables associated with the Chronic High trajectory group.
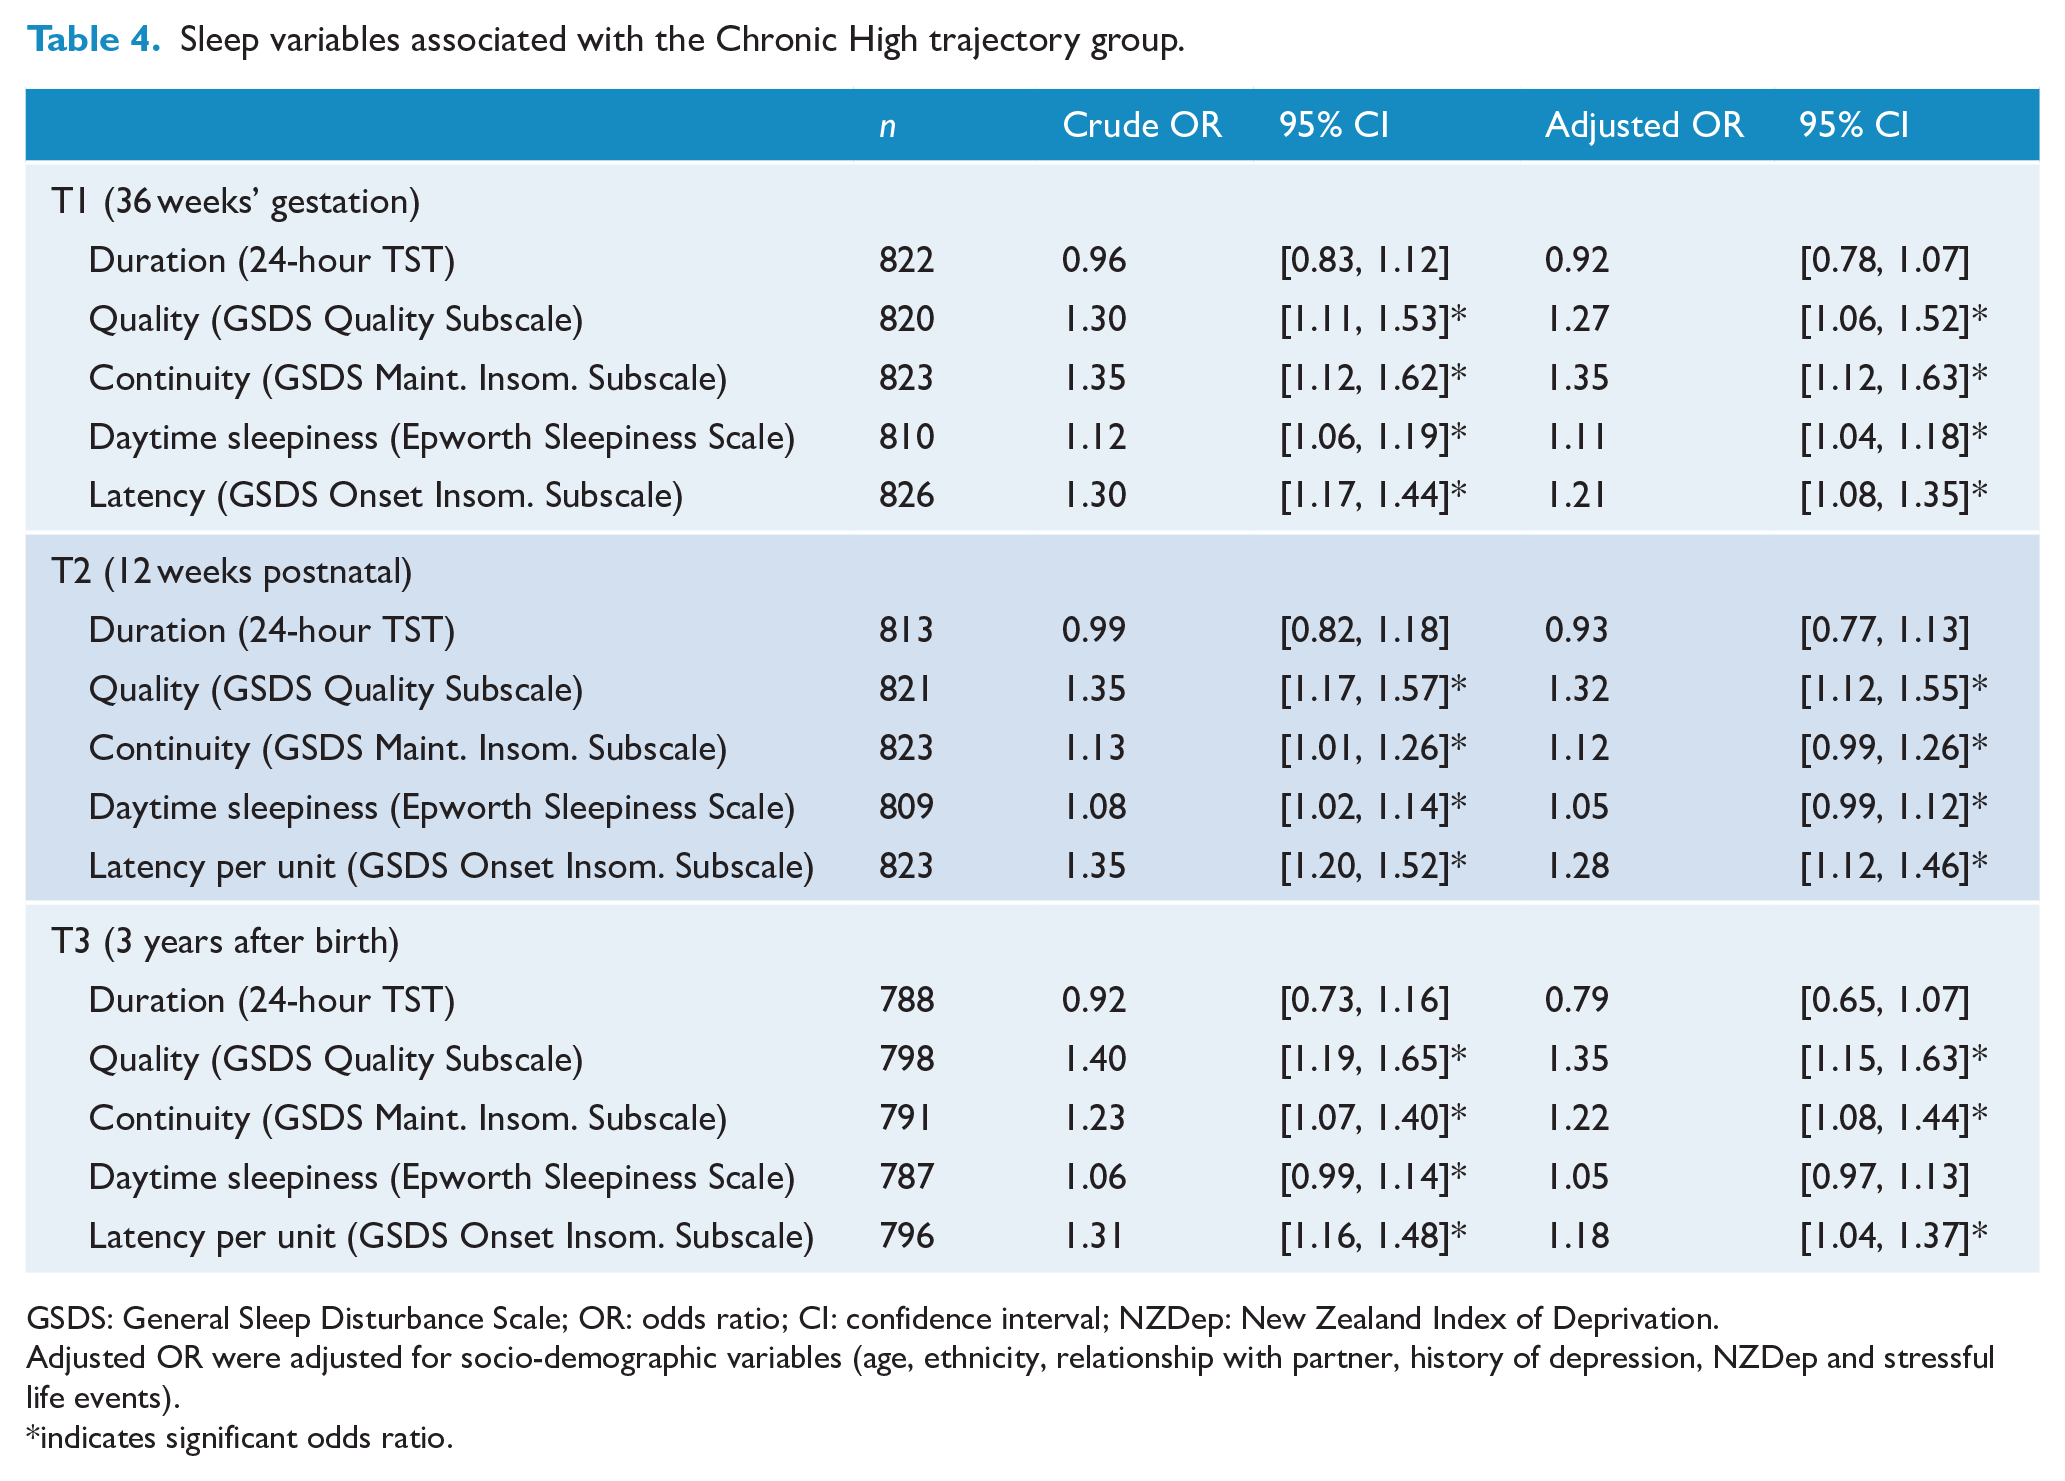
GSDS: General Sleep Disturbance Scale; OR: odds ratio; CI: confidence interval; NZDep: New Zealand Index of Deprivation.
Adjusted OR were adjusted for socio-demographic variables (age, ethnicity, relationship with partner, history of depression, NZDep and stressful life events). *indicates significant odds ratio.
Discussion
In this population sample, two distinct depressive symptom classes, SM and CH, were identified from late pregnancy to 3 years after birth for both Māori and non-Māori women. The CH trajectory demonstrates that for a subsample of women, persistent depressive symptoms are experienced well beyond pregnancy and the early postnatal period. In the full sample, 8.5% of women were identified as belonging to the CH class, with median scores on the EDPS and K-10 consistently at or above clinical cut-offs for depressive symptomatology. Specifically, a mother in the CH group, who has elevated depressive symptoms in late pregnancy, will also have a very high probability of experiencing depressive symptoms 3 years after birth.
Our previous work has shown that Māori women are more likely than non-Māori women to experience depression in pregnancy (Signal et al., 2016), and this study adds to this by demonstrating that there is a group of Māori women who have a very high probability of experiencing clinically significant depressive symptoms from pregnancy through until their child is 3 years of age. This is in contrast to non-Māori women, who show a similar pattern of change but a lower probability of clinically significant depressive symptoms from pregnancy to 3 years of age and lower median scores on the measures of depressive symptoms at T2 and T3, although the proportion of women in the non-Māori group is greater than the Māori women.
These results highlight the enduring nature of depression in perinatal women and suggest that mental health support and management in pregnancy and the years after birth are suboptimal for New Zealand women, particularly for Māori women, given the severity and likelihood of persistent depressive symptoms found in this study. Fahey and Shenassa (2013) emphasise the need to lengthen maternity care after childbirth as women are vulnerable to compromised health, due to the immense physical and psychosocial transition and decreased opportunities for self-care related to the demands of new motherhood. Verbiest et al. (2018) attributes poor maternal health to an infant-centric (and not mother-centred) approach, with focus placed on the birth, delivery and immediate postnatal period but not the years after birth. These authors appeal for an expanded continuum of care, before conception, throughout pregnancy, childbirth, adaption and recovery, and beyond. Previous studies have revealed that mothers experiencing depressive symptoms in late pregnancy may be identified in early pregnancy (Skouteris et al., 2009), providing an opportunity for novel interventions throughout pregnancy to help minimise persistent perinatal depressive symptoms. Moreover, there is an urgent need for healthcare providers and policy advisors to raise awareness of the persistent nature and severity of depression past traditional perinatal time frames and to advocate for quality primary care (including identification, referral and timely treatment) during pregnancy and the years beyond.
In both Māori and non-Māori populations, depressive symptoms significantly improved at 12 weeks postnatal. It is not clear why this occurred, but it may be that the social and professional support available for mother and baby in the early perinatal period was of benefit and/or that women place fewer expectations on themselves at this time and have fewer external obligations. An alternative explanation is that based on their involvement in this study, they were receiving the necessary mental health support after being referred to their Lead Maternity Carer (LMC) or doctor if there was evidence of self-harm or elevated depressive symptoms in late pregnancy. It should be noted, however, that Māori women and their families have greater exposure to factors associated with depression and experience significant barriers to accessing high-quality pregnancy and postnatal healthcare services (Makowharemahihi et al., 2014) and healthcare services in general (New Zealand Ministry of Health, 2008). This could also be reflected in the lack of difference found between Maori and non-Maori women in the reporting of depression history. That Māori women remained in a chronic depressive symptom group at the 3-year time point is of serious concern. Further research is required to document the pathways of mental healthcare for Māori women.
This is the first study to examine the association between depression trajectory classes and different dimensions of sleep. The results extend findings from previous studies, supporting the association between sleep quality and depressive symptoms (Kuo et al., 2012; Tomfohr et al., 2015; Tzeng et al., 2015; Wang et al., 2018). This study also demonstrated that depressive symptoms were consistently associated with poor sleep quality, continuity, latency and daytime sleepiness at each time point and remained significant when adjusting for other factors related to depression. Given that the ORs represent an increased risk of being in the CH group per unit change of sleep, these results demonstrate a strong association between sleep and mental health outcomes. The analyses cannot address the causal or directional relationships between aspects of sleep and depressive symptoms. However, this pattern of co-occurrence supports evidence of the bidirectional nature of sleep and depression. Thus, early pregnancy sleep health interventions may be beneficial for women, and further studies are needed to investigate whether improving sleep (or indeed keeping sleep stable over time) can minimise depressive symptoms, especially in the early stages of pregnancy.
Strengths of our study are the large community sample with approximately one-third of women identifying as Māori, the examination of multiple dimensions of sleep and controlling for known predictors of depression. The demographic characteristics of the participants in this study enhance the generalisability of our findings to a wider perinatal population. The inclusion of measures of depressive symptoms in pregnancy expands the research on the course of maternal depression, given that the majority of other population-based samples have examined trajectories across shorter time spans or the postnatal period only. We also used a sophisticated statistical approach to focus on data-driven and person-centred outcomes, which allows a greater emphasis on individual and longitudinal patterns of depressive symptoms. This is particularly important when investigating Indigenous populations, as total population analysis can potentially mask inequities concealed in the data. Posterior probability for each trajectory group was high as was the clear separation of classes, further supporting the analytical approach we have taken.
Despite the large sample and the longitudinal data, there are several limitations to this study. Due to the large sample size, depressive symptoms were assessed using well-validated self-report measures and not clinical interview, so it is unclear how many of these women were experiencing clinically diagnosable depression or were receiving antidepressant medication. However, this study used cut-off scores on the EPDS which are considered to indicate major or probable clinical depression, rather than just mild, transient or possible depression (Cox et al., 1987; Fellmeth et al., 2019; Khanlari et al., 2019). The EPDS includes an item regarding changes in sleep, and this item was included in the analysis of this scale to enable standard cut-off scores to be utilised and may have slightly increased the scores of some women. Furthermore, some studies investigating optimal cut-off scores on the EPDS have suggested a higher cut-off score in pregnancy (Matthey et al., 2006) although this is not universally supported. The sub-group used in the analyses presented here differed in some respects from those who did not have complete data. However, the proportion of women experiencing clinically significant depressive symptoms did not differ between the groups, and this was the variable used to determine trajectories. The study only used three time points, so we are not able to comment on the course of depressive symptoms between time points, specifically during the long period of time between 3 months and 3 years postnatal, which may be why our analyses support a two-class model. Follow-up periods are a critical dimension in determining the number of trajectory groups; thus, if we had more data time points, the classes may have split into subgroups following divergent trajectories (Nagin and Tremblay, 2005). Furthermore, we do not currently have data past 3 years after birth, so cannot comment on depressive symptoms trajectories past this time. However, three depression trajectory studies have identified groups of mothers with increasing depressive symptoms in the child’s preschool years (Hammerton et al., 2015; Matijasevich et al., 2015; Van Der Waerden et al., 2015). Thus, more studies with additional time frames within and beyond 3 years and that include Indigenous women would be valuable. We did not control for women receiving behavioural or pharmacological treatment for depression, which could have altered the natural course of symptoms or led to misclassification.
To our knowledge, this is the first study investigating depressive symptoms throughout the extended perinatal period and the association with multiple dimensions of sleep. Notably, persistent patterns of depressive symptoms occurred concurrently with poor sleep at distinct time points from late pregnancy to 3 years after birth. Given the well-described impact of maternal depression on the mother, child and community, this highlights the importance of healthcare professionals to ask about and assess mothers’ sleep quality, continuity, latency and daytime sleepiness as potential indicators for depressed mood beyond the perinatal period. These results are congruent with much of the literature on maternal depression trajectories and add to the mounting evidence on the relationships between sleep and depression. In addition, the study includes important findings on the specific aspects of sleep involved. Mothers with poor sleep are at risk of experiencing chronic depressive symptoms. Given the higher incidence and more pervasive nature of depressive symptoms in Indigenous Māori women, priority should be focused on the development of preventive interventions for these women.
Footnotes
Acknowledgements
We gratefully acknowledge the contribution of the women who participated in the Moe Kura study. We would also like to thank the localities for supporting promotion of the study and assisting with participant recruitment, Ms Monique Priston, Dr Kathryn Lee, Mr Alexander Smith, the research assistants and the study advisory group.
Data Availability
The data that support the findings of this study are available on reasonable request from author, T.L. Signal. The data are not publicly available due to them containing information that could compromise research participant privacy/consent.
Declaration of Conflicting Interests
The author(s) declared no potential conflicts of interest with respect to the research, authorship and/or publication of this article.
Funding
The author(s) disclosed receipt of the following financial support for the research, authorship, and/or publication of this article: This work was supported by the New Zealand Health Research Council (HRC grant numbers 09/255 and 08/547) and a Massey University Doctoral Scholarship.