
Abstract
Objective:
Many noninvasive brain stimulation techniques have been applied to treat depressive disorders. However, the target brain region in most noninvasive brain stimulation studies is the dorsolateral prefrontal cortex. Exploring new stimulation locations may improve the efficacy of noninvasive brain stimulation for depressive disorders. We aimed to explore potential noninvasive brain stimulation locations for depressive disorders through a meta-analysis and a functional connectivity approach.
Methods:
We conducted a meta-analysis of 395 functional magnetic resonance imaging studies to identify depressive disorder–associated brain regions as regions of interest. Then, we ran resting-state functional connectivity analysis with three different pipelines in 40 depression patients to find brain surface regions correlated with these regions of interest. The 10–20 system coordinates corresponding to these brain surface regions were considered as potential locations for noninvasive brain stimulation.
Results:
The 10–20 system coordinates corresponding to the bilateral dorsolateral prefrontal cortex, bilateral inferior frontal gyrus, medial prefrontal cortex, supplementary motor area, bilateral supramarginal gyrus, bilateral primary motor cortex, bilateral operculum, left angular gyrus and right middle temporal gyrus were identified as potential locations for noninvasive brain stimulation in depressive disorders. The coordinates were: posterior to F3, posterior to F4, superior to F3, posterior to F7, anterior to C4, P3, midpoint of F7–T3, posterior to F8, anterior to C3, midpoint of Fz–Cz, midpoint of Fz–Fp1, anterior to T4, midpoint of C3–P3, and anterior to C4.
Conclusion:
Our study identified several potential noninvasive brain stimulation locations for depressive disorders, which may serve as a basis for future clinical investigations.
Keywords
Introduction
Depressive disorders are some of the most common causes of disability in the world (Kassebaum et al., 2016). However, current treatments for depressive disorders are far from satisfactory (Gartlehner et al., 2016). Many depression patients will not benefit from treatment and will consequently be diagnosed with treatment-resistant depression (Malhi et al., 2019; Sato and Yeh, 2013). Thus, new therapies for the disorder are urgently needed.
Recently, noninvasive brain stimulation (NIBS) techniques—such as transcranial magnetic stimulation (TMS), transcranial direct current stimulation (tDCS) and acupuncture (scalp acupuncture or traditional acupuncture using acupoints on the head)—have been applied to treat depressive disorders (Lepping et al., 2014; Meron et al., 2015; Zhang et al., 2010). Although studies have supported the effectiveness of NIBS for depressive disorders, others have reported no significant effect compared to sham treatment (Lepping et al., 2014; Meron et al., 2015). One factor that may limit the efficacy of NIBS for depressive disorders is the stimulation site. To date, most NIBS treatments have used the dorsolateral prefrontal cortex (dlPFC) for depressive disorders (Lipsman et al., 2014). In a previous study, investigators found that stimulating the right parietal cortex may also produce antidepressant effects (Schutter et al., 2009), indicating that other brain regions may be potential stimulation locations. However, few studies have systematically investigated such brain regions.
With the aid of cutting-edge brain imaging tools, investigators have found that a large number of brain regions and networks are involved in the pathophysiology of depressive disorders (Gong and He, 2015). These findings provide a basis for exploring new stimulation locations for NIBS. Previous meta-analyses have summarized the findings of brain imaging studies in depressive disorders (Fu et al., 2013; Hamilton et al., 2012; Kempton et al., 2011). However, most of the regions identified in the meta-analyses are located in brain areas that are inaccessible for some NIBS techniques. As a result, findings from these meta-analysis studies cannot be easily applied to NIBS.
Functional connectivity analysis, which investigates the correlations between different regions, allows for further exploration of depressive disorder–associated brain surface regions based on the results from previous studies. For instance, Fox used a resting-state functional connectivity-based approach to optimize the locations of TMS for the treatment of depression, demonstrating the value of a connectivity-based targeting strategy for NIBS (Fox et al., 2012).
In this study, we first conducted a meta-analysis to identify depressive disorder–associated brain areas as regions of interest (ROI). Then, we applied resting-state functional connectivity analysis on 40 depression patients to identify brain surface regions functionally correlated with these ROIs in hopes of identifying potential locations and targets for NIBS treatment of depressive disorders.
Methods
Identifying depressive disorder–associated brain regions from meta-analysis
To identify brain regions involved in the pathophysiology of depressive disorders, we first conducted a meta-analysis using Neurosynth (http://neurosynth.org/) (Yarkoni et al., 2011). The meta-analysis was conducted on 24 March 2018 with the search terms ‘depressive disorder’ and ‘depression’, which pulled up 395 functional magnetic resonance imaging (fMRI) studies (see the list of the 395 studies in Supplementary Material 2). Neurosynth provides two types of statistical inference maps from the meta-analysis: uniformity test and association test maps. While uniformity test maps provide information about the consistency of activation for a given process, association test maps provide information about the relative selectivity with which regions activate in a particular process. Since our goal here was to identify brain regions related to depressive disorders rather than specific to depressive disorders, we applied the uniformity test map in this study. A false discovery rate (FDR) adjusted p value of 0.01 was applied to produce the uniformity test map. To create depressive disorder–related ROIs, the coordinates with peak z-scores within all clusters larger than 20 voxels on the uniformity test map were identified using the xjView toolbox (www.alivelearn.net/xjview). The 6-mm radius spherical masks centered on the identified peak coordinates were created using MarsBaR version 0.44 (http://marsbar.sourceforge.net/). To maintain regional specificity and to ensure that only voxels from the original uniformity test map were included, the ROIs were further refined by taking the overlap of the original uniformity test map and the masks from MarsBaR.
Participants
A total of 40 depression patients were included in the functional connectivity analysis (16 males and 24 females). The age of the subjects was 34.63 ± 11.39 years (M ± SD). The magnetic resonance imaging (MRI) data were collected at Beijing Normal University. All eligible participants were required to meet the following inclusion/exclusion criteria. The inclusion criteria were as follows: (1) 18–60 years old; (2) meets the diagnostic criteria for mild to moderate depression in the 10th revision of the International Statistical Classification of Diseases and Related Health Problems (ICD-10 code F32); (3) diagnosed with depression for the first time, without systematic treatment, and presence of depression syndrome for a duration of 2 weeks to 1 year; and (4) scored 20–35 on the Hamilton Depression Rating Scale. The exclusion criteria were as follows: (1) presence of suicide risk; (2) bipolar depression or other mental diseases; (3) in the process of taking antidepressants, in the washout period of antidepressants, or in the process of receiving acupuncture treatment; (4) pregnant or nursing; (5) severe systemic diseases; and (6) participated in other studies in the last 8 weeks. The study was approved by the Institutional Review Board at Beijing University of Chinese Medicine, and all patients signed informed consent forms.
MRI data acquisition
Resting-state functional magnetic resonance imaging (RS-fMRI) data were acquired with a 3T Siemens Trio scanner in the Imaging Center for Brain Research, Beijing Normal University. T2-weighted functional images encompassing the whole brain were acquired with the gradient-echo echo-planar imaging sequence (echo time: 30 ms, repetition time: 2000 ms, flip angle: 90°, slice thickness: 4 mm, voxel size: 3.1 × 3.1 × 4.8 mm3, slice number: 32 and volume number: 300). High-resolution brain structural images were acquired with a T1-weighted three-dimensional (3D) multi-echo magnetization-prepared rapid gradient-echo (MPRAGE) sequence (echo time: 3.39 ms, repetition time: 2530 ms, slice thickness 1.3 mm, voxel size: 1.3 × 1 × 1 mm3, field of view (FOV): 256 × 256 mm2 and volume number: 128).
Image processing
To identify potential brain surface regions related to depressive disorders, we used the ROIs identified from the meta-analysis to conduct a seed-to-voxel functional connectivity analysis based on resting-state fMRI data of 40 depression subjects (Figure 1). We first used Data Processing and Analysis for Brain Imaging (DPABI) version 2.3 (http://rfmri.org/dpabi) (Yan et al., 2016) and Statistical Parametric Mapping (SPM) 12 (www.fil.ion.ucl.ac.uk/spm/) to remove the initial five volumes of the RS-fMRI data and evaluate each subject’s head motion by the mean relative root mean square (RMS). Subjects whose head motion evaluated by the mean relative RMS exceeded 0.2 mm or whose maximum head motion exceeded 3 mm were excluded from the analysis. The images of the remaining subjects were then preprocessed (using Conn’s default preprocessing pipeline) and analyzed in Conn version 18a (https://sites.google.com/view/conn/) (Whitfield-Gabrieli and Nieto-Castanon, 2012) and SPM 12.
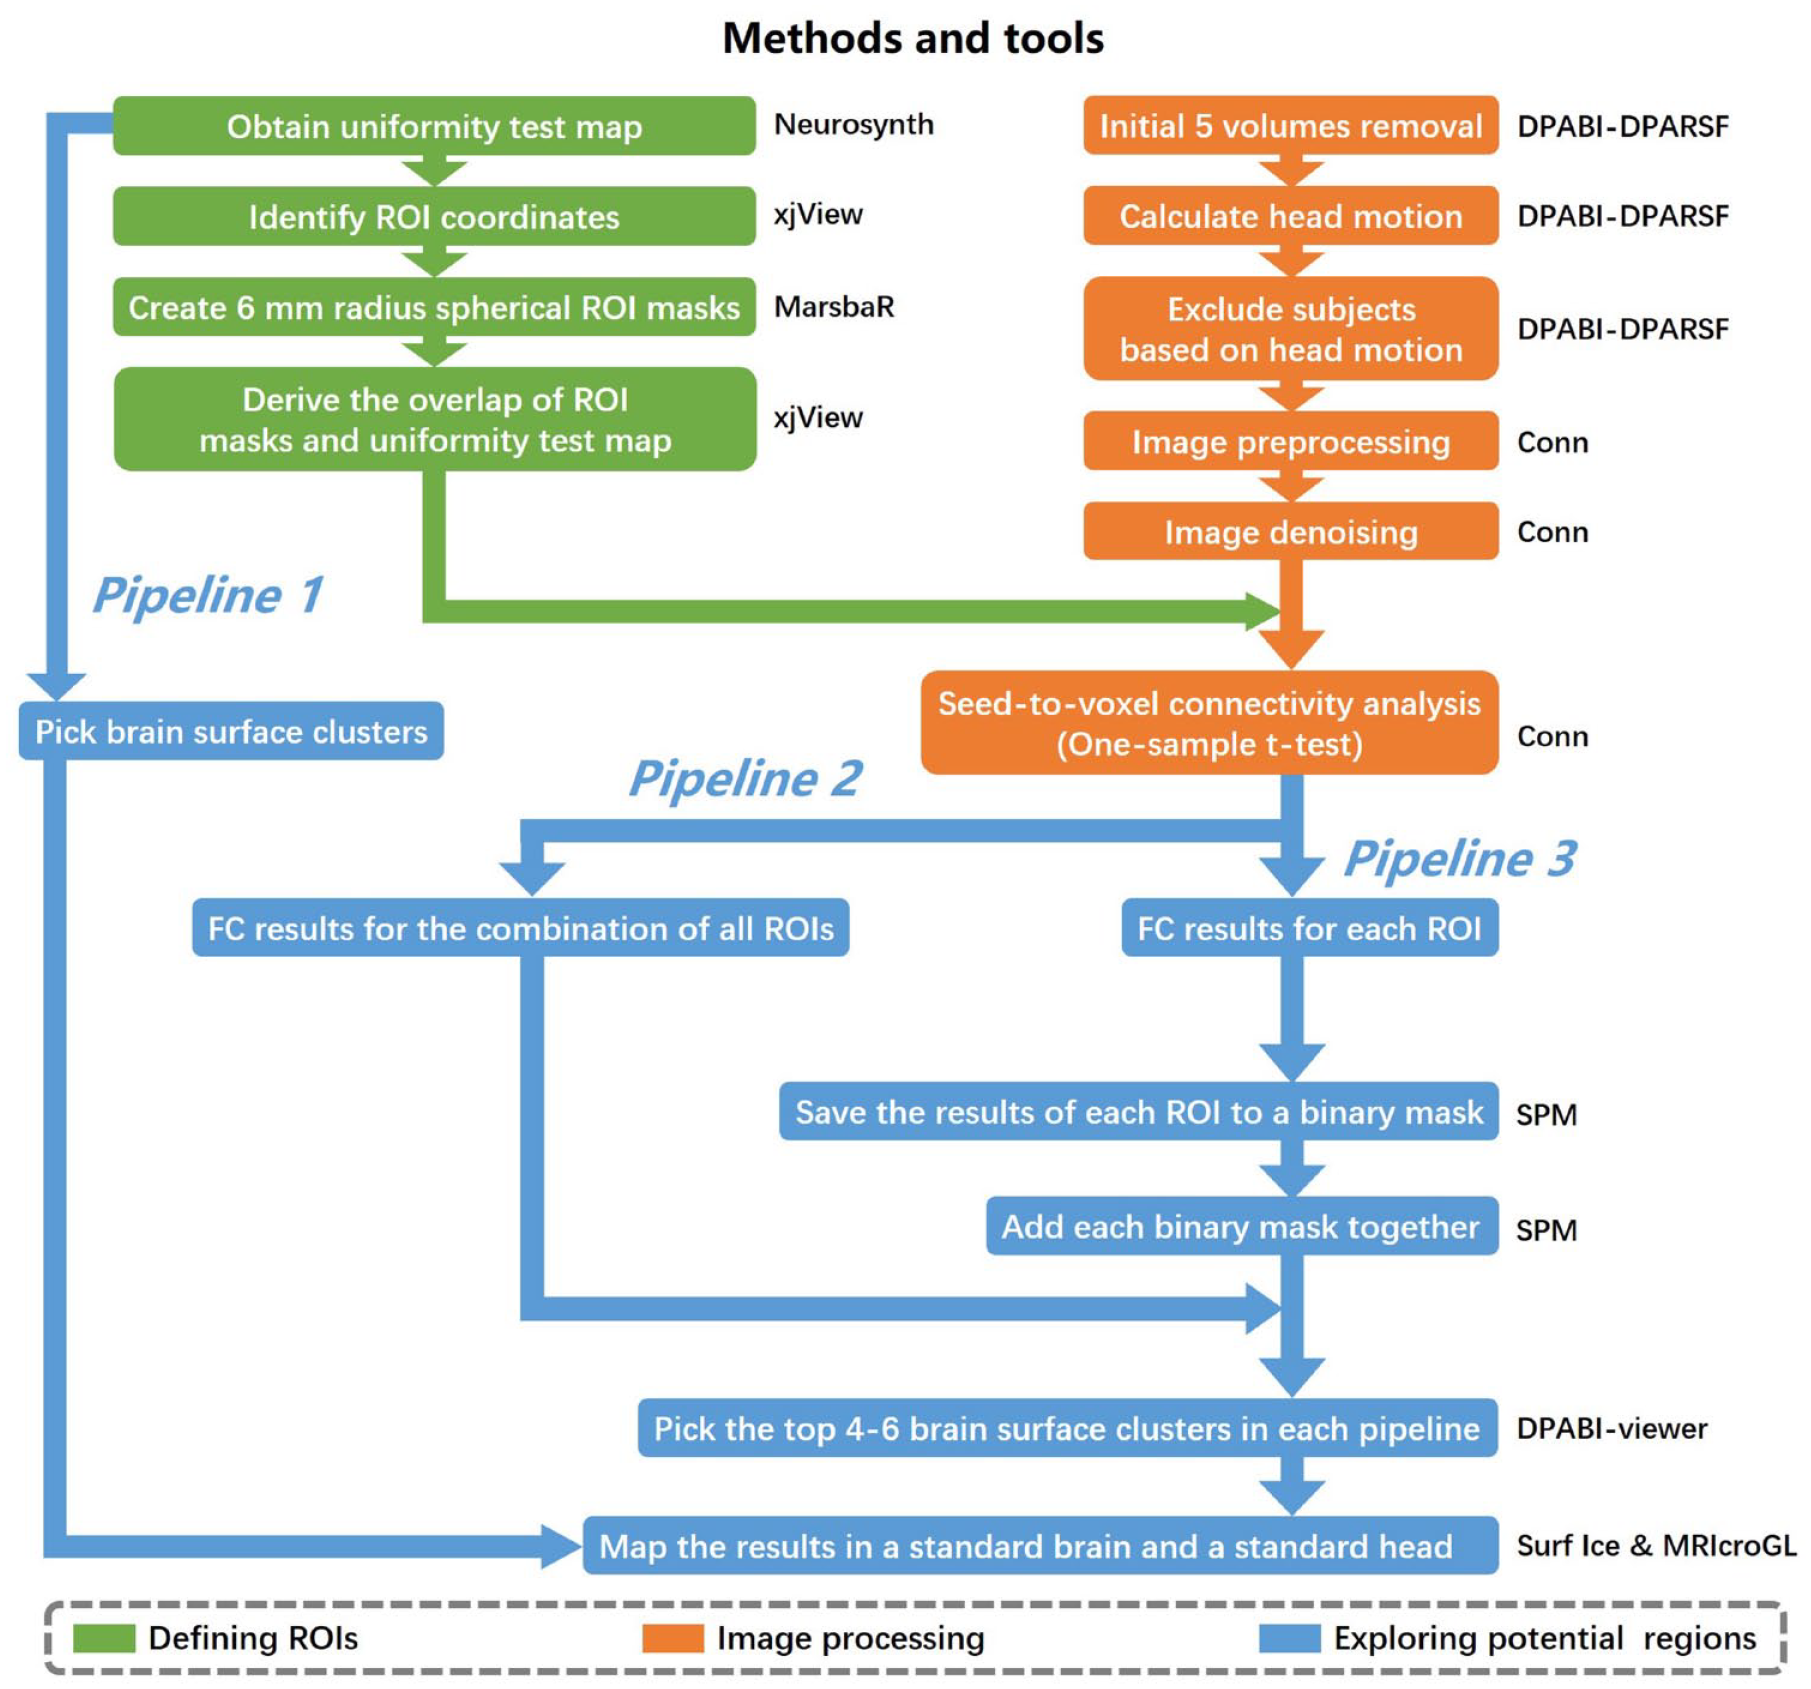
Data processing procedure.
During the preprocessing steps, the functional images were slice-timing corrected, realigned, normalized (3 × 3 × 3 mm3 in Montreal Neurological Institute (MNI) space), and smoothed (6 × 6 × 6 mm3). The Artifact Detection Tool (www.nitrc.org/projects/artifact_detect/) was used to detect outliers (>3 SD and >0.5 mm) for subsequent scrubbing regression. The structural images were segmented into gray matter, white matter (WM), and cerebral spinal fluid (CSF) and normalized (3 × 3 × 3 mm3) to MNI space. Then, linear regression using WM and CSF signals (CompCor; 10 components for WM and five components for CSF), linear trend, subject motion (six rotation/translation motion parameters and six first-order temporal derivatives), and outliers (scrubbing) was conducted to remove confounding effects. After that, the residual blood oxygen-level dependent (BOLD) time series was band-pass filtered (0.01–0.1 Hz).
Functional connectivity analysis
To produce subject-level correlation maps, the residual BOLD time course was extracted from depressive disorder–ROIs for each subject, and Pearson’s correlation coefficients were computed between ROIs and all other brain voxels. The resulting correlation coefficients were subsequently transformed into z-scores to increase normality and thus conform to the assumptions of generalized linear models.
At the group level, all subject-level seed maps of seed-to-voxel connectivity were included in a one sample t-test to get a group-level correlation map. We created a brain surface mask to exclude brain regions that are not on the brain surface. The brain surface mask included the bilateral pre- and postcentral gyrus; superior and middle frontal gyrus; superior, inferior and middle occipital gyrus; superior and inferior parietal lobule; supramarginal gyrus; angular gyrus; superior temporal gyrus; superior temporal pole; middle temporal gyrus (MTG); middle temporal pole; inferior temporal gyrus; opercular inferior frontal gyrus (IFG); Rolandic operculum; triangular IFG; superior medial frontal gyrus; calcarine sulcus; orbital middle, superior and inferior frontal gyri; orbital medial frontal gyrus; supplementary motor area (SMA); paracentral lobule; precuneus; and cuneus (see the mask image in Supplementary Material 1, Figure S1).
Exploring potential NIBS locations for depressive disorders
Three different pipelines were conducted to explore potential brain surface regions for NIBS (Figure 1). In pipelines 2 and 3, a voxel-wise level threshold of p < 0.001 and a cluster level family-wise error (FWE) of p < 0.05 were applied to obtain group-level correlation maps of ROIs.
Pipeline 1
We directly selected clusters at the brain surface in the original uniformity test map from the meta-analysis as potential regions. These clusters represent brain regions that may be directly involved in the pathophysiology of depressive disorders.
Pipeline 2
The depressive disorder–ROIs were combined to form a depressive network, and the network was regarded as an ROI for seed-to-voxel connectivity analysis in CONN. Then, four to six surface clusters with the largest peak z-scores among all clusters larger than 20 voxels on the group-level correlation map (positive and negative correlation maps separately) were identified as potential regions. These clusters represent the brain surface regions possessing the strongest correlations with the depressive network.
Pipeline 3
The group-level correlation maps of each depressive disorder–ROI were saved to a binary mask. Then, the binary masks of all ROIs were added together to form a third-level map (positive and negative correlation maps separately). The intensity of each voxel in the third-level map represents the number of depressive disorder–ROIs correlated with the voxel. Finally, four to six surface clusters with the largest peak z-scores among all clusters larger than 20 voxels on the third-level correlation map were identified as potential regions. These clusters represent the brain surface regions correlated with the largest number of depressive disorder–ROIs.
The results of the three pipelines were mapped onto a standard brain and a standard head with the international 10–20 system in MNI space (Cutini et al., 2011) using Surf Ice (www.nitrc.org/projects/surfice/) and MRIcroGL (www.mccauslandcenter.sc.edu/mricrogl/).
Results
ROIs identified from the meta-analysis
Fourteen clusters with 21 peak coordinates were identified from the uniformity test map of the meta-analysis (Table 1). The 21 coordinates were then used to create 6-mm radius spherical masks including the bilateral amygdala/hippocampus, bilateral dlPFC, bilateral insula, right anterior cingulate cortex, right middle cingulate cortex, left posterior cingulate cortex, bilateral thalamus, left medial orbitofrontal cortex, left medial superior frontal cortex, left precuneus, left putamen, right Rolandic operculum, right MTG, right primary motor cortex (M1), right superior temporal pole and right inferior parietal lobule. The masks were refined by taking the overlap of the masks and the original uniformity test map. Then, the refined ROIs were used in the seed-to-voxel connectivity analysis (see the refined ROIs in Supplementary Material 1, Figure S2).
Results of meta-analysis.
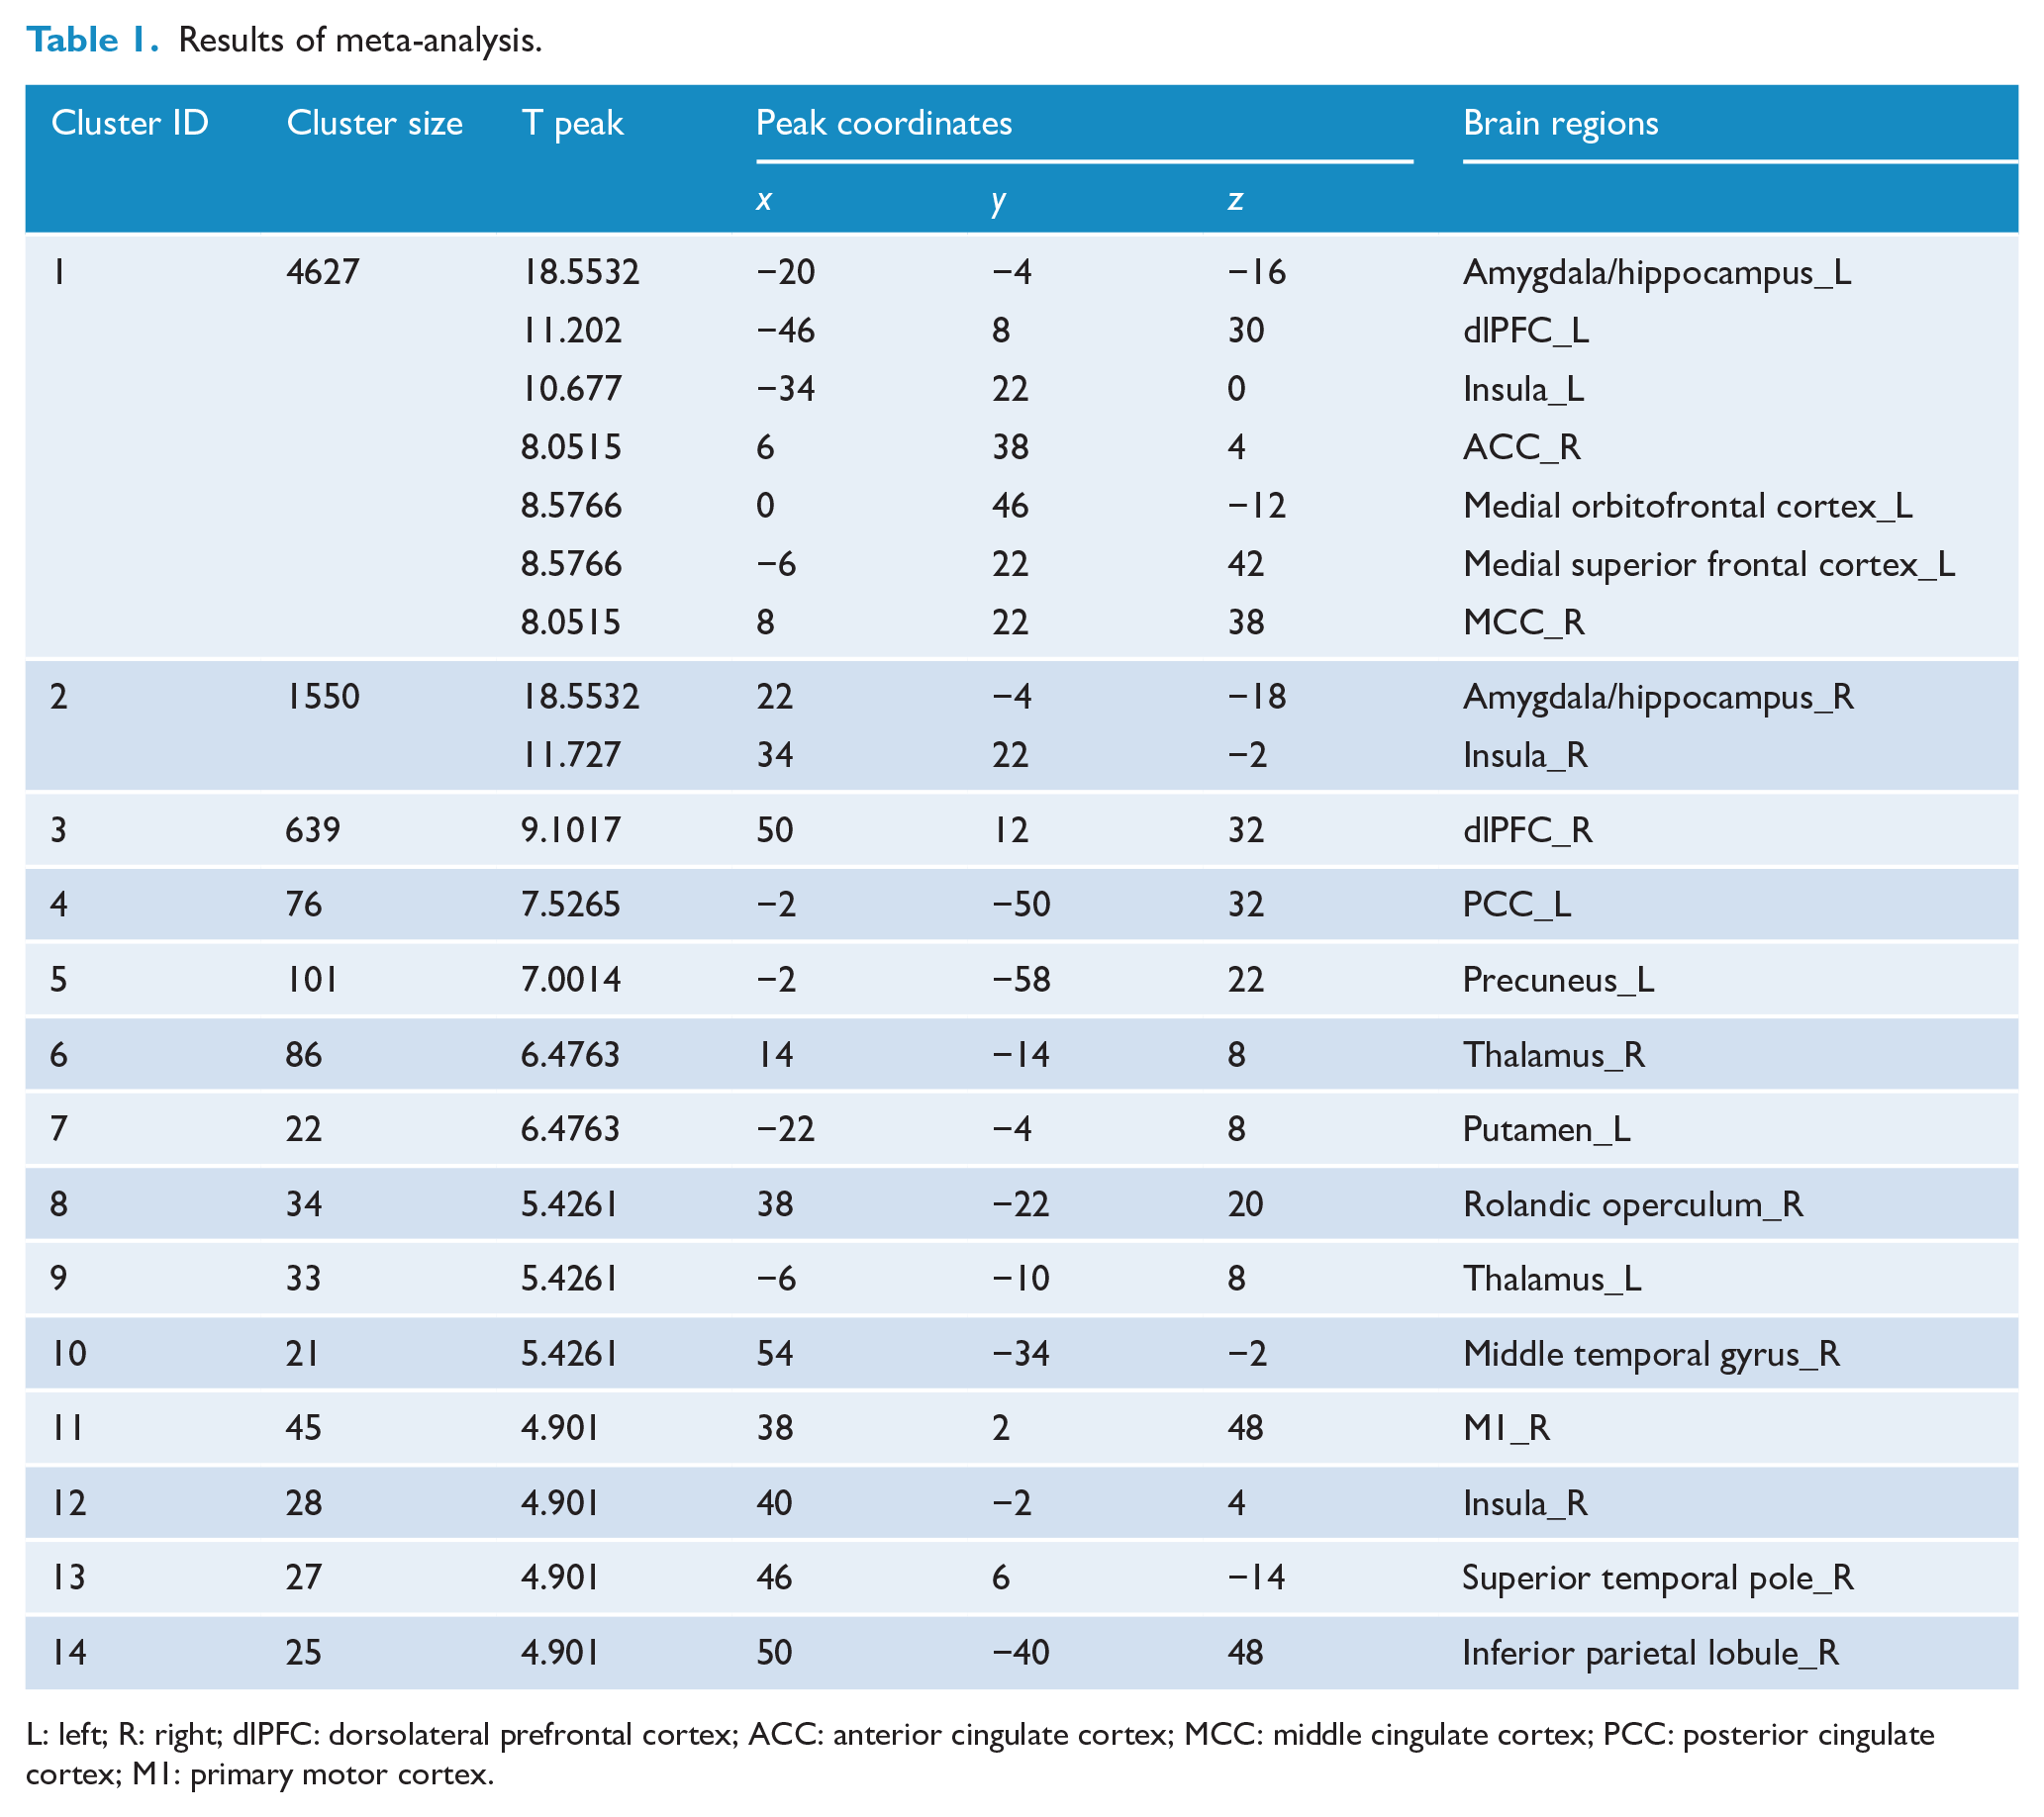
L: left; R: right; dlPFC: dorsolateral prefrontal cortex; ACC: anterior cingulate cortex; MCC: middle cingulate cortex; PCC: posterior cingulate cortex; M1: primary motor cortex.
Potential NIBS locations for depressive disorders
Three subjects were excluded because of substantial head motion. Thirty-seven depression patients were included in the analysis. The results of the three pipelines mapped on a standard brain and a standard head in the MNI space are shown in Table 2 and Figure 2 (see the statistical maps of each pipeline in Supplementary Material 1, Figures S3–S6).
Results of three pipelines.
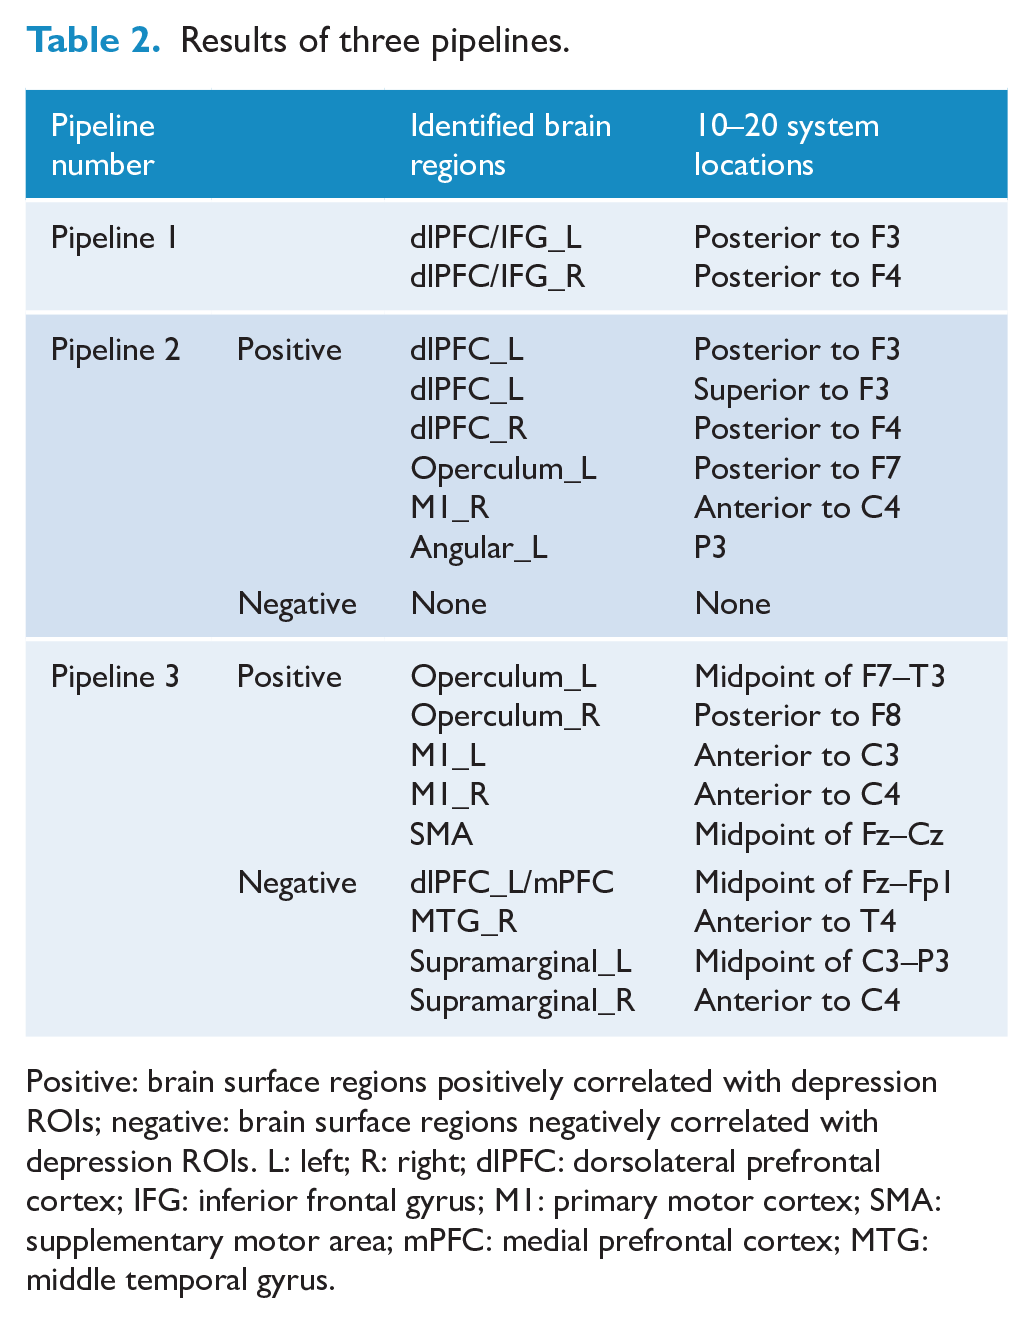
Positive: brain surface regions positively correlated with depression ROIs; negative: brain surface regions negatively correlated with depression ROIs. L: left; R: right; dlPFC: dorsolateral prefrontal cortex; IFG: inferior frontal gyrus; M1: primary motor cortex; SMA: supplementary motor area; mPFC: medial prefrontal cortex; MTG: middle temporal gyrus.
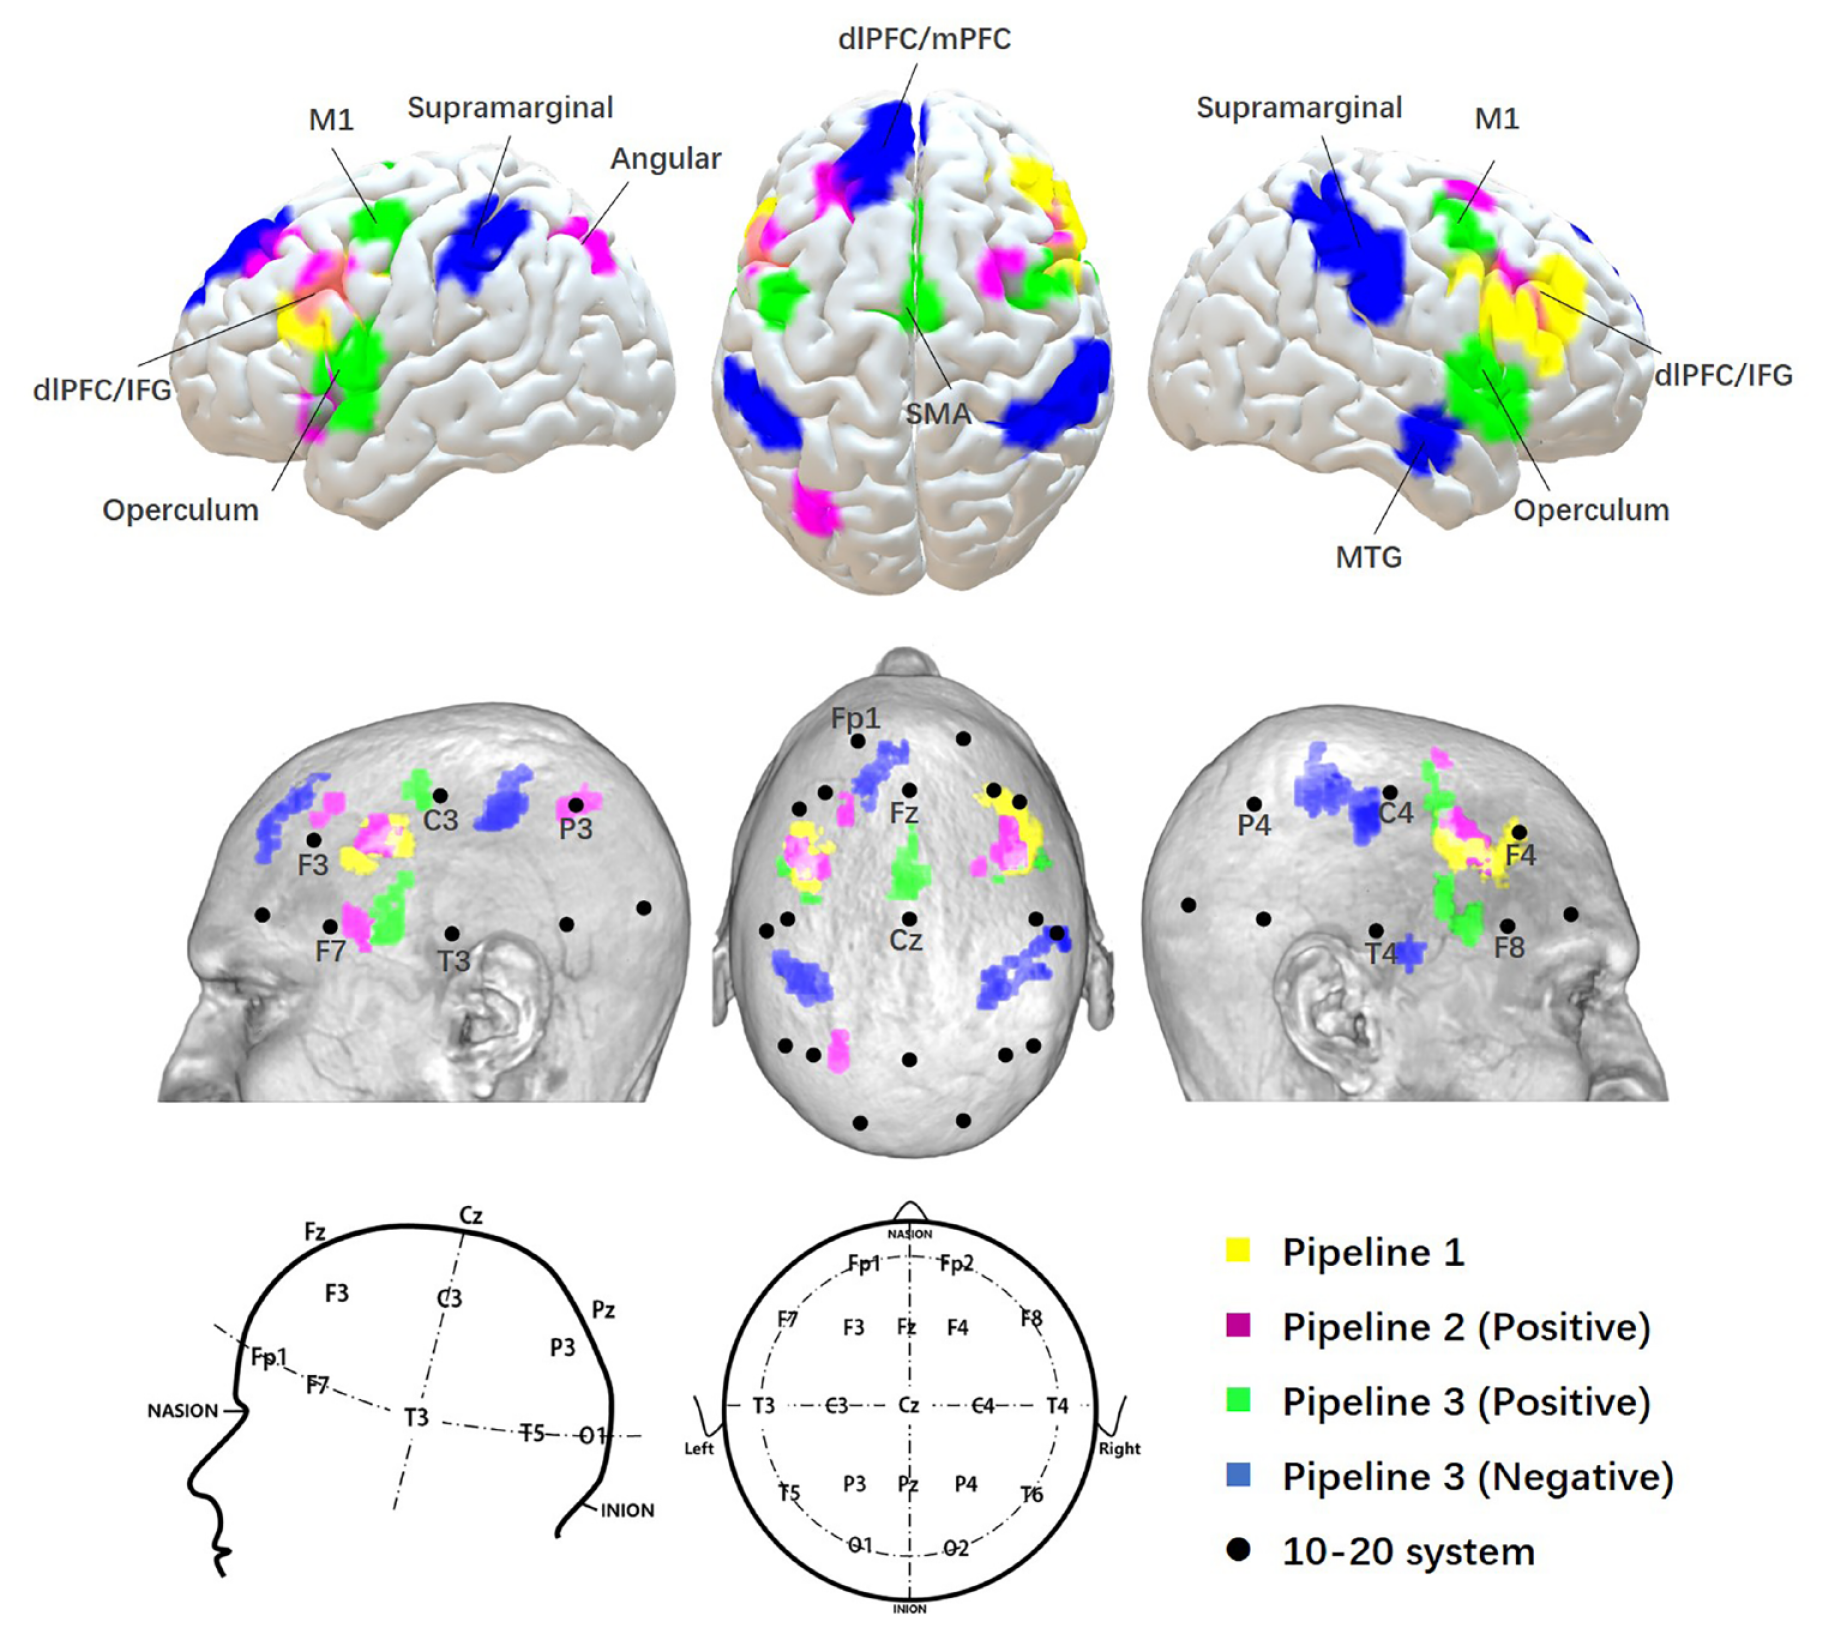
Results of three pipelines. The results from three pipelines were mapped on a standard brain and a standard head in MNI space with 10–20 system coordinates.
In pipeline 1, the bilateral dlPFC/IFG was identified as a brain surface region that may be directly involved in the pathophysiology of depressive disorders. The center of each side of the dlPFC/IFG was located posterior to F3 and posterior to F4 in the 10–20 system.
In pipeline 2, the bilateral dlPFC, left operculum (frontal, parietal and temporal), right M1 and left angular gyrus were identified as brain surface regions positively correlated with the depressive network. The 10–20 system coordinates corresponding to the centers of these regions were located approximately posterior to F3, superior to F3, posterior to F4, posterior to F7, and anterior to C4 and P3, respectively. No cluster was found to be negatively correlated with the depressive network.
In pipeline 3, the bilateral operculum, bilateral M1 and SMA were identified as brain surface regions positively correlated with depressive disorder–ROIs. The 10–20 system coordinates corresponding to the centers of these regions were located approximately at the midpoint of F7–T3, posterior to F8, anterior to C3, anterior to C4, and the midpoint of Fz–Cz, respectively. The medial prefrontal cortex (mPFC)/left dlPFC, right MTG, and bilateral supramarginal gyrus were found to be brain surface regions negatively correlated with depressive disorder–ROIs. The 10–20 system coordinates corresponding to the centers of these regions were located approximately at the midpoint of Fz–Fp1, anterior to T4, midpoint of C3–P3, and anterior to C4.
Discussion
Combining meta-analysis and functional connectivity analysis, we explored potential brain surface areas and their corresponding scalp locations for NIBS in the treatment of depressive disorders. These potential brain surface regions included the bilateral dlPFC, bilateral IFG, mPFC, SMA, bilateral supramarginal gyrus, bilateral M1, bilateral operculum, left angular gyrus, and right MTG. The corresponding scalp locations were posterior to F3, posterior to F4, superior to F3, posterior to F7, anterior to C4, P3, midpoint of F7–T3, posterior to F8, anterior to C3, midpoint of Fz–Cz, midpoint of Fz–Fp1, anterior to T4, midpoint of C3–P3, and anterior to C4 in the 10–20 system.
We identified the dlPFC as a potential target of NIBS for depressive disorders in all three pipelines. This finding is consistent with current stimulation targets for depressive disorders (Lipsman et al., 2014). We also found that the stimulation locations of the bilateral dlPFC were centered posterior to the F3 and F4 in the 10–20 system coordinates, which are posterior to the coordinates used in most tDCS studies (F3, F4, F8, and Fp2) (Meron et al., 2015). Our finding is in line with a previous meta-analysis that found consistent changes in the Brodmann area 9 in depression patients, which extends relatively posterior in the dlPFC (Fitzgerald et al., 2006). Currently, the optimal location for stimulating the dlPFC remains unclear. Unlike tDCS studies, most NIBS studies use a ‘5 cm rule’ (5 cm anterior to the motor cortex) to identify the stimulation location for the dlPFC (Spronk et al., 2011). Interestingly, studies have found that the stimulation site identified from the ‘5 cm rule’ is located posterior to the F3 (Fitzgerald et al., 2009; Fox et al., 2012), which is exactly the same location identified in this study. Many studies have confirmed the effectiveness of stimulating this location and its homologue in the right side for depression (Cao et al., 2018; Kazemi et al., 2016). Thus, our results provide neuroscientific evidence to support the idea that the optimal stimulation location of the dlPFC is posterior to the F3 and F4.
The M1 and operculum were identified as potential regions in two pipelines. Previous studies have suggested that these regions play important roles in the pathophysiology of depressive disorders. The M1 is a frequently used target for NIBS. A previous study has shown that M1 stimulation may induce functional changes in the thalamus and modulate the affective component of subjects (Polania et al., 2012). Another study showed that stimulating the left M1 is safe for investigating and treating children with major depressive disorder (Croarkin et al., 2013). The operculum is part of a modality-specific neural network sensitive to specific forms of emotional discrimination (Van Rijn et al., 2005). It is also a critical hub in the cingulo-opercular network, which is related to the psychopathology of depressive disorders (Wu et al., 2016). Along with the above findings, our study demonstrates the potential of the M1 and operculum in treating depressive disorders with NIBS.
The IFG, mPFC, SMA, MTG, angular gyrus, and supramarginal gyrus were identified in one pipeline. The mPFC is a critical hub in the default mode network (DMN), and studies have highlighted the importance of the DMN in pathophysiology of depressive disorders (Fang et al., 2016; Zhu et al., 2012). Thus, stimulating the mPFC may modulate activity in the DMN and produce therapeutic effects for depressive disorders. The IFG is a key cortical hub in the circuits of emotion and cognitive control (Roberts et al., 2017). In line with our finding, a previous meta-analysis found that the IFG is one of the most consistently identified regions involved in the pathophysiology of major depressive disorder (Fitzgerald et al., 2008).
The SMA may play a critical role in treatment-resistant depression. Hypometabolism in the SMA is considered to be a characteristic feature of treatment-resistant depression (Li et al., 2015). A recent study showed that activation in the SMA is associated with persistent antidepressant effects (Chen et al., 2018). The angular gyrus and supramarginal cortex are part of the temporoparietal junction (TPJ)—a region integrating information from diverse cognitive functions (Carter and Huettel, 2013). TPJ hypofunction is believed to be associated with low emotional arousal in depression (Moratti et al., 2008), and a previous study found that successful antidepressant treatment resulted in normalization of the hypoactivation at the TPJ (Domschke et al., 2015). The MTG is part of a relevant functional network associated with major depressive disorder (Liu et al., 2018). Depression patients show consistently and significantly decreased cortical gray matter in the MTG (Schmaal et al., 2017). A study further found that activity changes in the MTG are correlated with remission status in depression patients (Khalaf et al., 2016).
The literature described above provides support for the use of these regions in NIBS for depressive disorders. Stimulation of these regions may have different effects, as these regions could play different roles in depressive disorders. These different roles may further guide the application of these regions for different symptoms of depressive disorders.
There are several limitations to our study. First, the excitatory or inhibitory nature of the brain regions we identified is unclear. For techniques such as tDCS and TMS, it is important to know whether to excite or inhibit the brain region. Also, the efficacy of these techniques will be affected by parameters such as stimulus frequency, intensity and duration. Thus, further exploration is needed to establish detailed protocols for the use of these regions in NIBS. Second, we only investigated brain surface regions that are functionally connected to depressive disorder–ROIs. Future studies using anatomical connectivity methods could corroborate our results and investigate other potential brain regions for NIBS. Third, we do not know which pipeline would identify the most effective brain regions. Pipeline 1 may identify locations directly involved in the pathophysiology of depressive disorders, pipeline 2 may identify locations possessing the strongest correlations with the depressive network, and pipeline 3 may identify the brain surface regions correlated with the largest number of depressive disorder–associated ROIs. Although it is difficult to tell which the best option is, understanding the roles of each pipeline may help future researchers choose which regions to use. Fourth, the meta-analysis conducted by Neurosynth is not flawless. Potential errors may occur during automatic extraction and synthesis of fMRI activation coordinates. However, several supporting analyses have been conducted to confirm the validity and sensitivity of Neurosynth-based meta-analysis and may provide evidence for the feasibility of this method (Yarkoni et al., 2011).
In conclusion, our study identified several potential stimulation targets for NIBS treatment of depressive disorders. The brain surface regions corresponding to these targets include the bilateral dlPFC, IFG, mPFC, SMA, bilateral supramarginal gyrus, bilateral M1, bilateral operculum, left angular gyrus, and right MTG. These findings may serve as a basis for future NIBS clinical investigations and applications.
Supplemental Material
Supplementary_materials_for – Supplemental material for Locations for noninvasive brain stimulation in treating depressive disorders: A combination of meta-analysis and resting-state functional connectivity analysis
Supplemental material, Supplementary_materials_for for Locations for noninvasive brain stimulation in treating depressive disorders: A combination of meta-analysis and resting-state functional connectivity analysis by Binlong Zhang, Jiao Liu, Tuya Bao, Georgia Wilson, Joel Park, Bingcong Zhao and Jian Kong in Australian & New Zealand Journal of Psychiatry
Footnotes
Declaration of Conflicting Interests
The author(s) declared the following potential conflicts of interest with respect to the research, authorship and/or publication of this article: J.K. has a disclosure to report (holding equity in a startup company [MNT] and pending patents to develop new neuromodulation tools), but declares no conflict of interest. All other authors declare no conflicts of interest.
Funding
The author(s) received no financial support for the research, authorship, and/or publication of this article.
Supplemental material
Supplemental material for this article is available online.
References
Supplementary Material
Please find the following supplemental material available below.
For Open Access articles published under a Creative Commons License, all supplemental material carries the same license as the article it is associated with.
For non-Open Access articles published, all supplemental material carries a non-exclusive license, and permission requests for re-use of supplemental material or any part of supplemental material shall be sent directly to the copyright owner as specified in the copyright notice associated with the article.