
Abstract
Objective:
Access to services and workforce shortages are major challenges in rural areas worldwide. In order to improve access to mental health care, it is imperative to understand what services are available, what their capacity is and where existing funds might be spent to increase availability and accessibility. The aim of this study is to investigate mental health service provision in a selection of rural and remote areas across Australia by analysing service availability, placement capacity and diversity.
Method:
This research studies the health regions of Western New South Wales and Country Western Australia and their nine health areas. Service provision was analysed using the DESDE-LTC system for long-term care service description and classification that allows international comparison. Rates per 100,000 inhabitants were calculated to compare the care availability and placement capacity for children and adolescents, adults and older adults.
Results:
The lowest diversity was found in northern Western Australia. Overall, Western New South Wales had a higher availability of non-acute outpatient services for adults, but hardly any acute outpatient services. In Country Western Australia, substantially fewer non-acute outpatient services were found, while acute services were much more common. Acute inpatient care services were more common in Western New South Wales, while sub-acute inpatient services and non-acute day care services were only found in Western New South Wales.
Conclusion:
The number and span of services in the two regions showed discrepancies both within and between regions, raising issues on the equity of access to mental health care in Australia. The standard description of the local pattern of rural mental health care and its comparison across jurisdictions is critical for evidence-informed policy planning and resource allocation.
Introduction
While the prevalence of mental health disorders in rural and remote areas in Australia is similar to that in urban areas, suicide rates are higher (Australian Institute of Health and Welfare, 2014). Factors that might contribute to this include geographic and interpersonal isolation, economic pressures, environmental adversities, governmental policies, stigma and a greater proportion of high-risk groups such as Aboriginal and Torres Strait Islander people, as well as poor or limited service availability, accessibility, funding, staffing and supervision (Hirsch and Cukrowicz, 2014; Inder et al., 2011). Access to services and workforce shortages are major challenges in rural (and remote) areas worldwide (Strasser, 2003), and better access to mental health care seems essential to improve outcomes in rural areas. The Community Affairs References Committee (2018) of the Australian Senate has recently produced a report on the accessibility and quality of mental health services in rural Australia describing the barriers to access care and the problems of workforce in rural Australia. Although there has been some success in this area (Bradford et al., 2016; Morley et al., 2007; Perkins et al., 2006; Saurman et al., 2014a, 2014b), it is imperative to understand the availability, capacity and diversity of the current care system in order to monitor change, guide resource allocation and allow comparisons across jurisdictions and countries for benchmarking and comparative effectiveness. A better knowledge of the current provision is essential to guarantee access to health facilities, goods and services in rural areas, as stated by the United Nations Declaration on the Rights of Peasants and Other People Working in Rural Areas (United Nations General Assembly, 2018). However, this research is hampered by terminological variability (e.g. different terms are used in different settings to name similar services) and the commensurability bias (lack of common units of analysis in service assessment that may allow comparisons like-with-like across health districts and countries).
The Description and Evaluation of Services and Directories for Long-Term Care (DESDE-LTC; Salvador-Carulla et al., 2013) is an international classification system that addresses these two problems. It is used to generate ‘Integrated Mental Health Atlases’ to map services, identify gaps in service availability and provide service comparisons at a local level. These atlases are called ‘integrated’ because they incorporate a standard description of all services available in a defined area for a target population group including health, social, employment, education, justice and housing sectors. Visual maps of rural mental health services in Australia have been developed for Western Australia and New South Wales at different levels of geographical aggregation (Furst et al., 2018a; Hopkins et al., 2017a, 2017b; Salvador-Carulla et al., 2016), as well as for various rural and urban areas in Europe and Chile (Fernandez et al., 2015; Gutiérrez-Colosía et al., 2019; Salinas-Perez et al., 2018; Salvador-Carulla et al., 2008, 2015).
The aim of this study is to investigate mental health service provision in a selection of rural areas by analysing service availability, placement capacity and service diversity in rural and remote Australia.
Method
Study areas
In Australia, 31 Primary Health Networks (PHNs) were established by the Australian Government in 2015. The area of coverage of 20 of these 31 PHNs comprises only rural and remote areas. The current study, which is part of a larger project that aims to map mental health services in all of Australia, describes services in two rural PHN regions in which mapping has been completed: those of the Western New South Wales Primary Health Network (WNSW PHN) and the Country Western Australia Primary Health Network (CWA PHN).
The WNSW PHN contains two Local Health Districts (LHDs): Far West LHD and WNSW LHD. The CWA PHN contains seven regions: Goldfields, Great Southern, Kimberley, Midwest, Pilbara, South West, and Wheatbelt. Together, these nine areas cover over 38% of the Australian continent.
According to the Australian Standard Geographical Classification–Remoteness Areas (ASGC-RA) classification (McGrail and Humphreys, 2009), the whole of the Kimberley, Pilbara and Goldfields regions covered by CWA PHN, as well as the Far West LHD in WNSW PHN, are remote or very remote areas. The remaining jurisdictions are classified as rural areas (inner or outer regional Australia category).
The areas were described with a set of key demographic and socioeconomic indicators collected from the Census of Population and Housing 2016 (Australian Bureau of Statistics, 2018), and from the Social Health Atlases of Australia 2011–2016 (Public Health Information Development Unit [PHIDU], 2018). Socio-demographic characteristics and service availability were visualised using different levels of aggregation (e.g. Statistical Areas, Local Government Areas and PHN) to provide a more comprehensive understanding of the geographical variation of health determinants and service distribution. Our analysis here, however, is at regional level in WA and LHD level in WNSW. A more detailed visualisation is available at the atlases of these PHNs (see https://rsph.anu.edu.au/research/projects/atlas-mental-health-care).
Measures
The DESDE-LTC system (Salvador-Carulla et al., 2013) was used to assess all the services providing mental health care for people within the boundaries of the selected catchment areas. This internationally validated tool enables a standardised classification of mental health services based on information provided by the public agencies and care provider organisations in the local areas. The DESDE-LTC identifies ‘Basic Stable Inputs of Care’ (BSICs), which are defined as ‘the minimal organisational unit composed by a set of inputs with temporal stability arranged for delivering health related care to a defined population in a care area’ (Salvador-Carulla et al., 2013, 2015). Once a BSICs is identified, a code based on its main meaningful activity is provided for facilitating international comparison. This code, called the ‘Main Types of Care’ (MTC), uses a tree taxonomy for classifying six main branches: (1) residential care, (2) day care, (3) outpatient care, (4) accessibility to care, (5) information for care and (6) self-help and voluntary care. This results in each service being described using one or more MTC code(s) based on the main care structure and activity they offer, reflecting the real provision of care in the catchment areas. For a more detailed description of the DESDE-LTC terminology and the six main types of care, please check its glossary of terms (Montagni et al., 2018) and Box 1 in Fernandez et al. (2017). Supplementary Material provides examples of the translation of this international taxonomy to terms commonly used to describe mental health services in Australia.
Inclusion criteria
To be included in the current rural mental health atlas, a service had to meet the following inclusion criteria:
Specialised – defined as targeting people with a lived experience of mental illness. Thus, general practitioners and other Medicare Benefits Schedule (MBS) eligible practitioners were not included in this study.
Universally accessible – defined as not having a significant out-of-pocket cost. This excludes exclusively private sector services providing out-of-pocket care or fully private insurance without significant public financing.
Stable – defined as having ‘temporal stability’ (the service has received funding for more than 3 years), and ‘organisational stability’ defined as having administrative support, its own space, finances and documentation to track activity. The inclusion of stable services guarantees that the mapping reflects the robustness of the system. As such, pilot projects or services provided through short-term grants are excluded, unless these services have demonstrated capacity to sustain themselves over 3 years through different funding sources. Services were included if they were considered to be ongoing or had been delivered over a long period of time, even when their funding may not be secured beyond 1 year. This approach took into consideration uncertainty around funding streams and organisational management planning due to the implementation of the National Disability Insurance Scheme (NDIS; Furst et al., 2018b).
Care provision within the boundaries of the WNSW PHN and the CWA PHN.
Providing direct care or support to clients. This excludes services that were only concerned with the coordination of other services, without direct contact with people with lived experience of mental illness.
Data collection and analysis
A range of meetings with peak bodies and sector representatives was undertaken in both PHNs to build a list of all services providing mental health care in each study area. Next, data from identified services were collected through face-to-face interviews, telephone interviews and through an online survey tool in 2016 and 2017.
The availability, placement capacity and diversity of BSIC by MTC were analysed. Availability is calculated per 100,000 of the target population and defined as the service being operable upon demand to perform its designated or required function. Placement capacity refers to the maximum number of beds in residential care and to the maximum number of non-residential places in day care available in the catchment area at a given time. Data were grouped into seven major care types of functional teams reflecting the range of variability or diversity of services in these catchments: hospital and alternatives to hospital, community residential, day care, health outpatient, social outpatient and accessibility to care. These groups were further divided into 22 sub-groups to provide a more detailed description of the mental health provision in the study areas.
Results
Description of the study areas
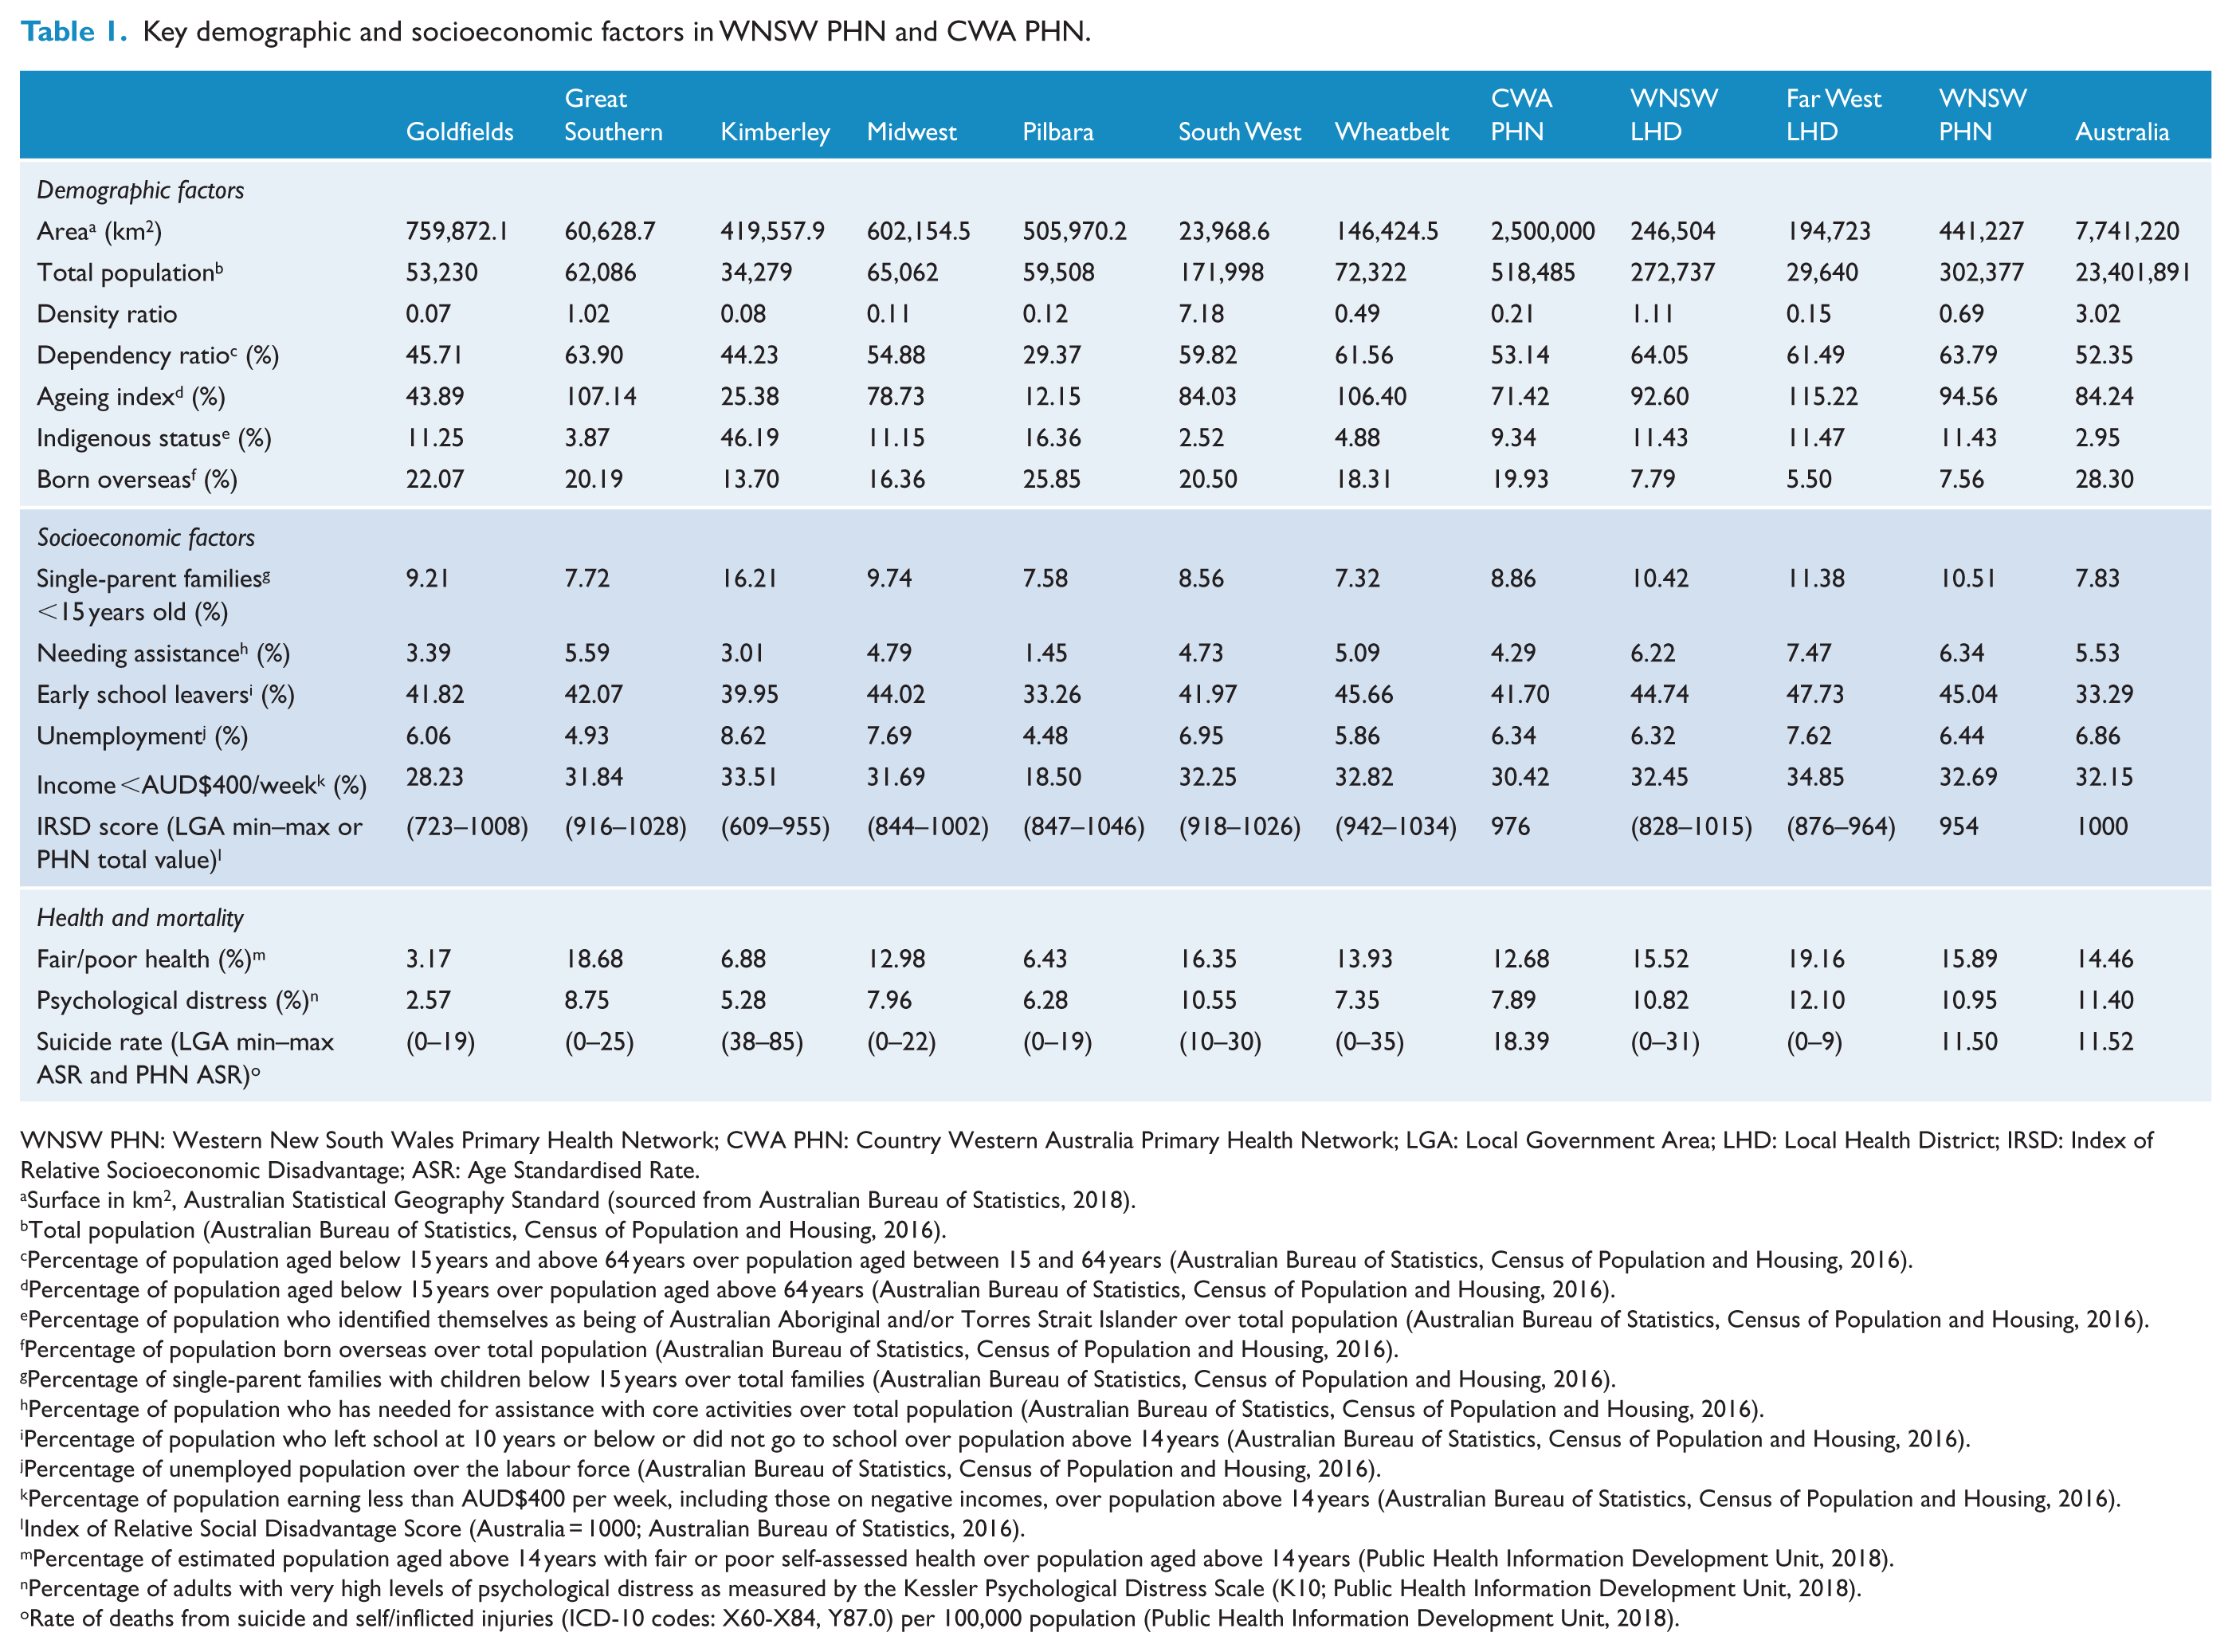
Table 1 shows the description of the study areas through demographic, socioeconomic, and health and mortality indicators. Main characteristics are summarised below.
Key demographic and socioeconomic factors in WNSW PHN and CWA PHN.
WNSW PHN: Western New South Wales Primary Health Network; CWA PHN: Country Western Australia Primary Health Network; LGA: Local Government Area; LHD: Local Health District; IRSD: Index of Relative Socioeconomic Disadvantage; ASR: Age Standardised Rate.
Surface in km2, Australian Statistical Geography Standard (sourced from Australian Bureau of Statistics, 2018).
Total population (Australian Bureau of Statistics, Census of Population and Housing, 2016).
Percentage of population aged below 15 years and above 64 years over population aged between 15 and 64 years (Australian Bureau of Statistics, Census of Population and Housing, 2016).
Percentage of population aged below 15 years over population aged above 64 years (Australian Bureau of Statistics, Census of Population and Housing, 2016).
Percentage of population who identified themselves as being of Australian Aboriginal and/or Torres Strait Islander over total population (Australian Bureau of Statistics, Census of Population and Housing, 2016).
Percentage of population born overseas over total population (Australian Bureau of Statistics, Census of Population and Housing, 2016).
Percentage of single-parent families with children below 15 years over total families (Australian Bureau of Statistics, Census of Population and Housing, 2016).
Percentage of population who has needed for assistance with core activities over total population (Australian Bureau of Statistics, Census of Population and Housing, 2016).
Percentage of population who left school at 10 years or below or did not go to school over population above 14 years (Australian Bureau of Statistics, Census of Population and Housing, 2016).
Percentage of unemployed population over the labour force (Australian Bureau of Statistics, Census of Population and Housing, 2016).
Percentage of population earning less than AUD$400 per week, including those on negative incomes, over population above 14 years (Australian Bureau of Statistics, Census of Population and Housing, 2016).
Index of Relative Social Disadvantage Score (Australia = 1000; Australian Bureau of Statistics, 2016).
Percentage of estimated population aged above 14 years with fair or poor self-assessed health over population aged above 14 years (Public Health Information Development Unit, 2018).
Percentage of adults with very high levels of psychological distress as measured by the Kessler Psychological Distress Scale (K10; Public Health Information Development Unit, 2018).
Rate of deaths from suicide and self/inflicted injuries (ICD-10 codes: X60-X84, Y87.0) per 100,000 population (Public Health Information Development Unit, 2018).
The WNSW PHN covers a land area of 441,000 km2 and has a population of 302,377. The population density of this PHN was 0.69 inhabitants per km2, which was considerably lower than the Australian density of 3.02. The dependency ratio, ageing index and percentage of people identifying as Aboriginal or Torres Strait Islander were above national rates. The percentage of people born overseas was substantially lower than the national value. Socioeconomically, this region performed worse on all indicators compared to the national figure except on unemployment and the proportion of people earning below AUD$400 per week. However, there was considerable variation within the region on most of these indicators. Regarding health and mortality, the proportion of people indicating fair or poor health was just above the national proportion, while psychological distress and suicide rates were at a similar level.
Within the WNSW PHN, the area covered by the Far West LHD has a much lower population density than that of the WNSW LHD, and a notably higher ageing index. Socioeconomic factors were similar for both LHDs, although the Far West LHD performed slightly worse on all indicators. Similarly, the health and mortality indicators were slightly better in WNSW LHD, although several of its LGAs had suicide rates above 20 per 100,000 population, which was significantly higher than the rate for the whole country.
The CWA PHN encompasses an area of approximately 2.5 million km2, which represents about 32% of Australia’s land area. Its 518,485 inhabitants (2.2% of Australia’s total population) are not uniformly dispersed, with considerable variation in population density. The overall density ratio was substantially lower than that of the Australian as a whole. The dependency ratio was similar to the overall Australian ratio, while the ageing index and percentage of people born overseas were lower. The proportion of Indigenous people was substantially higher. Socioeconomic indicators were similar to or better than the national figure, except for the higher proportion of early school leavers and the lower Index of Relative Socioeconomic Disadvantage (IRSD) score. Health and mortality indicators show that the proportion of people indicating fair or poor health was below the Australian rate, as was also the case with psychological distress. The suicide rate was markedly higher than the Australian rate.
At the health region level, most had population densities below 1 except for Greater Southern and South West. The highest proportion of Indigenous population was found in Kimberley. Overall, Pilbara performed best in terms of socioeconomic indicators, although these data are biased due to the inclusion in the census data of temporary residents and ‘fly-in fly-out’ workers in the mining sector, while the Kimberley was the opposite, displaying a high suicide rate.
Broad overview of services in study areas
Within the WNSW PHN, a total of 124 BSICs were identified, which deliver 128 MTCs. The majority of the MTCs were for adults (89.8%), while 8.6% were for children and adolescents, and 1.6% were for older adults. Considering the main branches of care, outpatient type services were most common (71.9%), followed by residential care (14.1%), day care (7.0%), self-help and voluntary care (4.7%), and accessibility to care (2.3%). Information for care services was not identified. The care diversity within this PHN could be described using 23 different DESDE codes.
Within the CWA PHN, a total of 193 BSICs were identified, which deliver 240 MTCs. The majority of these MTCs were intended for adults (72.9%), while 18.3% were for children and adolescents and 8.8% were for older adults. By far, the largest number of teams focus on delivering outpatient care (89.6%), while 5.8% provide residential services, 2.1% accessibility to care, 1.3% day care, 0.8% information for care and 0.4% self-help and voluntary care. The care diversity in this PHN could be described using 26 different codes.
Figure 1 shows the geographical location and the share by major groups of care provided in each area. Pilbara and Kimberley were the health areas with the lowest service diversity. The former only had outpatient care and the latter, only outpatient and residential care. The remaining areas provided a higher diversity of services. Outpatient care was always the largest group in these areas.
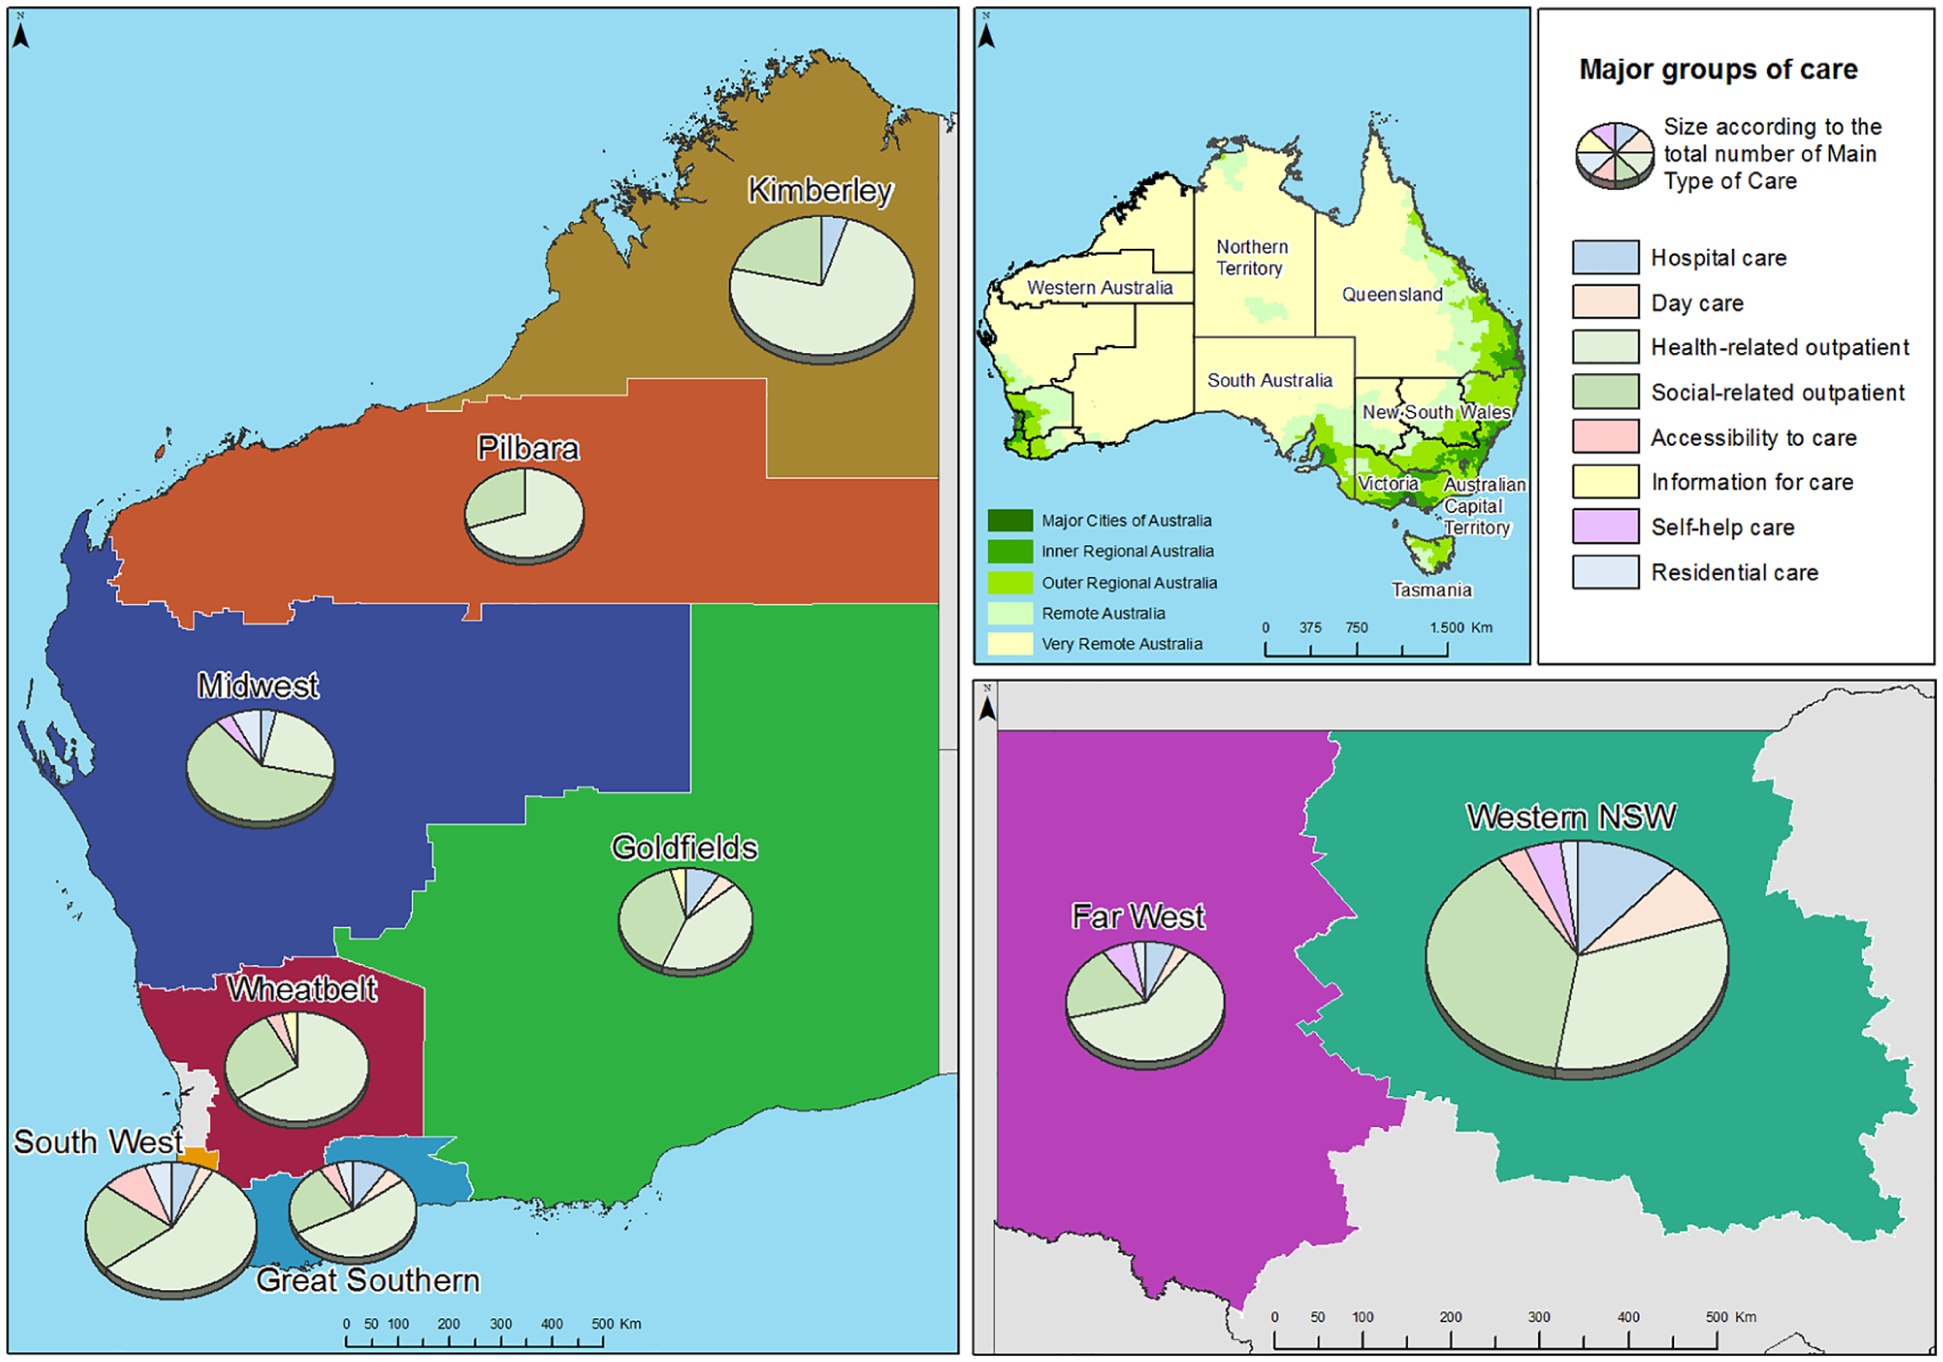
Location of the health regions of Country Western Australia and the Local Health Governments of Western New South Wales, and proportions of mental health care by main branches of the DESDE-LTC system.
Service availability and placement capacity within the WNSW PHN and CWA PHN for adults
Figure 2 depicts the availability of the main components of adult mental health care per 100,000 inhabitants in both study areas.
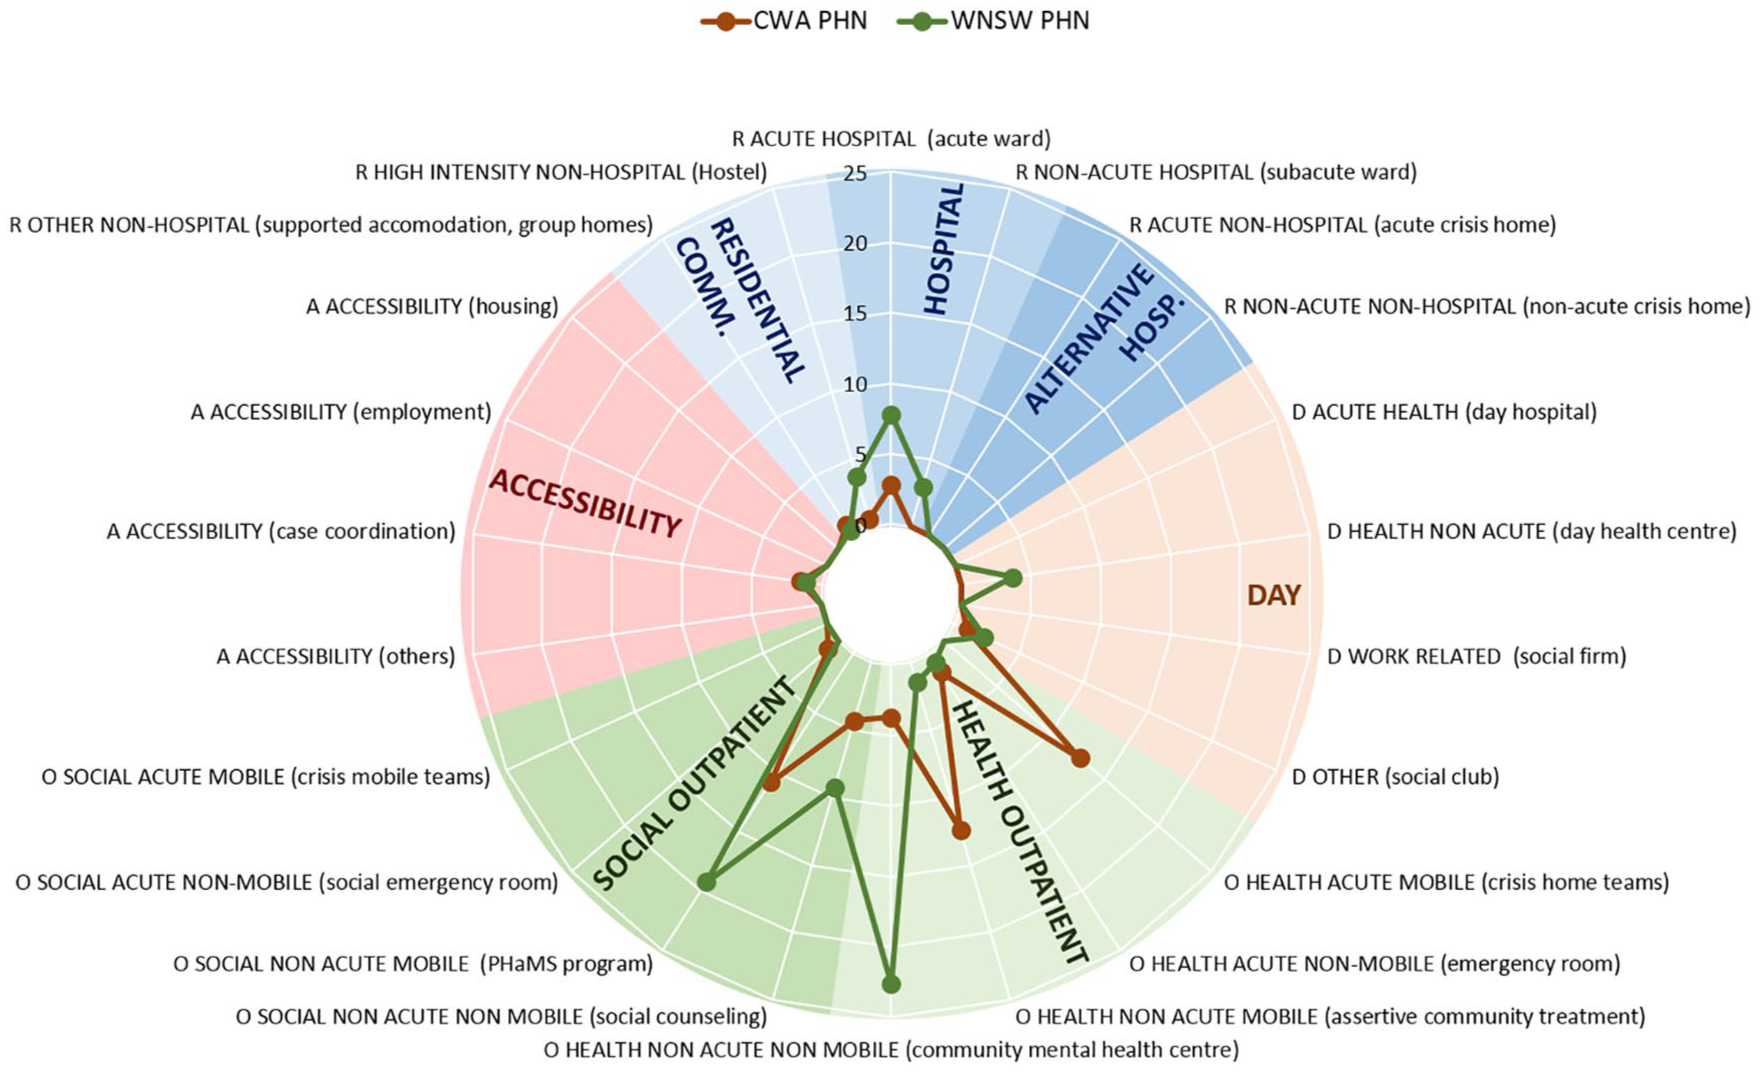
Adult mental health care in WNSW PHN and CWA PHN. Rates of groups of care for adults per 100,000 adult population.
Residential care
Acute inpatient care availability was higher in the WNSW PHN (7.77 per 100,000) compared to the CWA PHN (2.78 per 100,000), while sub-acute inpatient services were only found in WNSW. The placement capacity for acute inpatients in WNSW was 76.94 per 100,000 compared to 20.73 per 100,000 in CWA. The number of sub-acute beds in the WNSW PHN was 66.81 per 100,000. Alternatives to hospitalisation services (such as group homes) were limited in both areas, but WNSW had 3.7 per 100,000 high-intensity accommodation services (such as hostels) per 100,000. These provide a total of 36.6 beds per 100,000.
Day care
Acute day care and work-related day care facilities were missing in both PHNs. The only type of day care identified in CWA was classified as ‘other’ (which includes services such as social clubs without places assigned to specific individuals associated to structured care plans) and was limited with 0.93 facilities per 100,000. The WNSW PHN had 2.23 of these services per 100,000 plus 3.7 non-acute day care services per 100,000. Overall, day care was more limited than other types of care in both PHNs.
Outpatient care
The WNSW PHN had a higher availability of non-acute outpatient services for adults (a total of 52.6 per 100,000), but hardly any acute outpatient services (0.74 per 100,000). Acute services were much more common in CWA (a total of 15.16 per 100,000), and non-acute services were 31.24 per 100,000.
Other types of care
The availability of services classified as accessibility to care was similar in both PHNs (1.11 per 100,000 in WNSW and 1.55 per 100,000 in CWA), while self-help and voluntary care was more available in CWA PHN. Conversely, information for care was more available in the WNSW PHN.
Service availability and placement capacity in the WNSW PHN and CWA PHN for other age groups
Children and adolescents
In general, child and adolescent services had a greater availability in the WNSW PHN. Residential care was available only in WNSW for this age group, with 2.11 acute inpatient services per 100,000. Similarly, day care classified as ‘other’ was only found in WNSW, with 2.11 services per 100,000. Acute outpatient services were absent in the WNSW PHN, while there was a total of 4.77 per 100,000 in CWA. Non-acute outpatient services for children and adolescents were present in both PHNs. CWA provided more variety, with 10.35 non-acute mobile services, 8.76 non-acute non-mobile services, 7.96 social non-acute non-mobile services and 3.18 social non-acute mobile services (all per 100,000). The WNSW PHN only had non-acute mobile services (2.11 per 100,000) and a remarkable number of non-acute non-mobile services (57.22 per 100,000).
Older adults
Overall, mental health services for older adults were more common in CWA. However, only the WNSW PHN had acute inpatient services for this age group (3.41 per 100,000). No day care facilities for older adults were identified in either PHN. Acute outpatient services were only available in CWA (6.57 per 100,000). The CWA PHN also had the most non-acute outpatient services, with 18.39 non-acute mobile services and 2.63 non-acute non-mobile services (both per 100,000). In WNSW, only non-acute non-mobile outpatient services were available (3.41 per 100,000).
Service availability and placement capacity in the nine health areas for adults
Figures 3 and 4 show the availability of the main components of adult mental health care per 100,000 inhabitants in the different LHDs and health regions across the two PHNs.
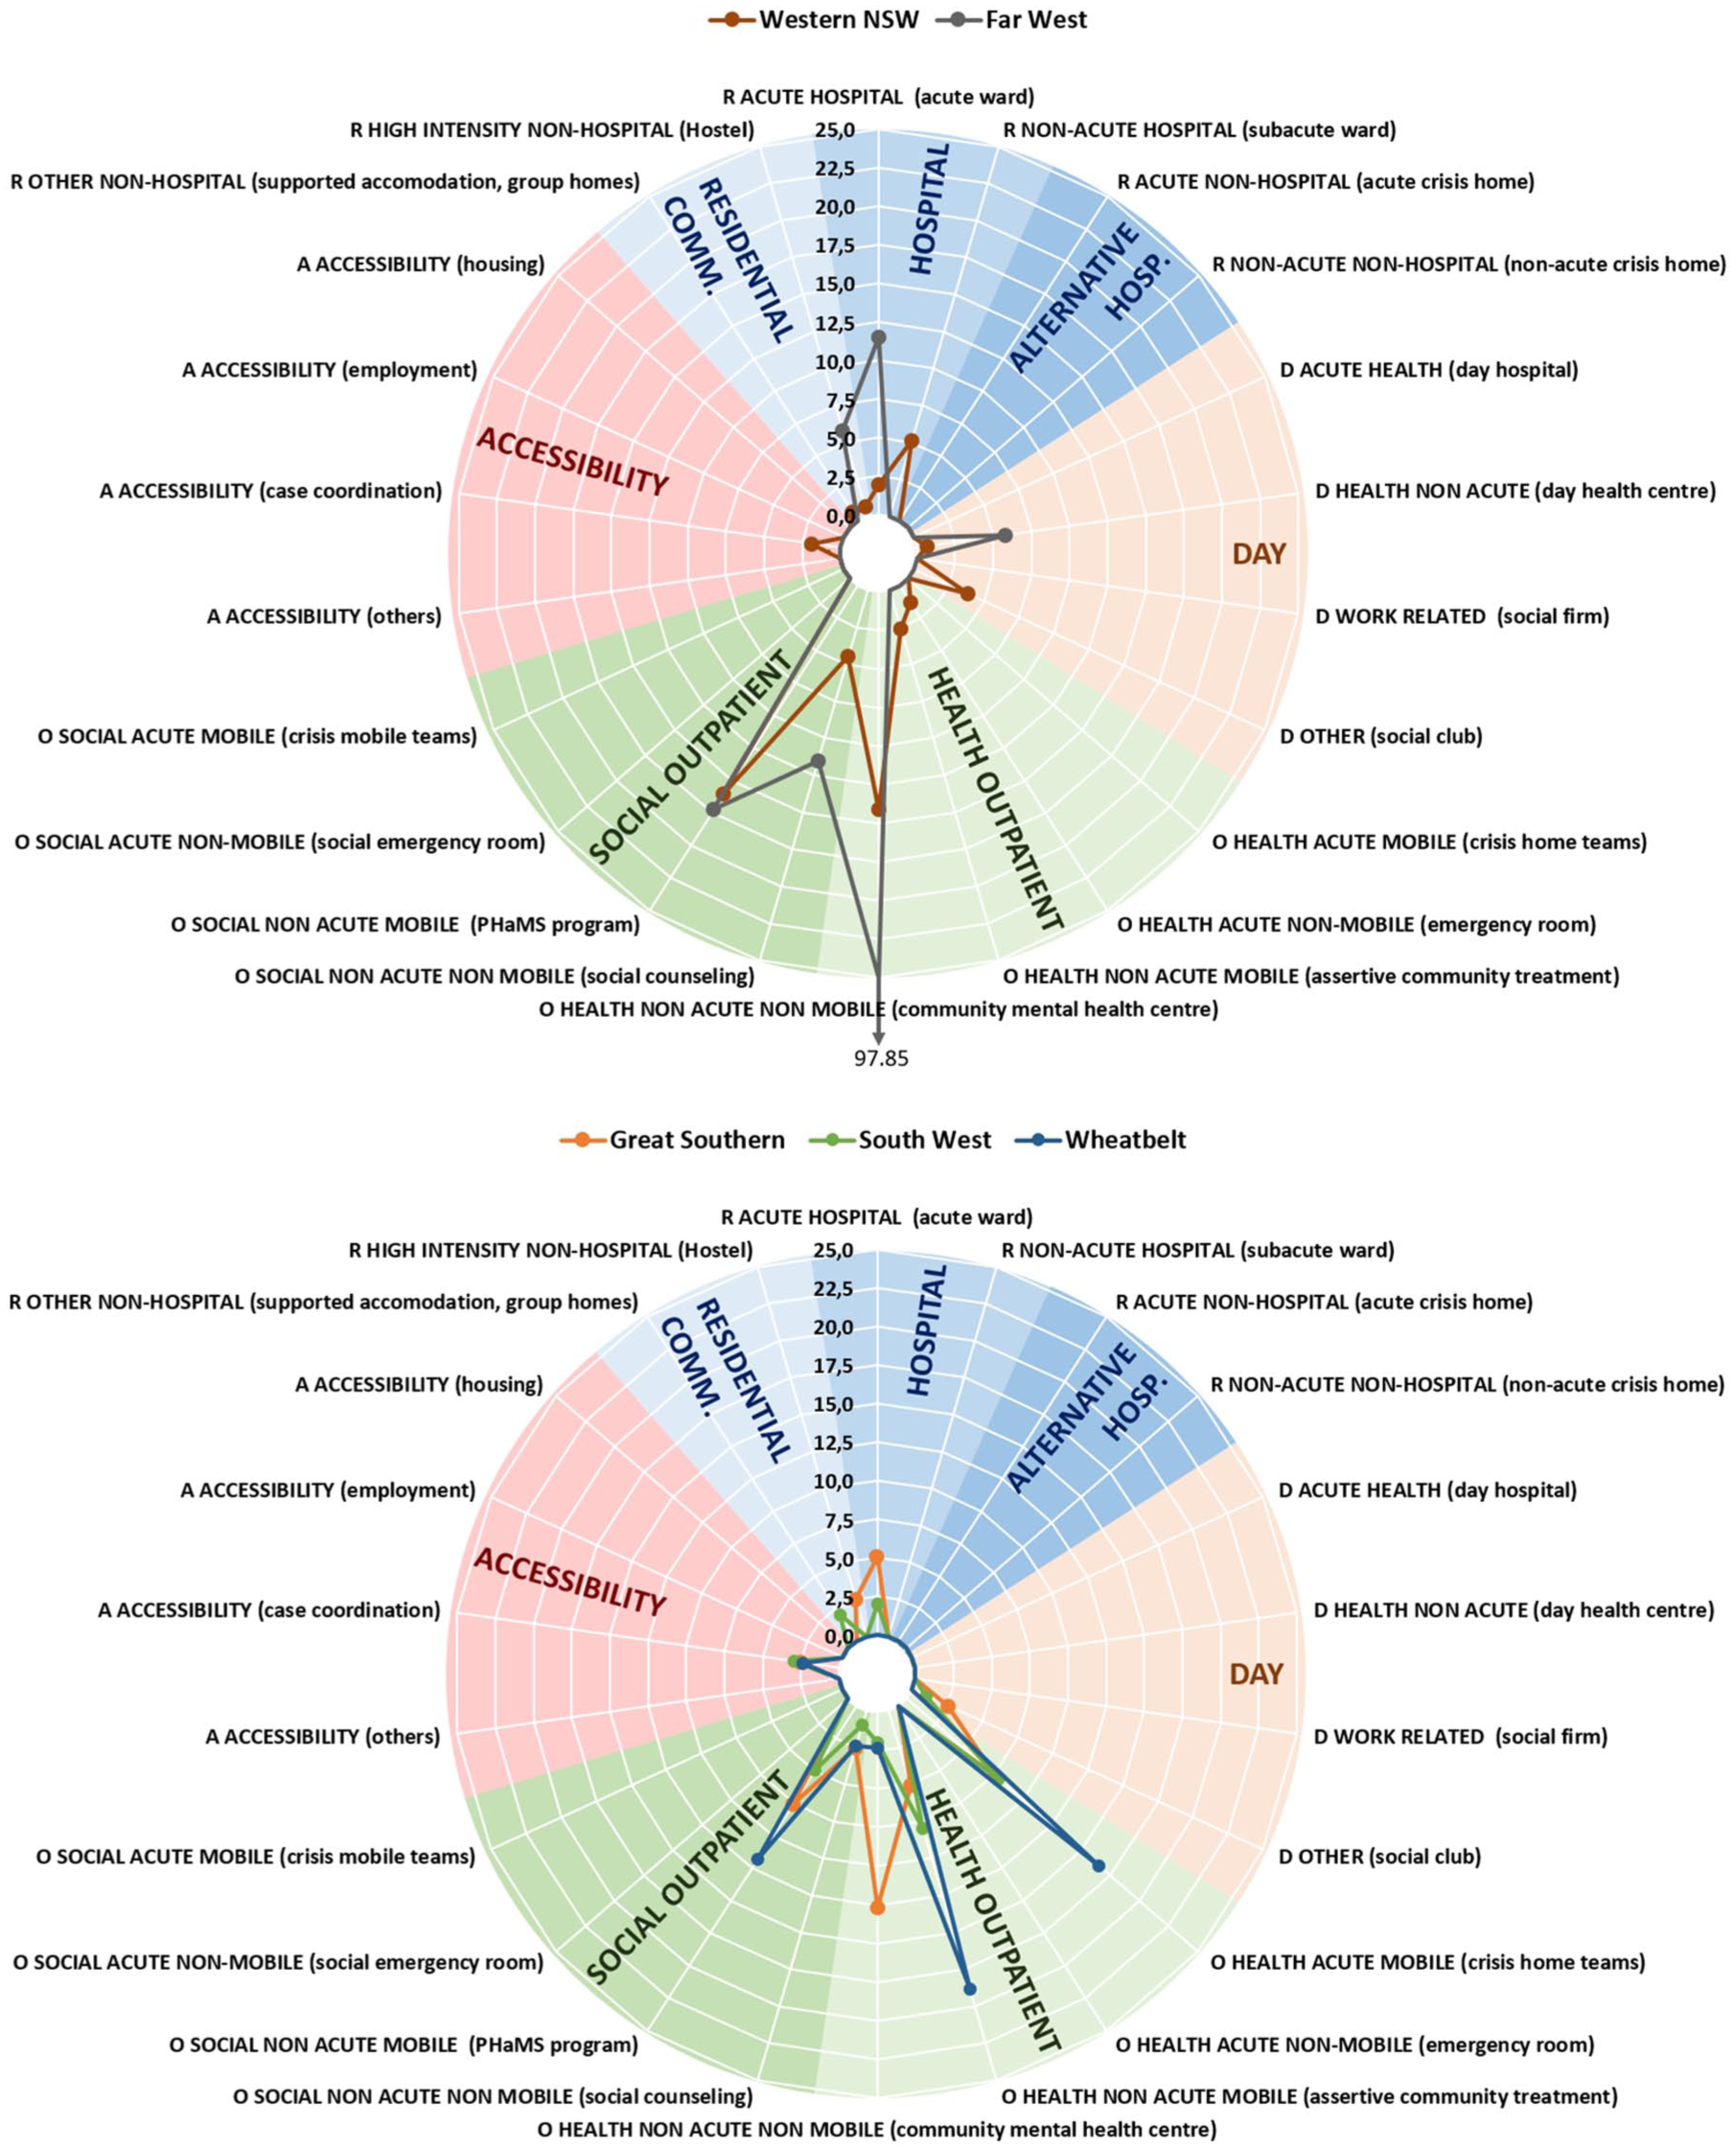
Adult mental health care in the health areas in WNSW PHN and CWA PHN (Great Southern, South West and Wheatbelt). Rates of groups of care for adults per 100,000 adult population.
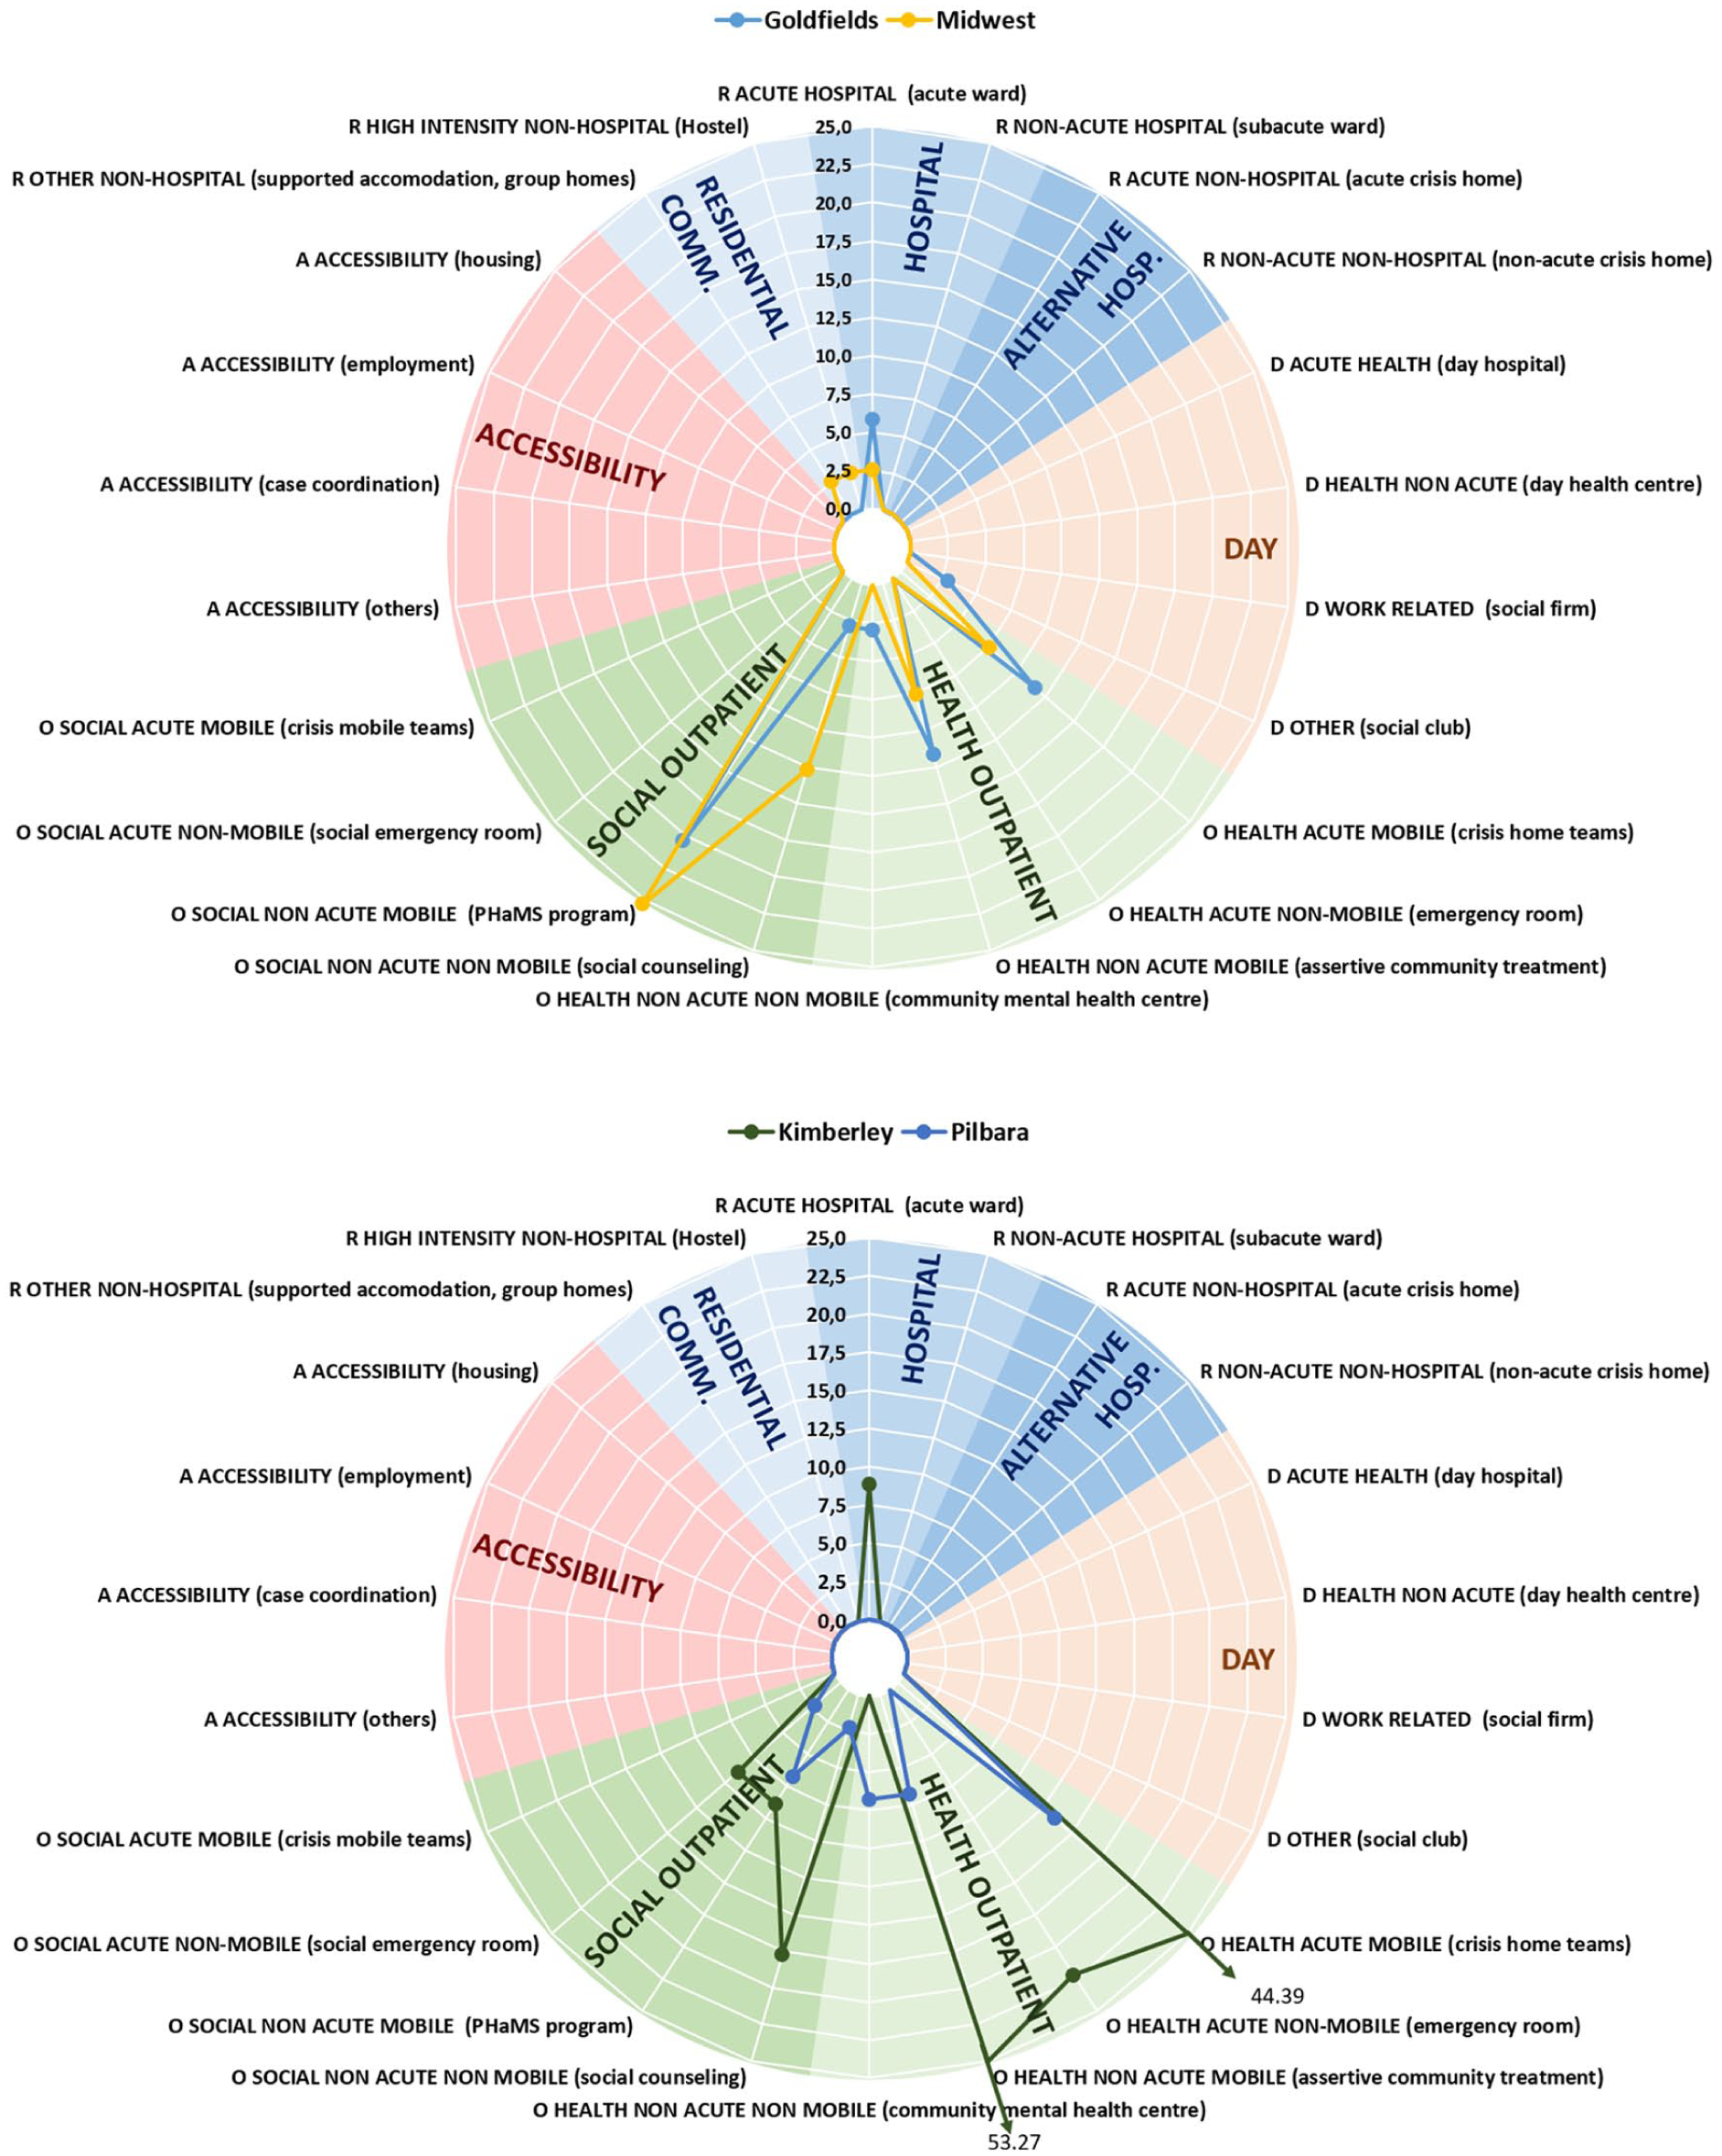
Adult mental health care in the health areas in CWA PHN (Goldfields, Midwest, Kimberley and Pilbara). Rates of groups of care for adults per 100,000 adult population.
Residential care
The highest rates of availability of acute hospital care were found in Far West LHD (11.51 services and 103.61 beds per 100,000) and the Kimberley (8.88 services and 57.71 beds per 100,000), while non-acute hospital care appeared only in WNSW LHD (with 5.14 services and 115.62 beds per 100,000). High-intensity non-hospital residential care was found in Far West LHD (5.76 services and 57.56 beds per 100,000), Great Southern (2.54 services and 27.89 beds per 100,000), Midwest (2.53 and 35.43 beds per 100,000) and WNSW LHD (0.64 services and 5.78 beds per 100,000). Other non-hospital care was identified in Midwest and South West, and WNSW LHD, although the rates were low (2.53, 1.99 and 0.64 services per 100,000; and 10.12, 24.87 and 15.42 beds per 100,000, respectively). Residential care was not available in Pilbara or Wheatbelt.
Day care
The availability of day care for adults was exiguous across the study areas. The non-acute care facilities in WNSW were mostly located in the Far West LHD (5.76 per 100,000), while the other types of day care in this PHN were all located in WNSW LHD (3.85 per 100,000). The availability of other types of day care in the CWA PHN was spread across Goldfields (2.91 per 100,000), Great Southern (2.54 per 100,000) and South West (0.99 per 100,000), with no day care available in Midwest, Kimberley, Pilbara and Wheatbelt.
Outpatient care
Acute mobile services were available in all CWA PHN regions. The highest number was observed in the Kimberley (44.39 per 100,000) and the lowest in the Great Southern region (7.61 per 100,000). Acute non-mobile services were only available in the Kimberley region (22.2 per 100,000) and WNSW LHD (1.28 per 100,000). Social acute non-mobile services were seen in Kimberley (8.88 per 100,000) and Pilbara (2.25 per 100,000). Non-acute non-mobile care was found in all areas, either as social care (such as social counselling), or health care (such as community mental health centres), or both. The highest rates for non-acute non-mobile care were found in the Far West LHD (109.36 per 100,000 in total) and the lowest in the Wheatbelt (4.72 per 100,000 in total). Non-acute mobile teams were also spread across all regions either in the form of social care (such as the Personal Helpers and Mentors Programme), or health care (such as assertive community treatment), or both. Highest availability was in Kimberley (62.15 per 100,000 in total), while Great Southern had the lowest rate (12.68 per 100,000 in total).
Other types of care
Four areas (South West, Great Southern, Wheatbelt and WNSW LHD) had services that specifically facilitated accessibility to care (2.98, 2.54, 2.36 and 1.93 services per 100,000 respectively). Information for care was only present in the Goldfields and Wheatbelt regions, while self-help and voluntary care was found only in Far West LHD, WNSW LHD and the Midwest.
Service availability and placement capacity in the nine health areas for other age groups
Children and adolescents
All acute inpatient services for children and adolescents in the WNSW PHN were located in WNSW LHD (1.52 per 100,000), as were all other types of day care (1.52 per 100,000) and non-acute mobile outpatient services (1.52 per 100,000). The non-acute non-mobile outpatient services in WNSW were located mostly in the Far West LHD (32.13 per 100,000), with 9.11 per 100,000 in WNSW LHD. In CWA, all acute mobile outpatient teams were in Goldfields (14.56 per 100,000), while all acute non-mobile services were found in the South West (9.50 per 100,000). Non-acute non-mobile services (including both health care and social care services) were spread across all areas, but missing completely in the Wheatbelt. The highest rate for these services was found in the Kimberley (51.95 per 100,000 in total) and the lowest rate in the South West region (7.13 per 100,000 in total). Non-acute mobile teams (including both health care and social care services) were less well spread. Again, the highest availability was found in the Kimberley region (93.51 per 100,000), while WNSW LHD had the lowest number of teams per 100,000 (1.52). This type of service was absent in Goldfields, Great Southern, Pilbara, South West, and the Far West LHD. Finally, it is also remarkable that only one transition to adulthood service, located in the South West region, was identified in this study.
Older adults
For older adults, all acute inpatient facilities in the WNSW PHN were located in WNSW LHD (1.95 services per 100,000). Acute outpatient services were only available in Goldfields (39.26 per 100,000) and South West (10.21 per 100,000). Non-acute mobile services were present in four of the nine areas: Kimberley (234.96 per 100,000), Wheatbelt (21.12 per 100,000), South West (17.01 per 100,000) and Midwest (9.85 per 100,000). Non-acute non-mobile services for older adults were found only in the Great Southern region (14.61 per 100,000) and WNSW LHD (1.95 per 100,000).
Discussion
This study aimed to describe the mental health services available in two diverse rural and remote regions in Australia. The nine smaller sub-regions allowed comparison of a set of Australian rural territories with different demographic, socioeconomic, health and mortality characteristics. The results are based on local evidence and can help policy-makers better understand service use and benchmarking for policy-planning and resource allocation in rural areas.
The availability of care services varied greatly with areas showing a high availability but low diversity of care types. Most services provided outpatient care. The lowest diversity was found in the northern areas of the CWA PHN (Pilbara and Kimberley), while other highly remote areas, such as Far West LHD, Goldfields and Midwest, show a higher diversity of services. This higher diversity was due to the distribution of services across core health care and other care types, that is, between services providing direct clinical treatment with health professionals and services providing other types of care with non-health staff.
The diversity of service types available in both PHNs was slightly higher than in Sør-Trøndelag in Norway, a rural area described using the same method in a previous study comparing eight health districts in Europe. Sør-Trøndelag has a population density of 15.6 inhabitants per km2 and a high diversity of services types (Gutiérrez-Colosía et al., 2019).
Due to the high granularity of the DESDE classification within the main branches, the simple counting of codes does not reflect the actual diversity of care across different care groupings. The analysis of the major groups of care as depicted in Figures 2 and 3 provides a better understanding of the diversity of services in every area. According to the sub-groups in major care groups, the Australian figures were similar to the European ones, although, in this case, the rural area in Norway had a broader spectrum of services than the Australian areas. The low availability of day care in rural areas in Australia in comparison with those described in Europe is noteworthy and has also been found in urban areas in Australia (Fernandez et al., 2017).
Most services in both PHNs were targeted at adults. Overall, the WNSW PHN had a higher availability and diversity of non-acute outpatient services for adults, but hardly any acute outpatient services. In the CWA PHN, substantially fewer non-acute outpatient services were found. Acute inpatient care services were more common in WNSW, which was also the only PHN to provide sub-acute inpatient services and non-acute day care services. When looking at the smaller areas within these PHNs, it became clear that these services were often not spread evenly. Of note was the high number of the various types of outpatient services in the Kimberley and the Far West LHD, and the lack of dedicated residential services in the Pilbara and Wheatbelt regions.
We have identified a low proportion of specialised services for older adults and child and adolescents in the two regions. While 18.8% of the population in the WNSW PHN is 65 years or older, only 1.6% of services was found to target this age group. A similar pattern was observed for child and adolescent services: while 23.8% of the population in the WNSW PHN are in this age group, only 8.6% of services specialises in this area. In CWA, the rate of specialised services targeted at older adults (8.8%) and child and adolescents (18.3%) is more closely related to their proportion in the population (14.5% and 24%, respectively).
Both rural areas display a higher number of services per 100,000 inhabitants than urban areas in Australia (e.g. Western Sydney; Fernandez et al., 2017). The information provided by these regional atlases and their comparison to international benchmarks may eventually contribute to the development of a model of mental health care in rural and remote Australia based on real data.
To achieve this aim, we also need to better understand the relationship between service availability and workforce capacity. Services in urban areas such as Western Sydney might be larger and able to service more people, whereas those in rural areas are likely to be smaller and more spread out in order to service as many people as possible. Data on workforce capacity were consistently collected only in the Far West LHD but not in the other regions. However, data from the Australian Institute of Health and Welfare (2018) show that workforce full-time equivalent (FTE) per 100,000 inhabitants declines significantly with remoteness for psychiatrists (16 in major cities vs 4 in very remote areas), mental health nurses (90.8 vs 31.1) and psychologists (102.6 vs 23.2)
Rates for acute psychiatric hospital beds were similar in urban Western Sydney and the CWA PHN, but substantially higher in WNSW. The WNSW PHN had almost four times as many non-acute psychiatric hospital beds as Western Sydney, although CWA had no availability of this type of care. The fact that the rural areas had similar or substantially higher bed availability may suggest that people delay seeking help in some of these areas due to other factors such as long travel time to services and less opportunity to get away from their property due to work commitments (for farmers in particular).
Inequity of access to mental health care in rural areas in comparison with urban areas in Australia (Community Affairs References Committee, 2018) is not brought to light through lower availability and placement capacity rates in the areas explored in this study and may require further analysis. The study of health inequities between rural and urban areas in Australia should be addressed not only on the basis of service provision but also on that of service accessibility, which is poorer in rural areas due to long distances and travel times, the cost of which are borne by consumers. Decision-makers should also pay attention to effective geographical location of services and to the development of flexible, equipped, mobile and at a distance services. The atlases produced by our group incorporate the geo-location of mental health services. This information allows a time and geographical accessibility analysis as shown in the Atlas of the Far West NSW region (Salvador-Carulla et al., 2016).
The main strength of the approach used to map available services lies in the use of an internationally validated classification system that uses a bottom-up approach, thus producing results based on local evidence. However, the DESDE-LTC also has a number of limitations. First, the local atlases did not include services where the primary presentation is not for a mental health issue, such as domestic and family violence services, sexual assault services and trauma services, community pharmacies, intellectual disability services or homelessness services. Similarly, generalist services, including general practitioners, and other MBS eligible practitioners who treat people with mental health conditions, as well as fee-private providers, are excluded from this study and should be mapped in different layers of service provision. In this respect, the atlases of WNSW and CWA have provided an additional analysis of Medicare subsidised mental health interventions, which indicate a relatively low number of these interventions in the study areas (Hopkins et al., 2017a, 2017b). Fully private providers were omitted as their inclusion would misrepresent the universality of access to services, and they should be mapped separately in future projects. This approach was followed in a previous study for Far West LHD (Perkins et al., 2006).
In addition, relevant services may have been missed, despite efforts to be all encompassing. Furthermore, services for alcohol and other drugs (AOD) and for carers were not included in this study although they were mapped in their respective atlases (Hopkins et al., 2017a, 2017b). AOD services deserve a specific analysis because they have special features that differ from mental health care services (such as less hospital-based care).
Conclusion
This study is intended to improve information on the local healthcare ecosystem, defined as a network of interrelated sub-systems such as natural and socioeconomic contexts, providers, organisations, health suppliers, regulations and consumers in a specific region (Serbanati et al., 2011). Comparison across jurisdictions and countries using the same method, terminology and tools (Chung et al., 2018; Gutiérrez-Colosía et al., 2019; Sadeniemi et al., 2018; Salinas-Perez et al., 2018) has favoured the modelling of local efficiency and resource allocation tailored to the particular needs of every area in urban planning (García-Alonso et al., 2019). In future, the extension of comparative research on local patterns of service delivery and resource utilisation in rural areas should facilitate the development of specific models of rural mental health care, replace the traditional ‘one size fits all’ approach to rural health by tailored local planning and enable a better analysis of factors related to geographical accessibility such as out-of-pocket costs of transportation, equity of access, the impact of distance on help-seeking behaviour, and social adherence and fragmentation.
Supplemental Material
Supplementary_material – Supplemental material for Service availability and capacity in rural mental health in Australia: Analysing gaps using an Integrated Mental Health Atlas
Supplemental material, Supplementary_material for Service availability and capacity in rural mental health in Australia: Analysing gaps using an Integrated Mental Health Atlas by Bregje A van Spijker, Jose A Salinas-Perez, John Mendoza, Tanya Bell, Nasser Bagheri, Mary Anne Furst, Julia Reynolds, Daniel Rock, Andrew Harvey, Alan Rosen and Luis Salvador-Carulla in Australian & New Zealand Journal of Psychiatry
Footnotes
Acknowledgements
The authors thank Western Australia Primary Health Alliance (WAPHA), the Government of Western Australia Mental Health Commission (MHC of WA) and Western New South Wales Primary Health Network (WNSW PHN) for the support in the development of the Integrated Mental Health Atlas in both jurisdictions. The authors especially thank Learne Durrington, Linda Richardson and Frances Casella at WAPHA; Elaine Paterson and David Axworthy (MHC of WA); David Naughton (WA Country Health Service) and the project reference group; and Janine Dennis and Jim Herbert (WNSW PHN), Susan Daly (Far West LHD) and Jason Crisp (WNSW LHD) and the project reference group.
Declaration of Conflicting Interests
The author(s) declared no potential conflicts of interest with respect to the research, authorship and/or publication of this article.
Funding
The author(s) disclosed receipt of the following financial support for the research, authorship and/or publication of this article: This study used data from the research projects developed by ConNetica Consulting Pty Ltd and the Mental Health Policy Unit of the Brain and Mind Centre (University of Sydney) titled ‘The Integrated Mental Health Atlas of Western NSW’ funded by the Western NSW Primary Health Network and the ‘Integrated Atlas of Mental Health and Alcohol and Other Drugs of Western Australia’ funded by the Western Australia Primary Health Alliance (WAPHA) and the Western Australia Mental Health Commission (WAMHC). The WNSW PHN project was approved by the Greater Western Human Research Ethics Committee (Project No. LNR/17/GWAHS/19; GWAHS 2017-018) and the Western NSW and Far West Local Health District Ethics Committee (Project No. LNR/14/POOL/467). The CWA PHN project was approved by the North Metropolitan Health Service Mental Health – Human Research Ethics Committee (HREC; Project No. 16/11) as part of a larger mapping exercise and subsequently approved through reciprocal recognition by Western Australia Country Health Service HREC.
Supplemental material
Supplemental material for this article is available online.
References
Supplementary Material
Please find the following supplemental material available below.
For Open Access articles published under a Creative Commons License, all supplemental material carries the same license as the article it is associated with.
For non-Open Access articles published, all supplemental material carries a non-exclusive license, and permission requests for re-use of supplemental material or any part of supplemental material shall be sent directly to the copyright owner as specified in the copyright notice associated with the article.