
Abstract
Objective:
Individuals with psychotic symptoms may actually correspond to various subgroups, characterized by different patterns of psychotic symptoms as well as specific sociodemographic and clinical correlates. We aimed to identify groups of individuals from the general population with specific patterns of psychotic symptoms.
Methods:
In a 38,694-subject survey, a latent class analysis was performed to identify subgroups based on the distribution of seven psychotic symptoms taken from the Mini International Neuropsychiatric Interview. The different classes were subsequently compared according to sociodemographic and clinical correlates.
Results:
The best fit was obtained with a four-class solution, including the following: (1) a class with a low prevalence of all psychotic symptoms (‘LOW’, 85.9%); (2) a class with a high prevalence of all psychotic symptoms (‘HAL + DEL’, 1.7%); and classes with a high prevalence of (3) hallucinations (‘HAL’, 4.5%) or (4) delusions (‘DEL’, 7.9%). The HAL + DEL class displayed higher rates of history of trauma, social deprivation and migrant status, while the HAL and DEL classes displayed intermediate rates between HAL + DEL and LOW. HAL + DEL displayed the highest rates of psychotic and non-psychotic disorders and the use of mental health treatment, while HAL and DEL displayed intermediate rates of these disorders between HAL + DEL and LOW. In comparison to the HAL class, psychotic and substance use disorders were more frequent in the DEL class, while anxiety and mood disorders were less frequent.
Conclusion:
These findings support the hypothesis of a continuum model relating the level of psychotic symptoms to the level of global psychopathology.
Introduction
While there has been no universal consensus on the concept of ‘psychosis’ (Potuzak et al., 2012; Waters et al., 2017), psychotic symptoms often refer to phenomena such as delusions and hallucinations (van Os and Reininghaus, 2016). In recent years, it has become increasingly evident that psychotic symptoms are common in the general population (i.e. their prevalence is approximately 7%) (Linscott and van Os, 2013; van Os et al., 2000). Psychotic symptoms are transitory in 80% of individuals, with 20% developing persistent psychotic experiences and an annual rate of transition to psychotic disorders below 1% (Kaymaz et al., 2012; Linscott and van Os, 2013; Zammit et al., 2013). Psychotic symptoms have also recently been presented as a transdiagnostic phenomenon, as the majority of individuals experiencing these symptoms have at least one diagnosed non-psychotic disorder (van Os and Reininghaus, 2016), such as anxiety disorders (Schutters et al., 2012), mood disorders (Saha et al., 2012; van Os et al., 2000), substance use disorders (SUDs) (Linscott and van Os, 2013) or suicide attempts (Kelleher et al., 2017).
These different data led to the notion that psychosis may exist on a continuum with normal experience (Ahmed et al., 2012). According to van Os (2014), the notion of a psychosis continuum can be understood in different ways. First, the prevalence of psychotic symptoms or the level of schizotypy in the general population can be viewed as a surrogate of the prevalence of psychotic disorders (Szöke et al., 2014b). Indeed, several studies have shown that the level of psychiatric symptoms in the community was associated with changes over time in the prevalence of psychiatric disorders (Whittington and Huppert, 1996), especially for psychosis outcomes (Szöke et al., 2014b; van Os et al., 2009). Second, the duration of psychotic symptoms is associated with the risk for psychotic disorders: the longer these symptoms last, the higher the risk of psychotic disorders (Kaymaz et al., 2012; Wigman et al., 2013). Third, psychotic symptoms and psychotic disorders shared the same demographic characteristics and risk factors (Linscott and van Os, 2013; Pignon et al., 2017b), and population-based epidemiological studies have shown that risk factors for schizophrenia (e.g. cannabis consumption) are associated with increases in the measures of the extended phenotype (Szöke et al., 2014a). Fourth, the level of expression of psychotic symptoms, in terms of number, severity and frequency, predicts the need for care (even for non-psychotic disorders), i.e., the view of psychotic symptoms as an ‘index of psychopathological severity’ (DeVylder et al., 2014; Kaymaz et al., 2012; McGorry and Nelson, 2016).
Recently, the results of several studies have confirmed that the clinical value of psychotic symptoms can vary according to the type of symptom (Calkins et al., 2017; Nuevo et al., 2013; Schultze-Lutter, 2009). More specifically, each psychotic symptom—or pattern of psychotic symptoms—appears to have different clinical correlates (Nuevo et al., 2013; van Os et al., 2000). For instance, somatic delusions are associated with mood and anxiety disorders, whereas delusions of reference are associated with SUDs (Vega et al., 2006). Among adolescents, auditory and visual hallucinations are associated with further suicide attempts (Cederlöf et al., 2016). In addition, each symptom or pattern of symptoms may have a different level of persistence in longitudinal studies (Calkins et al., 2017; DeVylder et al., 2015). Furthermore, several studies have shown that the number of psychotic symptoms is associated with the level of persistence of psychotic symptoms (the higher the number of psychotic symptoms, the greater the persistence) or with different sociodemographic and clinical correlates (McGrath et al., 2016; Nuevo et al., 2012). For all these reasons, individuals with psychotic symptoms may actually correspond to various subgroups, characterized by different patterns of psychotic symptoms and specific sociodemographic and clinical correlates.
Latent class analysis (LCA) can help characterize patterns of psychotic symptoms in the general population by identifying similar subgroups within multivariate data from heterogeneous populations. In other words, LCA could allow differentiation among latent classes of subjects that probabilistically share a common set of specific psychotic symptoms (Gale et al., 2011). Several previous LCA studies have provided interesting and varied findings in different countries. In an American study of 5893 subjects, Shevlin et al. (2007) found a four-class solution, which they named ‘Normative’ (i.e. almost without psychotic symptoms), ‘Psychosis’ (with a high prevalence rate of all psychotic symptoms), ‘Hallucinatory’ and ‘Intermediate’. The ‘Hallucinatory’ and ‘Intermediate’ classes did not differ in their level of prevalence of psychotic symptoms but did differ in the patterns of psychotic symptoms, i.e., a high prevalence rate of hallucinatory symptoms and a lower rate of delusional symptoms in the ‘Hallucinatory’ class, and the reverse in the ‘Intermediate’ class. In comparison to the ‘Normative’ class, the other classes were more likely to display mood or anxiety disorders or SUDs or to report a history of trauma. In a sample of 7435 subjects in New Zealand, Gale et al. (2011) found a three-class solution, without the ‘Intermediate’ class (i.e. the class that displayed a high prevalence rate of delusional symptoms in the Shevlin et al. study). In addition to several psychiatric disorders (anxiety, mood and SUDs), the use of mental health services was found to be higher in the ‘Hallucinatory’ and ‘Psychosis’ classes. A LCA study among 1271 subjects in Kenya found a similar three-class solution (Mamah et al., 2013). Notably, the differences between classes with psychotic symptoms (i.e. other than the ‘Normative’ class) were not described in these studies, and it is plausible that some classes had specific sociodemographic and/or clinical correlates. Moreover, the migrant status of the different classes has not been studied. Finally, replication studies in different countries with varied cultural backgrounds, e.g., in European countries, could be interesting (Morgan et al., 2009).
In this study, we used LCA on a large sample of 38,694 subjects from the French general population to identify several groups of individuals with specific patterns of psychotic symptoms. After identifying subgroups by LCA, we aimed to characterize and compare them according to their sociodemographic and clinical characteristics, including the use of mental health treatment. Crucially, migrant status (first, second or third generation), gender, income, education and marital status were included as sociodemographic variables. History of trauma was also studied. The retained clinical categories were psychotic, bipolar, depressive, dysthymia, alcohol use, substance use, generalized anxiety, social anxiety and panic disorders.
Methods
The Mental Health in General Population survey
The cross-sectional Mental Health in General Population (MHGP) survey conducted by the World Health Organization French Collaborating Center (WHO-CC) interviewed 38,694 subjects in France between 1999 and 2003. Participants were selected from 47 sites (900 subjects per site) using a quota-sampling method (Lunsford and Lunsford, 1995). This method provides a sample of subjects with a sociodemographic profile similar to that of the general population profile with regard to age, sex, educational level and occupational category, according to census figures from 1999 provided by the French National Institute for Statistics and Economic Studies (INSEE). Subjects were included in the study if they met the following criteria: (1) provided informed consent to participate in the survey, (2) spoke French, (3) were aged 18 years or older and (4) were neither institutionalized nor homeless (Caria et al., 2010). Legal authorization (number 98.126) was obtained by the ‘Commission Nationale Informatique et Liberté’ (CNIL) and the ‘Comité consultatif sur le traitement de l’information en matière de recherche’ (CCTIRS).
The Mini International Neuropsychiatric Interview (MINI, French version 5.0.0), a standardized psychiatric interview, was used to screen for 10th International Classification of Diseases (ICD-10)-defined psychiatric disorders in the general population. The MINI has been validated in the general population. Compared with the Composite International Diagnostic Interview (CIDI), the MINI has good to very good kappa values (Lecrubier et al., 1997). All of the MHGP interviewers (nurses and psychologists) were trained to administer the MINI using video recordings of interviews over a 3-day session provided by WHO-CC experts.
Sociodemographic characteristics
Sociodemographic data were gathered for each subject. Age was categorized into four bands (18–29 years, 30–44 years, 45–59 years, over 60 years). Income was categorized as low (<1650€/household monthly), medium (1650–3200€) and high (>3200€). We defined a first-generation migrant (1GM) as a subject born outside of metropolitan France, a second-generation migrant (2GM) as a subject with at least one parent born outside of metropolitan France and a third-generation migrant (3GM) as a subject with at least one grandparent born outside of metropolitan France. Migrant generations were exclusive from each other (e.g. a subject born outside of metropolitan France, even with parents or grandparents also born outside, was considered a first-generation migrant) (Amad et al., 2013; Pignon et al., 2017a, 2017b; Rolland et al., 2017). History of trauma was assessed with the posttraumatic stress disorder (PTSD) section of the MINI, i.e., the following question: ‘Have you ever experienced or witnessed or had to address an extremely traumatic event that included actual or threatened death or serious injury to you or someone else?’ (Examples of traumatic events were then cited, including serious accidents, physical assault and a terrorist attack).
Psychotic symptoms and disorders
The MINI includes the following: (1) five items that assess the lifetime occurrence of delusional symptoms: delusions of persecution, thought broadcasting, delusions of control, delusions of reference and other delusional ideas (e.g. somatic delusions or delusions of grandiosity) and (2) two items that assess the lifetime occurrence of visual and auditory hallucinations. Characterized psychotic disorders were confirmed by a senior psychiatrist who was familiar with transcultural psychiatry (Amad et al., 2013).
Non-psychotic disorders
The following psychiatric disorders were also assessed using the MINI: bipolar I disorder (BD, F30 and F31), depressive disorders (current and recurrent, F32 and F33), current dysthymia (F34.1), alcohol use disorders (AUDs, i.e., dependence [F10.1] and abuse [F10.2]), SUDs (i.e. substance abuse [F1(x).1] and substance dependence [F2(x).2]), and anxiety disorders, i.e., panic disorder with or without agoraphobia (F41.0 and F40.01), social anxiety disorder (SAD, F40.1) and generalized anxiety disorder (GAD, F41.1). For additional details regarding these diagnoses, see specific publications based on the MHGP data (Leray et al., 2011; Pignon et al., 2017a; Rolland et al., 2017; Tebeka et al., 2018).
Use of mental health treatment
Lifetime use of mental health treatment (LUT) was assessed with the following questions: (1) ‘Have you ever attended a consultation with a psychiatrist or a psychologist?’ (2) ‘Have you ever been prescribed a psychotropic drug, that is, a drug for a psychiatric disorder or a drug for “nerves”?’ and (3) ‘Have you ever been hospitalized in a psychiatric or mental health setting?’. LUT was defined by a positive answer to any of these three questions, as previously detailed elsewhere.
Statistical analyses
LCA was used to empirically derive groups of psychotic symptoms based on the seven psychotic symptoms. All analyses were performed in Mplus version 6.1 (Muthén and Muthén, 2007). Mplus estimates latent class models using full information maximum likelihood estimation. All participants in the MHGP survey with complete data on psychotic symptoms were classified into different latent classes based on the probability of their responses to the seven psychotic symptoms (only 10 subjects with missing data, i.e., 38,694 analyzed subjects). To determine the model with the optimal number of classes, we successively examined models comprising 1 to 6 classes. Fit indices and theory were used to identify the best-fitting and most parsimonious model. The fit indices that we used included Akaike’s information criterion (AIC), the Bayesian information criterion (BIC) and the sample-size-adjusted BIC (ABIC) (Garrett and Zeger, 2000). Entropy was also used as an index of the orderliness of the classifications. The Vuong-Lo-Mendell-Rubin likelihood ratio test (LRT) and the Lo-Mendell-Rubin adjusted likelihood ratio test (aLRT) were used to identify whether the fit of a model with K classes was better than the fit of a model with K – 1 classes (Muthén and Muthén, 2007). As in precedent LCA studies (Gale et al., 2011; Mamah et al., 2013; Shevlin et al., 2007), when comparisons were performed across clinical outcomes, participants were assigned to their most likely class.
Data were presented as percentages. Logistic regression analyses were performed to compare the sociodemographic and clinical characteristics between groups using the SAS software package, version 9.4. Statistical significance was evaluated using a two-sided alpha set a priori at 0.05.
Results
Identification of latent classes based on psychotic symptoms
We first examined the LCA fit statistics (given in Supplementary Table 1). The four-class model was retained because it exhibited the following: (1) significantly better fit indices than the three-class model (the LRT and the aLRT comparing the four- and the three-class models in fit indices were significant, with p < 0.001 for each); (2) a better entropy score (0.804 vs 0.756) than the five-class model, which may be related to the fact that individuals in one of the classes of the five-class model had a 100% probability of manifesting one of the symptom, i.e., visual hallucinations; and (3) good clinical interpretability.
The four-class model included Class 1, with low prevalence of both delusions and hallucinations (named ‘Low prevalence of psychotic symptoms’ or ‘LOW’, N = 33,381, 85.9%); Class 2, with only hallucinations (named ‘Intermediate/Hallucinations’ or ‘HAL’, N = 1652, 4.5%); Class 3, with only delusions (named ‘Intermediate/Delusions’ or ‘DEL’, N = 3005, 7.9%); and Class 4, with high prevalence of both hallucinations and delusions (named ‘Hallucinations and delusions’ or ‘HAL + DEL’, N = 646, 1.7%) (Figure 1). The prevalence rates of the different psychotic symptoms in the different classes and according to the psychiatric disorders are available in Supplementary Tables 2 and 3.
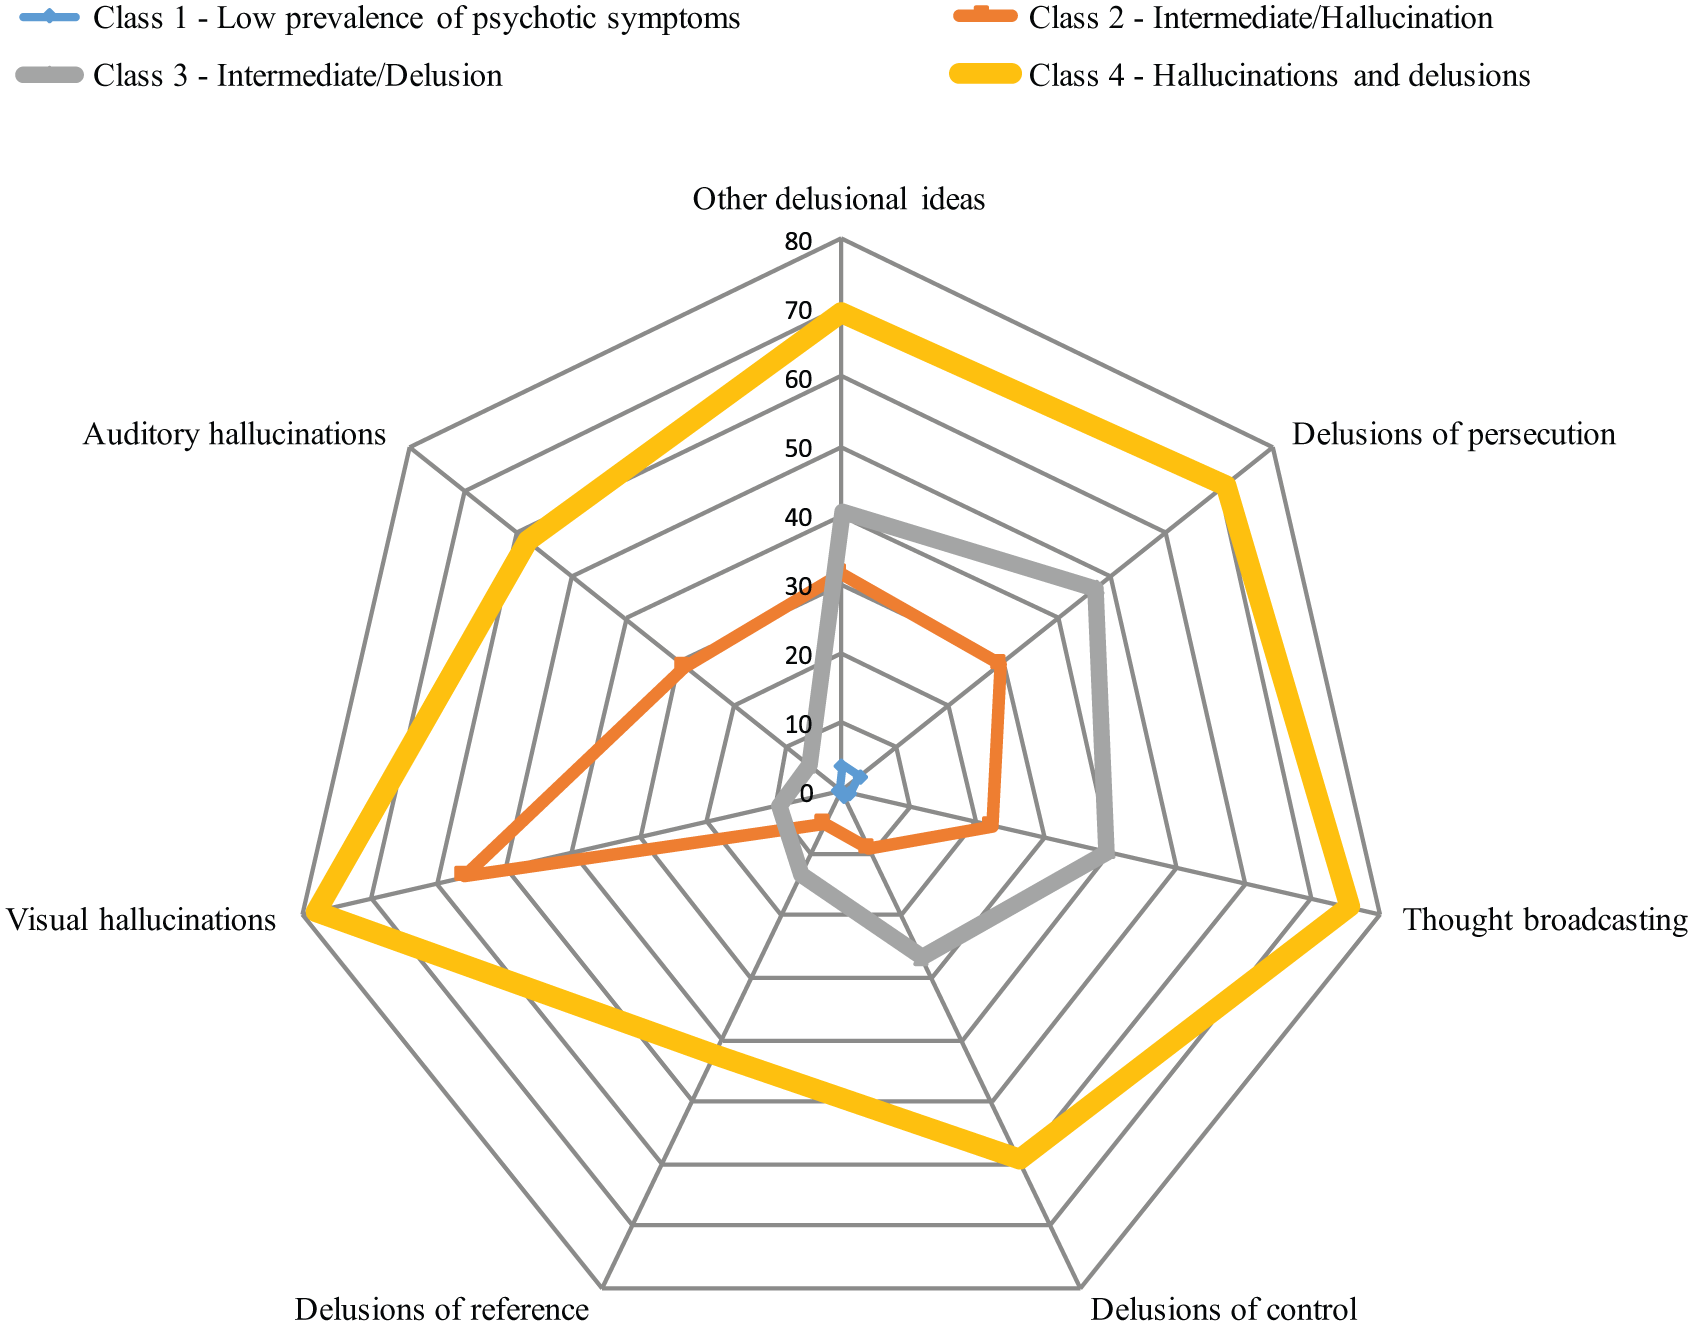
Latent class analysis of psychotic symptoms: prevalence rates of each symptom in each class (%).
Sociodemographic characteristics across latent classes
The sociodemographic and clinical characteristics of the different classes are available in Table 1, and multivariate comparisons between the different latent classes are available in Table 2. There was no significant difference in sex ratio among the four subgroups. Concerning migrant status, 1GM, 2GM and 3GM were significantly more frequent in the HAL + DEL class than in the other classes and more frequent in HAL and DEL than in LOW.
Sociodemographic and clinical characteristics of the different classes (%).
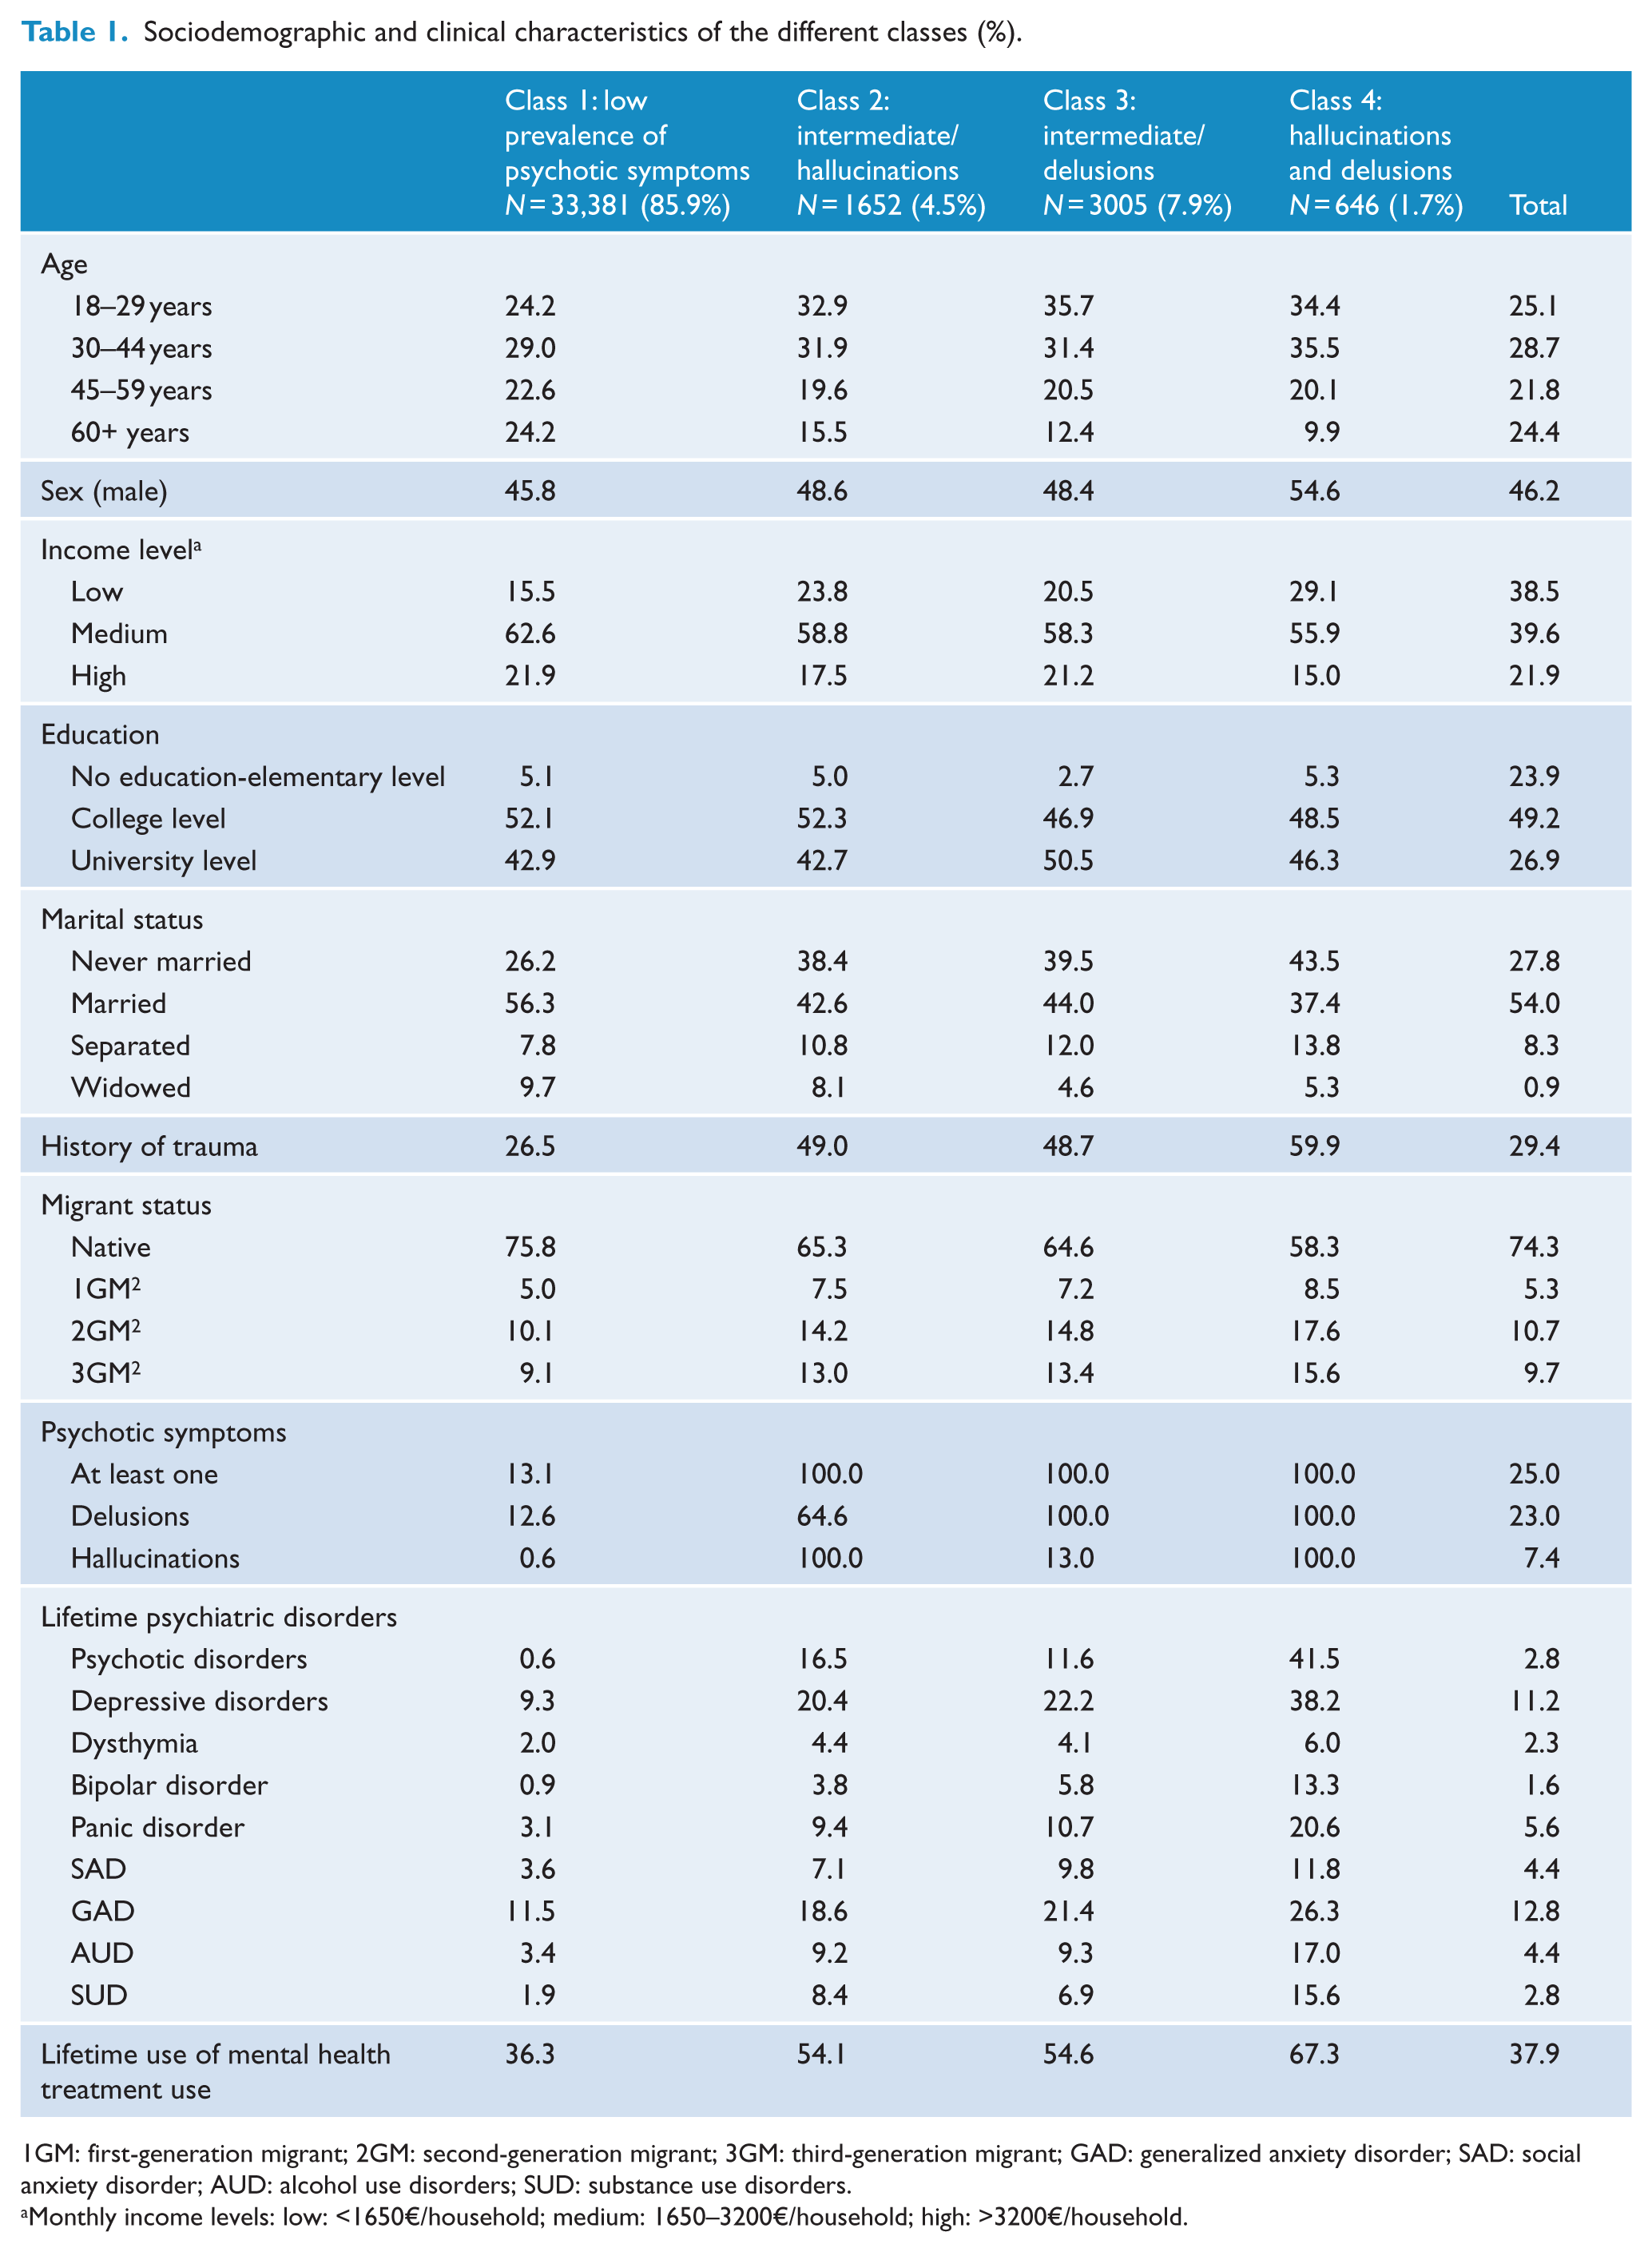
1GM: first-generation migrant; 2GM: second-generation migrant; 3GM: third-generation migrant; GAD: generalized anxiety disorder; SAD: social anxiety disorder; AUD: alcohol use disorders; SUD: substance use disorders.
Monthly income levels: low: <1650€/household; medium: 1650–3200€/household; high: >3200€/household.
Comparisons of classes according to sociodemographic and clinical characteristics.
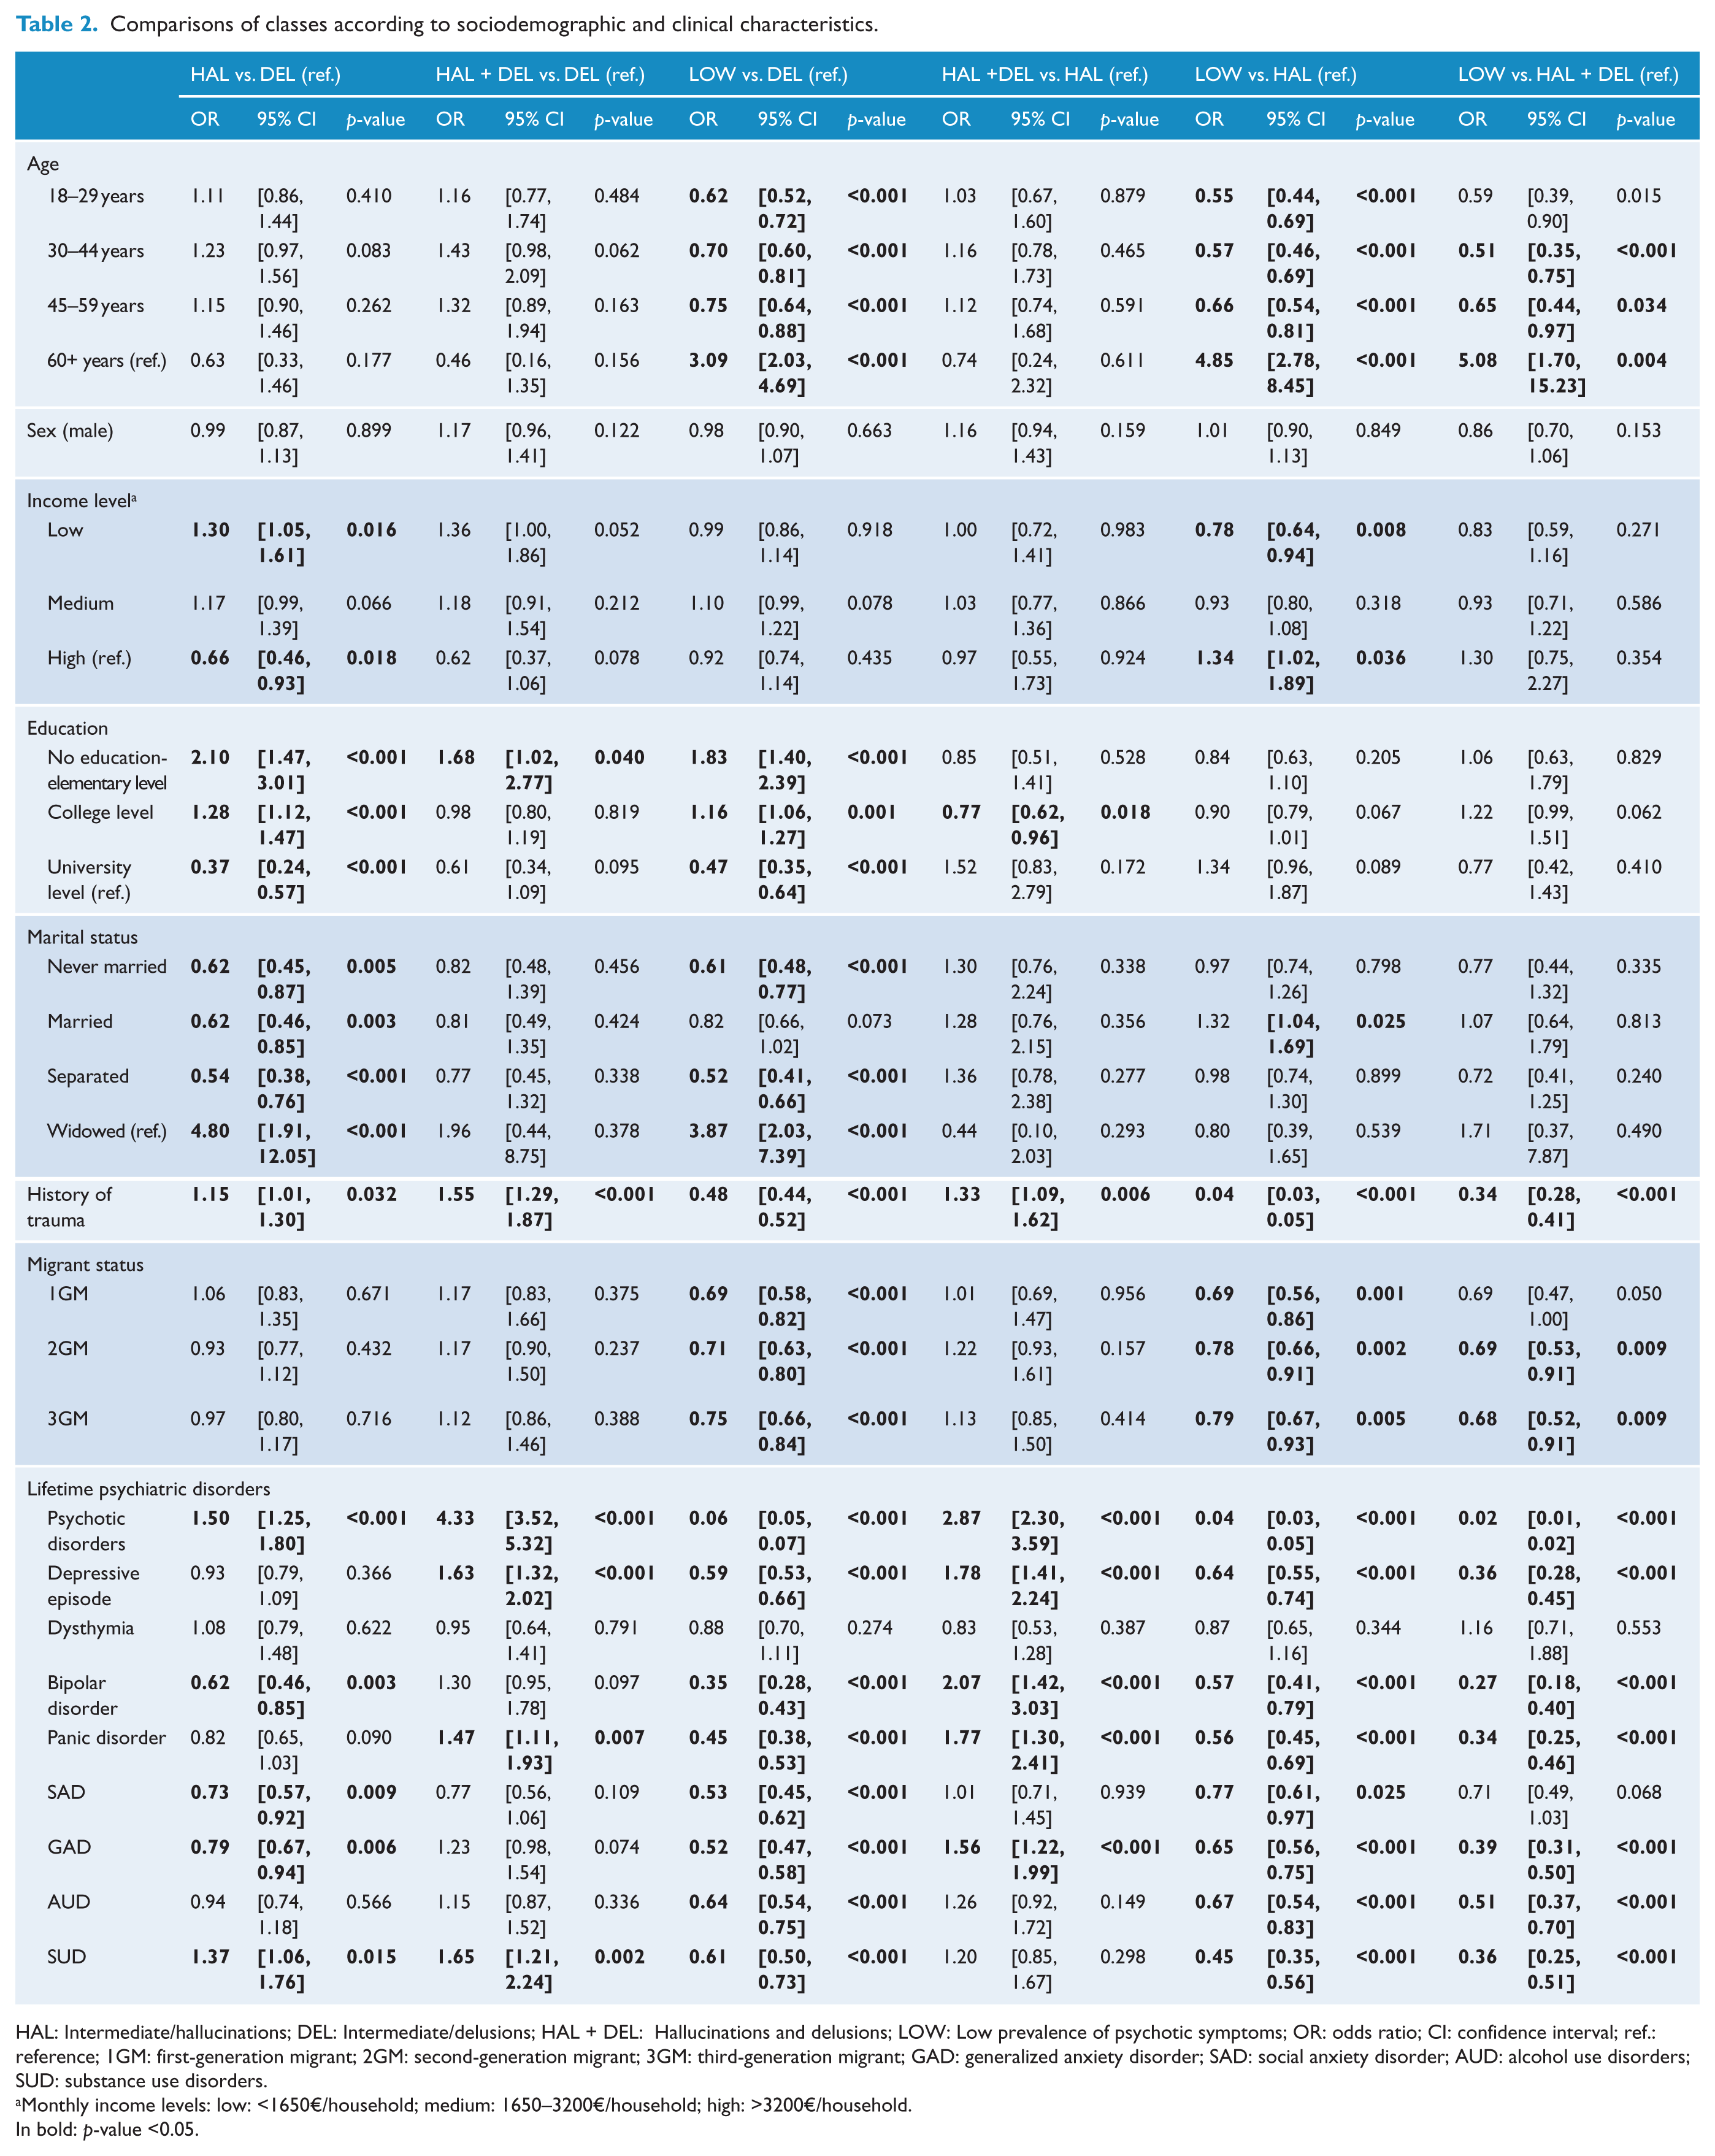
HAL: Intermediate/hallucinations; DEL: Intermediate/delusions; HAL + DEL: Hallucinations and delusions; LOW: Low prevalence of psychotic symptoms; OR: odds ratio; CI: confidence interval; ref.: reference; 1GM: first-generation migrant; 2GM: second-generation migrant; 3GM: third-generation migrant; GAD: generalized anxiety disorder; SAD: social anxiety disorder; AUD: alcohol use disorders; SUD: substance use disorders.
Monthly income levels: low: <1650€/household; medium: 1650–3200€/household; high: >3200€/household.
In bold: p-value <0.05.
Clinical characteristics
The prevalence rates (i.e. actual proportions) of psychiatric disorders in the different classes are represented in Figure 2. Here, we report the statistically significant differences.
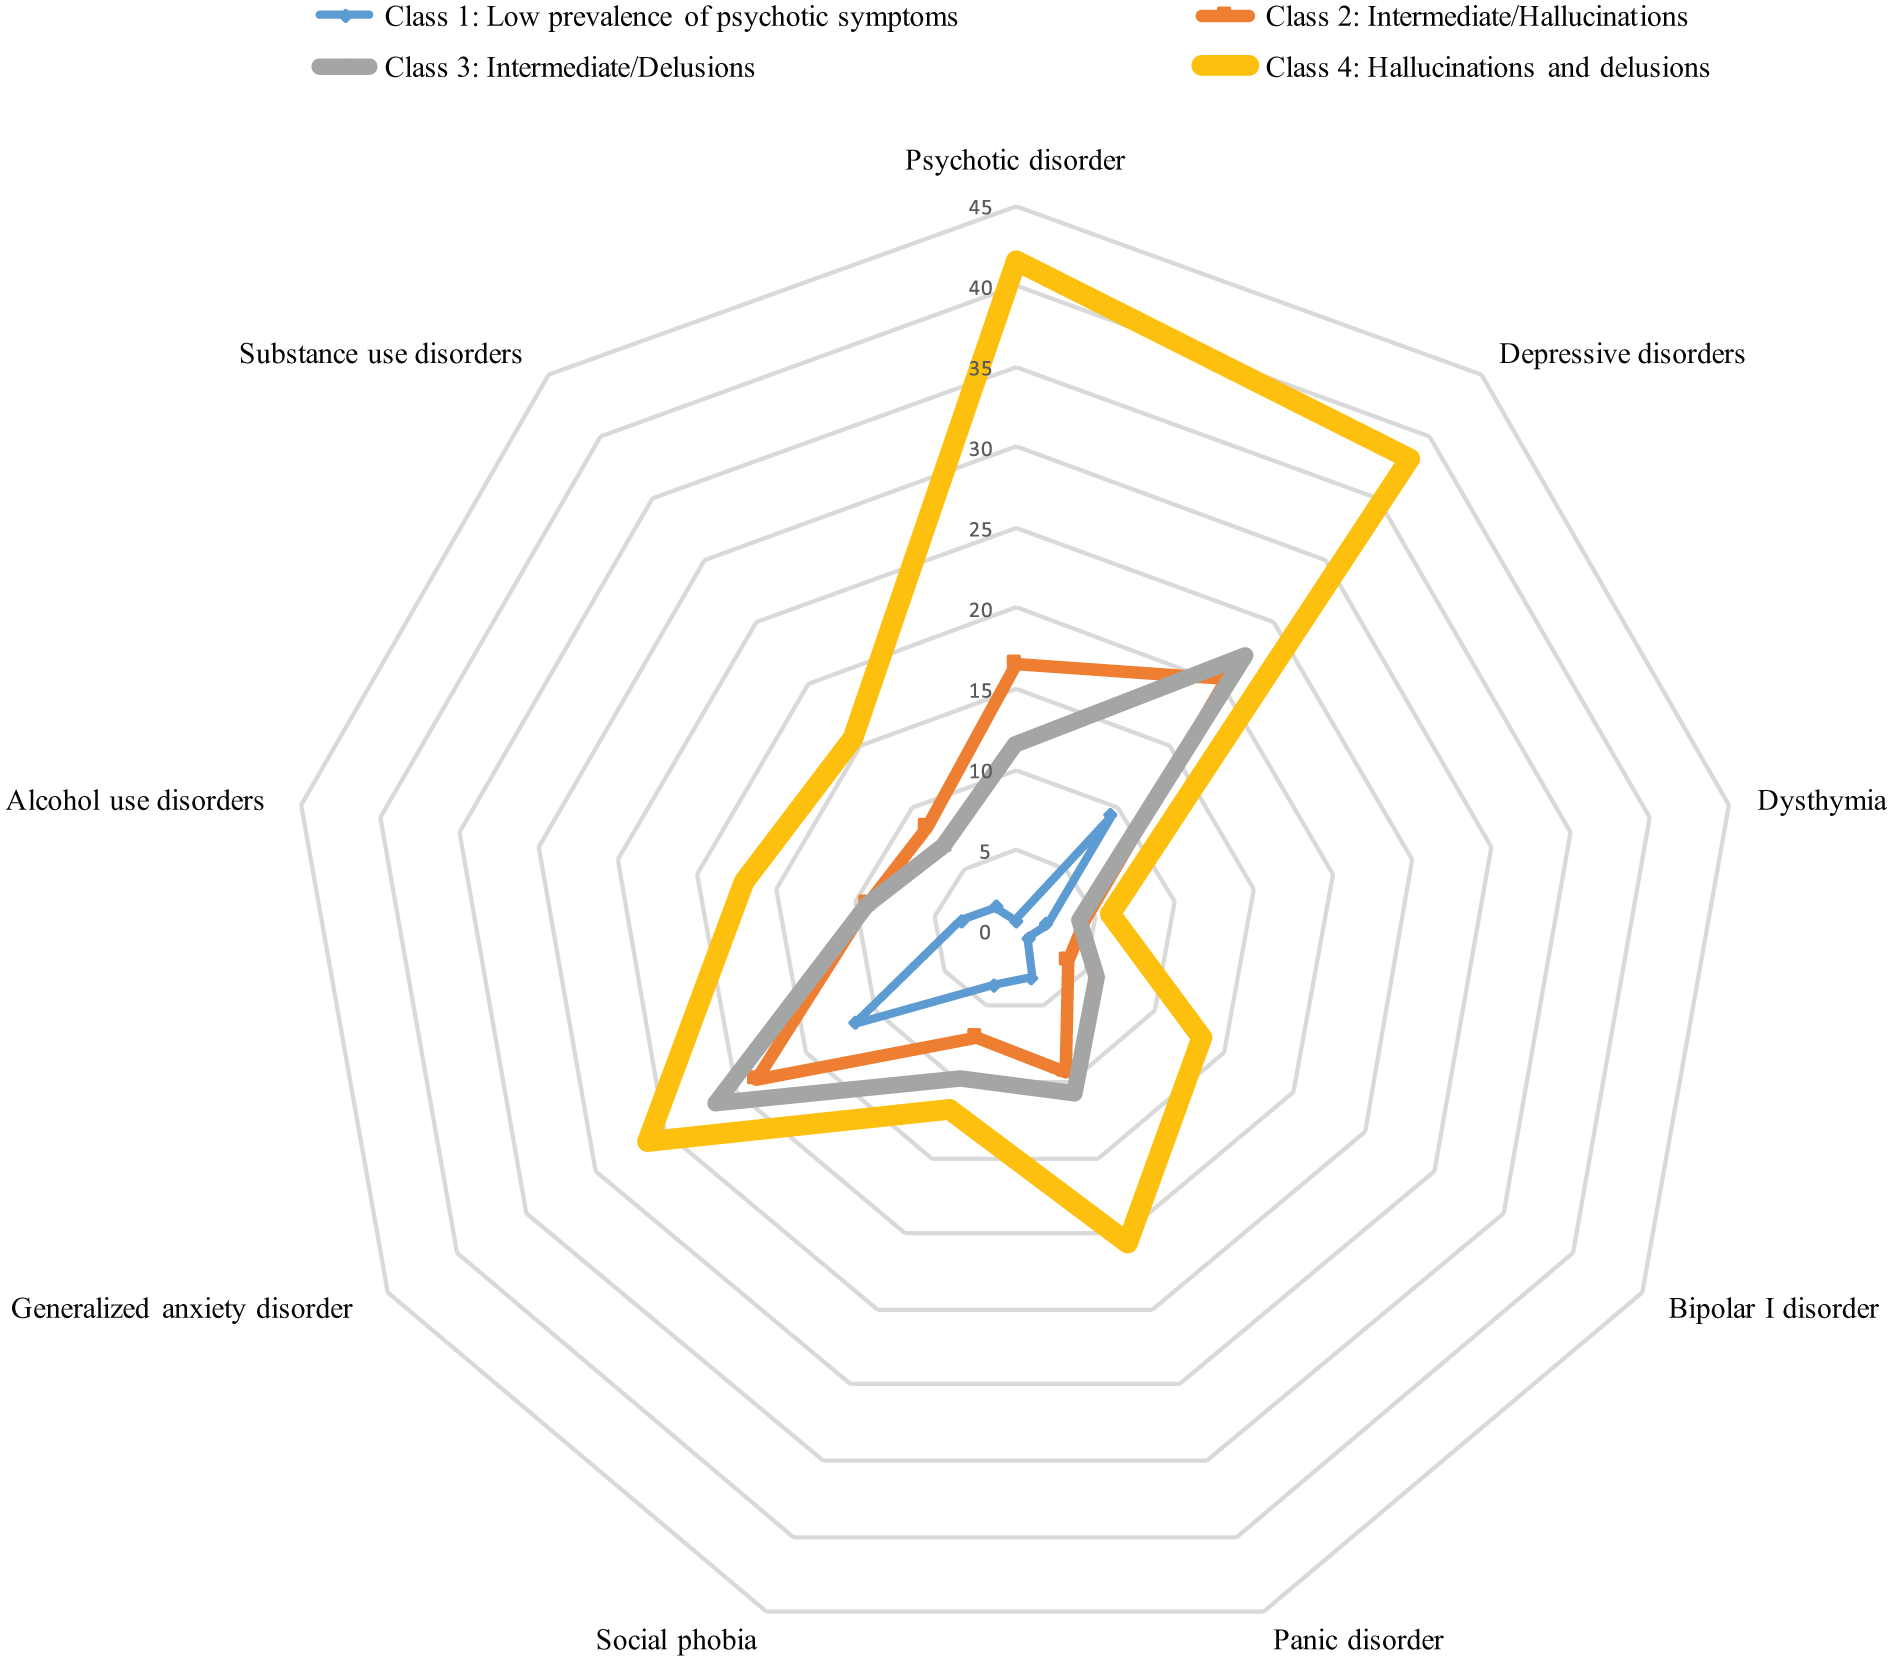
Latent class analysis of psychotic symptoms: prevalence rates of the psychiatric disorders in each class (%).
The rate of subjects with a history of trauma was higher in HAL + DEL class (59.9%) than in other classes; it was also higher in HAL (49.0%) and DEL (48.7%) than in LOW (26.5%).
Psychotic disorders were more common in the HAL + DEL class (41.5%) than in the other classes, more common in HAL (16.5%) and DEL (11.6%) than in LOW (0.6%), and more common in HAL than in DEL.
The prevalence rates of depressive disorders and BD were higher in the HAL + DEL class (38.2% and 13.3%) than in the other classes, and higher in HAL (20.4% and 3.8%) and DEL (22.2% and 5.8%) than in LOW (0.9% and 9.3%).
Concerning anxiety disorders, panic disorder was more common in the HAL + DEL class (20.6%) than in the other classes, and it was more common in HAL (9.4%) and DEL (10.7%) than in LOW (3.1%). SAD was more frequent in DEL (9.8%) than in LOW (3.6%) or HAL (7.1%), and it was more frequent in HAL than in LOW. Finally, GAD was more common in HAL + DEL class (26.3%) than in HAL (18.6%) or LOW (11.5%), and it was more common in DEL (21.4%) than in LOW or HAL.
Regarding addictive disorders, the prevalence rate of AUDs was higher in HAL + DEL (26.3%) than in LOW (11.5%), and it was higher in HAL (18.6%) and DEL (21.4%) than in LOW. SUDs were more common in HAL + DEL class (15.6%) than in DEL (6.9%) or LOW (1.9%), and they were more common in HAL (8.4%) than in LOW or DEL.
Overall, 72.0% of subjects in the HAL + DEL class displayed at least one psychiatric disorder, which was higher than the prevalence in any other class. The rate of subjects with at least one psychiatric disorder was higher in the DEL class (53.4%) than in the HAL class (49.8%) or the LOW class (26.8%). Finally, this rate was higher in HAL than in LOW.
LUT
The prevalence rates of LUT in the different classes are available in Table 1, and multivariate comparisons between the different latent classes are available in Table 3. LUT was significantly more frequent in HAL + DEL class (67.3%) than in the other classes and more frequent in HAL (54.1%) and DEL (54.6%) than in LOW (36.3%).
Comparisons of classes according to lifetime use of mental health treatment.
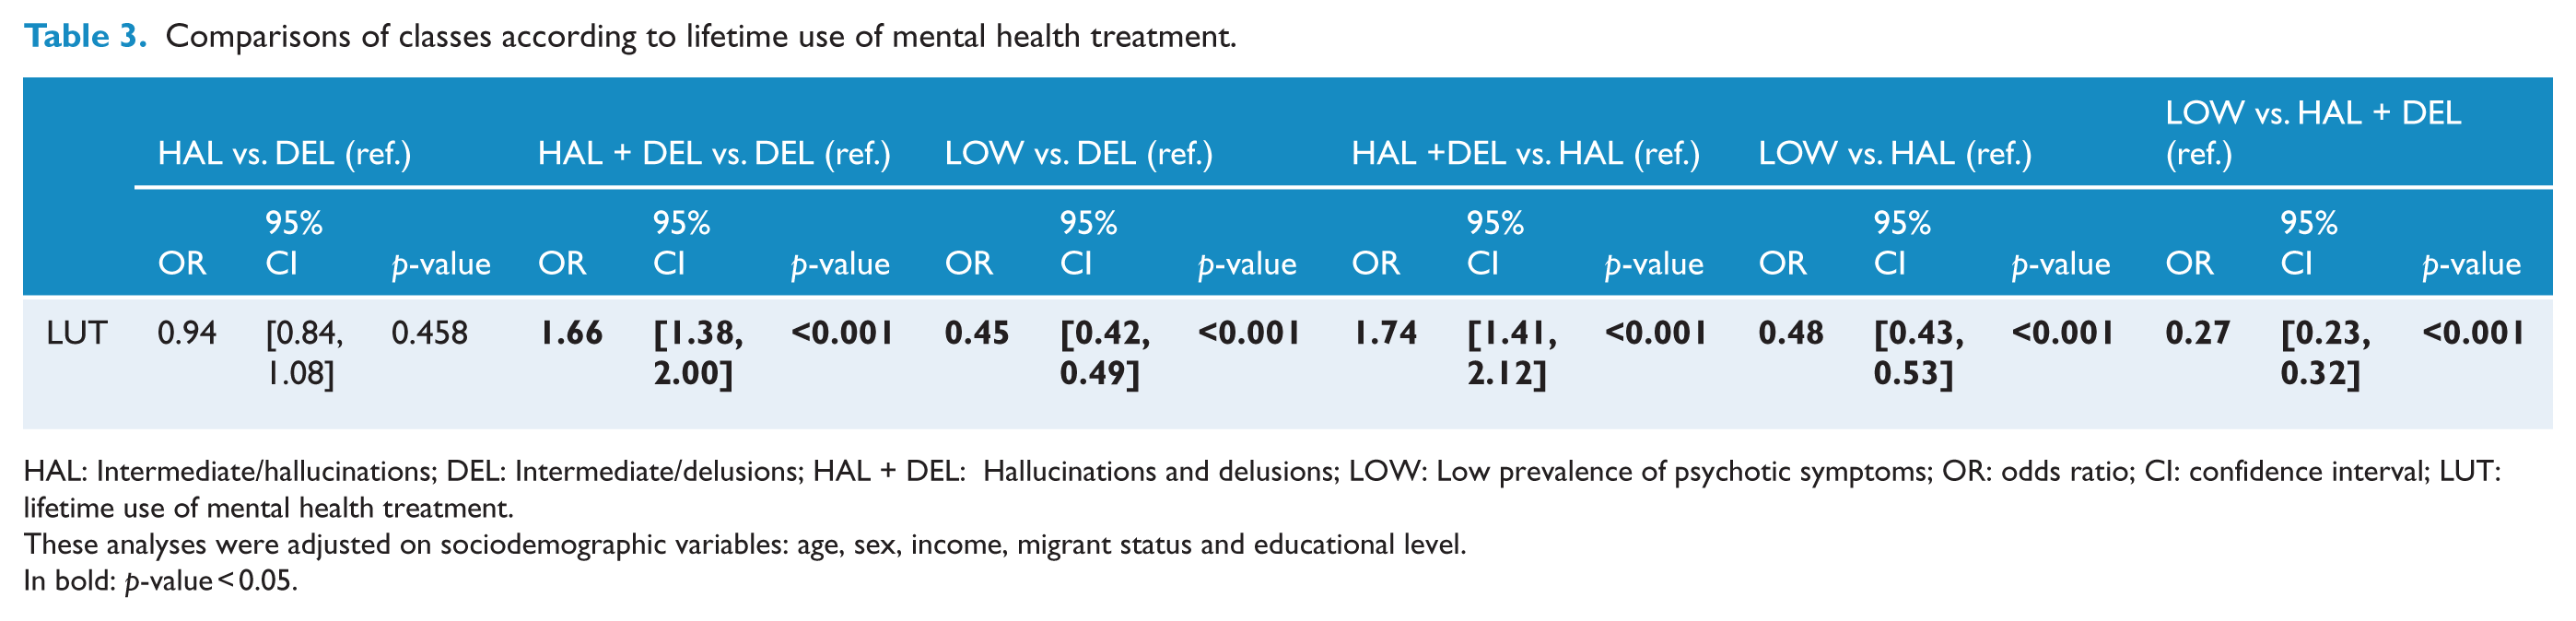
HAL: Intermediate/hallucinations; DEL: Intermediate/delusions; HAL + DEL: Hallucinations and delusions; LOW: Low prevalence of psychotic symptoms; OR: odds ratio; CI: confidence interval; LUT: lifetime use of mental health treatment.
These analyses were adjusted on sociodemographic variables: age, sex, income, migrant status and educational level.
In bold: p-value < 0.05.
Discussion
In a large cross-sectional survey of 38,694 subjects from the French general population, a LCA allowed us to identify four classes of subjects according to their psychotic profiles: two classes of subjects who manifested most of the psychotic symptoms but with different prevalence rates (LOW, which represented 85.9% of the population, and HAL + DEL, 1.7%), and two other classes of subjects who manifested specific patterns of psychotic symptoms, i.e., hallucinations in one class (HAL, 4.5%), and delusions in the other class (DEL, 7.9%). This study thus replicates and extends, in a different socio-cultural background, the American study by Shevlin et al. (2007) which found a four-class solution. Moreover, the proportions of the classes in the Shevlin et al. study (Normative: 86.4%, Hallucinatory: 6.0%, Intermediate: 5.9% and Psychosis: 1.8%) were similar. Contrary to these studies, studies by Gale et al. (2011) in New Zealand and Mamah et al. (2013) in Kenya found a three-class solution, with no ‘Delusion’ class. Notably, these three previous LCA studies were conducted in smaller samples of the general population. Moreover, this study is the first to examine data on migrant status and to report differences between the different classes of psychotic symptoms. These comparisons revealed that the proportion of migrants (across three generations) was (1) higher in HAL + DEL class than the other classes, including HAL and DEL, and (2) higher in HAL and DEL than in LOW. A similar pattern of associations was found between classes and history of trauma. Moreover, the HAL + DEL class displayed more psychotic and non-psychotic disorders than the other classes, including the other classes with prevalent psychotic symptoms, i.e., HAL and DEL. Finally, subjects in the DEL class suffered more frequently from BD and anxiety disorders than those in HAL, whereas subjects in the HAL class suffered more frequently from psychotic disorders and SUDs.
This study is consistent with the continuum hypothesis, as the level of psychotic symptoms indicates the level of overall psychopathology in the different classes (DeVylder et al., 2014; Kaymaz et al., 2012; Linscott and van Os, 2013; van Os, 2014), analogous to a ‘dose-response’ effect. Indeed, there were proportional relationships between, on one hand, the number of psychotic symptoms and their prevalence rates and, on the other hand, the prevalence rates of comorbid psychiatric disorders. The HAL + DEL class, i.e., the class with high prevalence rates of all psychotic symptoms, showed the highest rates of psychotic and non-psychotic disorders, while DEL and HAL, i.e., the classes with intermediate prevalence rates of specific patterns of psychotic symptoms, showed intermediate rates between the HAL + DEL and LOW classes. These results are consistent with LUT analyses, which showed the highest rate of LUT in HAL + DEL class and higher rates in HAL and DEL than in LOW. Interestingly, consistent with the continuum hypothesis, these classes, and particularly the most ‘severe’ class, i.e., HAL + DEL, were much less frequent than the LOW (Linscott and van Os, 2013).
Interestingly, the associations with the identified risk factors of psychotic disorders, i.e., history of trauma (Varese et al., 2012), social deprivation (Allardyce et al., 2005; Kirkbride et al., 2014), SUDs (Marconi et al., 2016; Szöke et al., 2014a) and migrant status (Bourque et al., 2011; Cantor-Graae and Selten, 2005), showed the same ‘dose-response’ relationship. They were consistent with the social defeat hypothesis of the etiology of psychotic disorders (Selten et al., 2013). This hypothesis states that a common denominator underlies the different well-established risk factors for psychotic disorders: the repeated negative experiences of being excluded from the majority group. However, as these associations were found in a cross-sectional survey, the temporal sequence between these factors and the occurrence of psychotic symptoms is unknown.
Comparisons between the DEL and HAL classes showed that subjects in the HAL class had lower income and education levels, suggesting lower socioprofessional functioning. Moreover, they had significantly more psychotic disorders and SUDs and fewer mood and anxiety disorders. Furthermore, the high level of depressive disorders in the HAL, DEL and HAL + DEL classes (between 20.4% and 38.2%) is consistent with the high rate of comorbidity between psychotic symptoms and depression (McGrath et al., 2015, 2016). Factor analyses have demonstrated that affective symptoms, and particularly depressive symptoms, constitute an important symptomatic dimension among patients with psychotic disorders (Hutchinson et al., 1999; Potuzak et al., 2012). In subjects with psychotic disorders, these depressive symptoms are associated with negative symptoms (Schennach et al., 2015; Singh et al., 2010). Such differences between the DEL and HAL classes could reflect the fact that, although psychotic symptoms lie on a continuum with psychotic disorders, distinct symptom patterns could reflect specific vulnerabilities to specific non-psychotic symptoms or disorders. Longitudinal studies of such classes could help to identify different psychiatric pathways.
Some limitations of this study should be acknowledged. First, as the sampling was non-probabilistic, we cannot assume that our sample was fully representative of the general population. However, the quota-sampling method yields the same sociodemographic characteristics as the general population (Rolland et al., 2017). Moreover, the exclusion of the homeless and institutionalized is a selection bias, especially given the high level of psychotic symptoms in these population (Boyd et al., 2016). Second, as mentioned before, this study is based on prevalence. This design prevents us from inferring anything about the temporal sequence of the incidence of psychotic symptoms and/or psychiatric disorders (Pignon et al., 2017b). Third, other key factors that may influence psychotic symptoms and psychiatric disorder risks, such as urbanicity (van Os et al., 2001), were not assessed and taken into account. Moreover, concerning specifically analyses on migrants, it has been suggested that misdiagnosis related to misinterpretations of cultural background could lead to an increase in psychotic outcome measures. However, this hypothesis has not been confirmed, and there is strong evidence against misdiagnosis, especially as an explanation for the increased incidence among migrants (Amad et al., 2013; Bhugra, 2004; Selten et al., 2007). Fourth, as noted by Morgan et al. (2014), large-scale surveys involve high levels of refusal and retrospective data collection using basic instruments that can be administered quickly. However, Knudsen et al. (2010) have shown that non-participation, despite threatening the validity of prevalence studies, has a limited impact on association testing. Similar to most of the studies on psychotic symptoms in the general population, this study focused only on a few self-reported positive psychotic symptoms (Linscott and van Os, 2013). Moreover, the items on delusions lack some specificity and could concern both affective and psychotic disorders. However, the aim of this study was to determine several groups of individuals with specific patterns of psychotic symptoms and to discuss their clinical significance, independently of the psychiatric diagnoses. Future studies should consider negative symptoms, for instance, by studying schizotypy, which includes negative symptoms such as social anhedonia, constricted affect or social isolation (Barrantes-Vidal et al., 2015). Moreover, future studies could consider the prospective follow-up of a sample of the general population and identify different trajectories.
In conclusion, in a larger sample and in a different cultural background than the preceding three LCA studies (Gale et al., 2011; Mamah et al., 2013; Shevlin et al., 2007), this new study allowed us to identify four classes: a class with low prevalence rates of psychotic symptoms, a class with high prevalence rates and two classes with intermediate rates of specific patterns of psychotic symptoms (hallucinations and delusions). These classes displayed specific sociodemographic and clinical correlates.
Footnotes
Acknowledgements
We want to thank Prof. Bruno Falissard (INSERM U669) for his advice on the statistical methodology.
Declaration of Conflicting Interests
The author(s) declared no potential conflicts of interest with respect to the research, authorship and/or publication of this article.
Funding
The author(s) received no financial support for the research, authorship and/or publication of this article.
References
Supplementary Material
Please find the following supplemental material available below.
For Open Access articles published under a Creative Commons License, all supplemental material carries the same license as the article it is associated with.
For non-Open Access articles published, all supplemental material carries a non-exclusive license, and permission requests for re-use of supplemental material or any part of supplemental material shall be sent directly to the copyright owner as specified in the copyright notice associated with the article.