
Abstract
Objective:
This review critically examines the structural neuroimaging evidence in psychotic illness, with a focus on longitudinal imaging across the first-episode psychosis and ultra-high-risk of psychosis illness stages.
Methods:
A thorough search of the literature involving specifically longitudinal neuroimaging in early illness stages of psychosis was conducted. The evidence supporting abnormalities in brain morphology and altered neurodevelopmental trajectories is discussed in the context of a clinical staging model.
Results:
In general, grey matter (and, to a lesser extent, white matter) declines across multiple frontal, temporal (especially superior regions), insular and parietal regions during the first episode of psychosis, which has a steeper trajectory than that of age-matched healthy counterparts. Although the ultra-high-risk of psychosis literature is considerably mixed, evidence indicates that certain volumetric structural aberrations predate psychotic illness onset (e.g. prefrontal cortex thinning), while other abnormalities present in ultra-high-risk of psychosis populations are potentially non-psychosis-specific (e.g. hippocampal volume reductions).
Conclusion:
We highlight the advantages of longitudinal designs, discuss the implications such studies have on clinical staging and provide directions for future research.
Introduction
Identifying biological markers of specific illness stages and states of remission may help to (1) further our understanding of the aetiology and precipitators of certain types of psychopathologies, (2) identify central neurobiological processes as distinct from epiphenomena, (3) validate boundaries of clinical groups (diagnostic or otherwise) and (4) potentially aid in predicting response to treatment. The clinical staging model is an approach found in general medicine to define the extent of disease. In psychiatry, this model has recently been applied to psychotic disorders to distinguish the earlier, non-specific features of illness (as found in the ultra-high-risk [UHR] phase) from later, more severe features associated with chronic illness (McGorry et al., 2007). A key component of the staging model is to identify and classify the pathological processes underlying the disorder. Although structural brain abnormalities have been consistently observed in psychotic disorders with evidence of progression over time, it is unclear whether the trajectories of brain structural changes align with a clinical staging model.
This review will critically evaluate the current structural neuroimaging evidence in psychotic illness and discuss the degree to which the literature supports a psychiatric clinical staging model. Our review will particularly focus on longitudinal research across the early illness stages, given that it may be more informative in understanding the course of illness and has greater implications for early intervention. We address two key questions: (1) Do biological distinctions, in this case brain structural indices, that are deemed abnormal relative to the healthy population exist between the clinical stages within psychotic illness? (2) Are changes within the longitudinal trajectory of psychosis apparent in the same or in different brain regions across illness stages? To provide some context, we first briefly summarise the well-established structural magnetic resonance imaging (MRI) research that has been conducted in people with an established schizophrenia-spectrum disorder and discuss the challenges associated with interpreting this literature. We then outline the cross-sectional findings supporting abnormalities in brain morphology that appear to depend on stage of psychotic illness, that is, evidence for brain structural differences between the UHR (stage 1b), first-episode psychosis (FEP; stage 2) and established illness stages. Focusing on the UHR and FEP stages, we then provide a comprehensive review of the longitudinal neuroimaging literature and highlight the implication of findings in relation to the clinical staging model. The review concludes with recommendations for future research.
Context: brain structural abnormalities in established schizophrenia-spectrum illnesses
Evidence from cross-sectional and longitudinal research
Before closely examining potential brain changes that may specifically take place during the early stages of psychotic illness, it is necessary to reflect on the large body of neuroimaging research in established schizophrenia, which has led us to focus on early-stage illness. In meta-analyses of cross-sectional research, individuals with a diagnosed schizophrenia-spectrum disorder have been consistently shown to have bilateral reductions in hippocampal volumes (Adriano et al., 2012; Davidson and Heinrichs, 2003; Ellison-Wright et al., 2008; Fornito et al., 2009; Haijma et al., 2013; Nelson et al., 1998; Wright et al., 2000; Zakzanis et al., 2000). These meta-analyses each comprised between 18 and 155 studies and between 522 and 4043 patients, and despite overlap in the individual studies analysed, reduced hippocampal volume was a consistent robust finding of moderate magnitude (effect size d = −0.38 to −0.58) (Shepherd et al., 2012). Other grey matter (GM) regions that meta-analyses have identified as significantly abnormal and specifically reduced in schizophrenia include the amygdala; uncus; insula; thalamus; nucleus accumbens; cerebellum; cingulate cortices; prefrontal cortices; dorso-medial frontal cortex; orbitofrontal cortices; fusiform gyrus; inferior, medial and superior temporal regions; parahippocampus, inferior parietal lobe; and frontal, occipital, parietal and temporal lobes (Chan et al., 2011; Davidson and Heinrichs, 2003; Ellison-Wright and Bullmore, 2010; Ellison-Wright et al., 2008; Fornito et al., 2009; Haijma et al., 2013; Wright et al., 2000; Zakzanis et al., 2000). While not all of these meta-analyses identified the same regions, the general findings of GM reductions in temporal, frontal, limbic and striatal regions are relatively consistent, despite the variation in methodology used (i.e. automated or manually parcellated volumetry [mm3], or voxel-based morphometry [VBM]). White matter (WM) deficits have also been observed in the prefrontal and frontal regions, temporal regions and the internal capsule (Di et al., 2009; Ellison-Wright and Bullmore, 2009; Haijma et al., 2013). In addition, enlargement of the ventricles (VE) has been consistently demonstrated in established schizophrenia-spectrum disorders (Shenton et al., 2001). Cross-sectional meta-analyses, which included substantial numbers of drug-naïve patients (Haijma et al., 2013; Wright et al., 2000), show significant VE (e.g. global VE = 126%) of moderate magnitude (e.g. Cohen’s d = 0.45–0.60) in schizophrenia patients relative to healthy controls (HCs), with greatest differences tending to be in the lateral and third ventricles (Haijma et al., 2013; Wright et al., 2000). Finally, meta-analyses from the recent ENIGMA Consortium, which comprised 2028 individuals with schizophrenia and 2540 HCs and which specifically focused on subcortical structures, found patients to have significant volume reductions of the hippocampus, amygdala, thalamus and accumbens, plus significant VE, which strongly supports previous research in this area (Van Erp et al., 2016). Interestingly, investigators found the pallidum to also be enlarged in schizophrenia patients and that this was associated with age and duration of illness (DOI; Van Erp et al., 2016). Overall, cross-sectional findings indicate that GM and WM loss is widespread in people who have an established schizophrenia-spectrum disorder.
Meta-analyses of longitudinal studies support the association between established illness and reductions in GM (and WM) volume (Fusar-Poli et al., 2013; Olabi et al., 2011; Vita et al., 2012). Moreover, these meta-analyses further suggest that volume loss is progressive in nature, where the rate of volume change over the course of illness is significantly greater than that of the general population (although it should be acknowledged that follow-up length ranged from 4 weeks to 10 years). Over time, significantly greater volume reductions are found in total cortical GM, temporal regions including the superior temporal gyrus (STG), Heschl’s gyrus and planum temporale, frontal GM and WM, and temporal and parietal WM (Fusar-Poli et al., 2013; Olabi et al., 2011; Vita et al., 2012). The difference in the annual percentage loss of volume between patients and controls is reported to be greatest for left superior temporal regions (approximately −2.4% difference) followed by the right STG (~−1.3%) (Vita et al., 2012), while the difference in annual reductions of global structures is less marked, ranging from −0.7% for whole-brain volume, −0.59% for whole-brain GM, −0.39% for temporal WM, to −0.32% for frontal and parietal WM (Olabi et al., 2011). Significant progressive VE of small to moderate effect size (Cohen’s d = 0.45–0.53; Hedge’s g = 0.21–0.45) has also been confirmed in established schizophrenia, where follow-up ranged from 1 to ~10 years (Fusar-Poli et al., 2013; Kempton et al., 2010; Olabi et al., 2011). These findings suggest that the greatest loss in brain volume over time in schizophrenia is circumscribed to discrete temporal regions, while a relatively subtle loss may occur more globally across the brain. However, given that the above meta-analyses tended to include studies consisting of both chronic and early-onset schizophrenia samples, the relative influence of early illness stages on the observed brain changes remains unclear. In support of the above findings, a descriptive review of progressive brain changes in chronically ill patients (with an average 10 years’ DOI) reported continuous brain volume reductions up to 20 years after the first onset of symptoms and that progressive volume loss was associated with poor outcome and severity of negative symptoms (Hulshoff Pol and Kahn, 2008). Overall, longitudinal research in established schizophrenia suggests that neurobiological progression may occur continuously over the course of illness in some individuals, presumably individuals who continue to progress to the most severe and persistent stages of illness.
Challenges in interpretation of structural brain abnormalities: pathophysiological, epiphenomena or a consequence of external factors?
The causes of brain volume loss in psychotic disorders remain controversial (Zipursky et al., 2013), as a number of factors have been shown to potentially contribute to volumetric changes over time.
Evidence shows that cumulative antipsychotic exposure over time (median = 74.2 weeks) is significantly associated with GM reduction in schizophrenia (Fusar-Poli et al., 2013). However, lateral VE was not linked with exposure to antipsychotic medications, and research in antipsychotic-naïve patients (n = 771) (Haijma et al., 2013), and never-treated, chronically ill schizophrenia patients (Zhang et al., 2015), has also revealed significant volume reductions, suggesting that antipsychotic treatment does not fully explain volumetric grey and WM loss in psychotic illness. The influence of other factors, including demographic, clinical and neuroradiological factors, on progressive brain change is also unclear. Several variables such as age, age at illness onset, gender, DOI and study quality have been revealed as significant moderators of the magnitude of brain structural effects (Olabi et al., 2011; Vita et al., 2012). The modifying effects of age and gender illustrate the need to consider brain structural findings in the context of developmental and ageing processes, ideally stratifying changes by sex. Interestingly, greater age and DOI have been reported to reduce the between-group difference in volume change (Olabi et al., 2011; Vita et al., 2012), implying that the magnitude of volume reductions diminish with increasing age and illness duration. Therefore, while the literature overall suggests that brain structural abnormalities are more severe in later stages of illness, with evidence of progressive reductions over time, these progressive changes may not occur linearly throughout the course of illness. Furthermore, although the associations with demographic and clinical factors make it difficult to disentangle the mechanisms underlying the observed brain structural trajectories (i.e. primary or secondary epiphenomena of the disease), much of the heterogeneity between studies is still reported to be unexplained (Olabi et al., 2011), suggesting that factors inherent to psychotic disease processes are also at play. Indeed, it is plausible that dynamic brain structural changes in discrete brain regions are associated with primary pathophysiological processes, while generalised loss may be related to factors secondary to the disease (such as antipsychotic exposure). Nevertheless, this is speculative and remains to be elucidated.
Given the challenges associated with the interpretation of brain structural changes in established schizophrenia, the early phase of illness, which is less confounded by medication exposure and factors associated with illness chronicity, may better reveal biological abnormalities associated with primary pathophysiological processes. We therefore now turn to the early illness stages, where brain changes appear to be more dynamic, and hence the trajectory of change more telling in the context of a clinical staging heuristic.
Brain structural abnormalities in early illness stages
It is now known that during adolescence and through to early adulthood the brain undergoes substantial GM and WM changes as part of normal neurodevelopment (Shaw et al., 2008). Specifically, much of the frontal, temporal, parietal and occipital cortices develop along a cubic trajectory, where during childhood there is an initial increase in the thickness of the cortex, but this then declines during adolescence and stabilises in adulthood (Shaw et al., 2008). However, the insula and anterior cingulate mostly develop along a quadratic trajectory, while regions of the orbitofrontal, piriform, medial temporal and occipitotemporal cortices, as well as the hippocampus, frontal operculum and subgenual areas, develop along a gradual downward linear trajectory (Shaw et al., 2008). These trajectories need to be taken into consideration when evaluating neuroimaging data in the context of clinical stages (Cropley and Pantelis, 2014). Several recent papers have outlined the potential applicability of neuroimaging evidence to a clinical staging model in psychiatry, with particular emphasis on the early illness stages which typically occur during adolescence, within this critical neurodevelopmental window (Frank et al., 2015; Lin et al., 2013; McGorry et al., 2014; Wood et al., 2011). The majority of research has been in FEP (stage 2) and UHR for psychosis (stage 1b).
FEP
Evidence from cross-sectional neuroimaging research
As with established schizophrenia disorders, meta-analyses of cross-sectional studies in FEP (excluding psychoses associated with a primary affective disorder) demonstrate reductions in hippocampal volumes relative to HCs (Adriano et al., 2012; Steen et al., 2006; Vita and De Peri, 2007; Vita et al., 2006). Interestingly, this deficit is comparable in magnitude to that of individuals in the chronic illness stages with Cohen’s d ranging from −0.47 to −0.66 (Adriano et al., 2012; Vita et al., 2006). Taking into account the linear developmental trajectory of this subcortical structure together with these findings, evidence suggests that reduced hippocampal volume may be a biological trait marker of psychotic illness. Having said this, given there is also evidence of hippocampal volume reductions in early-stage major depressive disorder (Cole et al., 2011; Zhao et al., 2014), it is more likely that hippocampal volume reduction is a non-specific risk marker for a range of psychiatric illnesses. VE is also a consistent finding in FEP (effect size range = 0.47–0.61) (De Peri et al., 2012; Steen et al., 2006; Vita et al., 2006). These region of interest (ROI)-based meta-analyses involved between 13 and 52 studies and 114 and 1424 FEP patients, indicating that findings are robust.
Other meta-analyses (N patient range = 271–965) that employed voxel-based methods have found reduced GM volume of the cerebellum, insula, caudate, operculum, superior temporal, medial frontal, prefrontal and anterior cingulate cortices (Chan et al., 2011; Fusar-Poli et al., 2012, 2014; Radua et al., 2012), and WM deficits (reduced fractional anisotropy) deep in the frontal and temporal lobes (Yao et al., 2013). One region that appears to be of normal volume in FEP is the amygdala (Velakoulis et al., 2006; Vita and De Peri, 2007; Vita et al., 2006). As mentioned previously, amygdala volume reductions are observed in established schizophrenia, suggesting that volume loss occurs post illness onset, which may be pathologically driven or a secondary consequence related to other factors (e.g. medication as mentioned previously). Nonetheless, if amygdala volume is intact at the first episode, this has implications for early interventions that may protect this region from later decline and possibly improve certain phenomenology associated with amygdala function (e.g. emotion regulation).
Interestingly, Radua et al. (2012) additionally found that the lingual and precentral gyri were significantly enlarged in comparison to age-matched HCs (mean age = 24 and 26 years, respectively; range = 15–35 years). Possible explanations for this may be related to the second (or third)-hit neurodevelopmental hypothesis, which posits that underlying pathophysiological mechanisms may lead to ‘arrest’ or potentially ‘delay’ of normal brain development during adolescence (Pantelis et al., 2005). Given that these gyri would normally develop along a cubic trajectory and generally are not found to be abnormal in established schizophrenia-spectrum illnesses, arrest or delay in the maturation of this region (i.e. a halt or delay in the natural reduction in thickness and subsequent stabilisation) is possible. However, the evidence presented here is cross-sectional in nature. Identifying neurobiological markers during the early stages of illness onset, which coincides with dynamic neurodevelopmental changes, is in essence like ‘searching for a moving target’ (Pantelis et al., 2009a). Thus, longitudinal designs are far more informative.
Evidence from longitudinal neuroimaging research in FEP
A recent meta-analysis of nine longitudinal studies in FEP (N=500) generally supports the findings from cross-sectional research (Vita et al., 2012). Specifically, this meta-analysis found that in addition to whole-brain GM volume reductions, FEP patients displayed significant GM reductions in the frontal, temporal (including transverse gyri) and parietal lobes over time in comparison with controls (mean years inter-MRI interval = 2.5). One prominent study conducted by Sun et al. (2009b) demonstrated that from the first psychotic episode, cortical surface contraction, particularly the dorsal regions of the frontal lobes, occurs at twice the rate as that observed in HCs over a period of 1–4 years, implying that the normal pattern of development is altered in FEP by way of excessive cortical thinning. Further work from our research group has demonstrated progressive GM reductions of the insula and several superior temporal sub-regions in FEP (Takahashi et al., 2009a, 2009c; see Table 1 for details of longitudinal studies in FEP).
Longitudinal neuroimaging studies initiated in the first episode of psychosis illness stage.
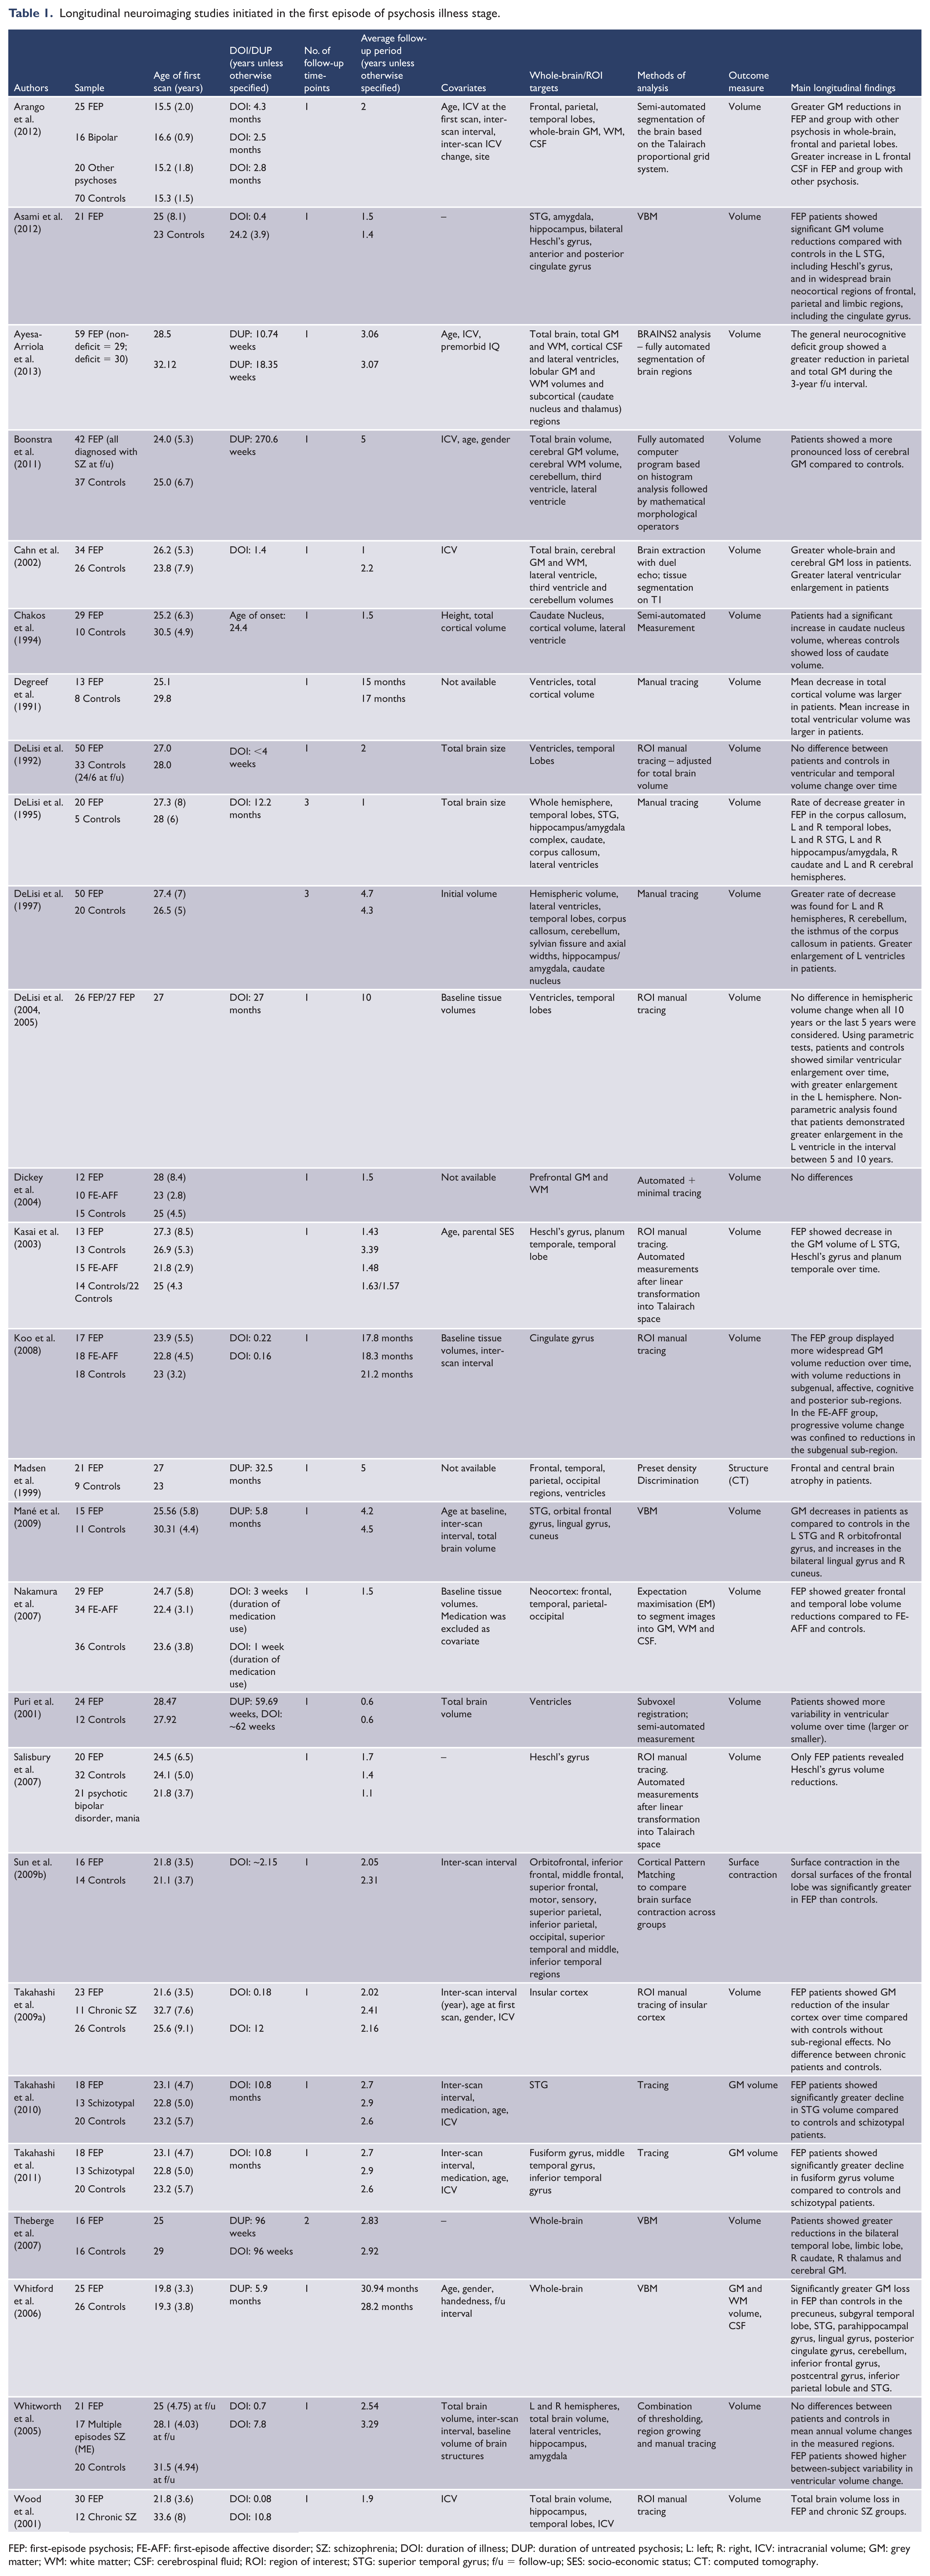
FEP: first-episode psychosis; FE-AFF: first-episode affective disorder; SZ: schizophrenia; DOI: duration of illness; DUP: duration of untreated psychosis; L: left; R: right, ICV: intracranial volume; GM: grey matter; WM: white matter; CSF: cerebrospinal fluid; ROI: region of interest; STG: superior temporal gyrus; f/u = follow-up; SES: socio-economic status; CT: computed tomography.
As can be seen from Table 1, the breadth of variation in the sample characteristics and study methodologies across the different studies makes it difficult to interpret trajectories (i.e. slope and timing) of brain changes. For example, the mean DOI ranged from ~3 weeks to 27 months and mean duration of untreated psychosis (DUP) from 2.3 months to 5.17 years, while length of inter-scan interval(s) ranged from 0.5 to 10 years, number of follow-ups was 1–6 and the analysis approach also varied across studies (i.e. whole-brain vs ROI/manual tracing vs automated). The majority of studies had only one follow-up time-point, and although inter-MRI interval was often controlled for, the lack of multiple time-points forces the assumption of a linear trajectory. Nonetheless, the majority of studies do show that from the first episode of psychosis (i.e. stage 2), decreases in GM and WM, particularly of the frontal and temporal lobes, will ensue, and these decreases will be greater than that observed in healthy individuals. Drawing on the studies that recruited FEP patients with short DOIs (i.e. <6 months) and a short duration to follow-up (i.e. <2 years), it can be inferred that not only do changes occur rapidly, but that these abnormal changes are occurring from first presentation to psychiatric services and that they are occurring during an important neurodevelopmental window (adolescence–early adulthood). These studies found FEP patients displayed whole-brain volume loss (Wood et al., 2001) and significant GM reduction in numerous frontal, temporal, parietal and limbic regions over a 0.5- to 1.9-year period (Asami et al., 2012; Koo et al., 2008; Nakamura et al., 2007). These reductions were over and above that of controls, who also tended to show minimal or no cortical volume loss, suggesting that in FEP the normal neurodevelopmental trajectory is altered (exaggerated or accelerated).
It is noteworthy that a number of previous studies failed to find any significant brain changes when comparing their FEP sample to HCs (DeLisi et al., 1992, 2005; Haukvik et al., 2016; Whitworth et al., 2005), although these studies are the minority. There are numerous factors that may account for the lack of findings in these studies, notwithstanding the possibility that these FEP samples may have comprised unique subsamples of patients who may display normal volumetric brain changes over the course of the illness. Indeed, DeLisi et al. (1992) reported that a subset of FEP patients had gross changes (e.g. >20% increase in ventricular volume and >10% decrease in temporal lobe volume). It should be further acknowledged that while group-by-time differences may not have been significant, some of these studies did find group differences at the individual time-point(s) (Haukvik et al., 2016; Whitworth et al., 2005) and/or that the degree of volume change was associated with features of the illness, for example, number of hospitalisations (DeLisi et al., 1992). The majority of studies discussed above have been in relatively small samples; thus, a lack of statistical power could also account for inconsistencies in the literature. Furthermore, most studies assumed a linear trajectory of change with only two time-points available, which may have resulted in no difference over time (for further discussion, see Cropley and Pantelis, 2014).
The Iowa Longitudinal Study is one of the largest and longest follow-up studies of FEP patients, with a subsample of 202 patients having on average two follow-up MRI scans, occurring up to 15 years after intake (mean time between first and last scan = 7.2 years) (Andreasen et al., 2011). Andreasen et al. (2011) found that total GM volume/year (specifically frontal, temporal and parietal GM) and WM volume/year (specifically frontal and temporal WM) decreased and that sulcal cerebrospinal fluid (CSF) increased significantly for FEP patients over time when compared to HCs. Interestingly, when they examined the pattern of change, it was only at the first inter-scan interval (approximately 2 years post baseline) that FEP volume changes were statistically different to control participants, highlighting that the most severe brain changes occur during the critical early illness stages. Surprisingly, there were no significant group differences in volume change for parietal WM or for the lateral ventricles. When medication effects were examined in this cohort, higher doses of antipsychotic medications corresponded to greater reductions in total cerebral and lobar WM, caudate and cerebellar volumes and greater enlargements in sulcal CSF, lateral ventricular and putamen volumes (Ho et al., 2011). Irrespective of illness duration and illness severity, higher antipsychotic dose was also associated with smaller GM and larger putamen volumes (Ho et al., 2011). There remains some debate about whether certain types of antipsychotic medications are more harmful than others and even suggestions of some being neuroprotective. For example, Lieberman et al. (2005) found that, relative to HCs, FEP participants randomised to olanzapine had no GM volume reductions at weeks 12 or 52, while FEP participants randomised to haloperidol showed widespread GM reductions at both time-points.
Despite the significant evidence for medication effects on the brain, cross-sectional research has shown that medication-naïve FEP patients present with reduced superior temporal, insula and cerebellum volumes (Fusar-Poli et al., 2012), indicating that although brain changes across the illness stages may be partially due to the effects of antipsychotic medications, alterations in brain structure also appear to be intrinsic to the illness. Overall, findings are in line with cross-sectional research into medication effects on the brain in FEP (Ansell et al., 2014; Lesh et al., 2015; Radua et al., 2012). (For further discussion on the effects of antipsychotic class on brain structure, see Ansell et al., 2014; Ho et al. 2011.) One reason for researchers turning their focus to the at-risk mental state was indeed to escape the confounding effects of antipsychotic medication use.
UHR of psychosis
Studies of individuals at ‘clinical’ or ‘UHR’ of psychosis (i.e. stage 1b) are essential for uncovering the potential predictors of both illness progression and response to treatment (be it either pharmacological or psychosocial). However, readers should be mindful that interpretation of cross-sectional research in this area is challenging, given that a large proportion (approximately 65–73%) will not transition to a full-threshold psychotic disorder in the short term (e.g. 2 years; Simon et al., 2013) or long term (e.g. 10 years; Nelson et al., 2013).
Evidence from cross-sectional neuroimaging research
Meta-analysis of 14 VBM studies has shown that UHR individuals (N = 198) present with significant GM reductions in the middle frontal gyrus, middle and superior temporal gyri, hippocampus, parahippocampus and anterior cingulate in comparison with matched HCs (Fusar-Poli et al., 2012). Considering the trajectories of normal brain development, particularly of the anterior cingulate (and insula, which develop along quadratic trajectories with peak volumes reached around age 17; Shaw et al., 2008), it is important that samples were matched in age with HCs (interestingly, age was found to have no moderating effect on brain volumes; Fusar-Poli et al., 2012). Fusar-Poli et al. (2012) further found that in relation to FEP patients, GM volumes of the STG, anterior cingulate, cerebellum and insula were significantly larger in UHR. Although these studies were cross-sectional, findings imply that additional volume loss may occur in specific structures (i.e. superior temporal and anterior cingulate gyri) during the transition phase from stages 1b to 2. Similarly, findings suggest certain regions, namely, the insula and cerebellum, may be preserved prior to first psychotic episode and deteriorate thereafter (Fusar-Poli et al., 2012). However, this is challenged by research showing these regions to be reduced in UHR relative to HCs (Borgwardt et al., 2007; Takahashi et al., 2009b). Some studies have also failed to find any between-group differences in whole-brain or regional GM, WM or cortical thickness (Klauser et al., 2015). Mixed findings may, in part, be the result of a dilution effect, which comes from averaging the volumes across a broad UHR population comprising both people who will and will not end up developing a psychotic disorder. Thus, numerous studies have followed up UHR individuals over several years to assess UHR status.
It has been shown that UHR individuals who later transition to psychosis (UHR-P) in comparison with UHR individuals who do not transition to psychosis (UHR-NP) have reduced insula volumes and thickness of the anterior cingulate and anterior genu of the callosum, but normal cerebellar volumes, at baseline (Fornito et al., 2008; Pantelis et al., 2003; Takahashi et al., 2009b; Walterfang et al., 2008b). Larger baseline pituitary volume (thought to be indicative of a heightened hypothalamic–pituitary–adrenal [HPA]-axis response to stress) has been found in UHR-P compared to UHR-NP and HCs (Buschlen et al., 2011; Garner et al., 2005). Evidence for WM is somewhat mixed (when comparing UHR-P to UHR-NP) where WM volume was reported as increased in regions of the frontal lobes (Fusar-Poli et al., 2011; Walterfang et al., 2008a), decreased in medial temporal and superior parietal regions (Fusar-Poli et al., 2011) and reduced in thickness in corpus callosum (Walterfang et al., 2008b), while fractional anisotropy (FA) has been found to be both decreased and increased in disparate temporal lobe regions (Bloemen et al., 2010). FA in a sub-region of the corpus callosum has been found to be significantly reduced in UHR-NP individuals (but not UHR-P) relative to HCs, although UHR-P (albeit a small transition group) did show a trend in the same direction (Katagiri et al., 2015). A recent study that used a whole-brain structural covariance approach (which examines GM correlations between a priori ROIs) found aberrant structural interconnectedness between nodes within several well-defined networks (salience, executive control, auditory and motor) in UHR-P relative to UHR-NP (Heinze et al., 2015).
Contrary to evidence that distinguishes transitioned individuals from non-transitioned individuals, volume of the STG was equally reduced in UHR-P and UHR-NP relative to HCs, suggestive of a more generalised deficit for persons with an at-risk mental state (Takahashi et al., 2010; Wood et al., 2010). Findings regarding the amygdala have been fairly consistent thus far with UHR individuals presenting with normal baseline volumes, irrespective of later transition (Dazzan et al., 2012; Velakoulis et al., 2006; Witthaus et al., 2010).
Despite the somewhat reduced heterogeneity within the broad UHR group by prospective classification of transition status, numerous other underlying factors remain unaccounted for. For example, studies have found hippocampal volumes of both UHR-P and UHR-NP to be no different to HCs (Velakoulis et al., 2006), equally reduced compared to HCs (Wood et al., 2010) or have found UHR-NP (but not UHR-P) to be reduced compared to HCs (Phillips et al., 2002). In addition, dividing the UHR sample into sub-groups is proving increasingly difficult (although not impossible; for example, see Cropley et al., 2016), given the low (and declining) transition rate, which impacts statistical power. It has been postulated that the inconsistencies in this cross-sectional literature (for review, see Smieskova et al., 2010) are due, in part, to abnormalities being dependent on the interactions between illness stage, developmental trajectory of the given brain structureand age/life stage (Gogtay et al., 2011; Pantelis et al., 2005, 2009b) and/or illness/symptom acuity (Cropley et al., 2013; Cropley and Pantelis, 2014), which further impresses upon the importance of longitudinal designs.
Evidence from longitudinal neuroimaging research
Longitudinal UHR studies (most of which used an ROI approach), with follow-up between 1 and 2.5 years, have found the UHR-P individuals (but not UHR-NP) to have significant progressive volume reductions in the insula, cingulate cortex, orbitofrontal cortex, STG, fusiform gyrus and parahippocampus (Pantelis et al., 2003; Takahashi et al., 2009b, 2009c), as well as reduced FA in frontal (Carletti et al., 2012) and reduced WM in the left fronto-occipital fasciculus (Walterfang et al., 2008a) and in cerebellar-thalamic regions (Mittal et al., 2014), during the transition to psychosis (see Table 2 for details of longitudinal studies in at-risk psychosis samples). Similarly, cortical thinning of the anterior cingulate, precuneus and sub-regions of superior temporal and temporo-parieto-occipital cortices has been found to be more pronounced in UHR-P relative to HCs, although no differences were found when compared to UHR-NP (Ziermans et al., 2012). However, Sun et al. (2009a), using a cortical pattern matching technique, did find that the rate of surface contraction was significantly exaggerated in the prefrontal lobe of UHR-P compared to UHR-NP individuals, consistent with their study in FEP (described earlier) (Sun et al., 2009b). While there are various morphological brain abnormalities that appear to be more common in UHR-P, cerebellar (Pantelis et al., 2003) and hippocampal (Walter et al., 2012) volumes have been found to decrease over time (between 1 and 4 years) in UHR individuals irrespective of transition status.
Longitudinal neuroimaging studies initiated in the ultra-high-risk and genetic high risk of psychosis illness stages.
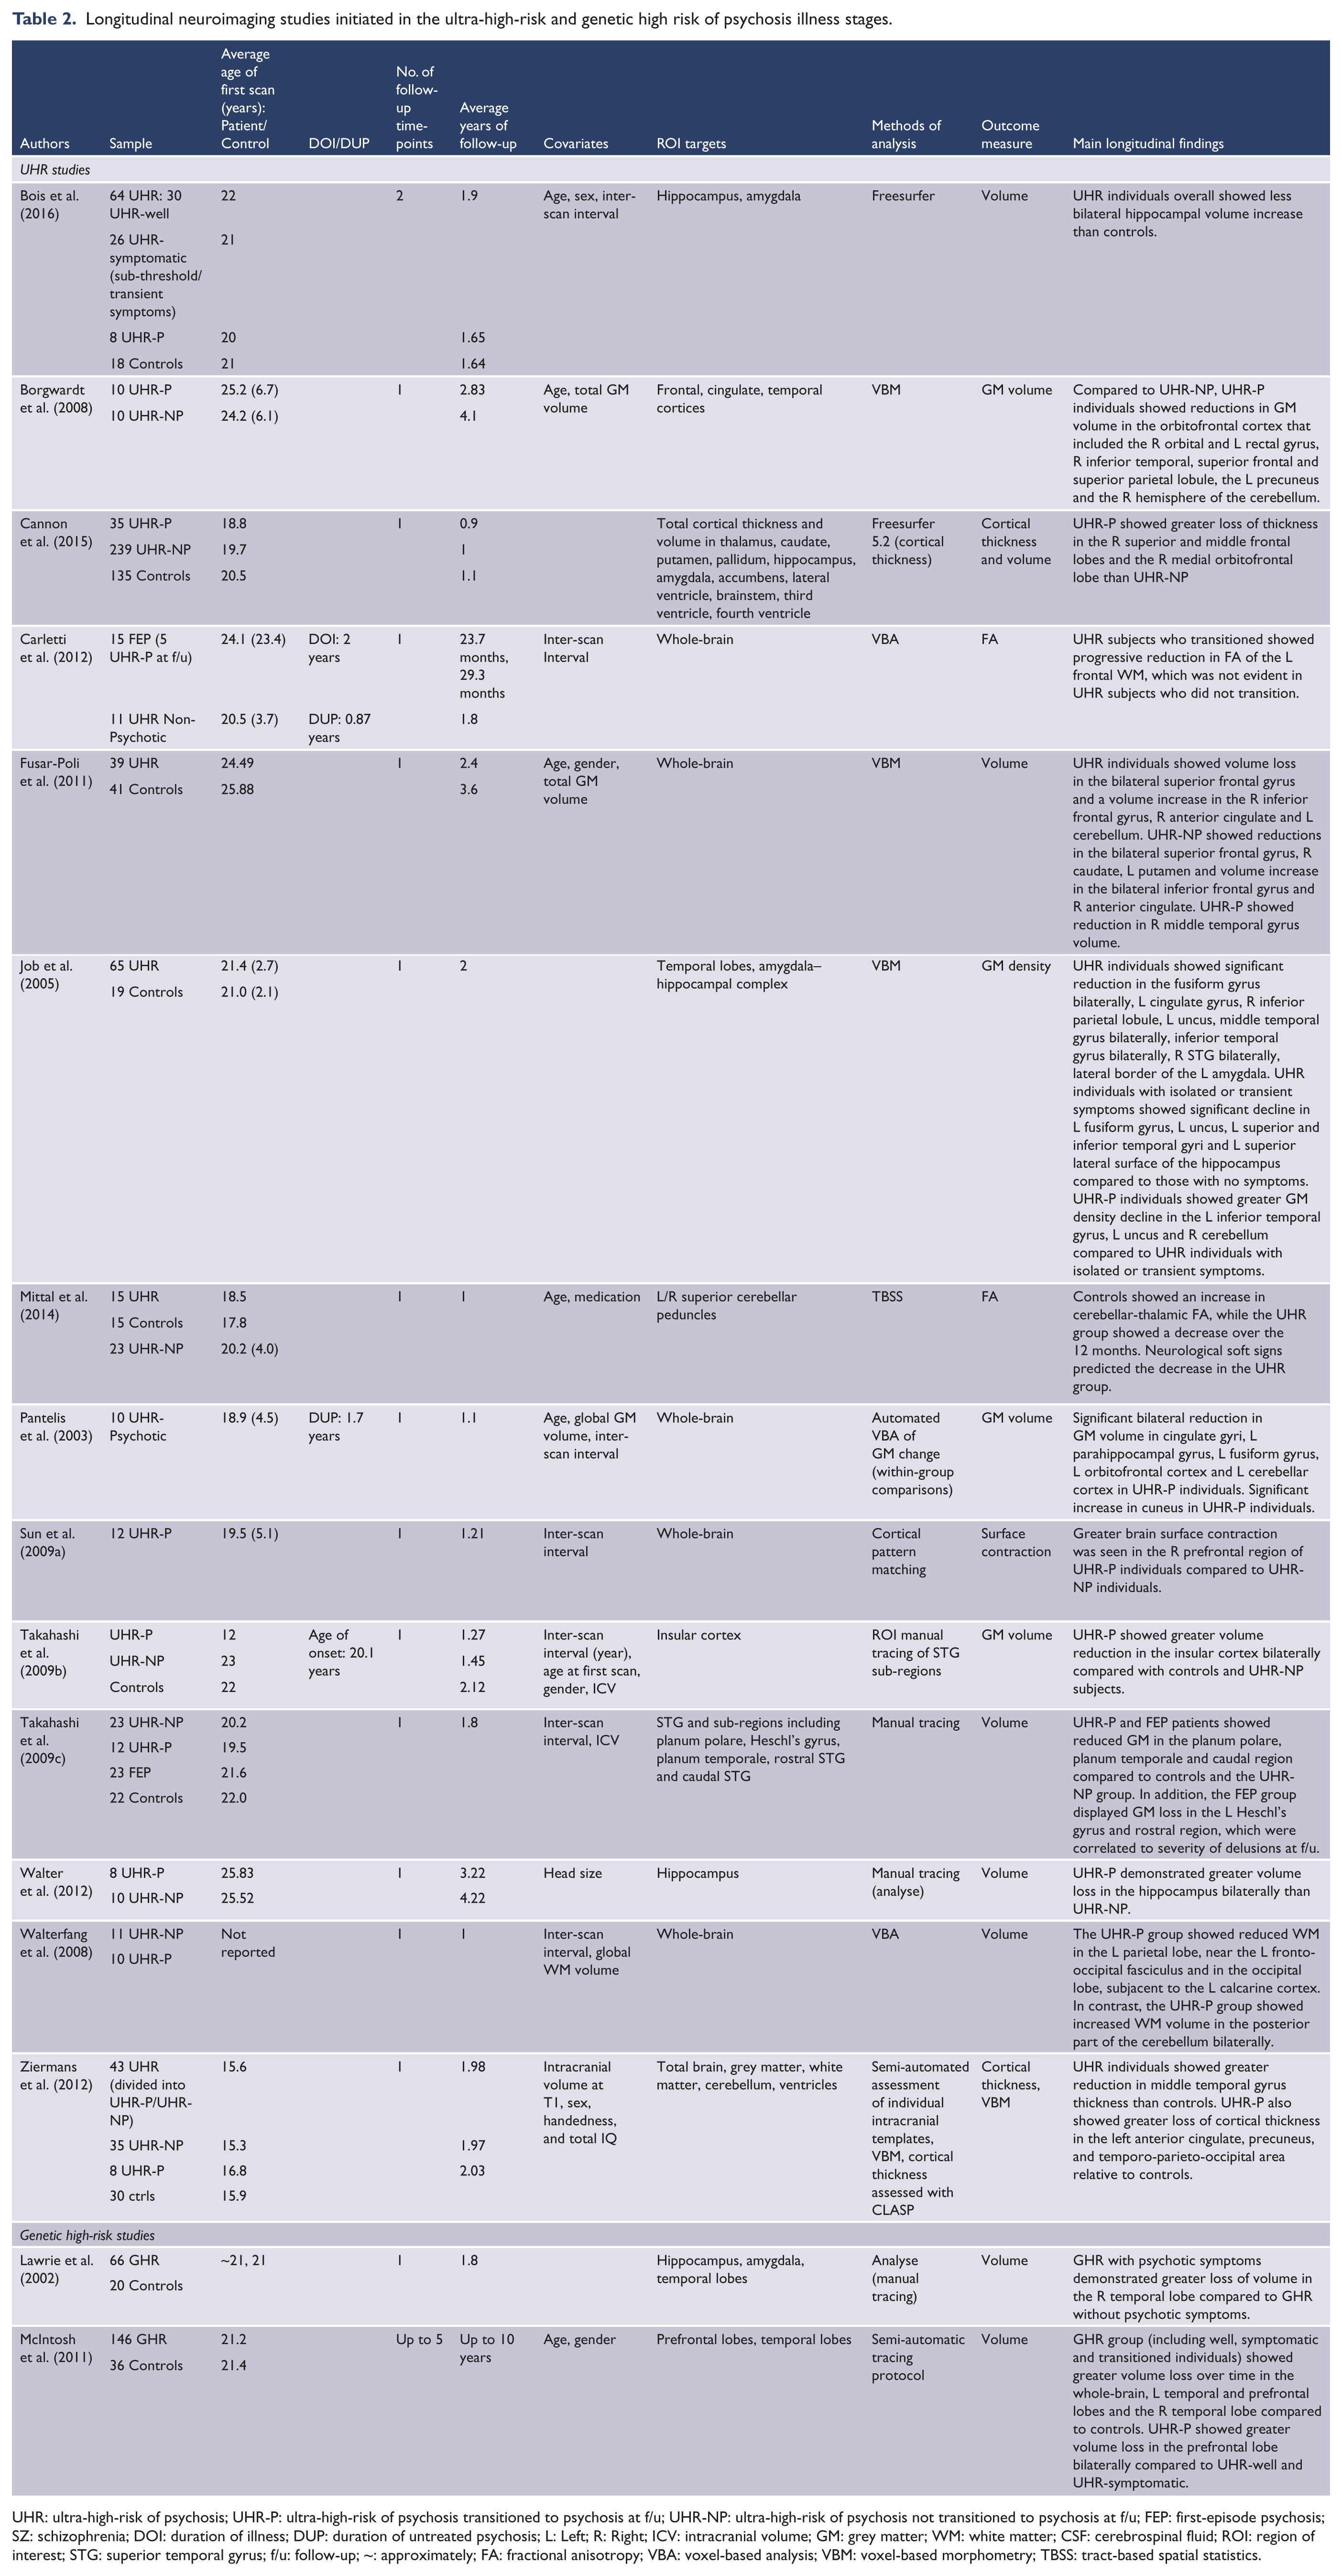
UHR: ultra-high-risk of psychosis; UHR-P: ultra-high-risk of psychosis transitioned to psychosis at f/u; UHR-NP: ultra-high-risk of psychosis not transitioned to psychosis at f/u; FEP: first-episode psychosis; SZ: schizophrenia; DOI: duration of illness; DUP: duration of untreated psychosis; L: Left; R: Right; ICV: intracranial volume; GM: grey matter; WM: white matter; CSF: cerebrospinal fluid; ROI: region of interest; STG: superior temporal gyrus; f/u: follow-up; ~: approximately; FA: fractional anisotropy; VBA: voxel-based analysis; VBM: voxel-based morphometry; TBSS: tract-based spatial statistics.
One of the largest longitudinal UHR studies to date (North American Prodrome Longitudinal Study, NAPLS) has recently confirmed that cortical thinning of the superior and middle frontal, as well as orbitofrontal cortices, occurs at a significantly faster rate in UHR-P (n = 35) compared to UHR-NP (n = 239) and HCs (n = 135), which was of moderate to large magnitude (d range = −0.30 to −1.0) (Cannon et al., 2015). This was demonstrated with an average inter-scan interval of only 141 days in individuals who transitioned, suggesting that structural brain changes can occur in a short time period. Several other regions, including the parahippocampus and regions of the parietal and superior temporal cortices, also demonstrated abnormal rates of change (however, these did not survive correction). Interestingly, Cannon et al. (2015) further examined the impact of duration of prodrome on brain changes, that is, whether a shorter time in stage 1b corresponds to more severe neural abnormalities. Indeed, they found that UHR-P individuals with a shorter duration (<26 months) had a steeper reduction in prefrontal cortical thickness compared to those with a longer duration of prodromal symptoms (>26 months). In addition, UHR-P participants had greater enlargement of the third ventricle in comparison with UHR-NP and HCs, but there were no longitudinal group differences in other ventricular regions, subcortical GM structures or various other cortical regions not mentioned above. It is noteworthy that no baseline differences existed between any of the groups, and changes occurred irrespective of antipsychotic exposure; rather, the authors found an association with peripheral inflammatory markers, which may suggest that the more rapid trajectory in those with shorter time in stage 1b may be related to illness acuity and neuroinflammation (see also Bloomfield et al., 2016; Cropley et al., 2013).
Finally, the Edinburgh High Risk Study (EHRS) is another large longitudinal study that provides some insight into the brain changes that occur early on in the illness course. This study was initiated in 1994 and involved young people (age 16–25 years) at genetic high risk (GHR) of psychosis, which was defined as having at least two first- or second-degree relatives with a diagnosis of schizophrenia (i.e. stages 0–1a according to the staging model; McGorry et al., 2007). This population is distinct from the UHR population who are clinically help-seeking and functioning sub-optimally (and who may or may not have any family member with a history of psychotic illness). GHR individuals tend to have a lower risk of transition (1 in 10 lifetime risk when one first-degree relative is affected by psychotic illness (Mueser and McGurk, 2004); for reviews of GHR populations, see Bois et al., 2015; Fusar-Poli et al., 2014). At the 2-year follow-up time-point, there were no significant differences in change in volume between GHR participants and HCs for any of the 17 ROIs investigated (including whole brain, ventricles, temporal, prefrontal, amygdala–hippocampus, thalamus, caudate, lenticular nucleus; Lawrie et al., 2002). However, GHR individuals who had psychotic symptoms (n = 19) did show significant reductions in right temporal lobe volume (2.5%) in comparison to GHR participants who had no psychotic symptoms (0.04%) (Lawrie et al., 2002). With a larger sample of GHR participants (n = 146), and after further sub-dividing the GHR group into GHR-well, GHR with psychotic symptoms and GHR who transitioned to schizophrenia (GHR-Sz; n = 17), over an 8-year period it was this latter group who showed the greatest amount of volume loss, specifically in the bilateral prefrontal lobes, relative to the other GHR sub-groups (McIntosh et al., 2011). Interestingly, these GHR sub-groups did not differ in brain volumes at the baseline scan, despite the GHR group as a whole having smaller prefrontal lobes compared to HCs. This suggests that the prefrontal lobe abnormalities in adolescents–young adults who later go on to develop schizophrenia are subtle/undifferentiating; thus, prefrontal lobe volumes may not have much utility as a predictor of transition in GHR individuals. Importantly, because participants of the EHRS were scanned up to five times at approximately 2-year intervals, investigators were able to examine the trajectories of brain changes and found that the GHR-Sz group had a steeper rate of prefrontal volume loss (McIntosh et al., 2011). One limitation of this study is that investigators did not report on analyses comparing GHR sub-groups to HCs.
Overall, longitudinal research in UHR is limited. Future research should aim to collect multiple follow-up scans at shorter intervals (e.g. 1 year) in order to allow examination using more sophisticated analysis methods, which would also enable the detection of subtle changes and potentially non-linear trajectories of change (Zalesky et al., 2015). In addition, given the overall heterogeneity in the UHR literature, future research should explore alternative outcome variables to ‘transition’ to psychosis (see, for example, Cropley et al., 2016), as it is likely that UHR individuals who will never develop psychosis still display aberrations in brain structural changes. It may be that changes are related to some other form of psychopathology (e.g. anxiety, stress), attenuated symptoms, neurocognitive deficit or poor social or occupational functioning.
Summary of brain changes across the stages of psychotic illness
Overall, there are many brain regions shown to be abnormal in the later more established stages of psychotic illness. Some abnormalities that are consistently observed in this chronic illness stage, namely, hippocampal volume reductions and VEs, appear to also be present in FEP (stage 2), suggesting that these are potential biological risk markers of illness progression (or more broadly, poor mental health outcomes). In addition, GM (and, to a lesser extent, WM) declines across multiple frontal, temporal (especially superior regions), insular and parietal regions in FEP. The longitudinal early psychosis literature suggests that the brain continues to develop abnormally (e.g. greater volume reductions, cortical thinning) for at least several years following the initial onset of illness, which includes regions that develop along differing trajectories (i.e. cubic, quadratic and linear). The UHR literature is considerably more mixed, but importantly, the severity and degree of neural abnormalities in stage 1b are significantly less than that observed in later, more established illness stages. Initial evidence suggests that VE and reduced hippocampal volumes are not consistent/typical characteristic features of the 1b (i.e. UHR) illness stage. However, volume reductions of the insula, cingulate and superior temporal cortices, as well as a faster rate of frontal cortical thinning, may represent predisposing risk factors that could aid in predicting transition to psychosis. Several studies have examined predictive ability of specific neural abnormalities. For instance, Garner et al. (2005) showed that for every 10% increase in baseline pituitary volume, risk of transition increased by 20%. Similarly, Walterfang et al. (2008b) showed that for every 1 mm reduction in mean thickness of the anterior genu, UHR participants had a 52% increase in risk of transition. However, a whole-brain approach appears more advantageous, as multivariate neuroanatomical pattern classification accurately identified 88% of UHR individuals who later transitioned, when grouped with UHR-NP and HCs (Koutsouleris et al., 2009). Thus, machine learning, as well as multimodal stepwise prediction models (Clark et al., 2015; Schubert et al., 2015), may prove most useful for applying a clinical staging model to schizophrenia spectrum and more broadly psychiatric illness in the future.
Clinical implications for the staging model: How can we move the field forward?
Much of the evidence to date highlights the need for longitudinal designs and a consideration for the ‘age’ of the sample population and how this relates to the normal trajectory of brain development (Gogtay et al., 2011; Pantelis et al., 2005, 2009a; Paus, 2005). Indeed, we argue that the detection of differences in neurobiology between illness stages may depend on the slope of the trajectory of change across time (see Figure 1). Hypothetically, if neurobiological changes occur rapidly and in parallel to when an individual’s phenotypic presentation moves them from one stage to the next within a distinct time window (red line Figure 1), this steep slope would suggest that the discovery of biological markers of illness progression across stages is attainable. However, if neurobiological changes take place gradually over a longer time period (blue line Figure 1) and do not map onto phenotypic changes, distinctions may be more difficult to detect, particularly if research is cross-sectional, if longitudinal studies have short follow-up periods or if illness stage is defined by behavioural indices (as it is currently). This challenges the utility of diagnosticcategories in the context of brain imaging being applied within a clinical staging model. Moreover, the time-point at which changes begin and the trajectory the slope takes is likely to differ for each individual and will depend on the presence of other factors (both protective and harmful) that can influence neurodevelopment and/or illness progression.
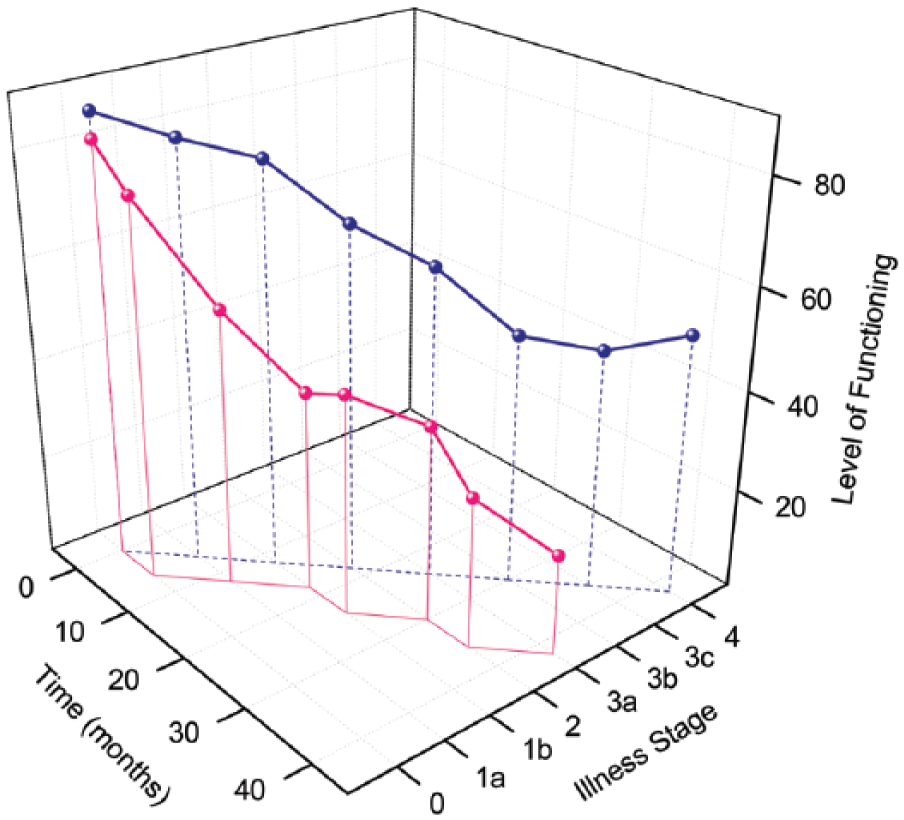
Model of differing illness stage trajectories over time.
Collectively, neuroimaging evidence in psychiatry continues to support a systems neuroscience/neural networks approach (Frangou, 2014; Hulshoff Pol and Bullmore, 2013), which acknowledges that symptoms of mental illness and dysfunctions emerge from disturbances in structural and functional integrity within large-scale neural networks. It is proposed that to move the field forward, researchers should focus on differentiating between abnormalities in ‘domain-general’ superordinate networks (which are likely associated with general processing impairments that give rise to common clinical, cognitive and affective symptoms) and microscale abnormalities within these large-scale networks (that may well be disease-specific) (Frangou, 2014). Thus, a focus on identifying and characterising microscale circuits that are dysfunctional, and the ways in which these abnormalities develop/change over time, may have the greatest implications for clinical staging in the near future. In terms of moving towards personalising medicine in psychiatry (Bousman and Hopwood 2016) (which is harmonious with clinical staging), machine learning techniques (Kloppel et al., 2012; Koutsouleris et al., 2009), combined with multimodal imaging (e.g. Cocchi et al., 2014; Schubert et al., 2015), appear most promising but require further investigation to address the issue of specificity when multiple illness populations are pooled together (as opposed to differentiating patients from HC individuals).
General directions for future research
While a wider review of the literature linking genes to brain morphology in schizophrenia-spectrum disorders was beyond the scope of this review, it is important to note that a wealth of neuroimaging literature has shown links between brain changes and genetics in all major psychiatric disorders, which attests to interdisciplinary research being a necessary way forward for this field (Ducharme et al., 2014). Thus, identifying neuroimaging-based intermediate phenotypes is more informative than simply investigating gene polymorphisms with behaviour, given that an intermediate phenotype (i.e. cell activity) is a heritable trait that is located on the pathogenesis pathway from genetic predisposition to psychopathology (Rasetti and Weinberger, 2011). These authors make the point that intermediate phenotypes are likely associated with a more basic and proximal aetiological process and are therefore more amenable to genetic investigation (Rasetti and Weinberger, 2011). Similarly, other biological factors (e.g. proinflammatory cytokines in plasma) will be more informative if examined in the context of predicting later brain changes (Cannon et al., 2015; Cropley et al., 2013; Laskaris et al., 2016).
Neuroimaging in psychiatry has great potential for aiding the prediction of treatment response, although this area of research is still nascent (for discussion, see Kempton and McGuire, 2015). For example, a cortical gyrification study in FEP showed that patients who were non-responsive to antipsychotic treatment had significant hypogyria (i.e. less cortical folding) of the insula, as well as frontal and temporal regions, when compared to FEP patients who responded well (Palaniyappan et al., 2013). Medication is typically a first-line treatment in individuals in stages 2 and above, but often patients go through months (or even years) of trial and error with several iterations of differing medications in order to discover the optimal treatment. Thus, effective predictive tools of medication response could provide timely and optimal treatment for individual patients and minimise illness burden.
The potential utility of neuroimaging extends beyond prediction of response to medication and may be useful for predicting response to psychological and cognitive therapies. Keshavan et al. (2011) found that in early course schizophrenia, greater global cortical reserve (i.e. larger GM and surface area, particularly of the temporal lobes) was predictive of a more rapid response to cognitive therapy in the first year of treatment (although this was only with respect to predicting social cognitive improvements). We have proposed that select cognitive abilities (e.g. set-shifting ability) appear to be preserved in the psychosis prodrome but soon decline with illness progression (Pantelis et al., 2015). Therefore, tailoring treatment to target specific cognitive abilities would be best initiated at the UHR stage (i.e. 1a and 1b), which is the time-point where the brain is changing dynamically and therefore improvements, particularly in relation to preserving/strengthening resilience factors, will be most evident. In this regard, recent attention is also focusing on improvement of trajectories over time in relation to amelioration of symptoms (Katagiri et al., 2015) and the identification of resilience or protective factors (Pantelis and Bartholomeusz, 2014).
With the premise that dysfunctional neural mechanisms underlie symptomatology, a shift from a holistic phenotypic classification of ‘disorders’ to a model whereby neurobiological markers can be mapped to specific symptomatology (for example, see Fontenelle et al., 2011), which is often transdiagnostic, may need to occur in the future. Indeed, a limitation of the current review is that we reported on the broad psychosis illness domain without much exploration into discrete symptom-specific sub-group populations. Similarly, biological sub-groups were not considered; for example, a distinct sub-group of schizophrenia patients are suggested to display cortical muscarinic receptor deficiency (Scarr et al., 2009), and elevated inflammatory markers (Fillman et al., 2013, 2015), while others suggest treatment-resistant patients have a non-dopamine-dependent form of the illness that may be related to elevated glutamate (Demjaha et al., 2014).
Finally, while we attempted to address the confounding issues of medication, a number of other potential confounders and moderators of brain volumetric changes were not taken into account, including substance and alcohol abuse (e.g. Lorenzetti et al., 2015; Yucel et al., 2008), comorbid mental illnesses, neuroradiological factors, environmental factors and early life adversity (e.g. growing up in an urban setting) (Haddad et al., 2015), but in particular childhood trauma which is reported in up to 73% of patients (Bendall et al., 2008). Childhood trauma is (1) associated with GM volume reductions and cortical thinning in the general population (Carrion et al., 2009; Edmiston et al., 2011; Hanson et al., 2010; Kelly et al., 2013), (2) linked with increased risk of psychosis (Barrigon et al., 2015; Thompson et al., 2014) and (3) has been found to be a predictor of left hippocampal and right amygdala volumes in FEP (Hoy et al., 2012). Evidence further suggests that smaller amygdala volume acts as a mediator between childhood trauma and poor cognitive functioning in FEP (Aas et al., 2012). The heritability of psychosis is estimated at approximately 40%; thus, environmental factors, and moreover gene–environment interactions, play a significant role in the susceptibility for, and progression of, psychotic illness (Van Os et al., 2010). Therefore, it will be important for future research to examine the slope of brain changes over time in conjunction with discrete phenotypic and epigenetic changes while accounting for various extenuating factors and without being bound by Diagnostic and Statistical Manual of Mental Disorders or International Classification of Diseases diagnoses, an approach that will lend itself well to the clinical staging model.
Concluding remarks
Broadly, structural neuroimaging data thus far support the behavioural and clinical literature attesting to a critical window for targeted intervention in the clinical ‘ultra high risk’ phase. It is hoped that the evidence from longitudinal neuroimaging of the early psychosis stages incites a sense of urgency for applying the right clinical treatment at this early illness stage. In addition, the initial knowledge that brain changes can occur in such a small time-frame (i.e. within 6–12 months) suggests future research should aim to (1) better characterise the trajectories of brain changes, (2) identify precipitators and mechanisms driving brain changes, (3) identify what the ‘right’ treatment would be and how such treatment would affect the brain and illness outcomes and (4) identify non-treatment-related ‘protective’ factors that lead to amelioration of symptoms or deficits, and which are associated with improved brain indices. To conclude by reflecting on our initial key questions, certain brain structural abnormalities do appear to be illness stage specific, which results in brain changes over time and hence across illness stages, as appearing progressive in nature for some regions, but not for others. Therefore, it is possible that within a clinical staging model in the future, altered neurodevelopmental pathways could potentially identify an individual at risk of a psychotic disorder or of developing specific psychiatric symptoms later in life, and for individuals already suffering from an early-stage illness, neural abnormalities may be predictive of progressing to later and more severe illness stages and/or of treatment responsiveness. Further research is needed in this area and should examine how structural brain changes may work in relation to other biological, genetic, behavioural and environmental factors, to better predict illness outcomes and inform clinical practice.
Footnotes
Declaration of Conflicting Interests
The author(s) declared no potential conflicts of interest with respect to the research, authorship and/or publication of this article.
Funding
C.P. was supported by a National Health and Medical Research Council of Australia (NHMRC) Senior Principal Research Fellowship (628386 and 1105825) and a Brain and Behavior Research Foundation (NARSAD) Distinguished Investigator Award (US; Grant ID: 18722). P.D.M. currently receives research support from NHMRC and the Colonial Foundation. He has also received grant funding from NARSAD and unrestricted research funding from Astra Zeneca, Eli Lilly, Janssen-Cilag, Pfizer and Novartis, as well as honoraria for educational activities with Astra Zeneca, Eli Lilly, Janssen-Cilag, Pfizer, Bristol Myer Squibb, Roche and the Lundbeck Institute. V.C. was supported by an NHMRC Training Fellowship (ID: 628880) and University of Melbourne Fellowship. M.D.B. was supported by the Rotary Health Ian Scott PhD Scholarship in Mental Health. C.W. was supported by a Cooperative Research Centres for Mental Health Scholarship.