
Abstract
Importance:
In the absence of a comprehensive neural model to explain the underlying mechanisms of disturbed circadian function in bipolar disorder, mathematical modeling is a helpful tool. Here, circadian activity as a response to exogenous daily cycles is proposed to be the product of interactions between neuronal networks in cortical (cognitive processing) and subcortical (pacemaker) areas of the brain.
Objective:
To investigate the dynamical aspects of the link between disturbed circadian activity rhythms and abnormalities of neurotransmitter functioning in frontal areas of the brain, we developed a novel mathematical model of a chaotic system which represents fluctuations in circadian activity in bipolar disorder as changes in the model’s parameters.
Design, Setting and Participants:
A novel map-based chaotic system was developed to capture disturbances in circadian activity across the two extreme mood states of bipolar disorder. The model uses chaos theory to characterize interplay between neurotransmitter functions and rhythm generation; it aims to illuminate key activity phenomenology in bipolar disorder, including prolonged sleep intervals, decreased total activity and attenuated amplitude of the diurnal activity rhythm. To test our new cortical-circadian mathematical model of bipolar disorder, we utilized previously collected locomotor activity data recorded from normal subjects and bipolar patients by wrist-worn actigraphs.
Results:
All control parameters in the proposed model have an important role in replicating the different aspects of circadian activity rhythm generation in the brain. The model can successfully replicate deviations in sleep/wake time intervals corresponding to manic and depressive episodes of bipolar disorder, in which one of the excitatory or inhibitory pathways is abnormally dominant.
Conclusions and Relevance:
Although neuroimaging research has strongly implicated a reciprocal interaction between cortical and subcortical regions as pathogenic in bipolar disorder, this is the first model to mathematically represent this multilevel explanation of the phenomena of bipolar disorder.
Introduction
Bipolar disorder is a chronic psychiatric condition characterized by deficits in many cognitive and regulatory functions (López-Muñoz et al., 2006; McKenna et al., 2014). Although the neurobiology of bipolar disorder is poorly understood, several lines of evidence support the idea of abnormalities in structure and/or function at many levels of the nervous system (Davidson et al., 2002; Goldbeter, 2011; Huber et al., 2000; Sanacora et al., 2012). One of the strongest domains of evidence relates to neurotransmitter function, with abnormalities in γ-aminobutyric acid (GABA) and glutamatergic pathways strongly implicated (Benes and Berretta, 2001; Berk et al., 2011; Davidson et al., 2002; Tretter et al., 2011; Veldic et al., 2007). A range of research also points to pathogenesis in the circadian system and abnormal patterns of corticocortical and subcortical connectivity (Anticevic et al., 2013; Harvey, 2011; Harvey et al., 2011; Leow et al., 2013; Meda et al., 2012; Salvatore et al., 2012; Strakowski et al., 2012).
The neuronal system composed of neurons and gliocytes is exquisitely sensitive to external forcing and internal shifts in functional parameters, strongly suggesting that an adequate explanation will include the dynamical properties of chaotic systems (Baghdadi et al., 2015; Crevier and Meister, 1998; Falahian et al., 2015; Faure and Korn, 2001; Jafari et al., 2013a, 2013b, 2013c; Jansen, 1991; Korn and Faure, 2003; Molaie et al., 2014; Preissl et al., 1996; Pritchard and Duke, 1995; Schiff et al., 1994).
Here, we sought to develop a mathematical model to investigate dynamical aspects of the correlation between apparently irregular circadian activity rhythms and abnormalities in neurotransmitter functioning. The model entails a field of real-valued properties extended over time, ruled by a set of coupled recurrent maps in a neuronal network fashion (Baghdadi et al., 2015). The proposed net is composed of several discrete dynamical systems (maps), in which each state is determined according to the states in previous finite time intervals (Hilborn, 2000). The map-based modeling approach captures recursive features of the system and seems to have potential to capture the inherently recurrent pattern of circadian activity.
From the perspective of nonlinear dynamics, the pulse train observed in normal circadian activity can be mathematically explained by occurrence of ‘intermittency’ close to the edge of chaos in the periodic window of a nonlinear dynamical system (Hilborn, 2000). Specifically, in a normal state, the trajectory of the circadian activity pulse mainly moves through a periodic cycle, but sometimes may deviate from the cycle for short periods under the influence of a strange attractor. Therefore, triggered by the daily cycle, pulse durations and sleep time intervals in circadian activity might vary somewhat, but the pulse train remains primarily periodic. In bipolar disorder, by contrast, the trajectory of circadian activity moves through a low-dimensional strange attractor and away from the periodic window. As a consequence, the long-term pattern of circadian activity pulse train in bipolar disorder seems less dependent on exogenous daily cycles and exhibits chaotic rather than ordered dynamics. Based on this paradigm, we propose that a simple model of a nonlinear dynamical system with a periodic window within an area of wild behaviors can characterize the abnormal circadian rhythm regulation observed in bipolar disorder.
We used this framework to develop a novel model of a chaotic system which mathematically represents the fundamentally irregular time series of circadian activity in bipolar disorder through changes in the model’s parameters. The model suggests that the complex pattern of circadian activity in bipolar patients can be denoted as discrete variables generated through a pulse generation formalism which is highly regulated by interactions with higher cognitive processes. In the model, the amplitude and duration of the active phase of the circadian activity rhythm are modulated by the degree of cognitive impairment arising from neuronal interplay between excitatory and inhibitory networks in prefrontal areas. As detailed below, the model uses chaos theory to characterize interplay between neurotransmitter functions and rhythm generation; it aims to illuminate key activity phenomenology in bipolar disorder, including prolonged sleep intervals, decreased total activity and attenuated amplitude of the diurnal activity rhythm. An advance over previous mathematical research into the time course of bipolar disorder (Daugherty et al., 2009; Goldbeter, 2011; Hadaeghi et al., 2015; Huber et al., 2000) was the use of objective actigraphy data to test the model’s predictions about diagnosis-related differences in circadian activity.
Model
The brain basis of bipolar disorder is complex, involving multiple pathways. A range of research suggests that pathological competition between electrical activity generated by excitatory (glutamatergic) and inhibitory (GABAergic) frontal circuits is a key pathogenic pathway to bipolar disorder (Benes and Berretta, 2001; Berns and Nemeroff, 2003; Davidson et al., 2002; Duman, 2002; Montague et al., 2012; Tretter et al., 2011). Similarly, there is growing consensus from neuroimaging research that bipolar disorder involves impaired connectivity between the frontal cortex and lower brain regions involved in emotion processing (Baghdadi et al., 2015; Davidson et al., 2002; McKenna et al., 2014; McKenna and Eyler, 2012). Consequently, a core logic in the present mathematical model is that a lower pulse generation network is modulated by the nonlinear dynamics arising from a cortical network (Figure 1). Specifically, the model asserts that adjusting control parameters of the cognitive block leads to periodic, chaotic and intermittent behaviors.
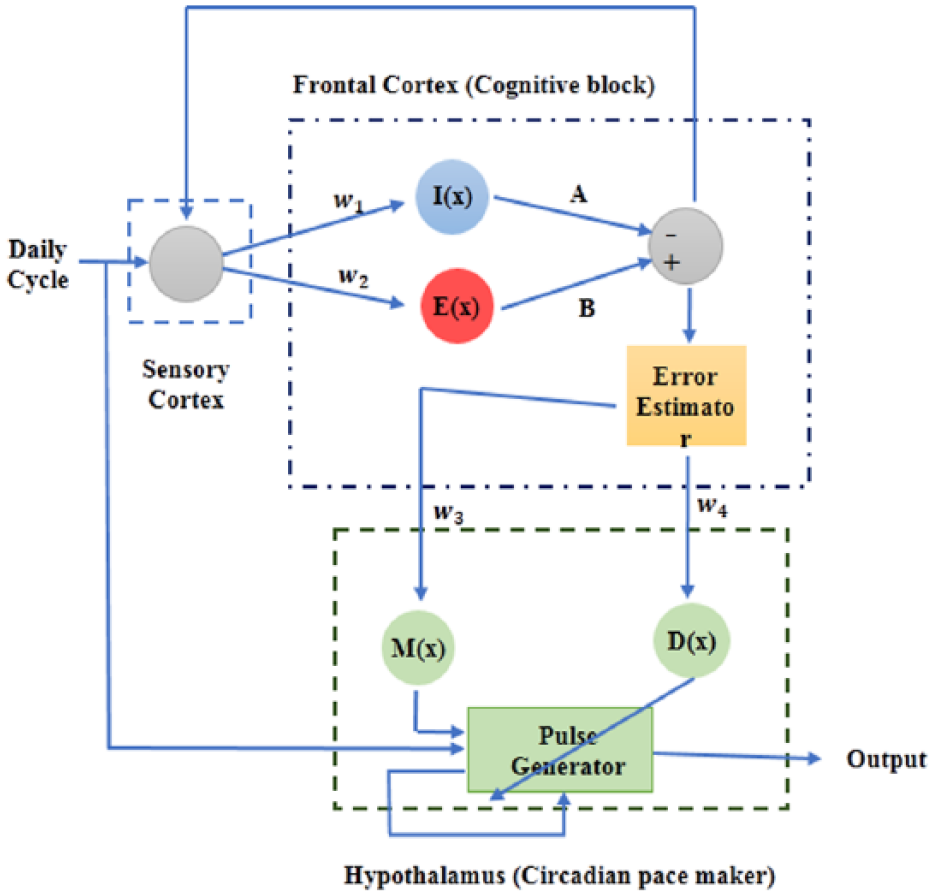
Schematic representation of the proposed complex system. Cortical cognitive processing and subcortical circadian pacemaker are building blocks of the system. Excitatory and inhibitory pathways in cortical level are, respectively, represented by B* and A*I(w1x) using the tangent hyperbolic activation functions. At each instance, the summing junction of these functions, i.e.,
Cognitive processing unit
The primary cognitive network in Figure 1 illustrates the interaction between two excitatory and inhibitory pathways spatially spread over the frontal cortex and varying on a daily timescale. As a result of interactions among these neurons, various complex behaviors can emerge in the system’s long-term dynamics. To investigate the role of weighted excitatory and inhibitory units in the cognitive process, we chose to mathematically represent the activation functions of each neuronal population via a hyperbolic tangent function so that

In this formalism, the coefficients,
As mentioned above, we assume that normal circadian activity has a trajectory close to the edge of chaos in the periodic window of a nonlinear dynamical system. Therefore, using the products of this network, at a given point of time, an error estimator unit calculates the deviation of the trajectory from the edge of chaos and sends this signal to regulate the parameters in the circadian pacemaker block. As stated in equation (2), working at the edge of a period- p window, at each time instance, absolute difference between the current sample and the pth sample ahead provides the error signal, e(n)
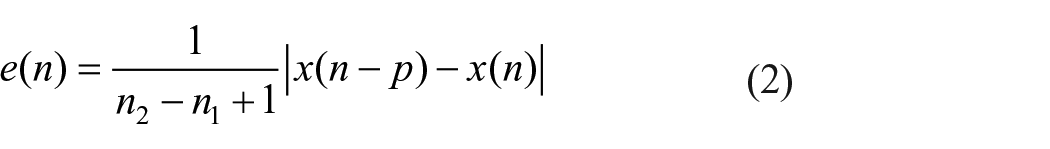
where n1 and
Circadian pacemaker
The proposed circadian pacemaker includes two populations of neurons. Regarding the output of the error estimator, the primary cortical network regulates the duty time and the amplitude of coming pulse generated by the secondary subcortical network, which works at the timescale of hours. To model the adaptive pulse generator unit, we chose to use a version of the Rulkov recurrent map which has been proposed to mathematically realize the action potential restitution curve in ventricular cardiac cells (Rulkov, 2007). The most fascinating feature of this model is its ability to adjust the action potential duration through changes in its parameters.
In our proposed model, each low to high transition of the daily cycle triggers a two-dimensional Rulkov map to generate a pulse through the following computational formalism
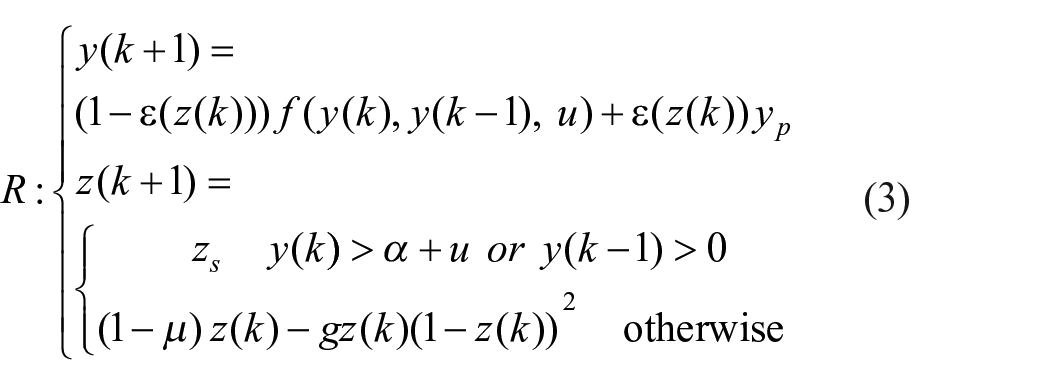
where
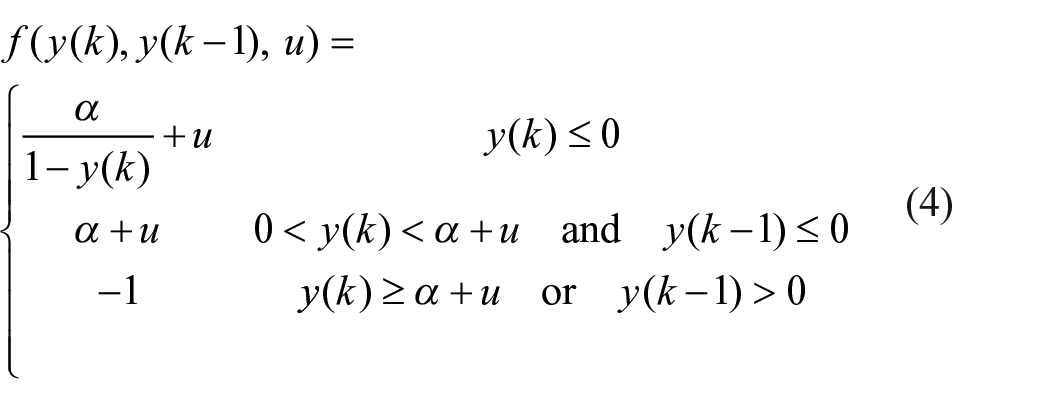
in which, u = β + Iext is a linear combination of the external trigger, Iext
At each daily iteration,
In healthy subjects, the control parameters in the cognitive block are regulated so that the balance between excitatory and inhibitory pathways results in a smaller error signal and consequently, the output circadian rhythm time series is largely periodic. The amplitude of activation during the duty cycle would also vary somewhat around a normal value.
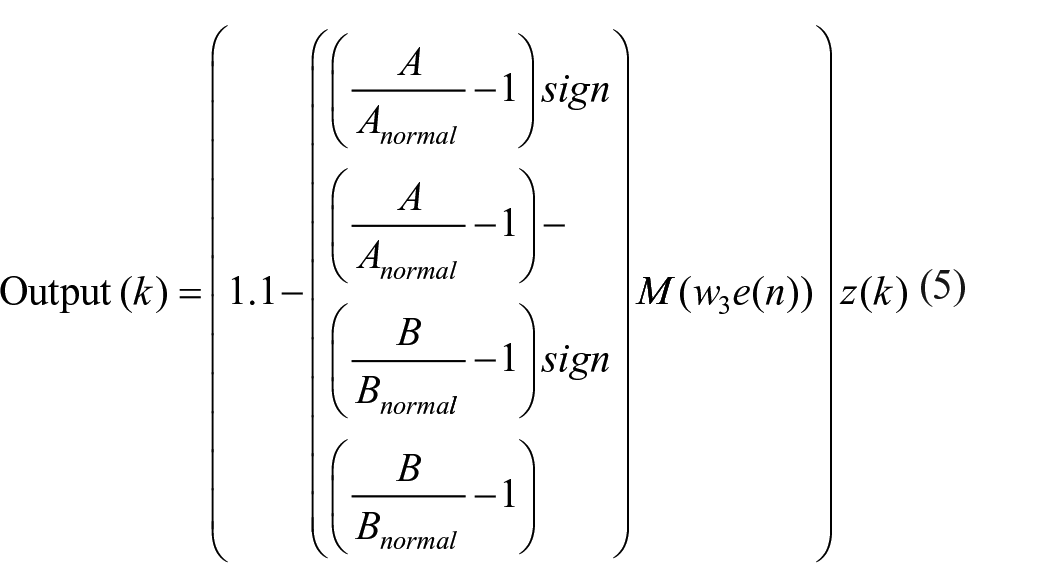
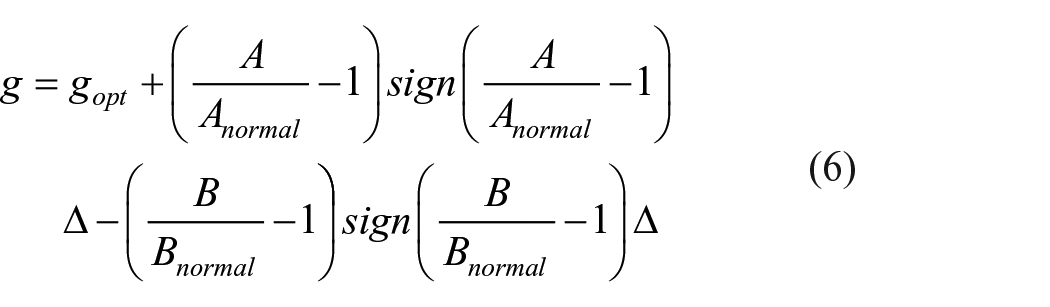
In people with bipolar disorder, however, the deviation from the edge of chaos results in a perturbation in the control parameter, g, which directs the system into aperiodic circadian activity rhythms. Equation (6) gives the mathematical expression of the new value of g following the deviation
In depressive episodes, for example, domination of inhibitory neurotransmitters (i.e.
Results
The proposed model is grounded on a simple map (equation (1)) with a few control parameters whose values mainly determine the emergent behavior of the system. In this section, we discuss how any change in the level of activity in excitatory and inhibitory neuronal populations may disturb sleep/wake time intervals and the amplitude of circadian activity. The results of simulations are represented in terms of activity traces (activity versus time) which can be simply compared with the experimental data. Taking advantage of previously collected actigraph data (Indic et al., 2011), the performance of the proposed model will also be evaluated.
Normal state
In a normal state, as a consequence of an approximately stable balance between excitatory and inhibitory activities in neuronal pathways, a relatively regular sleep/wake activity pattern would be captured. We assumed that such a behavior can be mathematically explained through the concept of intermittency occurrence at the edges of a periodic window. Therefore, considering a fixed value of the coefficients,
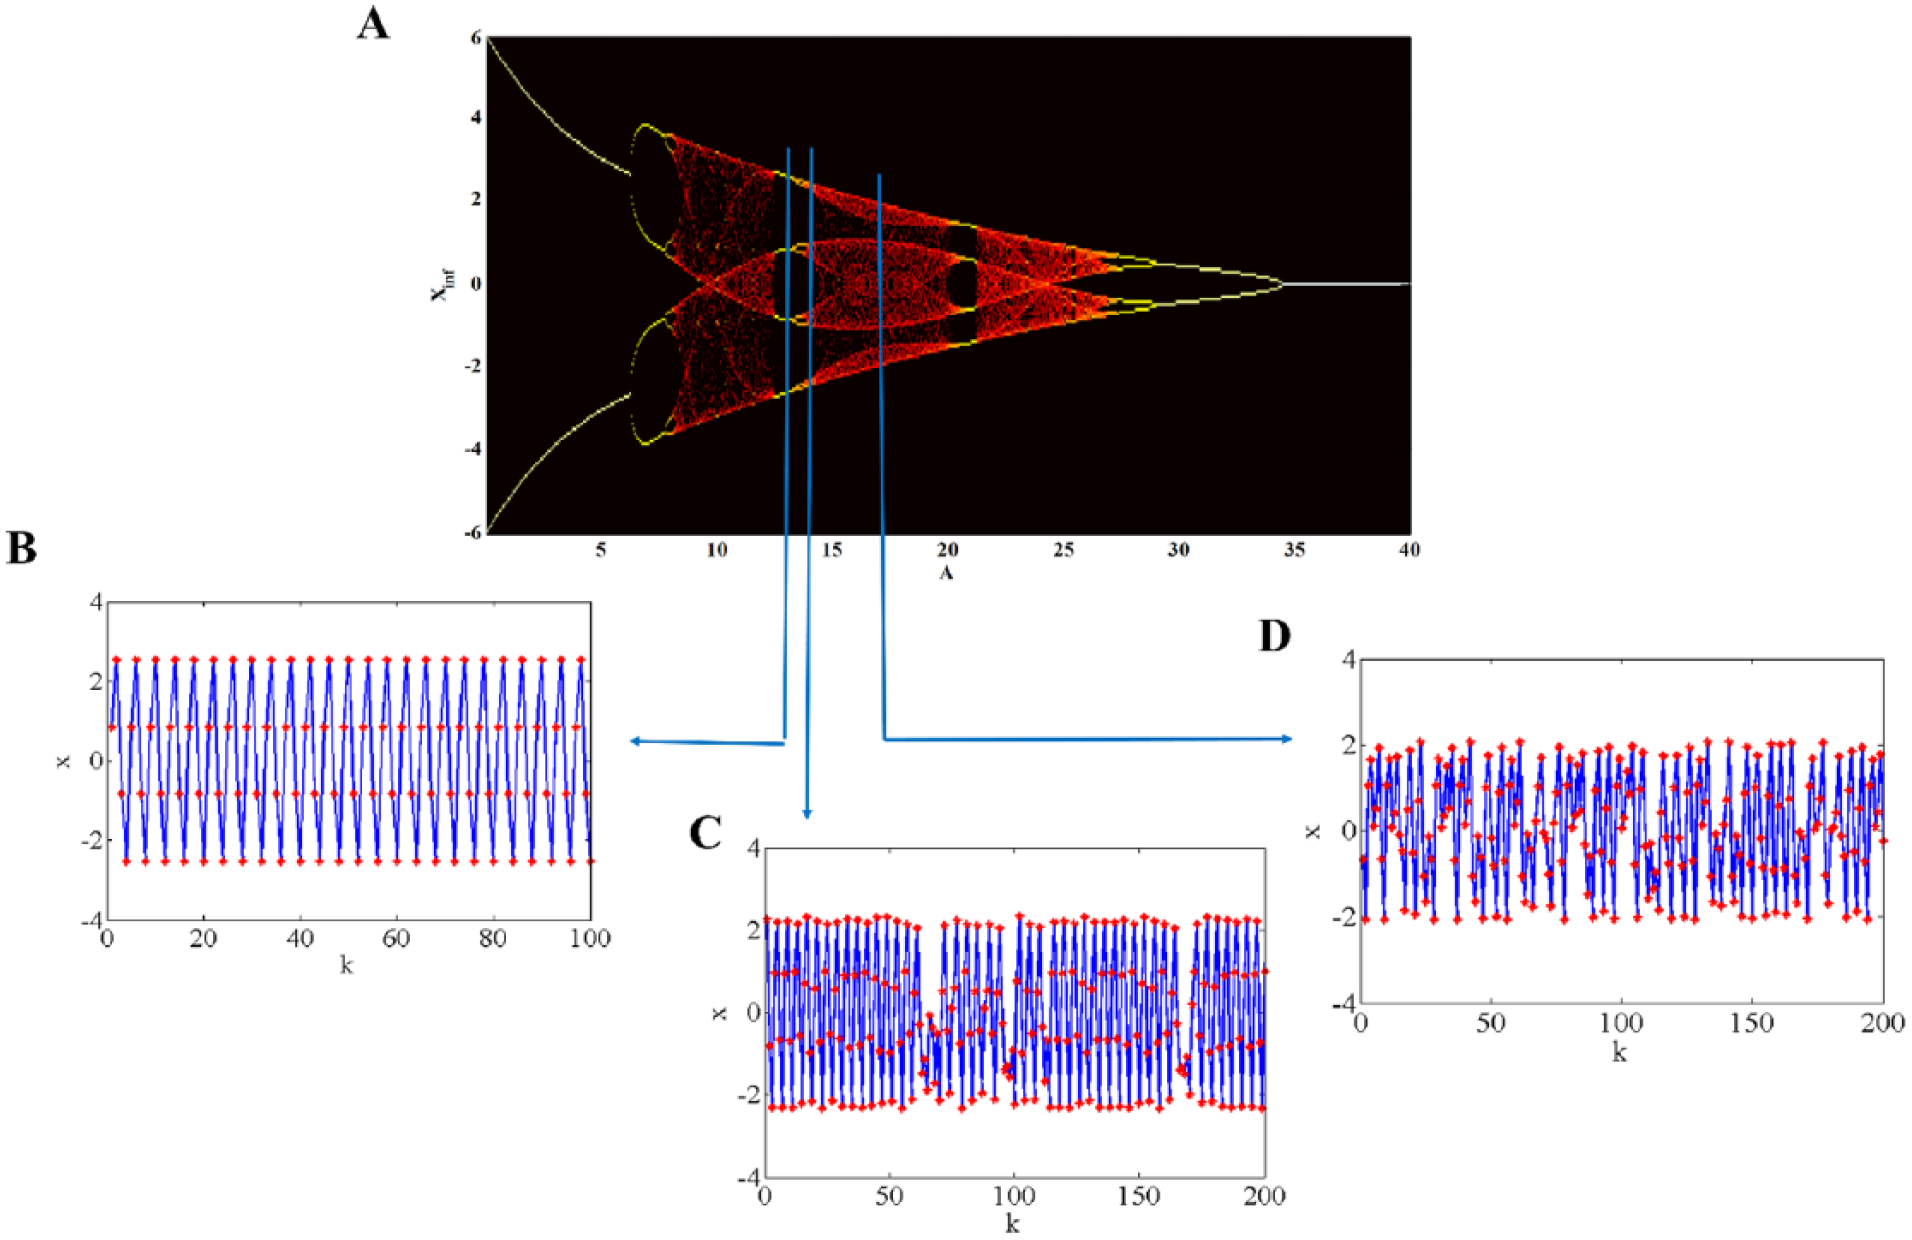
(A) Bifurcation diagram of the cognitive block of the model by varying the inhibitory parameter, A for w1 = 1.487, w2 = 0.2223, B = 5.82. The vertical axis shows the attractor sets of the variable x at different values of the inhibitory parameter. Examples of patterns arising from various conditions such as (B) stability (e.g. at A = 13.6, (C) intermittency (e.g. at A = 14.8) and (D) chaotic area (e.g. at
Similarly, considering fixed values of the coefficients,
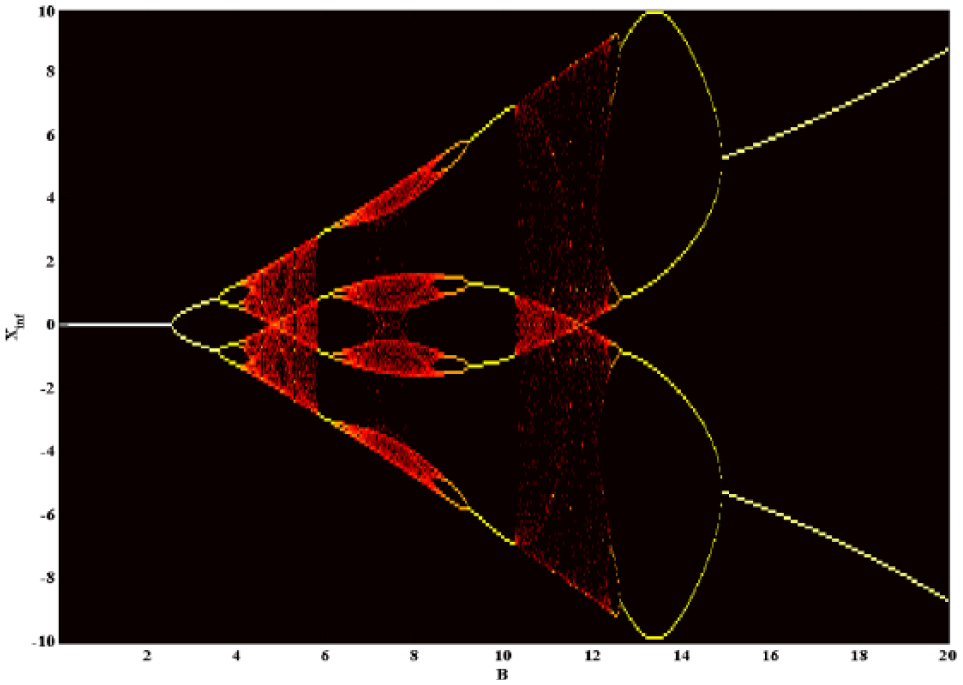
Bifurcation diagram of the cognitive block of the model by varying the excitatory parameter, B, for w1 = 1.487, w2 = 0.2223, A = 14.47. The vertical axis shows the attractor sets of the variable x at different values of the excitatory parameter.
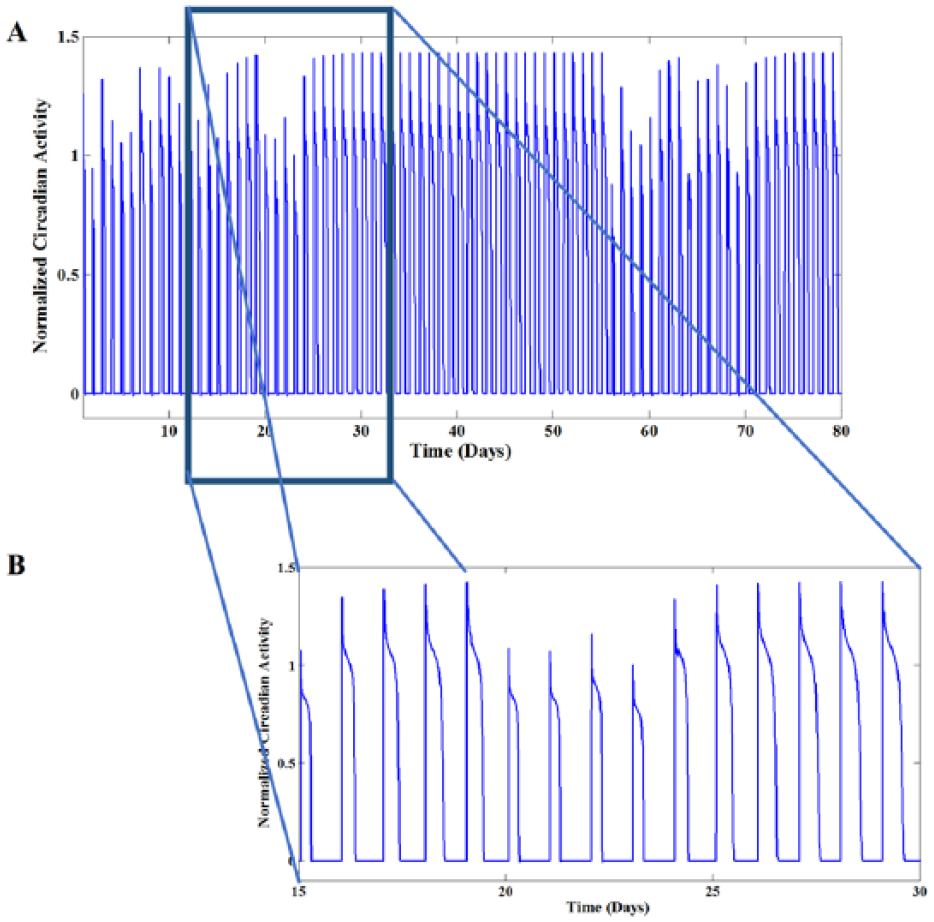
(A) Apparently rhythmic circadian activity in 80 days at normal state (the output of hypothalamic pacemaker). Simulation was performed by setting the inhibitory and the excitatory coefficients at the edge of chaos (i.e.
Bipolar episodes
In the two extreme states of bipolar disorder (depression and mania), domination of one of two interacting circuits in the cognitive block increases the level of error (in a negative or positive direction) and lengthens or shortens the duty cycle and the amplitude of circadian activity. For example, in the state of depression, inhibitory network domination (e.g.
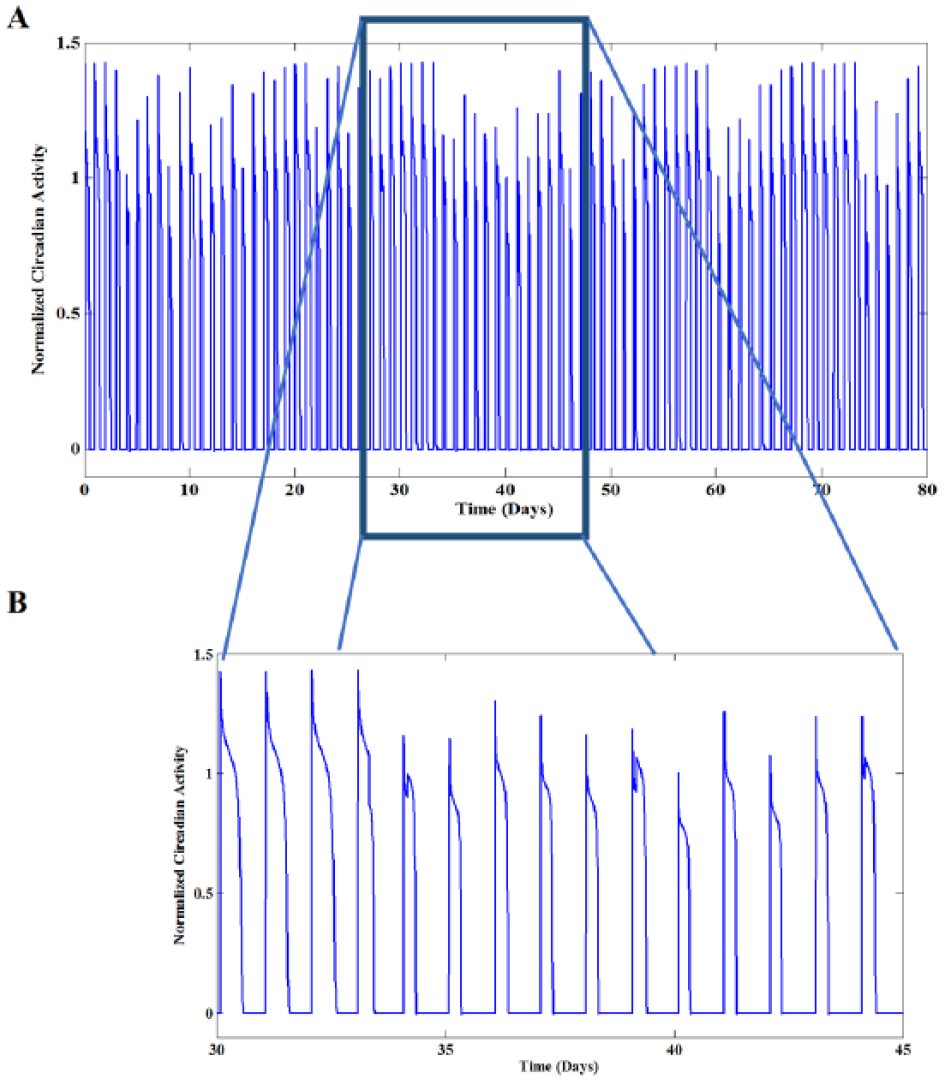
A) Low-dimensional chaos in circadian activity in 80 days at depression episode. B) Magnification of 15 days activity emphasized by blue box in A. In comparison with the normal state, duty cycles are significantly shorter, and the amplitudes are smaller as well. Numerical simulation was performed by setting the inhibitory coefficients at the chaotic area of bifurcation diagram which was previously illustrated in Figure 2 (i.e. A = 16.47. The other parameters are as follows:
In contrast, increase in the authority of excitatory pathways in manic episodes would be replicated in the model through increase in the excitatory parameter, B or decreasing the inhibitory coefficient, A. In this situation, in reaction to the daily cycles, the system shows chaotic fluctuations which tend to increase the duration and the magnitude of activity during the wake period (see Figure 6).
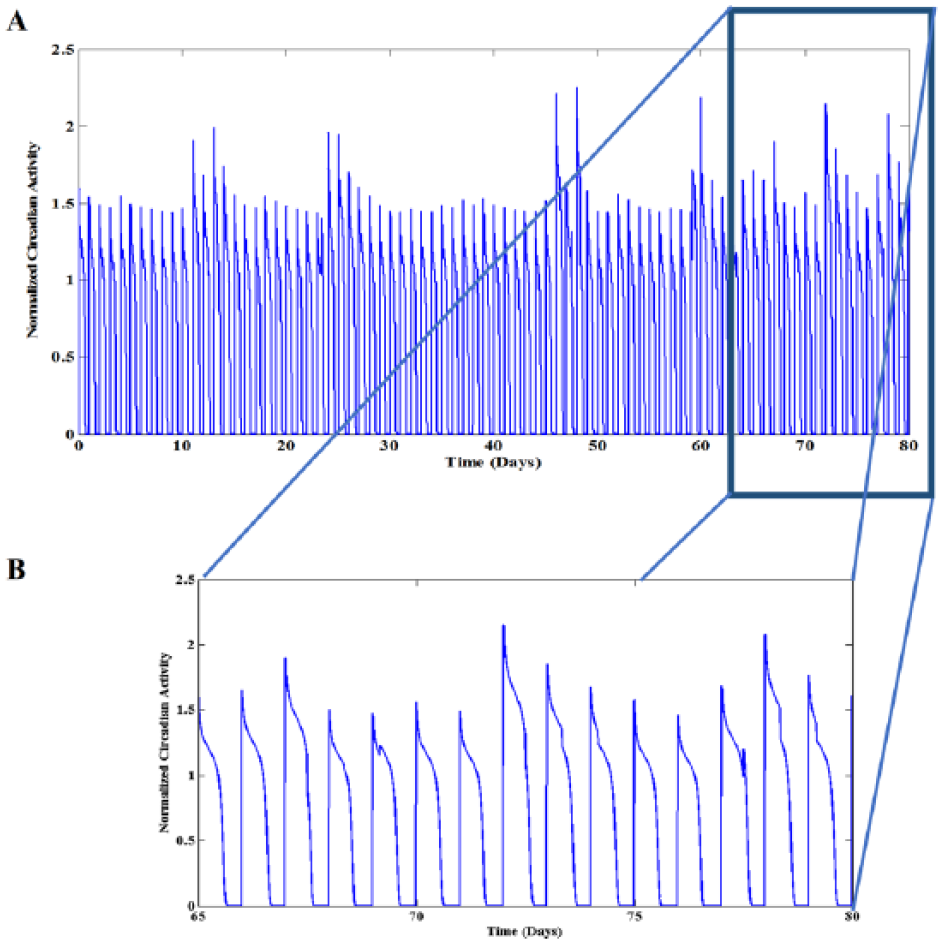
A) Low-dimensional chaos in circadian activity in 80 days at manic episode. B) Magnification of 15 days activity emphasized by blue box in A. In comparison with the normal state, duty cycles are significantly longer, and the magnitudes are greater as well. Numerical simulation was performed by setting the excitatory coefficients at the chaotic area of bifurcation diagram which was previously illustrated in Figure 3 (i.e. B = 7.65). The other parameters are as follows: w1 = 1.487, w2 = 0.2223, w3 = 0.1, w4 = 1, a = 3.2, µ = 0.002, zs = 1.3, gopt = 0.3, yp = -0.8, yth = 0.01, A = 12.47
Comparison with experimental data
The hypothalamic suprachiasmatic nucleus (SCN) is central to biological rhythms’ regulation and a key node in the temporal dynamics of locomotor activity (Harvey, 2011; Harvey et al., 2011; Indic et al., 2011). Several studies have now explored multiscale features of locomotor activity in bipolar disorder, interpreting these features to reflect underlying abnormalities in the SCN control node (e.g. Indic et al., 2011). Consequently, to test our new cortical-circadian mathematical model of bipolar disorder, we utilized previously collected locomotor activity data recorded from normal subjects and bipolar patients by wrist-worn actigraphs (Indic et al., 2011).
As reported previously (Indic et al., 2011), participants were clinically euthymic, medicated patients diagnosed with type-I bipolar disorder by DSM-IV criteria (n = 15; 46.7% female; age M = 46.9) and healthy controls with no past or current mental illness, matched approximately for sex and age (n = 15; 46.7% female; age M = 46.8). Both groups wore a Mini-Mitter actigraph on their nondominant wrist continuously for 7 days.
Real data were preprocessed for analysis by removing high-frequency noise from the normalized signal. Extracting the corresponding rhythm for a scale of 23.8 hours (red line in Figure 7(A) and (B)), the resulting time series, say
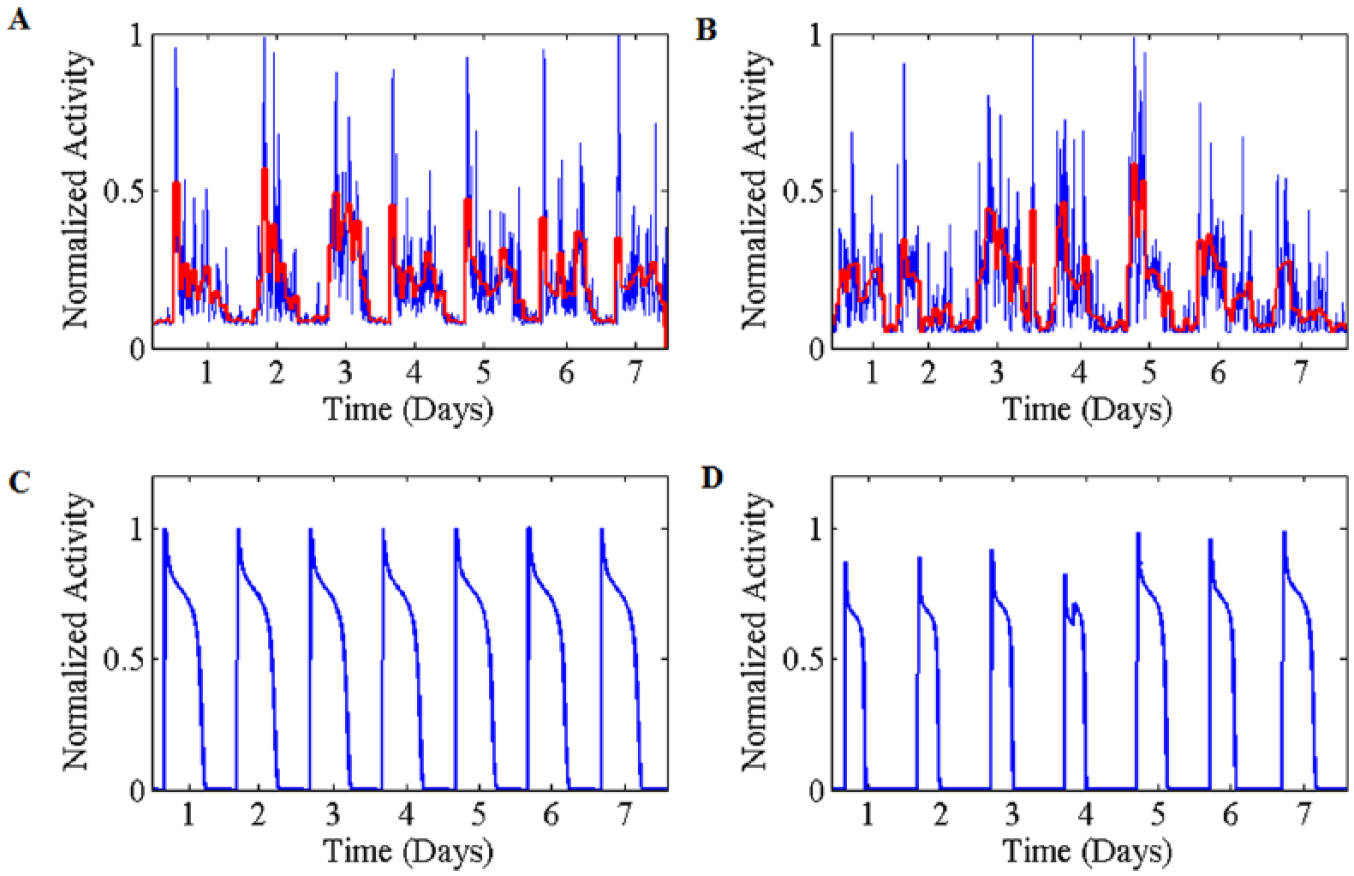
A schematic comparison of the real data and the output of the model. (A) Time series and the corresponding rhythm for a scale of 23.8 hours (red line) of a 7-day-actigraphy record from a healthy person. (B) The same time series and rhythm for a record from euthymic bipolar patient. (C) Time trace obtained from simulation with the coefficients at their optimum levels. (D) Time trace obtained from simulation with the state of high values of inhibitory neurotransmitters. The parameters in theses simulations are same as those for Figures 4 and 5.
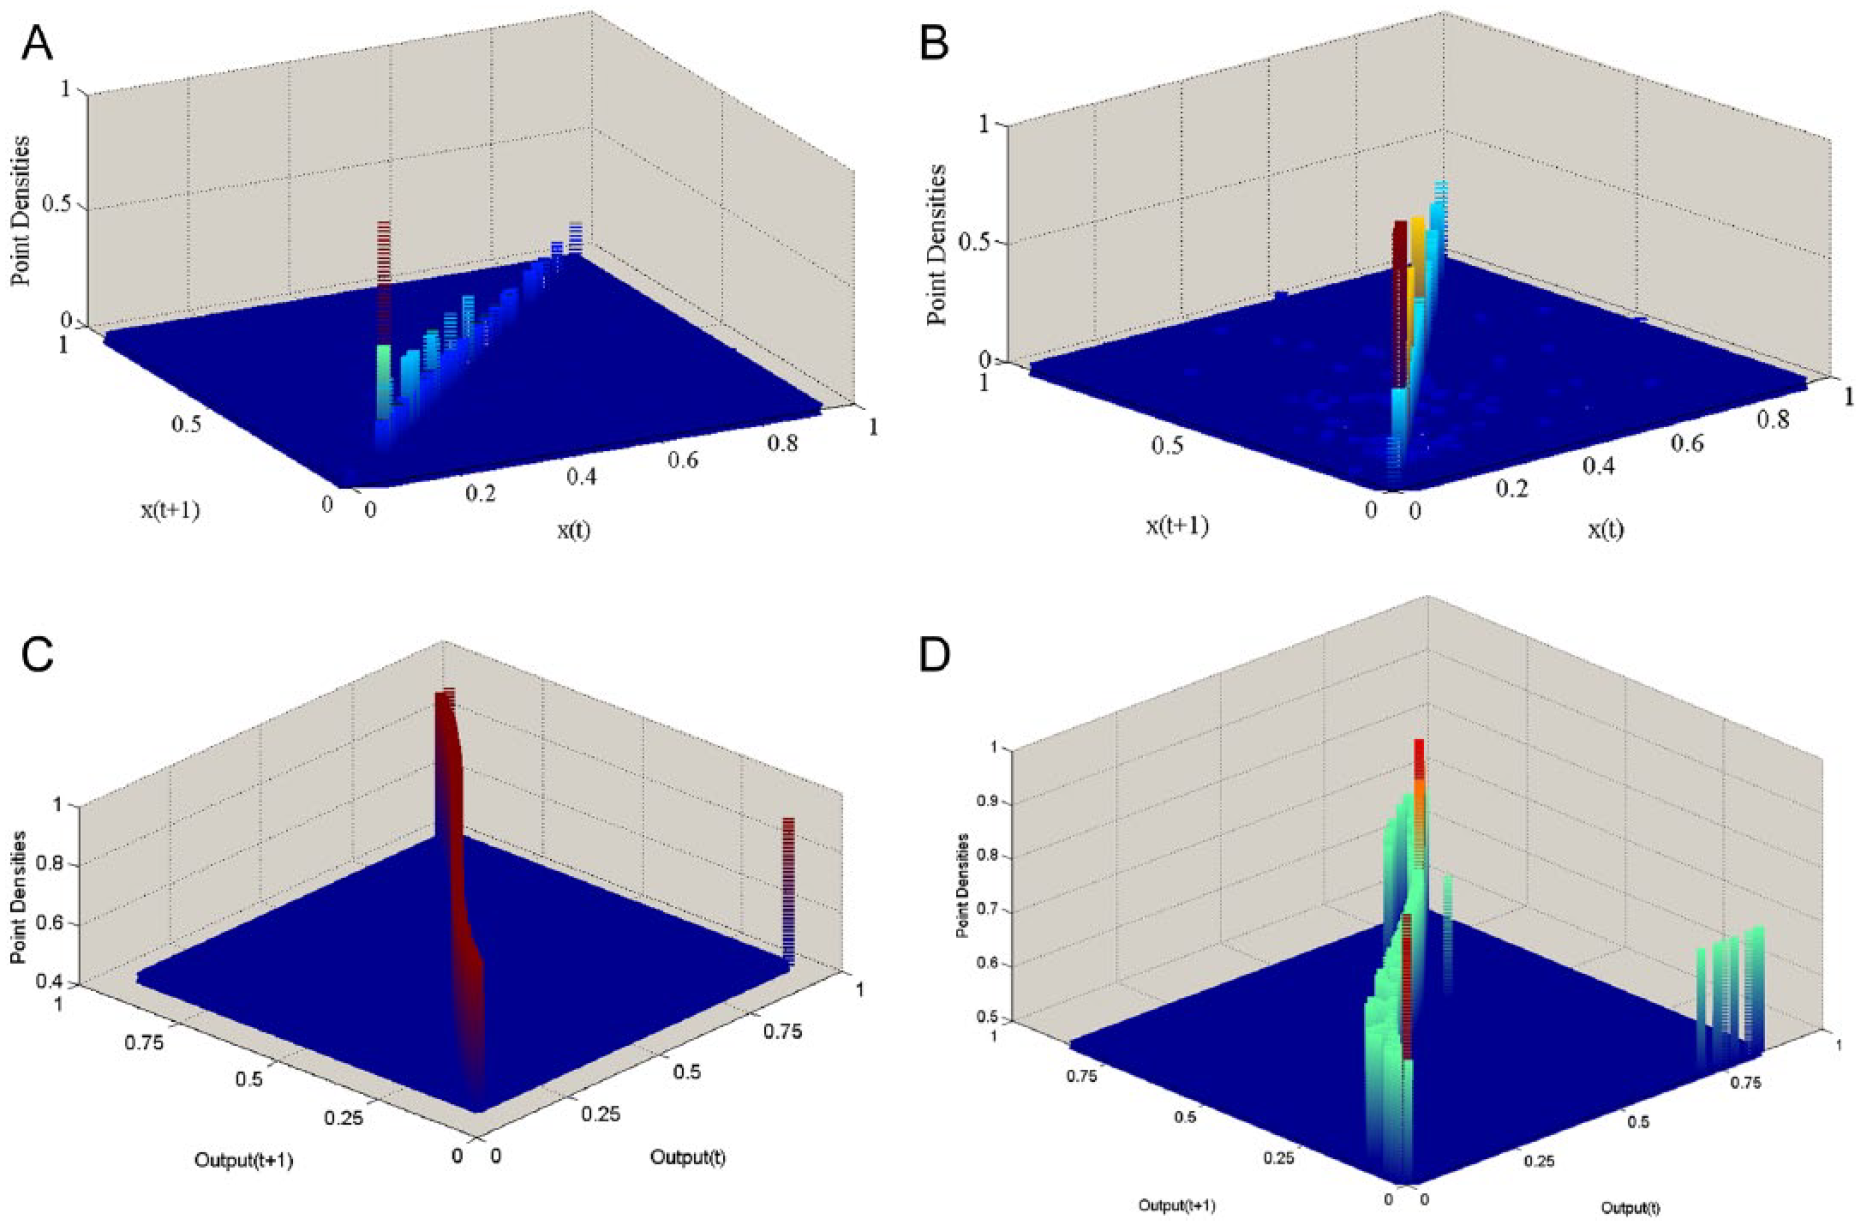
A schematic comparison of the real data and the output of the model. (A) Color map of point densities in phase space of a 7-day-actigraphy record from a healthy person. (B) The same color map for a record from euthymic bipolar patient. (C) Color map of simulated point densities in phase space of 7 days with the coefficients at their optimum levels. (D) Color map of simulated point densities in phase space of 7 days with the state of high values of inhibitory neurotransmitters. The parameters in theses simulations are same as those for Figures 4 and 5.
The same discrete space can be replicated using the output of the proposed model. As illustrated in Figure 7(D), adjusting the control parameters led to the sleep time interval dominating the output time series relative to wake. Figure 8(C) shows the color map of simulated data in such a situation. In contrast, setting the control parameters to their optimum values, Figures 7(D) and 8(D), respectively, illustrate the time trace and color map of point intensities in the discrete space generated by the model in a normal state.
Discussion
In the absence of a comprehensive neural model to explain the underlying mechanisms of disturbed circadian function in bipolar disorder, mathematical modeling is a helpful tool (Harvey, 2011; McKenna et al., 2014). Here, circadian activity as a response to exogenous daily cycles is proposed to be the product of interactions between neuronal networks in cortical (cognitive processing) and subcortical (pacemaker) areas of the brain. We developed a novel map-based chaotic system which can capture chaotic disturbances in circadian activity across the two extreme mood states of bipolar disorder. In contrast to previous mathematically based studies of bipolar disorder (Daugherty et al., 2009; Goldbeter, 2011; Hadaeghi et al., 2015; Huber et al., 2000), we were able to test the model in comparison with real activity data collected by actigraphy from healthy subjects and euthymic bipolar patients. Actigraphy has been previously used to index the function of core-control nodes in the timing of behavior.
We believe that the model proposed here has qualities not present in existing mathematical models of bipolar disorder. The model of Goldbeter (2011) is based on the assumption that levels of particular neurotransmitters or electrical activities generated by two neural circuits lead the system to two potential steady states of mania and depression (steady states are points, rather than strange attractors). The system is modeled by a 4-order ordinary differential equation (ODE) in which the transition from bistability to periodic oscillations is achieved by mutual inhibition of depression and mania variables while each of these two variables inhibits itself indirectly. The model is deterministic and can only capture periodic patterns (albeit with a variety of waveforms): clearly, this model fails to capture the erratic course that typifies bipolar disorder. Furthermore, the model represents the system as thermodynamically closed and therefore, does not account for unpredictable life events or exogenous stimuli.
The model of Huber et al. (2000) proposes a system of a pair of excitatory and a couple of inhibitory units with different activation patterns. The temporal state of mood is then described by an ODE in which the recurrent nature of the illness is represented as positive feedback. Control parameters reflecting the interactions among the agents are assumed to be fixed, and the impact of exogenous events is imported into the model as stochastic Gaussian white noise with zero mean. The model includes a control parameter which changes dynamically and brings the system to monostability, bistability and transitions between these stable states. This control parameter successfully generates a variety of chaotic and aperiodic patterns, but lacks a counterpart in real-world neurobiology. A final limitation of both Goldbeter and Huber is the reliance on ODE, which brings several analytic and computational constraints.
Relying on the competition paradigm in a set of discrete systems, our previously proposed model (Hadaeghi et al., 2015) could replicate the monostable states corresponding to the defining manic and depressive episodes of bipolar disorder, in which one of the two neurotransmitter competitive circuits is dominant. In the proposed paradigm, a winnerless competition process can drive the system to periodically or chaotically switch between these monostable states.
Here, the core of our systemic model is a cognitive network which reflects the interactions among excitatory and inhibitory pathways in prefrontal areas involved in cognitive and emotional processing. These internal interactions are highly sensitive to both the level of electrical activity generated by neurotransmitter pathways and the variation in synaptic concentrations of different neurotransmitters. Importantly, these two interacting factors might be changed during cognitive, emotional, decision-making or attentional functions. In the proposed model, a tangent hyperbolic activation function was utilized to mathematically represent dynamical activity in the involved neuronal populations while the weight coefficients symbolize the synaptic concentrations. On producing an error signal, the cognitive processing block regulates a pacemaker neuronal network. A pulse generation paradigm based on the Rulkov nonchaotic map was utilized to represent the internal procedure of adaptive pulse generation, the output of which is circadian rhythmic activity.
The model can successfully replicate deviations in sleep/wake time intervals corresponding to manic and depressive episodes of bipolar disorder, in which one of the excitatory or inhibitory pathways is abnormally dominant. In the proposed model, all control parameters have an important role in replicating the different aspects of circadian activity rhythm generation in the brain. For example, our simulations show that deviation from the optimum level of inhibitory or excitatory activity in the prefrontal cortex may disturb rhythm regulation in the SCN.
While our proposed model is conceptually consistent with these important models, following the idea of competition between neurotransmitter pathways, the model replicates the fundamental irregular time series of circadian fluctuations in bipolar disorder. It is worth mentioning, however, that the model as currently configured does not account for the mixed depressive/manic syndromes of bipolar illness.
The model proposed here is the first attempt at a coherent computational framework to explain abnormal circadian activity rhythms in the context of the abnormal cognitive functioning seen in bipolar disorder. Neuroimaging research has strongly implicated the reciprocal interaction between cortical and subcortical regions as pathogenic in bipolar disorder, but to our knowledge, this is the first model to mathematically represent this multilevel explanation of the phenomena of bipolar disorder. Not only is our proposed model consistent with the main concepts discussed in important behavioral models of mood disorder, but it is also developed using real data derived from actigraphy: actigraphy generates a unique noninvasive high-resolution time series which reflects the activity of core-control nodes in the timing of behavior. We also note that bipolar disorder has proven difficult to reliably diagnose (Malhi and Berk, 2015; Malhi et al., 2015), and models integrating classic neuroscience with recent advances in the mathematics of nonlinear systems to model biology may provide new solutions to longstanding nosological questions.
As with other human physiological functions, regulatory mechanisms across orders of magnitude in space and time are involved in adjusting daily motility rhythms. Modeling the information and dynamics from one scale to another is therefore critical for understanding the complex temporal phenomenology of daily motility rhythms as the outcome measure of mood episodes in bipolar illness. Mathematical approaches are therefore a critical complement to biological experiments as we attempt to bridge the gap between neuronal mechanisms at lower levels of the hierarchy and the complex temporal dynamics observed in behavioral data.
While the proposed phenomenological model is consistent with current physiological and behavioral findings in bipolar disorder, further empirical research is clearly required to empirically ground complex mathematical models such as this one. Testing the model in comparison with functional neuroimaging data would be an obvious next step. In the interim, we propose that the novel model introduced here warrants further investigation as a formal, neurobiologically plausible representation of the complex dynamics of bipolar disorder.
Footnotes
Declaration of Conflicting Interests
The author(s) declared no potential conflicts of interest with respect to the research, authorship and/or publication of this article.
Funding
The author(s) received no financial support for the research, authorship and/or publication of this article.