
Abstract
To the Editor
The frequency of rises in various parameters with clozapine-induced myocarditis has been reported, as well as the observation that rises in C-reactive protein (CRP) anticipate rises in troponin and any rise in eosinophil count is typically delayed (Ronaldson et al., 2010, 2011).
Data collected for a case–control study (Ronaldson et al., 2012) of myocarditis developing in patients commencing clozapine included all recorded diagnostic data for 109 cases and 299 controls. While no patient had daily diagnostic data, aggregated data could provide a picture of the evolution of troponin, CRP and eosinophil counts, including the inter-patient variation in these parameters.
Graphical presentation of the evolution of CRP, troponin I/T and eosinophil count for cases (Figure 1a–c) indicates the range of responses in terms of each of these parameters. In particular, some experience a very marked rise in eosinophil count (to >2.5 × 10⁹/L), while for others the increase is to a little above the upper limit of normal (ULN) (0.4–0.6 × 10⁹/L); however, some continue to have counts less than 0.1 × 10⁹/L, despite the development of myocarditis (Figure 1c). Moreover, around 90% of cases have an eosinophil count that does not exceed the ULN at the time of onset of myocarditis; the peak of any rise in eosinophil count is delayed by 7–8 days after cessation of clozapine for myocarditis (Figure 1c).
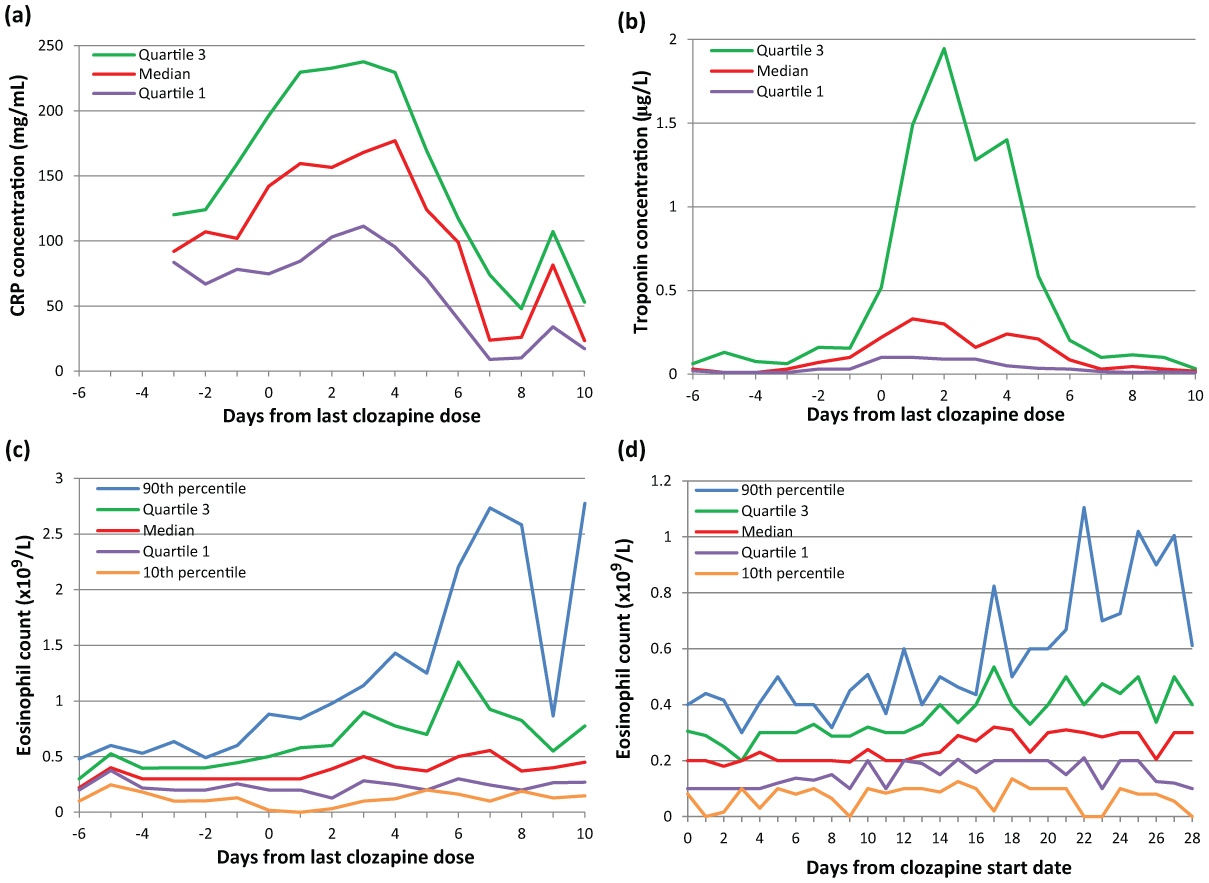
The evolution of (a) C-reactive protein (CRP), (b) troponin I/T and (c) eosinophil count with time in cases, using the day of the last dose of clozapine (stop date for myocarditis) as the reference. The precipitous drop in the 90th percentile for eosinophil count on day 9 arises from the lack of data from cases with high counts on that day. Descriptive statistics (mean ± standard deviation, range) for the number of results available for each day were: CRP 21 ± 14, 5–48; troponin I/T 29 ± 23, 7–83; eosinophil count 30 ± 19, 9–77. (d) The evolution of eosinophil counts (upper limit of normal 0.4–0.6 × 10⁹/L) in control patients using the day clozapine therapy was started as the reference. Descriptive statistics for the number of results available for each day: mean ± standard deviation 49 ± 25, range 17–104.
In relation to troponin results, the ULN varied widely (mean ± standard deviation 0.12 ± 0.15, median 0.05, range 0.01–0.6 µg/L) according to the sensitivity of the test. A criterion for case inclusion was a troponin result greater than or equal to twice the ULN. Hence, some cases did not attain very high absolute values for troponin (Figure 1b), but more than 30% had results in excess of 1 µg/L (Ronaldson et al., 2011). The graph also indicates that troponin rapidly normalised after withdrawal of clozapine.
A further observation from the graphical presentation is that CRP (ULN 5–10 mg/L) is typically raised above 50 mg/L at least 3 days before a rise in troponin is detected, and well before the peak in eosinophil count.
Most controls experience a rise in eosinophils (Figure 1d), but for only 30% the rise exceeds the ULN (Ronaldson et al., 2011). However, in about 10% a substantial rise occurs from 17 days following the commencement of clozapine.
Footnotes
Funding
This research received no specific grant from any funding agency in the public, commercial, or not-for-profit sectors.
Declaration of interest
Professor McNeil has received personal fees from Novartis Pty Ltd for participation in the Australian national Advisory Board for Clozaril (clozapine). The other authors report no conflicts of interest. The authors alone are responsible for the content and writing of this paper.