
Abstract

Keywords
Introduction
Publishing is a key measure of academic performance and an important determinant of career success. There is a cottage industry devising different methods to measure the impact of scientific publications and this has spawned controversy as to which method is best (Bornmann et al., 2011; Cleary et al., 2013; Panaretos and Malesios, 2009). The number of publications, the impact factor of the journal in which these are published and number of times publications are cited are all ‘measures’ used to evaluate scientific merit and the output of individual scientists. Two questions follow: Which is the best measure? And, how can an equitable comparison of impact be achieved between well-established scientists and those early in their career? Recently, the CEO of the National Health and Medical Research Council (NHMRC) announced it no longer considers where an article is published (see ‘Death of the journal impact factor’) but instead asks chief investigators to select their most important articles within the last 5-year period to self-assess recent output, and provide examples from the last 15-year period to demonstrate long-term significance (Anderson, 2013).
Here we consider methods for assessing the impact of published research via citation counts. In recent years, the h-index (Hirsch, 2005) has become the most popular measure of scientific performance. As most readers will know, a researcher with an h-index of 20 has at least 20 publications that have each been cited at least 20 times. We (Hunt et al., 2010) and others have shown how to obtain your h-index and the advantages of using this measure to determine the impact of research (Alonso et al., 2009; Bornmann et al., 2008; Costas and Bordons, 2007; Glanzel and Moed, 2013; Patro and Aggarwal, 2011).
But one of the disadvantages of the h-index is when it is used to assess the impact of scientists having different career lengths. This is because the h-index represents accumulated career citations and therefore it does not decrease over time and may not capture recent productivity. Hirsch (2005) recognised this weakness and suggested that career length could be factored in by dividing h by the age of the paper (which Hirsch called the m quotient). Others variants accounting for career length or age have also been suggested (Bornmann et al., 2011; De Visscher, 2010; Sidiropoulos et al., 2007). However, all of these fall well short of the mark when it comes to comparing outcomes between older and younger scientists. Notably, papers published late in a scientist’s career will take many years to receive sufficient citations to enter the h-core (see below) and add to their already high h-index. Another problem with the h-index is that excess citations are completely ignored once an article enters the h-core of papers. Recently, the e-index was proposed to account for these excess citations and was shown to be useful when evaluating highly cited scientists with identical h-indexes (Zhang, 2009).
An additional way to view and express the h-index is to divide it into 5-year retrospective blocks. By focusing on the most recent 5-year block, a more equitable analysis of early, mid and late career researchers may be achieved by allowing a focus on recent productivity rather than career longevity. Below we analyse the h-index of various researchers computed over the last 15 years, considering the entire 15-year period and also when these 15 years are divided in three consecutive 5-year blocks. We refer to an h-index over a 5-year interval as a ‘hi-5’. We also use the e-index to complement the h-index to measure excess citations. Examples of research output from de-identified academics and clinical academics from the University of Sydney and two other universities are used to illustrate this method and its possible advantages.
Method
Assessment of academic performance by the Australian Research Council, a major granting body in social and basic science, is based on the Excellence in Research Australia (ERA) assessment conducted every 5 years. The Scopus database (www.scopus.com) is used by the ERA to count publications and the citations they receive (arc.gov.au/era/era_2010/archive/citation.htm). We therefore used Scopus for the current analysis which has some advantages over other databases (e.g. Google Scholar Citations (scholar.google.com.au/citations) or Web of Science (www.isiknowledge.com)) to view author citation sets (Jacsó, 2008). Our illustrative examples involve members of the discipline of psychiatry who held clinical, conjoint or academic positions, as well as other academics of the University of Sydney and prominent psychiatrists from two other universities. All data were collected in the last week of September 2013 and were de-identified to avoid potential conflicts of interest and/or breach of ethics.
The Scopus author search was used (last name, first initial and affiliation) to identify author sets and then ‘show documents’ was selected to view the document sets. The drop-down menu for ‘year’ was used to select publications for each 5-year period. The h-index was then automatically calculated from the ‘view citations’ window. All publications from 1998 to 2012 were then selected and a final h-index was derived using the ‘view citations’ button. The last step sorted the publications (1998–2012) by number of citations received using the drop-down menu to gather information to derive the e-index (Dodson, 2009). Using the h-index result in the previous step, the publications within the h-index (called the h-core) were selected and the total number of citations these received was noted in the summary citation window. The best way to describe the calculation of a person’s e-index is by example. If a person has an h-index of 25 and these received 1691 citations, then 1066 of these are in excess of the 625 citations in the h-core needed to make up this h-index (25 × 25 = 625). To calculate the e-index the square root of the remaining 1066 citations is derived revealing an e-index of 32.6, which helps describe the additional impact these papers confer over and above the h-index (Zhang, 2009).
Note that a h-index covering the last 5 years can also be readily obtained by visiting Google Scholar Citations and viewing the ‘h index since 2008’ option for individual researchers. However, this is different to the hi-5 as it is based on citations received for all publications since 2008 and it is generally thought that Google Scholar Citations have more foreign language and non-journal (grey) citations than Scopus, and the feature is only available for authors who have verified (registered) their publications to be made public (Jacsó, 2012). Furthermore, this database is not used in the ERA assessment.
Results
Table 1 shows the number of publications and h-index for each 5-year block (hi-5) from 1998 to 2012 for 40 individuals with varying career lengths (6 to 40+ years). Note that a hi-5 refers to the set of articles published in a 5 year period and is based on the citations these received up to September 2013. In other words, a hi-5 of 20 for 2008–2012 means that an author published 20 articles during 2008–2012 that each had 20 or more citations to date.
Number of publications and h-index for each 5-year period (hi-5) between 1998 and 2012 sorted by the h-index in the last 15 years (hi-15).
A: academic; CA: clinical academic.
Based on citation sets from 40 de-identified cases recorded in Scopus (27 Sept 2013).
Number of articles published in a given interval.
A measure of the number of citations over and above the h-index (core) (Zhang, 2009).
In considering Table 1, it is important to note that the citation window is much longer for the first 5-year period (1998 to 2002) than the most recent period, which explains why most researchers have lower hi-5s for the 2008–2012 interval relative to the 1998–2002 or 2003–2007 intervals. The last three columns show the number of publications, h-index and e-index for the entire 15-year publication period. To differentiate the career h-index from the one derived in the last 15 years, we refer to the latter as the ‘hi-15’.
This type of analysis reveals how different metrics can lead to different conclusions regarding research performance. In particular, it is apparent that the h-index alone, or the closely related hi-15 (1998–2012), is relatively insensitive to differences in productivity over time, and also may discriminate against highly productive early career researchers.
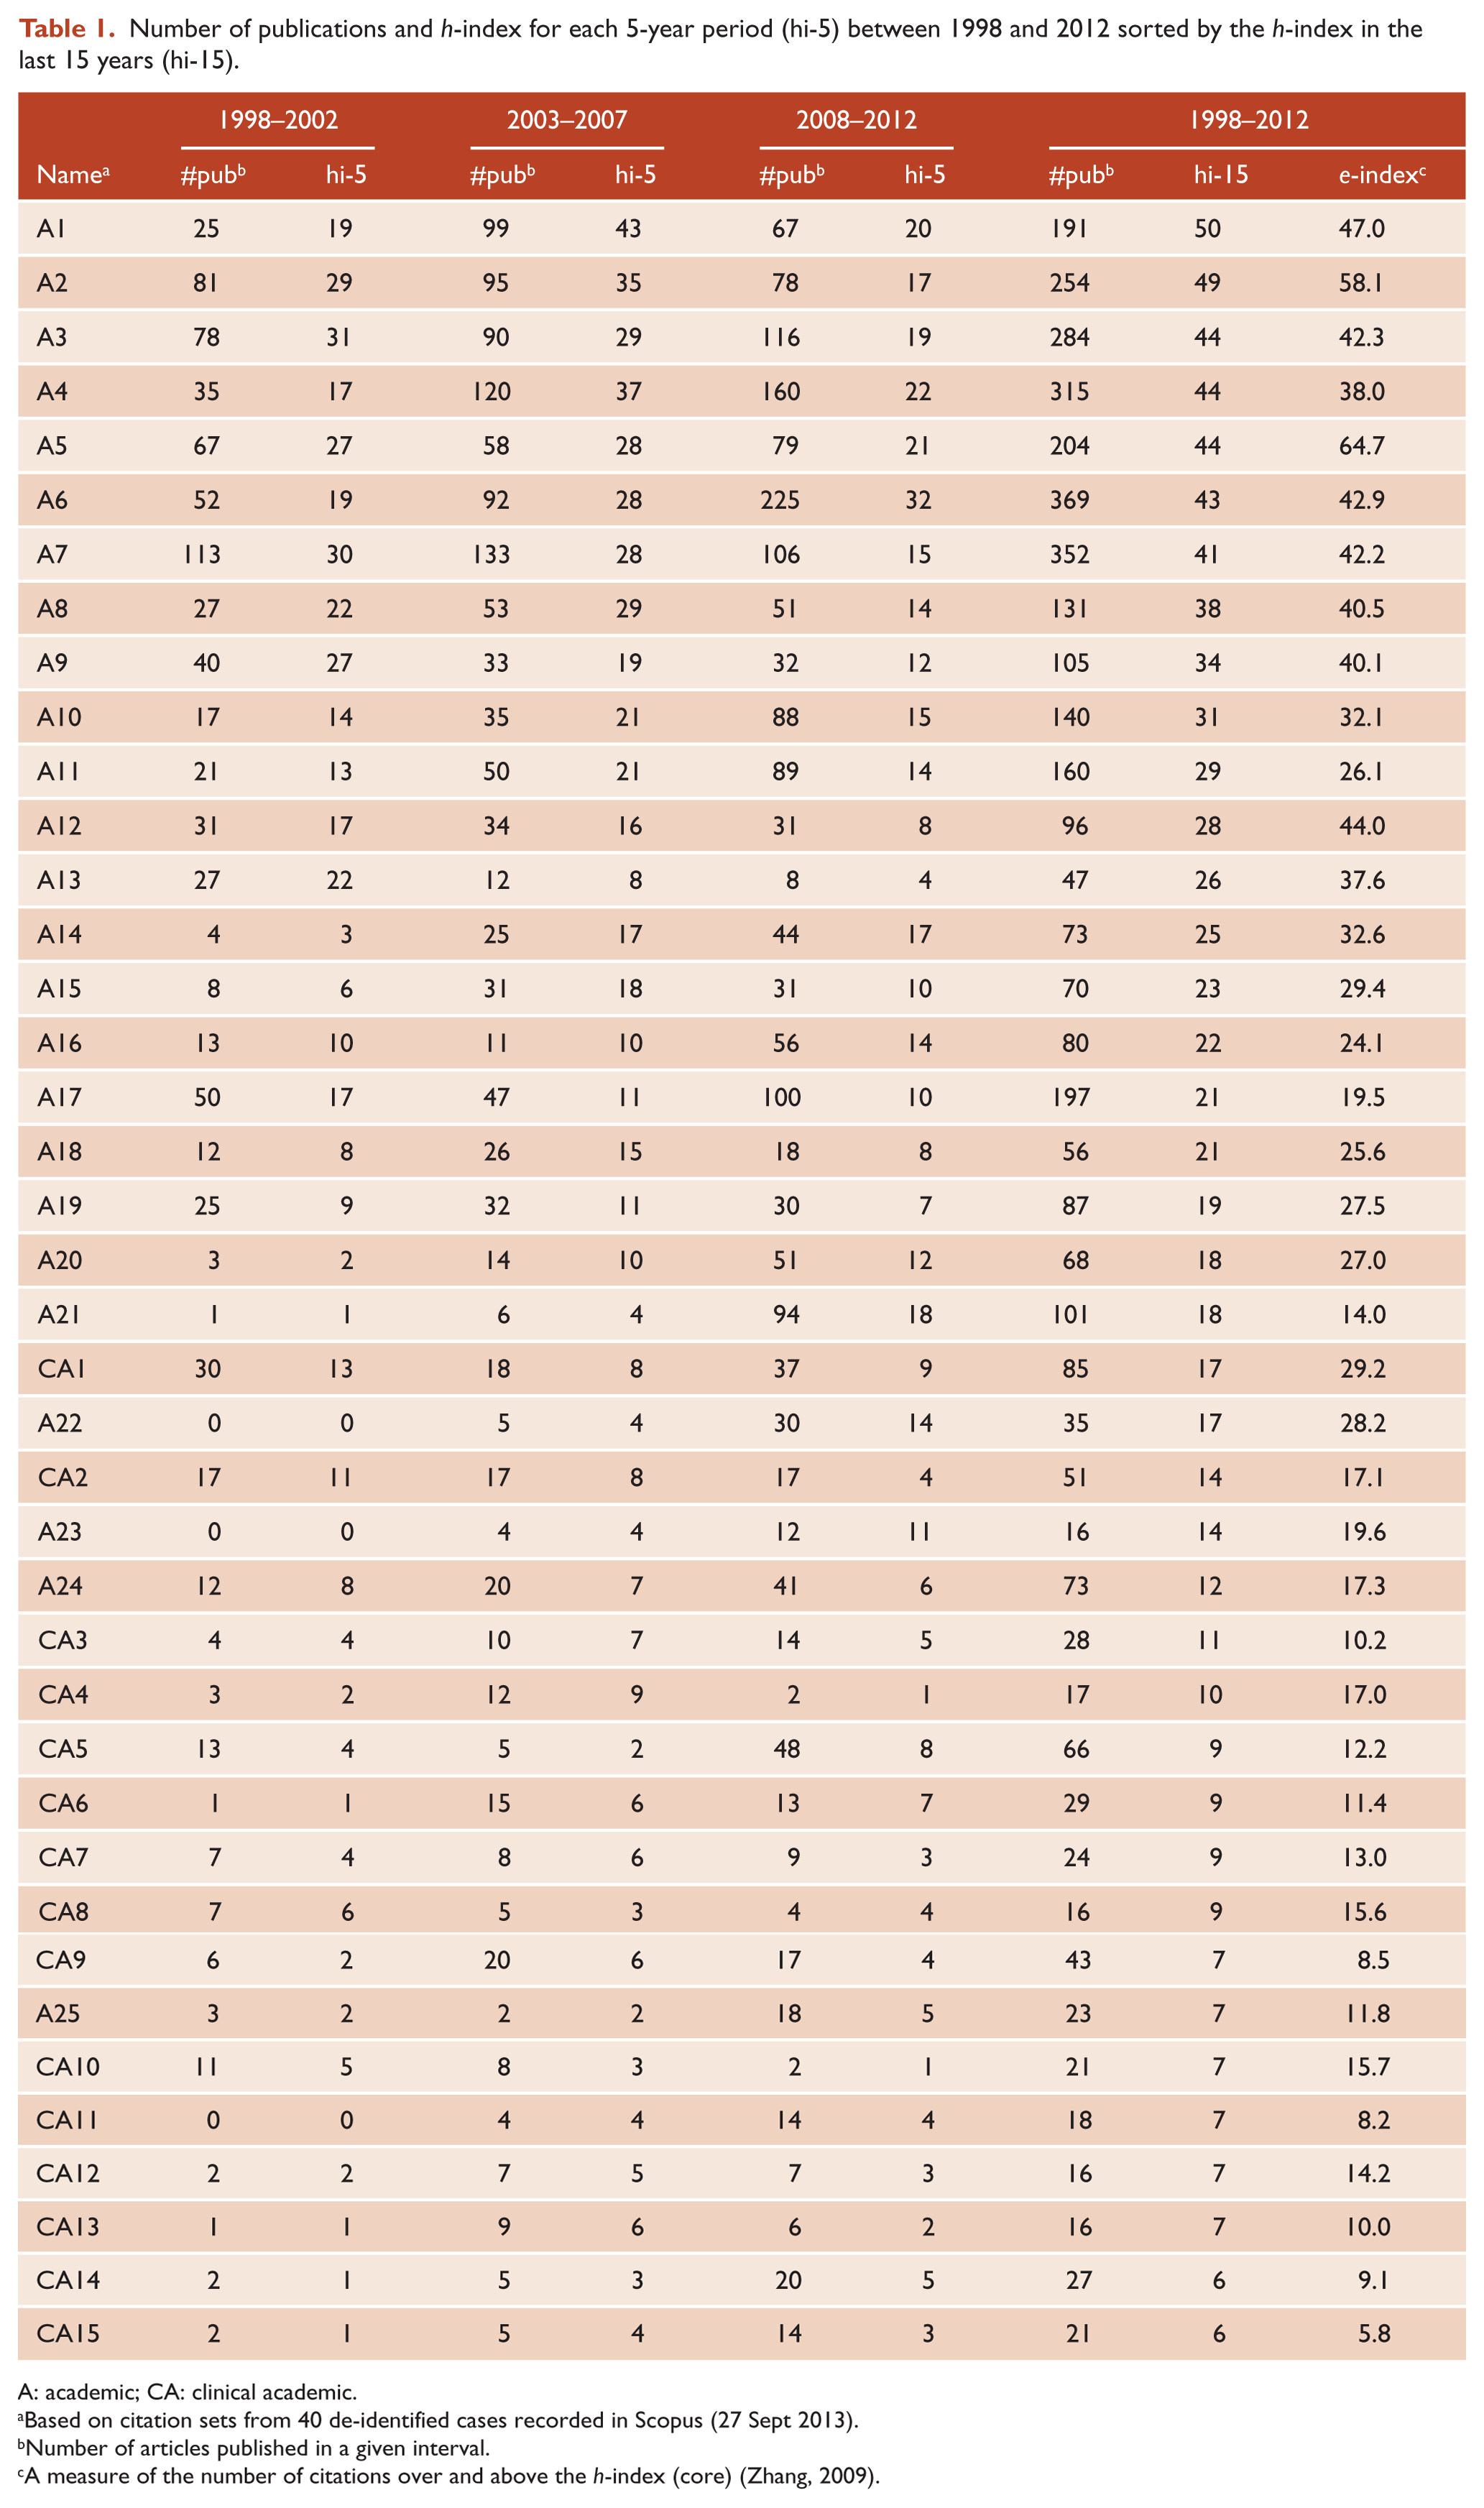
An example of the former is seen in Figure 1 (upper). Four academics had hi-15s of 43 or 44 (A3–A6). However, these four researchers with near-identical hi-15s have very different trajectories, and as we move from the first epoch (1998–2002) to the last (2008–2012) their hi-5s are re-ordered. A6, with the lowest hi-15 of 43, is clearly on an upwards trajectory relative to A3, A4 or A5, the second of whom (A4) had an exceptional hi-5 of 37 during the 2003–2007 period. All other things being equal, who would you give the research grant to?
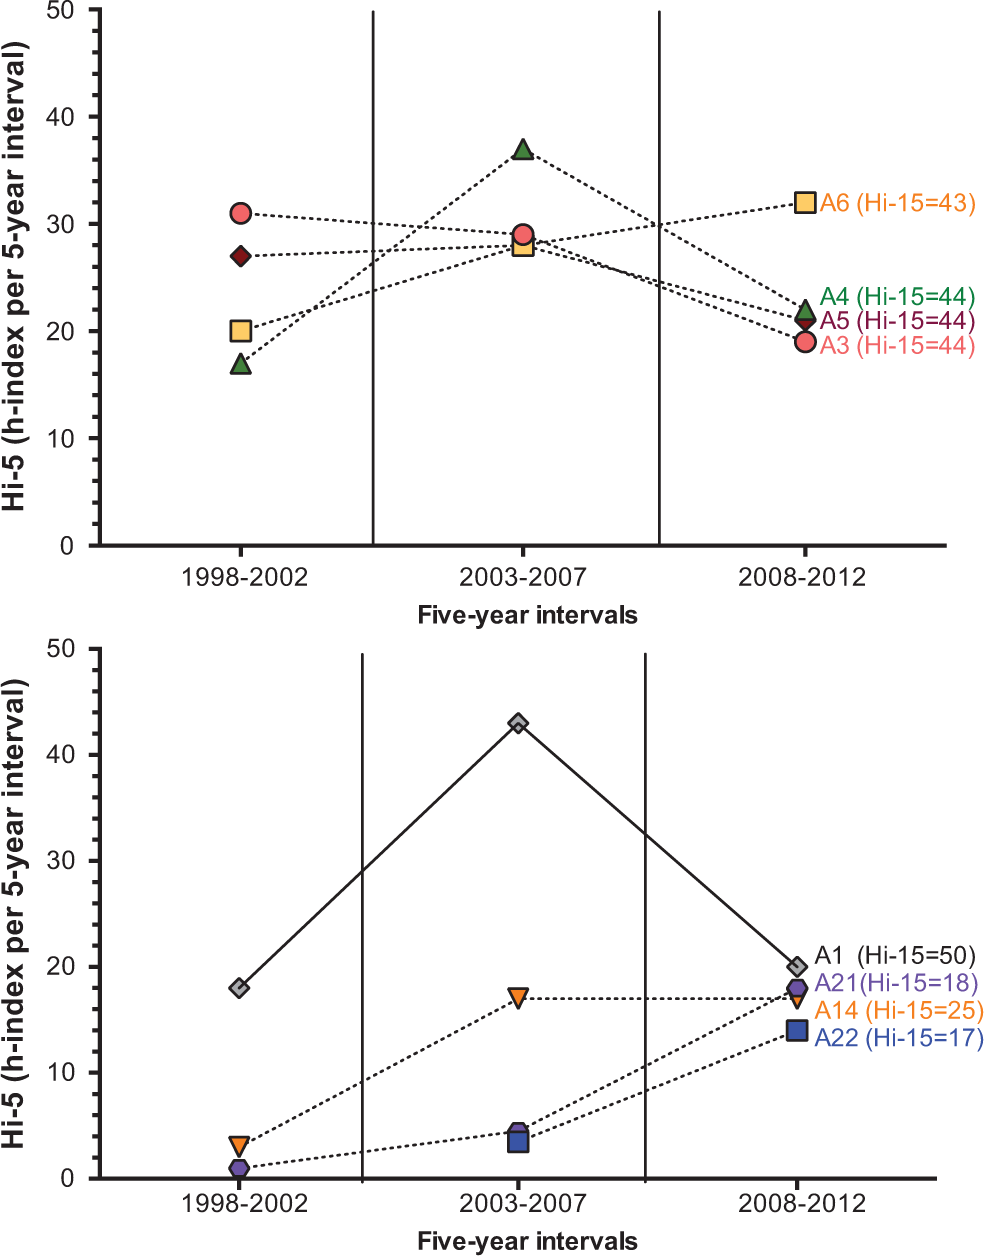
Selected cases from Table 1 illustrating the utility of viewing the h-index over three 5-year intervals (hi-5). The top panel compares four academics with similar hi-15s (43–44) but with different career trajectories. The bottom panel compares three early career academics (hi-15s 17–25) with an academic with a much higher hi-15 of 50. However, the three early career researchers approach the more senior researcher for hi-5 in the last 5 years (2008–2012).
However, before you say ‘A6’, it is also worth noting that based on the e-index, academic A5 had many more excess citations (e index = 64.7) 64.7) than A3, A4 or A6 (42.3, 38.0 and 42.9, respectively).
Overall, it is apparent that some hi-5s increase over time, some remain stable, while others decrease (Table 1). One of the main advantages of viewing the number of publications and hi-5s within each 5-year block is that it is a more equitable approach towards ‘early career’ academics with strong performance in the last 5 years.
In our second example (Figure 1, lower), we show the researcher with the highest hi-15 (A1, with a hi-15 of 50) relative to three early career researchers (A14, A21 and A22 with hi-15s of 25, 18 and 17, respectively). Importantly, our analysis shows these early career researchers have a hi-5 for 2008–2012 that is approaching that of A1 (hi-5 of 20). Again, it is worth asking, all other things being equal, who deserves the funding? Should past achievements count for more than career trajectory?
Discussion
Typically, the progressive build-up of an h-index is a long, slow process. The reason for this is simple: time is required for articles to be published and cited as one’s career progresses. Hirsch (2005) describes that growth patterns of the h-index are usually in the order of 1 or 2 each year and that an h-index of 20 or more indicates good performance, while those with an h-index of 40–60 over 20 years shows outstanding achievement. One should remember that the accumulation of citations also varies between and within fields of research over time (Carbon, 2011; Opthof and Wilde, 2011; van Leeuwen, 2008; Wu et al., 2011).
As one achieves a higher and higher h-index, the time required for newly published articles to add to the core h-index takes longer. Thus, a new publication by an academic with an h-index of 50 normally enters their core much later than the same publication for a co-author with an h-index of 10. A major advantage of parsing the h-index into delimited 5-year periods is the ability to compare recent output over time. Notably, early career scientists can have equivalent or higher hi-5s than those with longer successful careers. Moreover, as some of the articles that make up a person’s h-index can be decades old, they may represent ideas that are no longer relevant or representative of recent areas of research endeavour by the author. Giving more weight to the papers published in the last 5 years is in accordance with most granting bodies focusing on publications in the last 5 to 15-year period to describe ‘career’ research impact.
Other advantages of the hi-5 is its ease of use (it takes about 1–2 minutes per author to gather this information using Scopus) and it is easy to understand using the well-known h-index metric. Viewed together, it can be used to monitor career trajectory as well as overall career achievement.
Like the h-index, the hi-5 and hi-15 do not take into account author position, therefore a person can have a relatively high h-index with few first or last authored papers. However, granting agencies typically ask applicants to self-nominate their best articles and those that have had the greatest impact on the field. The hi-15 deliberately ignores significant contributions that are more than 15 years old, which is arguably an advantage, but may cause key historical contributions to be overlooked. Moreover, the most recent hi-5 may change dramatically over relatively short intervals, so relevant data need to be accessed at the same time for all individuals when making comparisons based on this metric.
Conclusions
The hi-5 and hi-15 are potentially useful additions to the overall h-index score that enhance its relevance with regard to current research output and career trajectory. Using 5-year intervals helps to identify researchers with increasing or decreasing output and allows direct comparisons to be made between researchers with high throughput within these quinquennia. Combining the h-index with other variants such as the e-index helps to further discriminate the overall research impact of researchers who have similar h-index values. Focusing on articles published in the last 5 years is in accordance with current granting bodies that use these articles to assess an applicant’s track record. It should be noted, however, that citations are just one metric and that there are many other aspects of academia that need to be considered alongside publication output. But within this arena of indices, we illustrate the potential benefits of this additional metric and show that the hi-5 can grow rapidly over relatively brief time frames, especially for those researchers with high publication rates (10–20 articles per year), and perhaps this warrants a big Hi-5!
Footnotes
Funding
This research received no specific grant from any funding agency in the public, commercial or not-for-profit sectors.
Declaration of interest
The authors report no conflicts of interest. The authors alone are responsible for the content and writing of the paper.