
Abstract
With the introduction of body worn cameras, new data types have emerged, including activation metadata, which is information on the extent of the implementation of body worn cameras, by whom, and under what conditions. In this paper, we propose an avenue of methodological interest: linking activation metadata with police-recorded behaviour. We take the case of complaints to examine the use of these data for investigations of officers’ misconduct. We used an observational approach, analysing 1.73 million body worn camera activations by more than 3900 frontline officers, juxtaposed with professional conduct data. We find a heterogeneous distribution of implementation, despite a ‘blanket’ body worn camera policy requiring activation. Specifically, distinct types of officers disproportionally under-activate body worn cameras. We show that body worn cameras activation rates are inversely correlated with complaints, although minimally when observed at the population level. We discuss the use of metadata for research as well as for policy.
Across the world, there has been a rapid proliferation in policing of body worn camera (BWC) technology (Lum et al., 2019). However, the swift uptake of BWC technology is largely occurring in low-research environments, with many agencies beset by ‘watershed moments’ in the use of force (UOF) by police, such as the death of George Floyd (2020) and the events that followed worldwide. Despite the relative paucity of empirical research on the implementation and use of BWCs, this technology has been widely embraced by policing agencies for practical (Morrow et al., 2016), symbolic (Makin, 2016) and environmental reasons (Nix et al., 2020). BWCs have been heralded by many as a potential panacea to resolve a myriad of contemporary policing concerns that include increasing police legitimacy, reducing complaints about the police, decreasing UOF and improving the outcomes of criminal investigations (Alpert & McLean, 2018). However, despite burgeoning interest and growing belief in the efficacy of BWC technology, the evidence remains equivocal in terms of its operational capacity, accountability and cost-effectiveness (Maskaly et al., 2017).
However, there are emergent benefits of BWC implementation, such as the back-office functionalities afforded by the data collected. Audio-visual data can be used to detect early warning signs of violence using artificial intelligence based on the movements of the people in video footage (Cavallaro & Brutti, 2019; Fang et al., 2019; Kepski & Kwolek, 2016). While still ethically contentious (Bryan, 2020; Hood, 2020; Park & Pang, 2019; Ringrose, 2019), early data indicate better-than-luck identification of wanted persons using facial recognition technology. Merola et al. (2016) and Groff et al. (2019) demonstrated how BWC data can be used in court, with the result of increased convictions in difficult cases such as domestic violence and assault on the police.
Another avenue of new research is how to capitalise on the availability of big data consisting of BWC metadata to support decision-making in internal investigations. Metadata are ‘data about data,’ and they summarise basic information about data, allowing for cross-referencing between datasets. BWC metadata offers a previously unknown, additional layer of information – activation data. These metadata tell us the exact number of minutes an officer attended a call, how many officers were at the scene, and whether officers complied with BWC policies. Further, metadata can be used to gather evidence that can later be used for internal investigations if a BWC is not activated according to standard operating procedures.
The importance of tracking BWC activation records was demonstrated in a subgroup analysis of a meta-analysis comprising 11 cases in which activation failure diluted the effectiveness of a BWC program (Ariel et al., 2016a, 2016b). Ariel et al. (2017) concluded, although with limited supportive evidence (see critique in Lum et al. 2019), that the effectiveness of BWCs is predicated on officers activating their devices. While the effectiveness of BWCs depends not on the policy but on the implementation of the policy by field officers, little attention has been paid to activation. Young & Ready (2015) argued that failure to comply with BWC policies pursuant to chronic non-activation is potentially correlated with other forms of non-compliance and personnel concerns. As such, officers’ lack of compliance with BWC procedures may be indicative of overall compliance issues. It is thus reasonable to expect an inverse correlation between activation rates and other indicators of compliance such as professional standards.
Using several layers of data juxtaposed with BWC activation metadata, we analyse 1.73 million BWC activations by frontline Queensland Police Service (QPS) officers against 2,074,881 computer-aided dispatch (CAD) attendances and 3905 officer complaints. This case study provides a roadmap for the deeper exploration of BWC metadata in measuring and improving the effectiveness of BWC use by frontline officers. Accordingly, we seek to demonstrate the utility of BWC metadata in evaluating both BWC implementation and police-recorded behaviour. As a contribution to the literature, we answer two research questions:
How are BWC activations distributed across officers, officer ranks, age groups and locations? Do rates of activation differ among these categories? Are BWC activation and officer compliance correlated? Does this correlation differ for proactive and reactive officers?
Literature review
Overall findings on BWCs
The volume of research focused on BWCs is consistently increasing, with a recent review by Lum et al. (2019) identifying 70 studies with varying methodological rigour and differing outcomes. BWC research can be separated into five broad categories: officers’ attitudes towards BWC, the impact of BWCs on officer conduct, the impact of BWCs on citizen behaviour, the impact of BWCs on criminal investigations and the impact of BWCs on policing agencies.
While some studies have demonstrated reductions in citizen complaints and UOF incidents, others have reported non-statistically significant findings (see Lum et al., 2019). The Rialto Experiment was the first peer-reviewed randomised controlled trial (RCT) of BWC use by law enforcement. This experiment reported reductions of nearly 90% and 50% in complaints against police and UOF incidents, respectively (Ariel et al., 2015; Farrar, 2013). Jennings et al. (2015) reported from an RCT conducted in Florida a 65% reduction in complaints against officers in the treatment group relative to those in the control group as well as a 53% decrease in UOF incidents. A quasi-experiment conducted by the Mesa1 Police Department resulted in a 48% decrease in citizen complaints and a 75% reduction in UOF complaints (Mesa Police Department, 2013). Furthermore, an RCT conducted by the Las Vegas Metropolitan Police Department found significant reductions in complaints and UOF reports for officers in the treatment group relative to those in the control group (Braga et al., 2018). Similar findings have been reported for subsequent studies in Phoenix2 (Hedberg et al., 2017), Spokane3 (White et al., 2018) and the United Kingdom (Ellis et al., 2015).
However, studies in Washington (Yokum et al., 2017), Edmonton4 (Edmonton Police Service, 2015) and London (Grossmith et al., 2015) failed to replicate similar reductions in complaints and UOF incidents. Explanations for this disparity in results include variations in the methodological rigour of studies (Lum et al., 2019), agencies’ implementation failures (White et al., 2018), differences in BWC activation rates (Lawrence et al., 2019) and differences in compliance with BWC policies (Ariel et al., 2018). In short, the disparities are largely attributable to differences in officer compliance.5
Variations in compliance-with-BWC-policy
The effect of BWCs depends on the degree to which they are activated by officers (Ariel, 2016). Lawrence et al. (2019), Jennings et al. (2014) and Ariel (2016) suggested five reasons: (1) officers forget to activate the device; (2) officers deliberately failed to activate the device; (3) there was insufficient time for activation due to the spontaneity of the police–citizen encounter; (4) there was a device malfunction and (5) an officer did not know how to operate the device.
Ariel et al. (2016a, 2016b) discussed a possible consequence of the variation in BWC activations. Based on data from a multi-site RCT conducted across eight agencies involving 2122 officers, Ariel et al. (2016b) initially reported null effects for BWC-wearing officers, but a subsequent re-analysis of the data revealed that differences in officer compliance with BWC protocols diluted the previous results. In particular, the authors found a 93% before-after reduction in complaints across seven experimental sites, falling from 1.2 complaints per officer to 0.08. This is attributed to both an ‘observer’ effect where the behaviour of officers and citizens are affected by the presence of a BWC and contagious accountability where entire police departments become acutely aware that they are being observed more closely.
Moreover, whereas three sites with a strong record of compliance demonstrated a 37% reduction in UOF incidents, sites with cross-contaminated treatment and control groups reported non-statistically significant differences between the groups (Ariel et al., 2016a). As such, compliance with BWC protocol matters greatly and is likely to cause variations in study outcomes. To this extent, three studies (Ariel et al., 2016a) have reported increases in UOFs when experimental sites reneged on study procedures and gave their officers stronger discretionary powers in determining when and how BWCs were used. More recently, a meta-analysis by Lum et al. (2020) revealed that BWCs may not substantially reduce officers’ use of force, arrest activities, proactive or self‐initiated activities, or other measured behaviours given inconsistencies in its use. Importantly, their analysis suggests that restricting officer discretion in turning on and off BWCs may reduce police use of force.
Identifying BWC non-compliance using metadata
To measure BWC non-compliance, we first examine BWC activation patterns given that activation constitutes compliance in an exact sense. Indeed, the most fundamental feature of the BWC device is its ability to store audio-visual data from police–public interactions accurately and reliably. As such, failure to activate is a record of non-compliance, which can then be investigated as such through internal affairs units. While there may be substantive reasons for improper recording, the overall result does not necessarily divert from general recording policies that stipulate that activation must occur. Most importantly, however, we can measure non-activations.
With the emergence of big data, due to in part to exponential advances in cloud storage, vast quantities of data can be recorded and catalogued (Fan, 2018). In a law enforcement context, millions of public contacts are recorded every year (Joe, 2016). In a world of perfect BWC activation compliance, this translates to terabytes of audio-visual data, with vast swaths of associated metadata (e.g. date/time, number of recorded minutes, officer identification).
BWC activation metadata offers at least two benefits related to tracking non-compliance and monitoring officer behaviour. The first benefit is precision. As activation metadata is associated with the lowest unit of analysis, the individual and reflects verifiable space and time variables, each recording creates a permanent watermark. We can subsequently identify under which conditions non-activation is more likely to occur (Brayne, 2017). Moreover, we can identify non-activators quickly and easily without consulting massive amounts of audio-visual data. As a large number of officers do activate their camera in compliance with BWC policy, it is optimal to identify the specific officers who do not to deal surgically with non-compliance. The second benefit is the ability to overlay BWC metadata with other datasets (Hyatt et al., 2017; Miller, 2014). Since BWC activation metadata are linked to individual officers, we can compare patterns of BWC activation with other behavioural and perceptual measures. Examining activation data against records on UOF incidents, complaints, assaults, arrests and other instances allows for more granular analyses than were possible before the introduction of BWCs.
Existing research on BWC metadata
Despite these benefits, rigorous empirical research on BWC activation compliance has been sparse (see reviews in Ariel (2019) and Lum et al. (2019)) – a gap we attempt to fill with this study. Nevertheless, the available research is informative. During the implementation phase of BWC technology in Canada, the United Kingdom and the United States, agencies in each country reported similarly large disparities in BWC activation rates relative to activation policies (Ellis et al., 2015; Katz et al., 2014; Whynot et al., 2016). At the individual officer level, two RCTs reported large variations in activation rates from as low as 0% to as high as 75% (White et al., 2018). A study in Bedfordshire (United Kingdom) (Greswell, 2018) also revealed a wide variance in BWC activations, with 27% of officers failing to produce a single activation in the 12-month study and only 2.5% of officers capturing 50% of the incidents they attended.
An analysis of officer BWC activation during the first six months of the Anaheim6 Police Department’s BWC programme revealed that average activation rates varied from 0% to 72% (Lawrence et al., 2019). Interestingly, the study reported that BWC activation rates increased over time as the study progressed from 3% to 54% without supervisors undertaking audits or officers receiving notifications to improve BWC activation rates. Furthermore, Lawrence et al. (2019) concluded that had there been provisions within their study to reprimand officers for non-compliance, they would have expected higher activation rate increases. These findings are contrary to Katz et al.’s (2014) Phoenix study, which reported a decrease in BWC activations from 42% at the beginning of the study to 13% in the following year.
Research methodology
Setting
The QPS is the third-largest policing agency in Australia in terms of employees, with approximately 12,031 sworn officers. The QPS is responsible for policing a geographic area of 1.853 million square kilometres and serving a population of about 5.1 million (QPS, 2019).
Measures
Apart from three calendar years for complaint data, the dataset comprised records from 1 January 2018 to 31 December 2018. The unit of analysis is the officer, with an explicit focus on compliance metadata. The data thus include the number of BWC activations over the study period per officer, the date and time of each activation, the duration of each activation, activation trajectories, in-house police records of complaints, CAD attendances per officer and a variety of demographic variables for individual officers, including age, gender, rank, organisational unit, position location and precinct location.
These data were extracted from four distinct QPS record management systems: (1) Evidence.com©, a cloud-based repository platform for digital evidence captured by QPS-issued BWCs, (2) QCAD, a CAD system that records all calls for service (CFS), (3) Compass, a complaint tracking system available to both QPS personnel and Queensland residents and (4) a human resources database operated by the Public Safety Business Agency.
Some research suggests 10% of all officers account for 90% of all police misconduct complaints (DeCrescenzo, 2005). Ede et al. (2002) suggested that studies of complaints should control for the task environment by ensuring a comparison of units of similar size, location and duty types. As such, a concentration-prevalence analysis of complaints is required to ensure that ‘apples are compared with apples.’ While a low volume of complaints may not be problematic for an officer in a locality with a high volume of CFS, it may be indicative of a potential problem in a locality with few CFS. Similarly, it is known that officers with high arrest rates tend to receive more complaints and more UOF reports (Worden et al., 2012). Accordingly, while complaints can potentially be highly ambiguous, they nevertheless provide a type of barometer for police-public interactions and police misconduct (Macintyre et al., 2009).
Procedures
Each of the aforementioned datasets was organised into five spreadsheet files. Officers’ registered numbers served as unique reference numbers across the datasets. This variable was thus utilised as an index key to match/merge datasets and enable statistical analysis. Once each dataset was cleaned for duplicates, test entries and blank cells, a structured query language script and multiple applications of the ‘VLOOKUP’ function within Excel were employed to merge the five datasets into a single Excel spreadsheet, enabling various statistical analyses to be conducted.
As this study analyses BWC activations and other indicators of compliance involving officers from across the State of Queensland, a particular challenge was accounting for the disparity in the workload and the volume of citizen interactions associated with officers in distinctly different geographical locations within QPS. For example, the rate of BWC activations and complaints about officers in metropolitan Brisbane differs from the rate for officers in a remote outback location such as Birdsville. To account for this variation, for several of the analyses, the number of CAD incidents attended by officers was used as a moderator to normalise the data. Accordingly, within the research design, CAD incidents are applied to standardise the low-density, low-policing-activity areas in remote parts of Queensland to the higher density, high-policing-activity city areas. This enables a ‘like for like’ comparison for analysis as closely as possible.
Exploratory descriptive analyses were then conducted in R to identify the ratio between BWC activation and complaint rates and within variables such as gender, rank, age group and jurisdiction. Independent sample t-tests were then conducted to assess whether there were statistically significant differences in the means between relevant variables.
Furthermore, one-way analysis of variance (ANOVA) was performed where appropriate to test the null hypothesis: there is no difference in mean intermittency between officer rank, age group and jurisdiction. When ANOVA results led to a rejection of the null hypothesis, group-based analyses in the form of Bonferroni post hoc tests were applied to gain better insight into where discernible differences exist between groups.
Finally, Pearson’s correlation coefficients were computed to assess the strength of the relationship between the number of BWC activations and the number of complaints and allegations, respectively. Importantly, an officer was classified as engaging in proactive policing if they recorded no attendances at a CAD incident and one or more BWC activations for 2018, whereas officers were classified as engaging in reactive policing if they recorded more than one CAD attendance and BWC activation.
Findings
There was a total of 1,716,615 BWC activations across 6333 officers for the 2018 calendar year. This equates to an overall volume of 33.42 years of BWC recordings. Analysis of CAD records revealed 2,074,881 incidents in which an individual officer physically attended the scene of a CAD logged call for service during 2018. In a simple comparison of the total number of BWC activations (n = 1,716,615) and CAD attendances (n = 2,074,881), it appears as though officers achieved a BWC activation compliance rate of 82.7%. However, the total number of BWC activations is distorted by a disproportionate number of proactive policing activities and multiple device activations at a single incident attended by several officers.
Distribution of BWC activations across the service
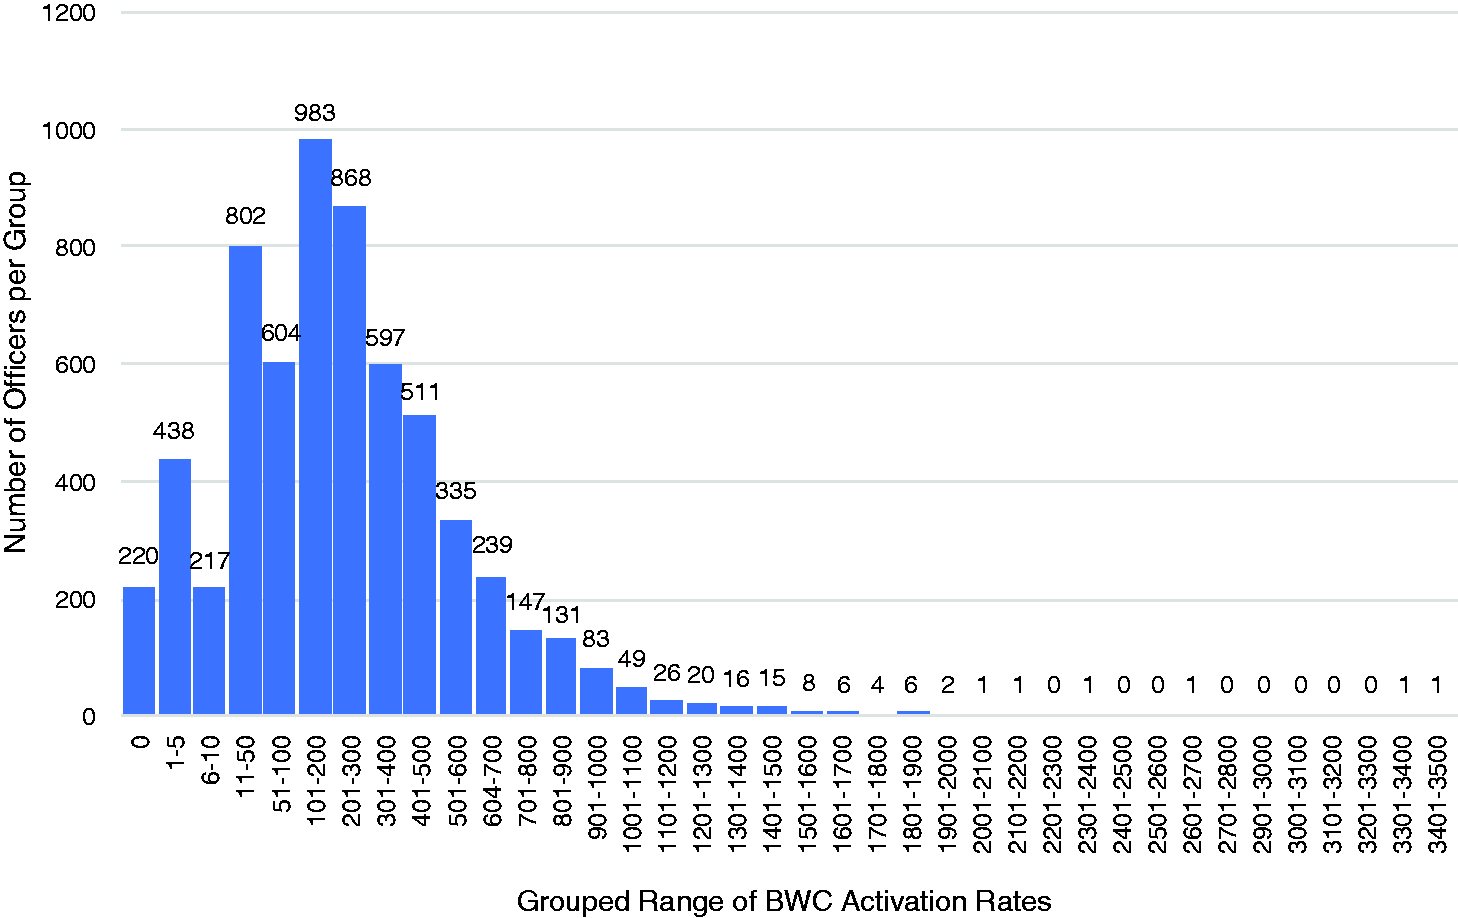
Per Figure 1, 220 officers, who attended a total of 35,036 CAD calls, failed to activate their BWCs on any single occasion during 2018. In 2018, 35.7% of officers activated their BWCs fewer 100 times (n = 408,375 CAD calls attended), 158 officers activated their BWC on more than 1000 occasions, and two officers activated their devices on more than 3000 occasions, or about three times per day. Measuring the number of officer shifts per year (n = 223 days, inclusive of rest days and six weeks of annual leave) against the total number of BWC activations, 55.7% of all BWC-assigned officers activated their BWCs on one or fewer occasions per rostered shift for the entire year, on average.
Frequency of BWC activations.
On a month-to-month basis, there was a gradual increase in the rate at which officers activated their BWCs over the year. Whereas the sharpest increase in the rate of activations (26.46%) occurred between February (n = 112,914) and March (n = 153,547), the sharpest decrease in the rate of activations (20.69%) occurred from March to April (n = 127,223). These months coincided with the Gold Coast 2018 Commonwealth Games, which may explain these two fluctuations of more than 10%. There was also a leave embargo for all officers during March across the State that resulted in a higher-than-average number of officers performing their duties. Furthermore, during April 2018, a large proportion of service officers from across the State of Queensland were deployed to various South East Queensland Commonwealth Games venues to perform predominantly static, security-related roles. This variation in the type of duty performed during April likely affected the rate at which a large proportion of officers attended CFS. The rate at which officers engaged in proactive duty also likely declined. An 11.2% increase in BWC activations occurred from April to May (n = 1,433,375), a period coinciding with officers returning to their substantive operational roles.
BWC compliance by jurisdiction
During the study period, there were 1,638,938 activations spread across Queensland’s 15 jurisdictions. The Operations Division of the Road Policing Command produced the highest total number (n = 365,902) and mean (M = 689.08) of BWC activations. When excluding the Road Policing Command and considering only the general duty jurisdictions, the Gold Coast District7 had the highest volume of activations (n = 184,210), and the Capricornia District8 had the highest mean BWC activations (M = 349.03). At the opposite end of the spectrum, the South West District9 had the fewest activations (n = 28,111). South Brisbane District, which has the third-largest staff (n = 552) and shares responsibility for policing the most populous area of the State of Queensland with North Brisbane District,10 had the lowest mean of BWC activations (M = 147.72). A one-way ANOVA to compare the mean rate of BWC activations between the 16 jurisdictions revealed a statistically significant difference between the groups: F(15, 5791) = 110.94, p < 0.001.
A one-way ANOVA was also conducted to compare the mean rate of BWC activations when controlling for attendance at CAD calls between the 16 jurisdictions. Again, the differences between the jurisdictions were statistically significant (F(15, 1352)= 7.63, p < 0.001). A Bonferroni post hoc test controlling for CAD attendance found that the Road Policing Command had a substantially higher mean activation rate than the other 15 jurisdictions (p < 0.05). Further, the mean activation rate in South Brisbane District differed from all jurisdictions except Logan, South West and the Sunshine Coast.
For the total and mean duration of BWC activations across the 16 jurisdictions, Road Policing Command officers again had the highest volume with 61,235 total hours and a mean of 118.22 h. In considering only the general duty jurisdictions, the Gold Coast District produced the highest total duration (n = 32441.45 h), consistent with the overall number of BWC activations. The South West District produced the lowest mean duration of BWC activations (n = 25.71 hours), followed by the Sunshine Coast District (n = 27.59 h). A one-way ANOVA was performed to compare the total volume of BWC durations between the 16 BWC jurisdictions and revealed a statistically significant difference between the groups: F(15, 6192) = 106.815, p = <0.001. A Bonferroni post hoc test revealed that the Road Policing Command had a higher mean activation time than all other jurisdictions.
Compliance by gender, rank and age group
Male officers (n = 4,738) had 1,316,967 activations (M = 290.58, SD = 307.51) while female officers (n = 1595) had 339,778 activations (M = 213.02, SD = 232.43). A t-test revealed a statistically significant difference between the two genders: t(3604.861) = 10.57, p < 0.001. Among non-commissioned officers, senior constables had the highest total and mean BWC activations while sergeants had the lowest total and mean rate of BWC activations (see Table 1). Controlling for CAD attendance, ANOVA results revealed statistically significant differences between the ranks: F(3, 1499.6) = 8.26, p = <0.001. Furthermore, Bonferroni post hoc tests revealed three statistically significant differences among the ranks: constable and senior sergeant (p < 0. 001), senior constable and senior sergeant (p < 0. 05) and sergeant and senior sergeant (p < 0. 05). No other rank combinations were found to have statistically significantly different rates of activation.
BWC activations by rank (12 months of data).

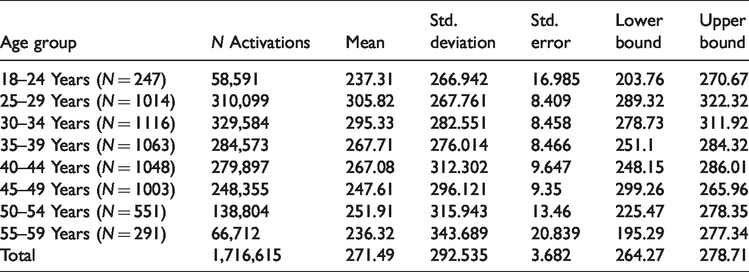
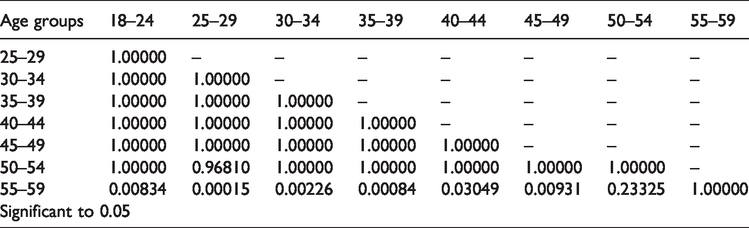
Table 2 displays the age groups of officers who were assigned BWCs during 2018. The 30–34 age group had the largest number of BWC activations and the second-highest mean rate of activations while the 18–24 age group had the lowest number of activations (n = 58,591) and the second-lowest mean rate of activation. ANOVA, controlling for the number of BWC activations against the number of CAD attendances, revealed statistically significant differences between the age groups, F(7, 6668) = 3.342, p = < 0.001. However, a Bonferroni post hoc test revealed statistically significant differences between the age 55–59 group and the following groups: 18–24, 25–29, 30–34, 35–39, 40–44 and 45–49 (see Table 3).
BWC activations by age group (12 months of data).
Bonferroni post hoc mean differences between age groups.
Top and bottom 10% of BWC activators
The top and bottom 10% of BWC activators offer insight into why variations in BWC activations exist (DeCrescenzo, 2005). Road Policing Command had the highest number of officers (n = 351) within the top 10% of activators, with 66.7% of all Road Policing officers positioned within the top 10% of BWC activators. For districts, the Gold Coast District had the largest number of officers (n = 53), followed by North Brisbane District (n = 52). The Specialist Services Group had 50 officers within the top 10% of BWC activators. These officers are predominantly engaged in proactive policing activities focused on public disorder and safety. Per our definition of proactive policing, these officers are not responding to CAD incidents per se but are actively engaging with members of the public.
Identifying the bottom 10% of BWC activators provides insight into the negative ‘pockets’ of BWC culture that may exist within the QPS (Huff et al., 2018). The Wide Bay Burnett District11 (n = 181) had the highest number of officers within the bottom 10% of activators. The 181 officers from Wide Bay Burnett who are within the bottom 10% of activators represent 74.5% of officers in that district. In contrast, in South Brisbane District, the 57 officers within the bottom 10% of activators represent only 9.78% of officers within that district. The jurisdictions not part of a policing district with officers in the bottom 10% are less concerning, given that they have less scope and opportunity to activate BWCs as part of their daily policing duties.
BWC activation and misconduct
There were 1350, 1289 and 1266 complaints received against QPS officers in 2016, 2017 and 2018, respectively. A total of 1266 individual complaints were received against 1130 officers in 2018; 9.39% of officers received 100% of the complaints. Stated differently, 91% of officers (n = 10,901) did not receive a single complaint in 2018. Furthermore, 8.4% of officers (n = 1011) received one complaint, 0.88% (n = 106) officers received two complaints and 0.11% (n = 13) received three or more complaints.
To estimate the association between BWC activation and professional conduct, Pearson’s r was calculated for the number of complaints and allegations per CAD attendance, respectively. The results demonstrate that BWC activation compliance is negatively correlated with complaints (r = −0.102; p < 0.001) and allegations (r = −0.092; p < 0.005). While the effect is not large, it is evident that complaints and allegations are rare events. Moreover, due to the vast number of CAD attendances and a large number of officers a large effect was not anticipated when considering the entire population of officers.
Complaints against officers assigned and not assigned BWCs
Officers not assigned a BWC had a higher mean number of complaints per CAD attendance (M = 0.012, SD = 0.0721; N = 2938) than officers who were assigned a BWC (M = 0.003, SD = 0.072; N = 5905). An independent t-test demonstrated a statistically significant difference between the mean number of complaints per CAD attendance between officers who were assigned and those who were not assigned a BWC (t(8841) = 5.22; p < 001). These outcomes correspond with a small effect size (d = −0.125; 95% CI −0.169, −0.081).
Again, an officer was classified as engaging in proactive policing if they recorded no attendances at a CAD incident and one or more BWC activations for 2018, whereas officers were classified as engaging in reactive policing if they recorded more than one CAD attendance and BWC activation. The results demonstrate that officers engaged in proactive policing (n = 553) produced a higher mean number of complaints (M = 0.139) than officers engaged in reactive policing (n = 5780; M = 0.074). An independent t-test demonstrated a statistically significant difference in the mean number of complaints between officers engaging in reactive policing and those engaging in proactive policing (t(795.14)=5.012; p < 001).
Discussion and conclusion
Chronic or low levels of BWC activation compliance have the potential to fundamentally undermine an agency’s BWC program (Ariel et al., 2017; White et al., 2018). Moreover, low levels of BWC activation could be indicative of BWC implementation failure (Lawrence et al., 2019). This study found that 220 officers failed to activate their BWCs during the 12-month study period. To negate the claim that these officers were on either long-term sick leave or had been transferred to non-operational roles, the officers’ CAD attendances were examined. This revealed that the same group of officers attended 35,036 CAD incidents for the equivalent 12-month period. More broadly, the rates of BWC activation were grouped by ranges of activations (i.e. 1 to 5, 6–10, 11–50), enabling a more granular analysis of the distribution of BWC activations across the service. This analysis revealed that approximately 35.7% of officers activated their BWC fewer than 100 times (n = 408,375 CAD calls attended). Comparing the number of officer shifts per year (n = 223 days, inclusive of rest days and six weeks of annual leave) against the total number of BWC activations, 55.7% of all BWC-assigned officers activated their BWC on one or fewer occasions per rostered shift for the entire year, on average. Overall, this indicates that a relatively large number of officers are non-activators, despite the policy of non-discretionary activation.12 This finding is particularly relevant when also considering the large number of annual CAD calls.
Consistent with RCTs conducted by White et al. (2018), this study found a large variation in the rates of BWC activation between officers. Furthermore, over the course of the study period, there was a gradual increase in activations. Although more pronounced, Lawrence et al. (2019) found a similar increase in the Anaheim Police Department. According to Adams & Mastracci (2018), this gradual increase in activations may be explained by officers’ growing belief in the effectiveness of BWCs.
Unsurprisingly, the Road Policing Command produced the highest number of activations and the greatest proportion of officers within the top 10% of activators. This style of policing lends itself to more contact with citizens than general duty officers. However, the most interesting finding pertains to the bottom 10% of BWC activators. 74.5% of all officers from Wide Bay Burnett were chronic under-activators. The literature suggests that such comparatively low rates of BWC activations, particularly within Wide Bay Burnett, could be indicative of negative perceptions of organisational justice (Jennings et al., 2014; Ready & Young, 2015).
Furthermore, when analysing BWC-assigned officers and complaints per CAD attendance, officers within the Wide Bay Burnett District reported the highest mean number of complaints. Hedberg et al. (2017) suggested that while reduced rates of complaints are associated with officers wearing BWCs, the rate of complaints is less pronounced when officers activate their BWCs. Accordingly, the higher mean number of complaints per CAD within Wide Bay Burnett compared to other districts is perhaps indicative of the full benefits of officer self-awareness not being realised. However, more research is needed to substantiate this contention. 13
This study found that BWC-assigned officers recorded a substantially lower number of complaints per CAD attendance than those officers not assigned a BWC. While this finding should be treated with some caution as this study does not document an experiment, it does provide a useful narrative that enhances our knowledge of complaints. Reduced complaint rates for BWC-assigned officers meshes with theories of deterrence as well as the results from other studies (Ariel et al., 2015, 2017; Braga et al., 2018; Ellis et al., 2015; Hedberg et al., 2017; Jennings et al., 2015; Mesa Police Department, 2013; White et al., 2018).
This finding could be explained by citizens’ increasingly positive perception of police legitimacy due to the presence of BWCs. From an officer perspective, the presence of BWCs may have engendered greater levels of self-awareness and accountability. This study is the first to examine compliance by BWC-assigned officers engaged in reactive and proactive styles of policing. The analysis revealed that officers engaged in proactive policing produced a higher mean number of complaints per CAD attendance (M = 0.1386) than officers engaged in reactive policing (M = 0.0741). Reiss (1971) contended that when officers are engaged in reactive policing, which is typically characterised by a citizen calling the police, they can generally count on public support in arresting an offender. However, when engaged in proactive policing, the equivalent level of support should not be assumed.
Finally, Pearson’s correlation coefficients revealed a negative relationship between rates of BWC activation and complaints and allegations. This raises the question of whether implementing a robust system for tracking rates of BWC activation, including the ability to reprimand chronic under-activators, could result in greater reductions in complaints. This contention is supported by Lawrence et al. (2019), who, in their study of the Anaheim Police Department, hypothesised that BWC usage would dramatically increase with tracking compliance. A study by Hedberg et al. (2017) with the Phoenix Police Department also suggested that complaints could be nearly eliminated through 100% compliance with BWC. This finding corroborates Lum et al.’s (2020) contention that consistent and significant effects are observed when officers have little discretion over activation. Subsequently, future research with QPS should consider whether higher BWC compliance by non-compliant officers would change their behaviour and reduce the number of complaints. This could involve an RCT tracking experiment comparing the top 20% and bottom 20% of BWC activators with the provision that officers in the bottom 20% receive regular granular feedback in terms of rates of BWC activation.
Footnotes
Declaration of conflicting interests
The author(s) declared no potential conflicts of interest with respect to the research, authorship, and/or publication of this article.
Funding
The author(s) received no financial support for the research, authorship, and/or publication of this article.