
Abstract
Background
The escalating prevalence of diabetes underscores the need for precise diagnostic tools to facilitate effective management. Hemoglobin A1c (HbA1c) is a crucial biomarker for long-term glycemic control in diabetic patients. Point-of-care testing (POCT) for HbA1c offers rapid, accessible alternatives to conventional laboratory methods, but uncertainties persist regarding the accuracy and reliability of POCT assays.
Methods
This study evaluates the analytical performance of two boronate-affinity based HbA1c POCT assays, the GreenCare A1c and Cera-Stat HbA1c. Various analytical parameters including precision, linearity, comparison, and accuracy are assessed following guidelines from Clinical and Laboratory Standards Institute (CLSI), with results applied to certification criteria from the National Glycohemoglobin Standardization Program (NGSP) and International Federation of Clinical Chemistry and Laboratory Medicine (IFCC). Furthermore, 52 and 13 frozen EDTA whole blood samples were respectively used for additional evaluation of accuracy and interference due to Hb variants for the GreenCare A1c assay.
Results
Both GreenCare and Cera-Stat demonstrated good precision (repeatability CV% 1.5-1.9 and total imprecision CV% 1.6–2.2), linearity (R2 = 0.9996 & 0.9990), and correlation (r = 0.982 & 0.978) with an established HbA1c analyzer, the Bio-Rad D100. The GreenCare also exhibited good accuracy with frozen EDTA samples with known HbA1c values. Both assays met the certification criteria from NGSP and IFCC, classifying them as “standard” according to IFCC model for quality targets for HbA1c.
Conclusions
This evaluation affirms the reliability of GreenCare and Cera-Stat POCT assays for HbA1c measurements, which can potentially reduce unnecessary referrals and enhance the overall quality of diabetes diagnosis and treatment.
Introduction
The worldwide prevalence of diabetes, a chronic metabolic disease that takes the lives of millions per year, 1 continues to increase and is predicted to affect more than 550 million people by 2030. 2 The multifaceted nature of diabetes demands precise diagnostic tools to enable timely interventions and effective management. Since its discovery in 1955 by Kunkel and Wallenius, 3 Hemoglobin A1c (HbA1c) has emerged and continues to be the pivotal biomarker for long-term glycemic control in individuals with diabetes. 4 HbA1c, a glycated form of hemoglobin, reflects average blood glucose levels over the preceding 2 to 3 months, thus does not require fasting, and provides clinicians with valuable insights into a patient’s overall glycemic history.
Currently, many different methods for measuring HbA1c have been established for routine clinical measurements, such as high-performance liquid chromatography (HPLC), immunoassays, enzyme assays, capillary electrophoresis, etc., with each method having different analytical properties. Traditional laboratory-based assays have proven effective, but the expanding landscape of healthcare necessitates alternatives that are rapid, accessible, and can be deployed at the point-of-care. 5 Specifically, a survey revealed that >50% of primary care physicians wanted more access to HbA1c point-of-care testing (POCT). 6
In response to this growing need, various HbA1c POCT assays have emerged as promising solutions, offering the advantages of convenience, immediate results, and the potential to enhance patient outcomes. However, there exists a simultaneous uncertainty between clinicians with regards to the accuracy and reliability of POCT. 7 Thus, the analytical performance of POCT assays requires rigorous evaluation to ensure their accuracy and reliability in diverse clinical settings.
This study aims to evaluate two HbA1c POCT assays, the GreenCare A1c and Cera-Stat HbA1c, with both assays utilizing a boronate-affinity method. Various analytical parameters will be evaluated according to various guidelines from Clinical and Laboratory Standards Institute (CLSI), and these results will be applied to analytical certification criteria from the National Glycohemoglobin Standardization Program (NGSP) and International Federation of Clinical Chemistry and Laboratory Medicine (IFCC), which are the two most-established organizations for HbA1c standardization.
Materials and methods
Instruments, reagents, and study samples
The analytical performance of the GreenCare A1c assay (GreenCare; GC Medical Science, Yongin, Korea) and Cera-Stat HbA1c assay (Cera-Stat; GC Medis, Cheonan, Korea) were evaluated on their corresponding POCT analyzers GreenCare RT-1000 and Cera-Stat 4000, respectively. Both assays are based on a boronate-affinity method, with free boronic acid conjugate mediated either by beads (GreenCare) or dye (Cera-Stat) binding to non-bound HbA1c. Also, the GreenCare can analyze both frozen and fresh whole blood samples, while the Cera-Stat can analyze only fresh whole blood samples. Finally, conjugate-bound HbA1c is detected via a spectrophotometer and % HbA1c is calculated via comparison with the intensity of total hemoblogin. Conversion from NGSP units (%) to IFCC units (mmol/mol) can be conducted using the following equation: NGSP (%) = [0.09148 × IFCC (mmol/mol)] + 2.152. 8
Residual, fresh EDTA whole blood samples at Seoul National University Bundang Hospital, donated human whole blood specimens with no additives and preservatives, with known HbA1c reference values obtained with a liquid chromatography-mass spectrometry (LC-MS/MS) based reference measurement procedure (RMP)9,10 from the National Medical Reference Laboratory (NMRL) of Korea Disease Control and Prevention Agency (KDCA), and frozen whole blood samples previously confirmed for commonly found Hb variants in the Korean population 11 were used for evaluation. In brief, the RMP involves cleavage of Hb peptides via a Glu-C endoproteinase, subsequently followed separation and quantification of the glycated and non-glycated N-terminal hexapeptides of the β-chain. Depending on the time of acquisition, frozen samples were stored at −70°C for periods ranging from 1 months to 2 years, and thawed before use. All measurements were conducted by current full-time medical laboratory technologists with at least 2 years’ experience using either chemistry analyzers and POCT devices in the clinical laboratory.
The study received renewed approval by the Seoul National University Bundang Hospital Institutional Review Board (IRB number X-2402-885-902).
Precision
Repeatability and total imprecision of the GreenCare assay were evaluated according to the CLSI guideline EP15-A3. 12 Two frozen whole blood samples with HbA1c levels of 6.3 and 8.3% (corresponding to 45.34 & 67.21 mmol/mol, respectively) were measured five times a day, over a total period of 5 days.
Repeatability and total imprecision of the Cera-Stat assay were evaluated according to the CLSI guideline EP15-A3. 12 Two residual, fresh EDTA whole blood samples with HbA1c levels of 6.5 and 8.9% (47.53 and 73.76 mmol/mol) were measured five times a day, over a total period of 5 days.
Coefficients of variation (CV) were calculated for repeatability and total imprecision, and compared with each assays’ claimed precision performance. The precision results were also compared to established precision criteria including both CLSI guideline C44-A, 13 a guideline regarding the harmonization of HbA1c, and clinical practice guidelines from the National Academy of Clinical Biochemistry (NACB). 14
Linearity
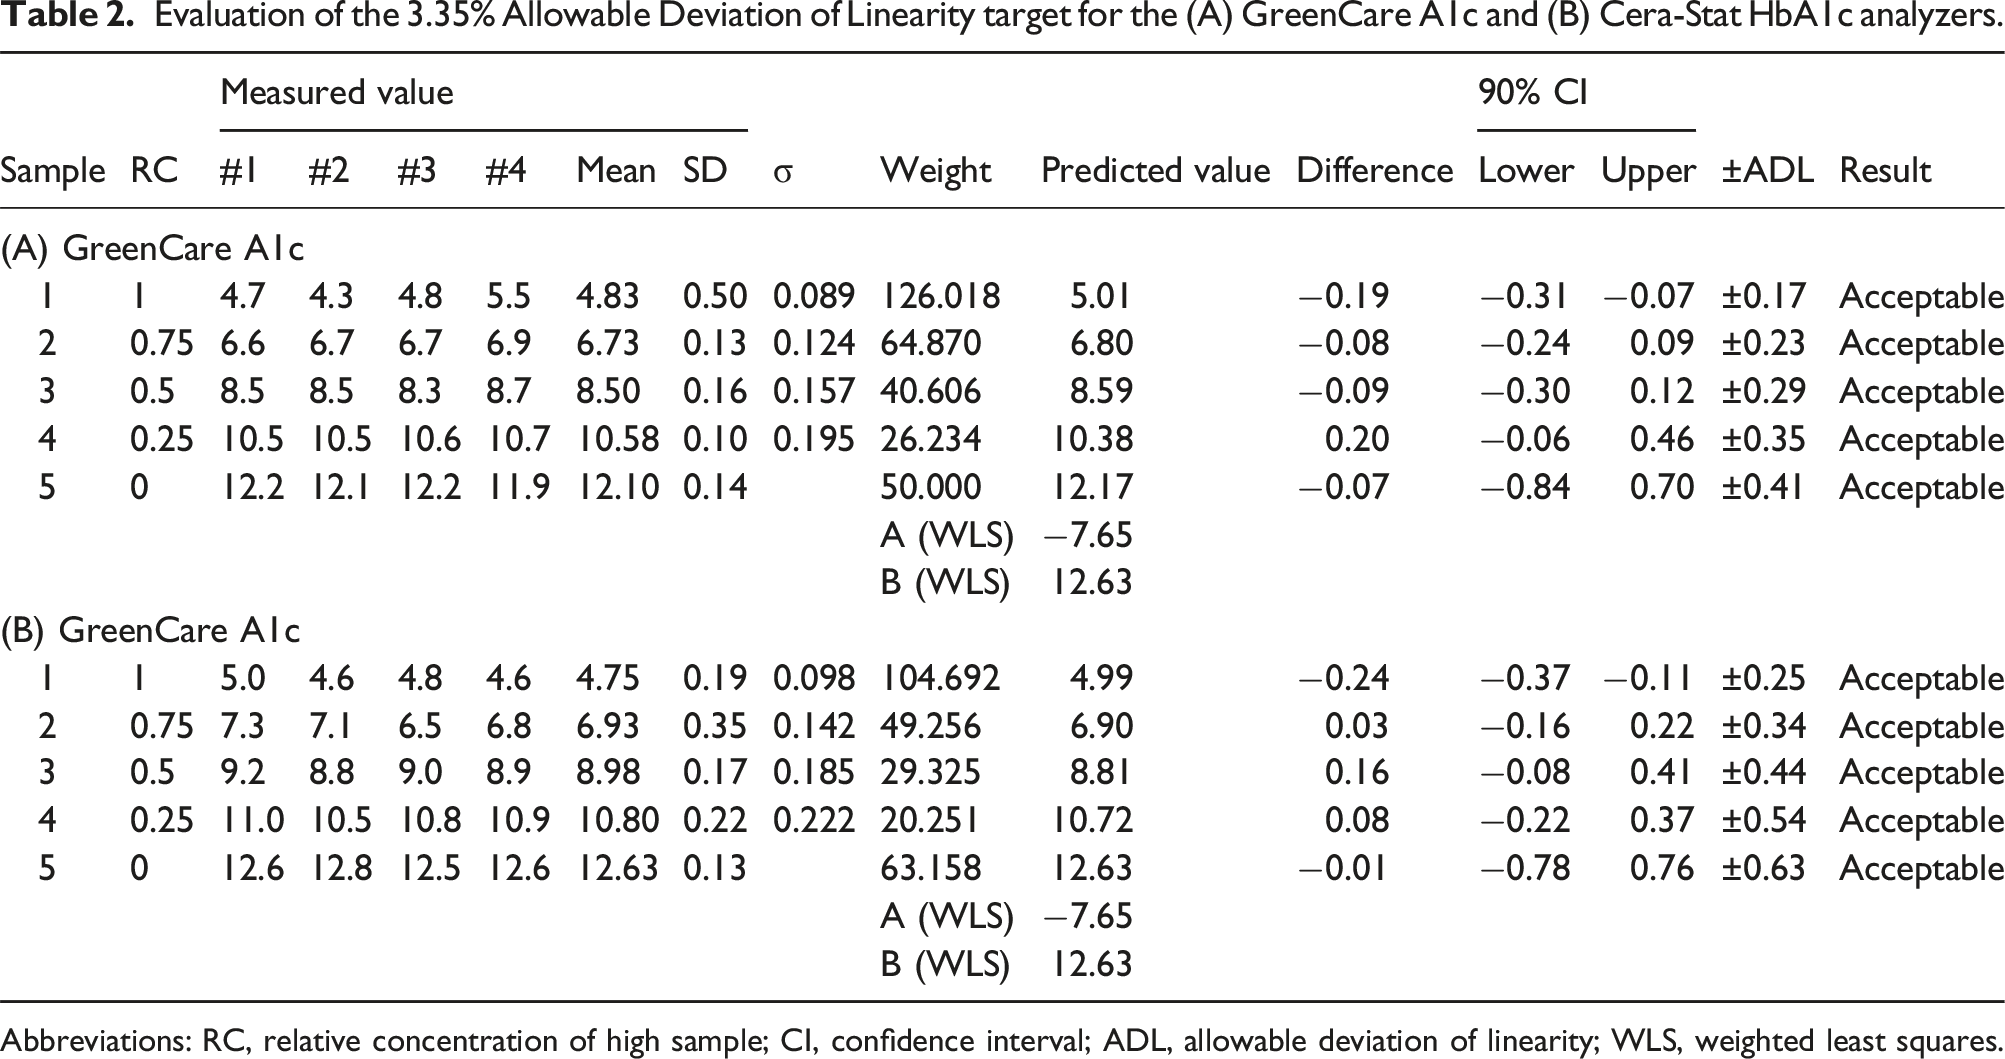
Linearity was evaluated with referral to CLSI guideline EP06Ed2, 15 in which measured values are compared to predicted values derived from a weighted least squares linear regression. For the GreenCare, quadruplicate measurements of five specimens prepared from mixed ratios (100:0, 25:75, 50:50, 25:75, and 0:100) of two frozen EDTA whole blood samples with known low (4.7% or 27.85 mmol/mol) and high (12.2% or 109.84 mmol/mol) HbA1c concentrations obtained via the aforementioned LC-MS/MS based RMP were conducted. For the Cera-Stat, which cannot use frozen samples, quadruplicate measurements were conducted using five specimens prepared from mixed ratios (100:0, 25:75, 50:50, 25:75, 0:100) of two residual, fresh EDTA whole blood samples with low (5.0% or 31.13 mmol/mol) and high (12.6% or 114.21 mmol/mol) HbA1c concentrations measured with a Bio-Rad D100 (D100; Bio-Rad Laboratories, Inc., Hercules, CA, USA), which is a well-established HPLC-based HbA1c analyzer routinely used in our clinical laboratory for HbA1c measurements. As stated in the CLSI guideline, the allowable deviation from linearity (ADL) should generally be less than 50% of the allowable total allowable error (TE), which is usually 6.7% in NGSP units for HbA1c. 16 Thus, an ADL of 3.35% was used for linearity evaluation.
Comparative analysis versus Bio-Rad D100
Fifty-two frozen EDTA whole blood samples were used for comparison of the GreenCare assay to the Bio-Rad D100 (D100; Bio-Rad Laboratories, Inc., Hercules, CA, USA).
Forty residual, fresh EDTA whole blood samples were used for comparison of the Cera-Stat assay with the D100.
CLSI Guideline EP09c 17 was utilized when comparing each POCT assay to the D100, with each sample measured in duplicate, and Passing-Bablok regression and Bland–Altman plots of the compared methods were obtained. The % bias to the D100 at medical decision levels (MDL) of 5.7 and 6.5% (38.78 & 47.53 mmol/mol) were evaluated, with MDL obtained via reference to clinical practice guidelines from the American Diabetes Association (ADA) 18 and Korean Diabetes Association (KDA). 19
Accuracy evaluation using frozen EDTA HbA1c samples (GreenCare A1c only)
Accuracy of the GreenCare was evaluated using 52 frozen whole blood samples, with assigned target HbA1c values (range 4.99%–12.78% or 31.04–116.19 mmol/mol) obtained via an RMP. Passing-Bablok Regression and Bland–Altman plots of the GreenCare assay against the reference values were obtained, and bias at MDL of 5.7 and 6.5% were evaluated. For this study, a target bias of 2% was applied, which gives a good chance of meeting both the NGSP certification criteria and the College of American Pathologists (CAP) criteria.20,21
Evaluation of interference due to Hb variants (GreenCare A1c only)
In Korea, Hb variants which are relatively common in the Western population including Hb C, E, D and S, are very rare. The prevalence of Hb variants in Korea is 1/2700, and those variants which are observed usually are either Hb G-Coushatta or Hb Queens, variants of the β- and α-chains respectively.11,22 In this study, interference due Hb variants was evaluated with 13 frozen whole blood samples that were LC-MS/MS based RMP-confirmed to have an Hb variant: 5 Hb G-Coushatta, 4 Hb Queens, 3 Hb Ube-4, and 1 Hb Yamagata. In order for a more robust evaluation, GreenCare HbA1c measurements of Hb variant samples were compared to the following routine HbA1c analyzers which are commonly used in Korean clinical laboratories: D100 fast mode, Arkray ADAMS HA-8190V Standard mode (HA-8190V; ARKRAY Inc., Kyoto, Japan), HLC-723 G11 (G11; Tosoh Corporation, Tokyo, Japan), Cobas Integra module (Roche Diagnostics, Mannheim, Germany), and CAPILLARYS 2 Flex Piercing (Cap 2FP; Sebia, Lisses, France), depending on sample availability. Due to the limited number of samples, no specific performance criteria were applied. Instead, mean bias±standard deviation (%) for each method were obtained, and the % differences to HbA1c target values were compared between the GreenCare, D100, HA-8190V, G11, Cobas Integra and Cap 2FP HbA1c assays.
Statistical analysis
All statistical analyses were conducted on MedCalc version 22.016 (MedCalc Software, Mariakerke, Belgium) and Labostats v1.5 (Laboratory Medicine Foundation, Seoul, Korea).
Results
Precision
For the GreenCare, repeatability and total imprecision gave CVs [95% confidence intervals] of 1.5 % [1.2-2.3] and 1.6 % [1.3-2.3], at low (6.3%) HbA1c concentrations, and 1.7 % [1.3-2.7] and 1.8 % [1.4-2.8], at high (8.3%) HbA1c concentrations, respectively.
For the Cera-Stat, repeatability and total imprecision gave CVs of 1.9 % [1.5–0.8] and 2.2 % [1.8-3.9], at low (6.5%) HbA1c concentrations, and 1.8 % [1.4–2.7] and 2.0 % [1.6–3.0], at high (8.9%) HbA1c concentrations, respectively.
Imprecision of the GreenCare A1c and Cera-Stat HbA1c assays.
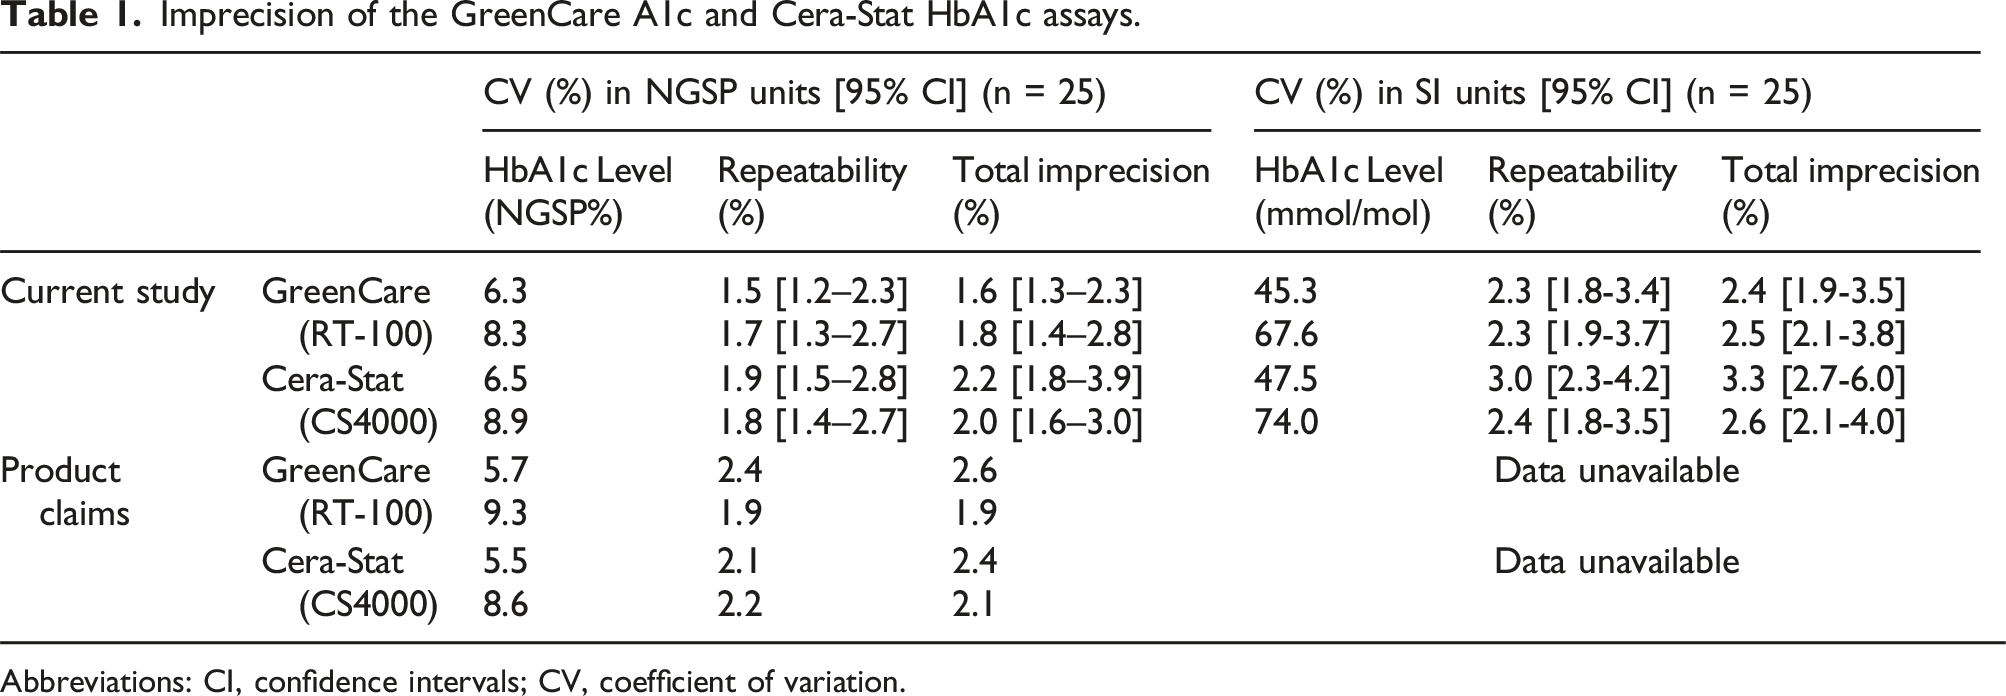
Abbreviations: CI, confidence intervals; CV, coefficient of variation.
Linearity
With five samples ranging 4.7%–12.2% (GreenCare) and 5.0%–12.6% (Cera-Stat), both the GreenCare and Cera-Stat showed good linearity with coefficients of determination (R2) of 0.9996 and 0.9990, respectively (Figure 1). Also, if rounding up is taken into account, both the GreenCare and Cera-Stat met the 3.35% ADL criteria at all measured levels (Table 2). Specifically, the GreenCare gave HbA1c results (average of quadruplicate measurements) of 4.8, 6.7, 8.5, 10.6, and 12.1 % at predicted HbA1c levels of 5.0, 6.8, 8.6, 10.4 and 12.2 %, and Cera-State gave HbA1c results of 4.8, 6.9, 9.0, 10.8 and 12.6 % at expected HbA1c levels of 5.0, 6.9, 8.8, 10.7, and 12.6 %. Linearity of the (a) GreenCare A1c and (b) Cera-Stat HbA1c analyzers. The blue solid line and red dotted lines represent the linear curve and 95% confidence interval, respectively. Data points are the average of the quadruplicate measurements for each specimen. Evaluation of the 3.35% Allowable Deviation of Linearity target for the (A) GreenCare A1c and (B) Cera-Stat HbA1c analyzers. Abbreviations: RC, relative concentration of high sample; CI, confidence interval; ADL, allowable deviation of linearity; WLS, weighted least squares.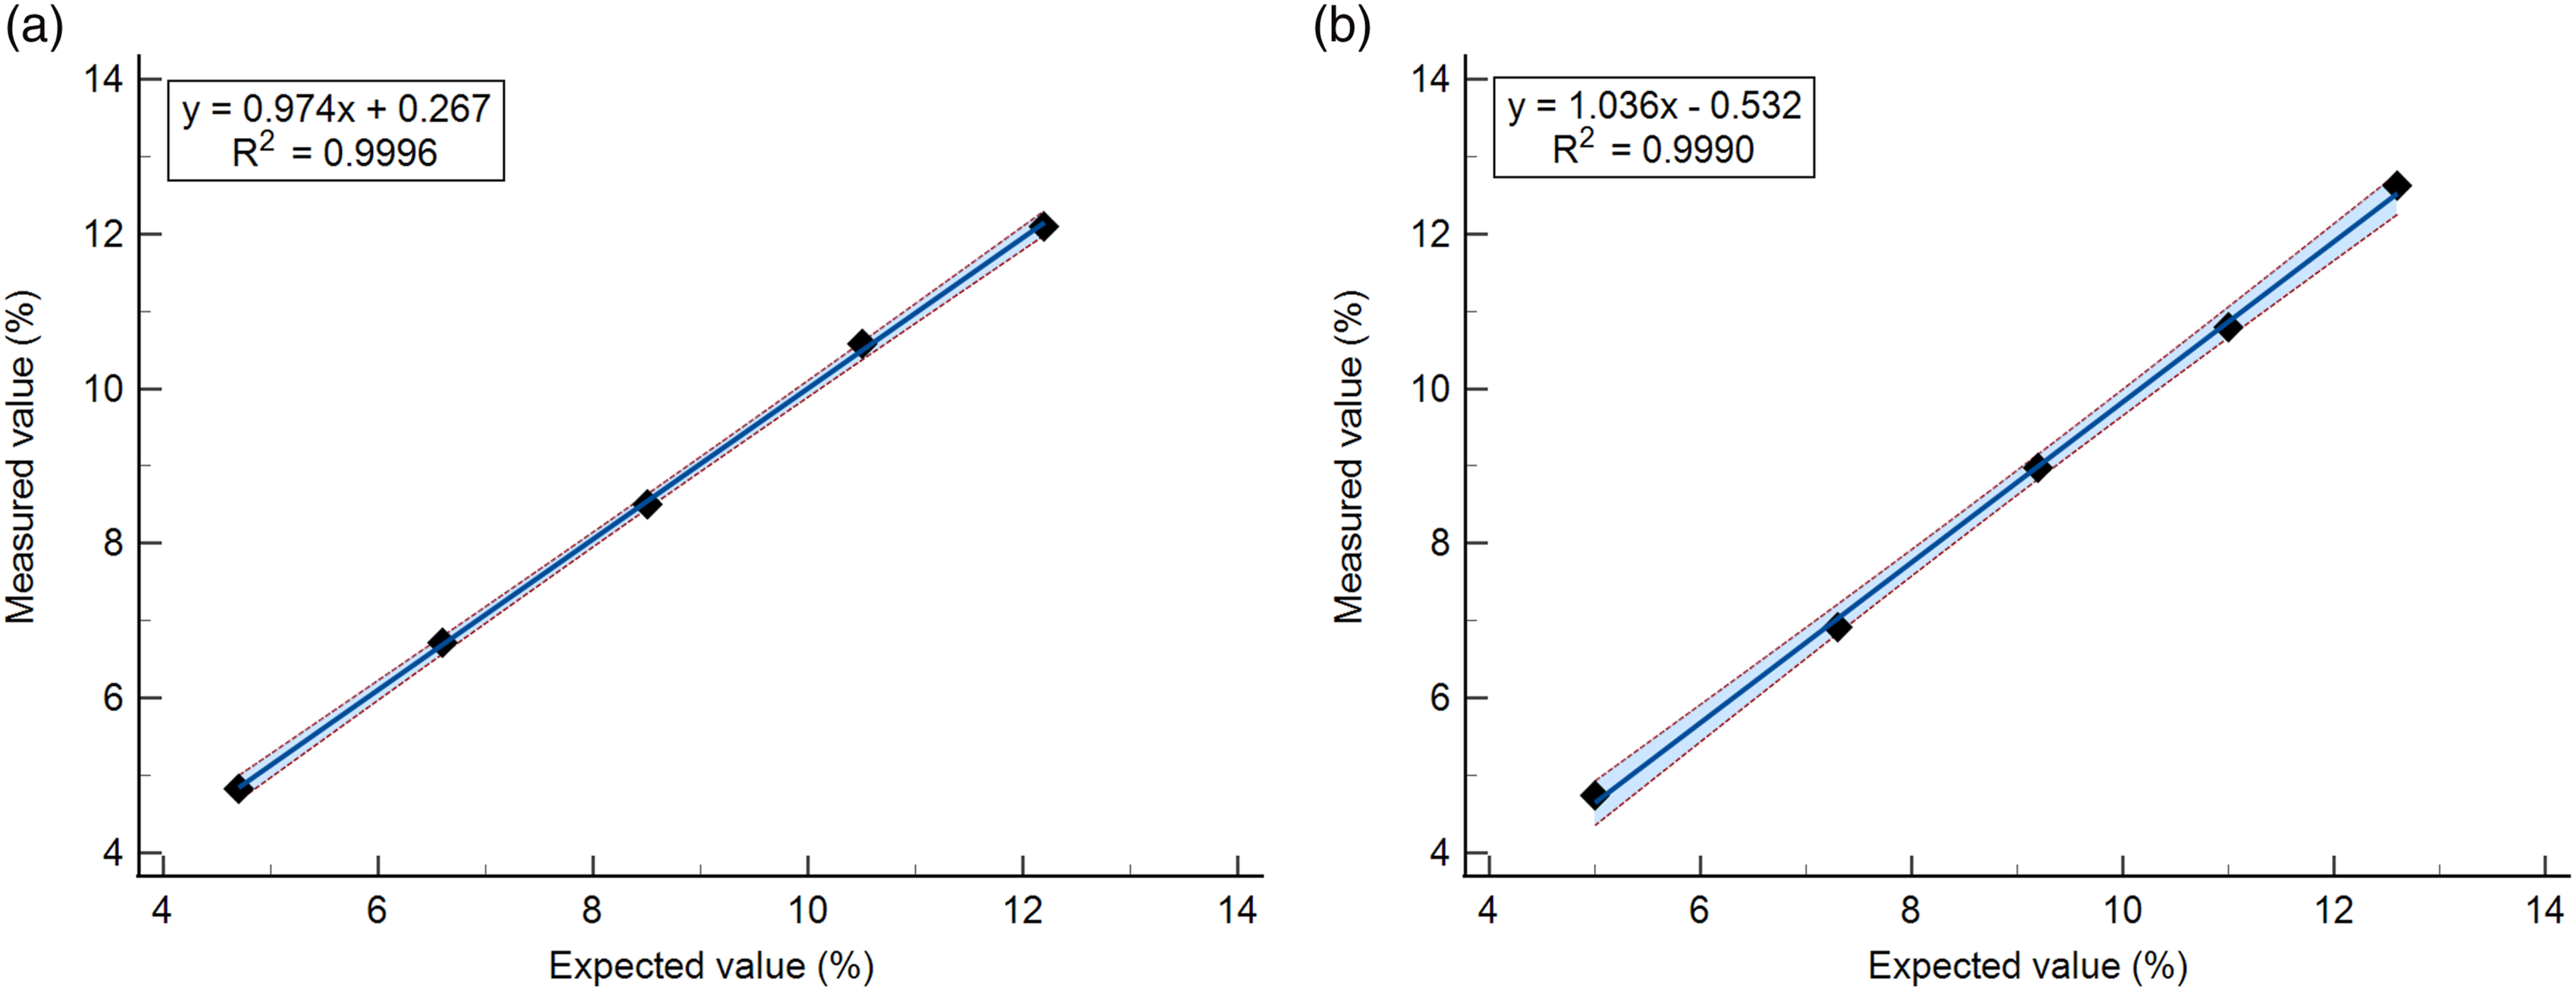
Comparative analysis versus Bio-Rad D100
Passing-Bablok regression between the GreenCare and D100 rendered a slope of 1.028 (95% CI, 0.968-1.090), and an intercept of 0.0818 (95% CI, −0.334 to 0.457) (Figure 2(a)). The Pearson correlation coefficient (r) between the two assays was 0.982. The mean % difference shown on the Bland–Altman plot was 3.5 (95% CI 2.372 to 4.650) (Figure 2(b)). At the HbA1c MDL of 5.7 and 6.5%, the bias versus D100 for the GreenCare were 4.21 and 4.05% respectively. One outlier was observed, rendering a positive bias of 19.07% for the GreenCare compared to the D100 at HbA1c levels ∼10%. Comparison of the GreenCare A1c and Cera-Stat CS4000 POCT analyzers with a Bio-Rad D100 HbA1c assay. (a) Passing-Bablok regression of HbA1c results for the GreenCare A1c. The blue solid line and red dotted lines represent the linear curve and 95% confidence interval, respectively. (b) Bland–Altman plot of HbA1c results for the GreenCare A1c. The blue solid line and red dotted lines represent the mean and 1.96 standard deviation (SD) borders, respectively. (c) Passing-Bablok regression of HbA1c results for the Cera-Stat CS4000. The blue solid line and red dotted lines represent the linear curve and 95% confidence interval, respectively. (d) Bland–Altman plot of HbA1c results for the Cera-Stat CS4000. The blue solid line and red dotted lines represent the mean and 1.96 standard deviation (SD) borders, respectively.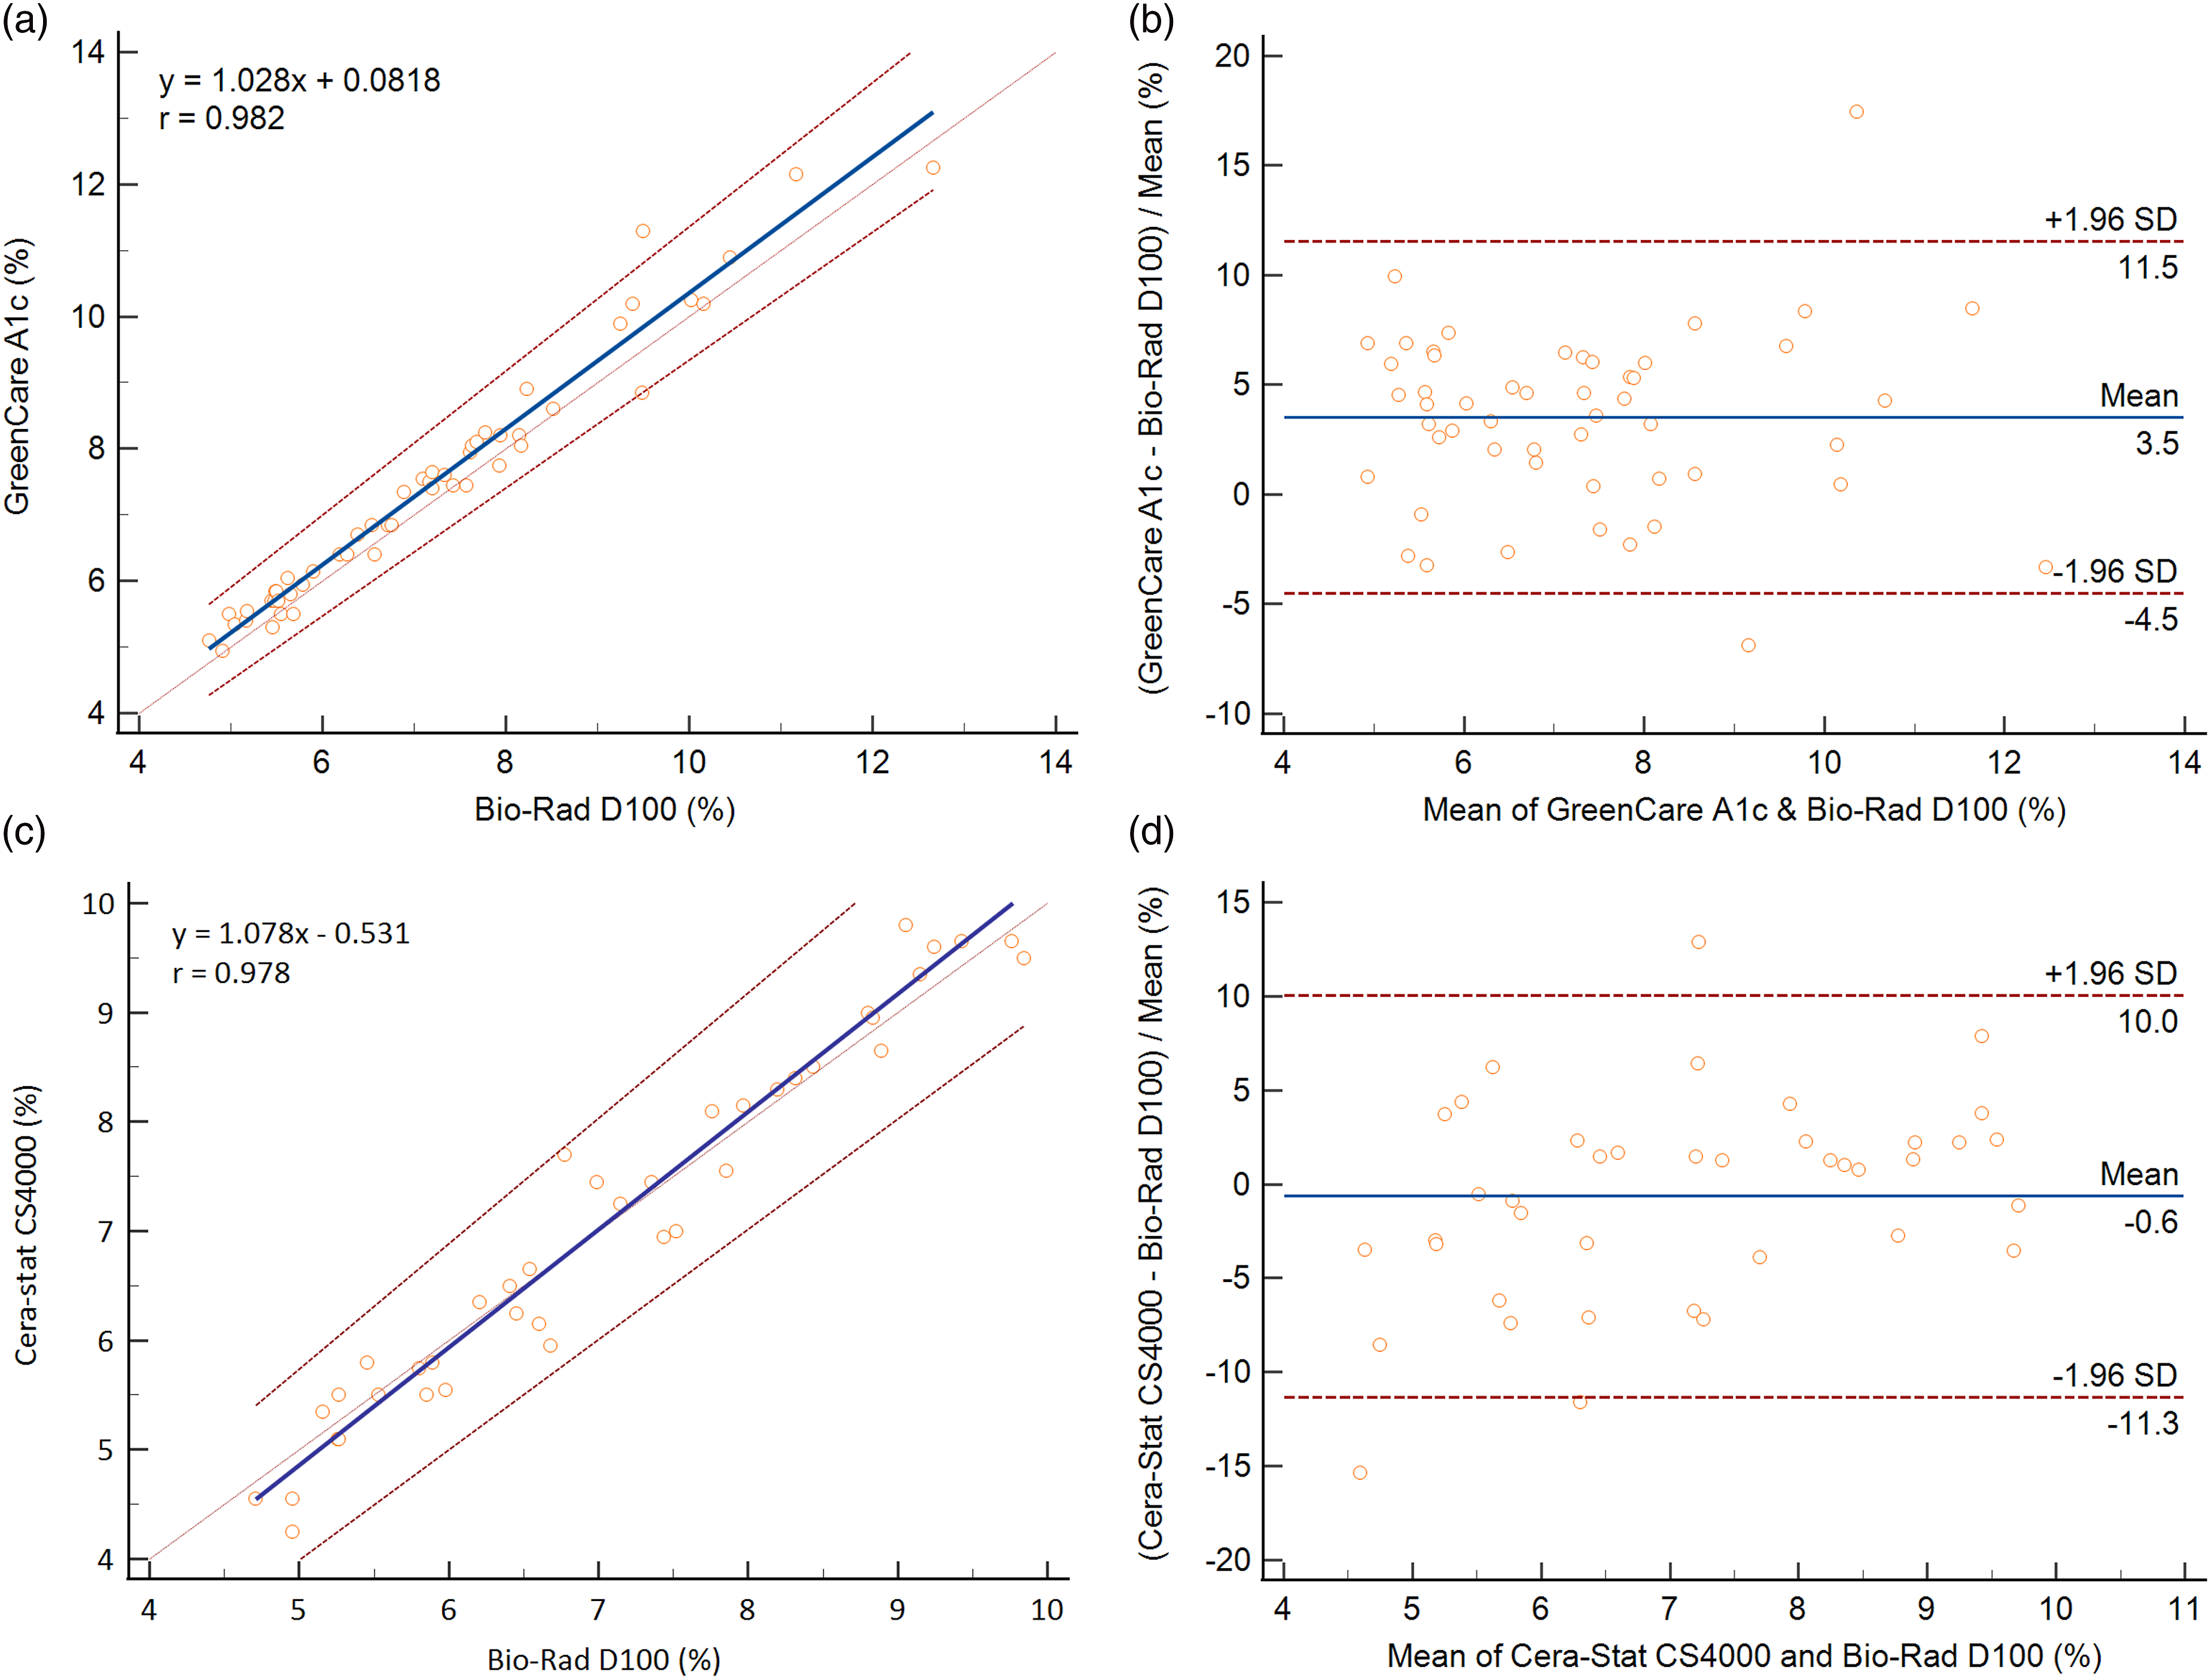
Passing-Bablok regression between the Cera-Stat and D100 rendered a slope of 1.078 (95% CI 1.009–1.148), and an intercept of −0.531 (95% CI −1.054 to −0.000) (Figure 2(c)). The Pearson correlation coefficient between the two assays was 0.978. The mean % difference observed on the Bland–Altman plot was −0.6 (95% CI −2.383 to 1.101) (Figure 2(d)). At the HbA1c MDL of 5.7 and 6.5 %, the bias versus D100 for the Cera-Stat were −1.51 and −0.37% respectively.
Accuracy evaluation using frozen EDTA HbA1c samples (GreenCare A1c only)
The GreenCare was used to measure HbA1c for frozen EDTA whole blood samples with known HbA1c target values (4.99%–12.78% or 31.04–116.19 mmol/mol). Regression of the GreenCare against the target HbA1c values gave a slope of 1.077 (95% CI, 1.007–1.146), an intercept of −0.373 (95% CI, −0.813 to 0.120), and a Spearman rank correlation coefficient (r) of 0.975 (Figure 3(a)). A Bland–Altman plot of HbA1c values measured via the GreenCare showed a mean % difference of 2.6 (95% CI, 1.310–3.897) (Figure 3(b)). At the HbA1c MDL of 5.7 and 6.5%, the % bias for the GreenCare were 1.12 and 1.94% respectively. Accuracy assessment of the GreenCare A1c using frozen EDTA whole blood with assigned HbA1c target values measured via an IFCC RMP (LC-MS/MS). (a) Passing-Bablok regression plot of the GreenCare A1c against target HbA1c value (%). The blue solid line and red dotted lines represent the linear curve and 95% confidence interval, respectively. (b) Bland–Altman plot of the % bias of the GreenCare A1c against target values. The blue solid line and red dotted lines represent the mean and 1.96 standard deviation (SD) borders, respectively.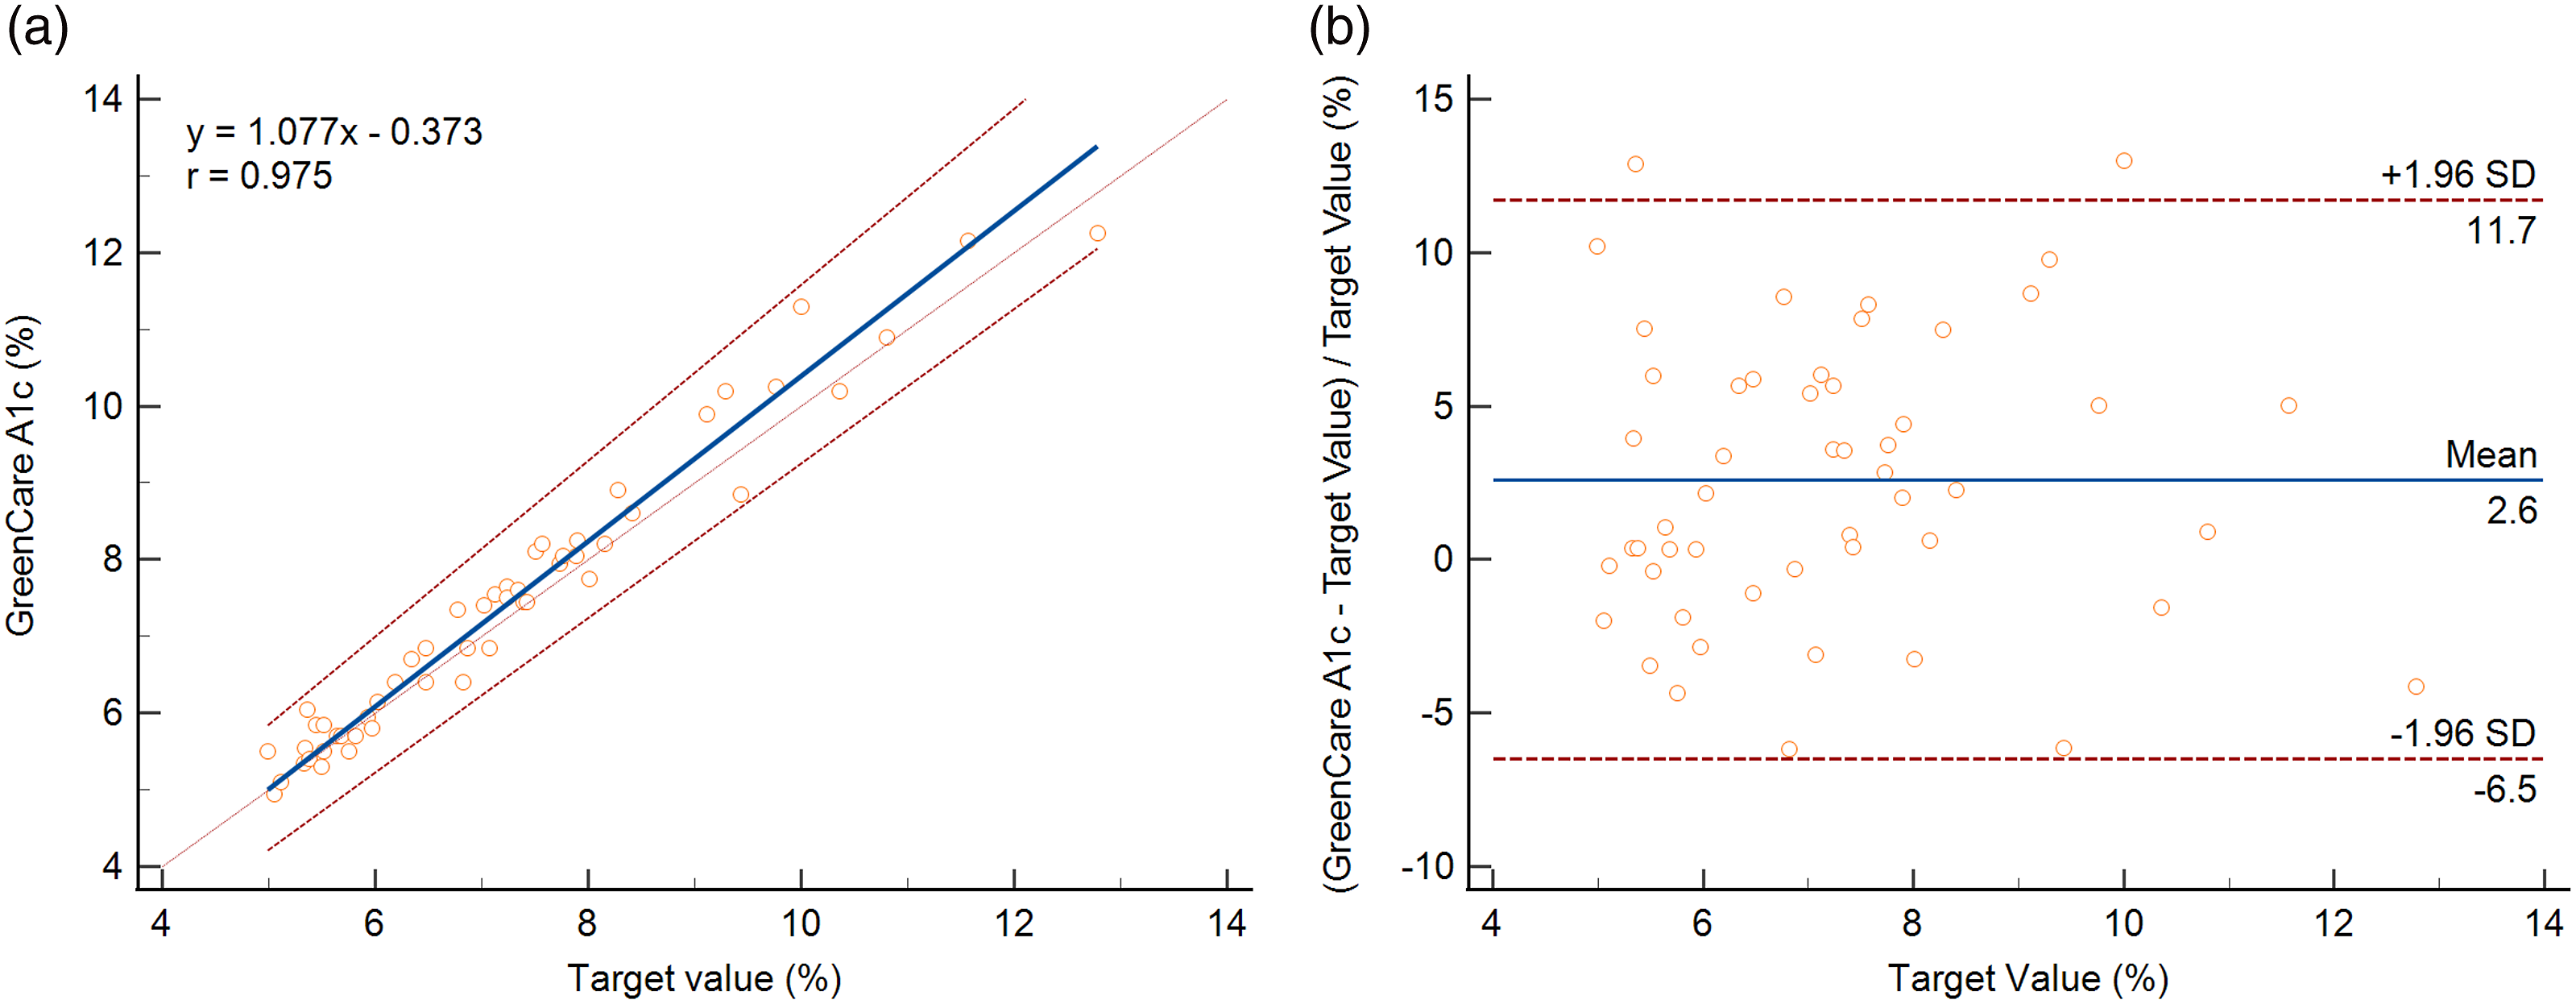
Evaluation of interference due to Hb variants (GreenCare A1c only)
Mean bias ± standard deviation (%) of HbA1c methods compared to reference target values a for four known Hb variants.
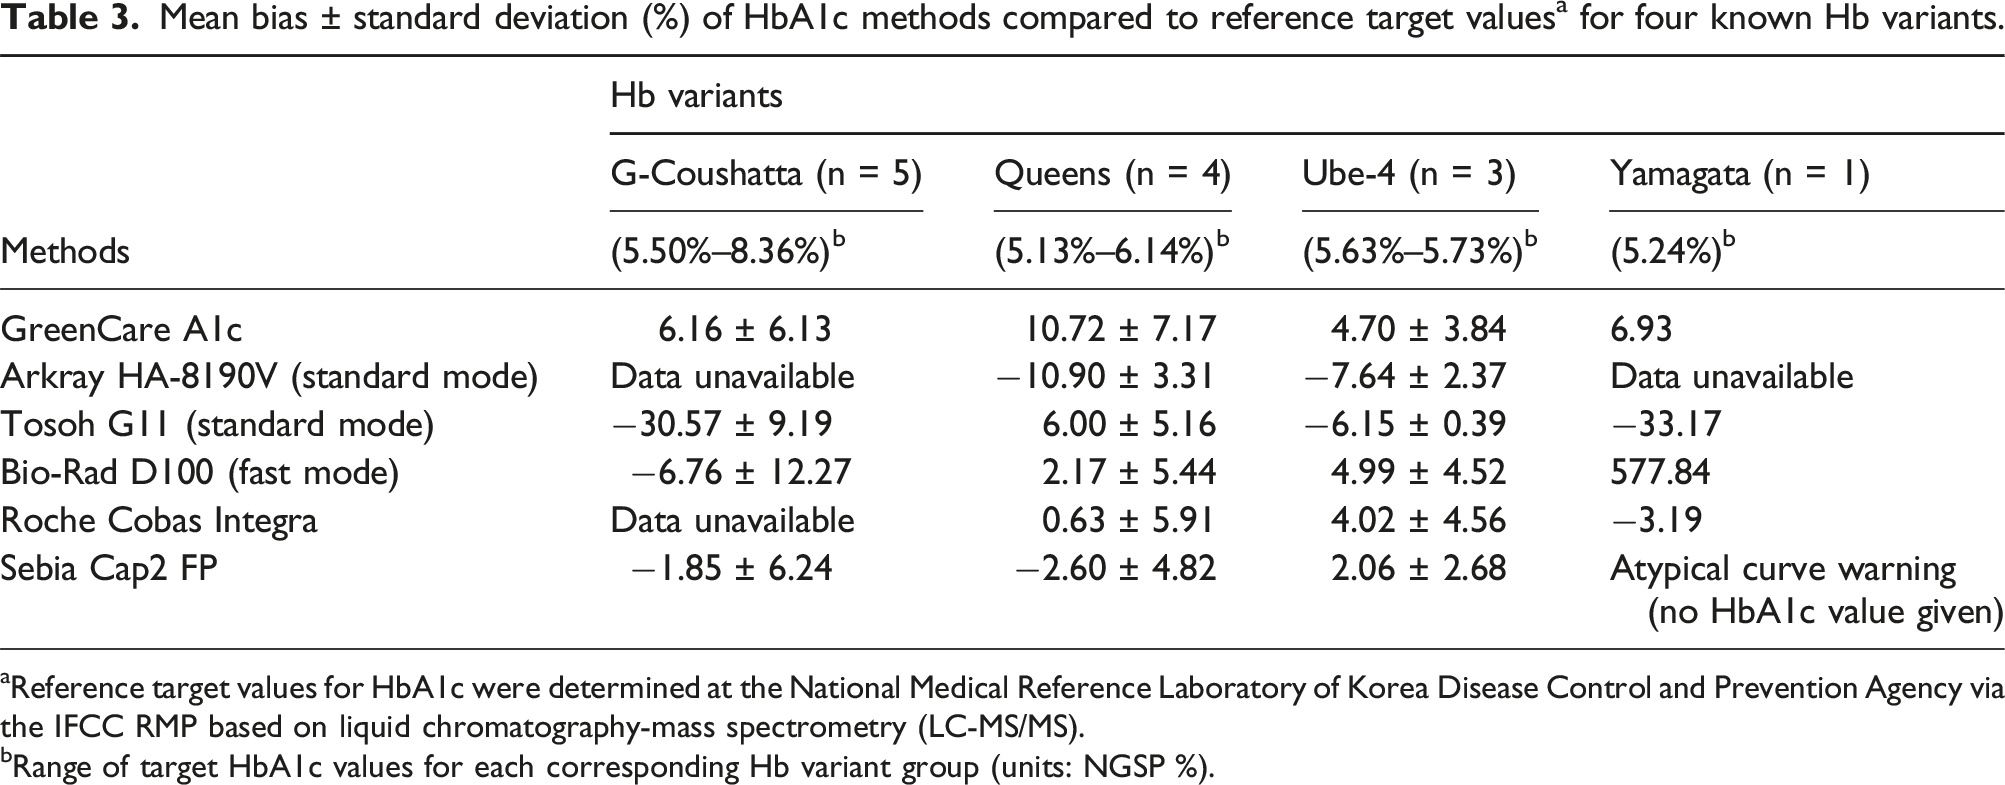
aReference target values for HbA1c were determined at the National Medical Reference Laboratory of Korea Disease Control and Prevention Agency via the IFCC RMP based on liquid chromatography-mass spectrometry (LC-MS/MS).
bRange of target HbA1c values for each corresponding Hb variant group (units: NGSP %).
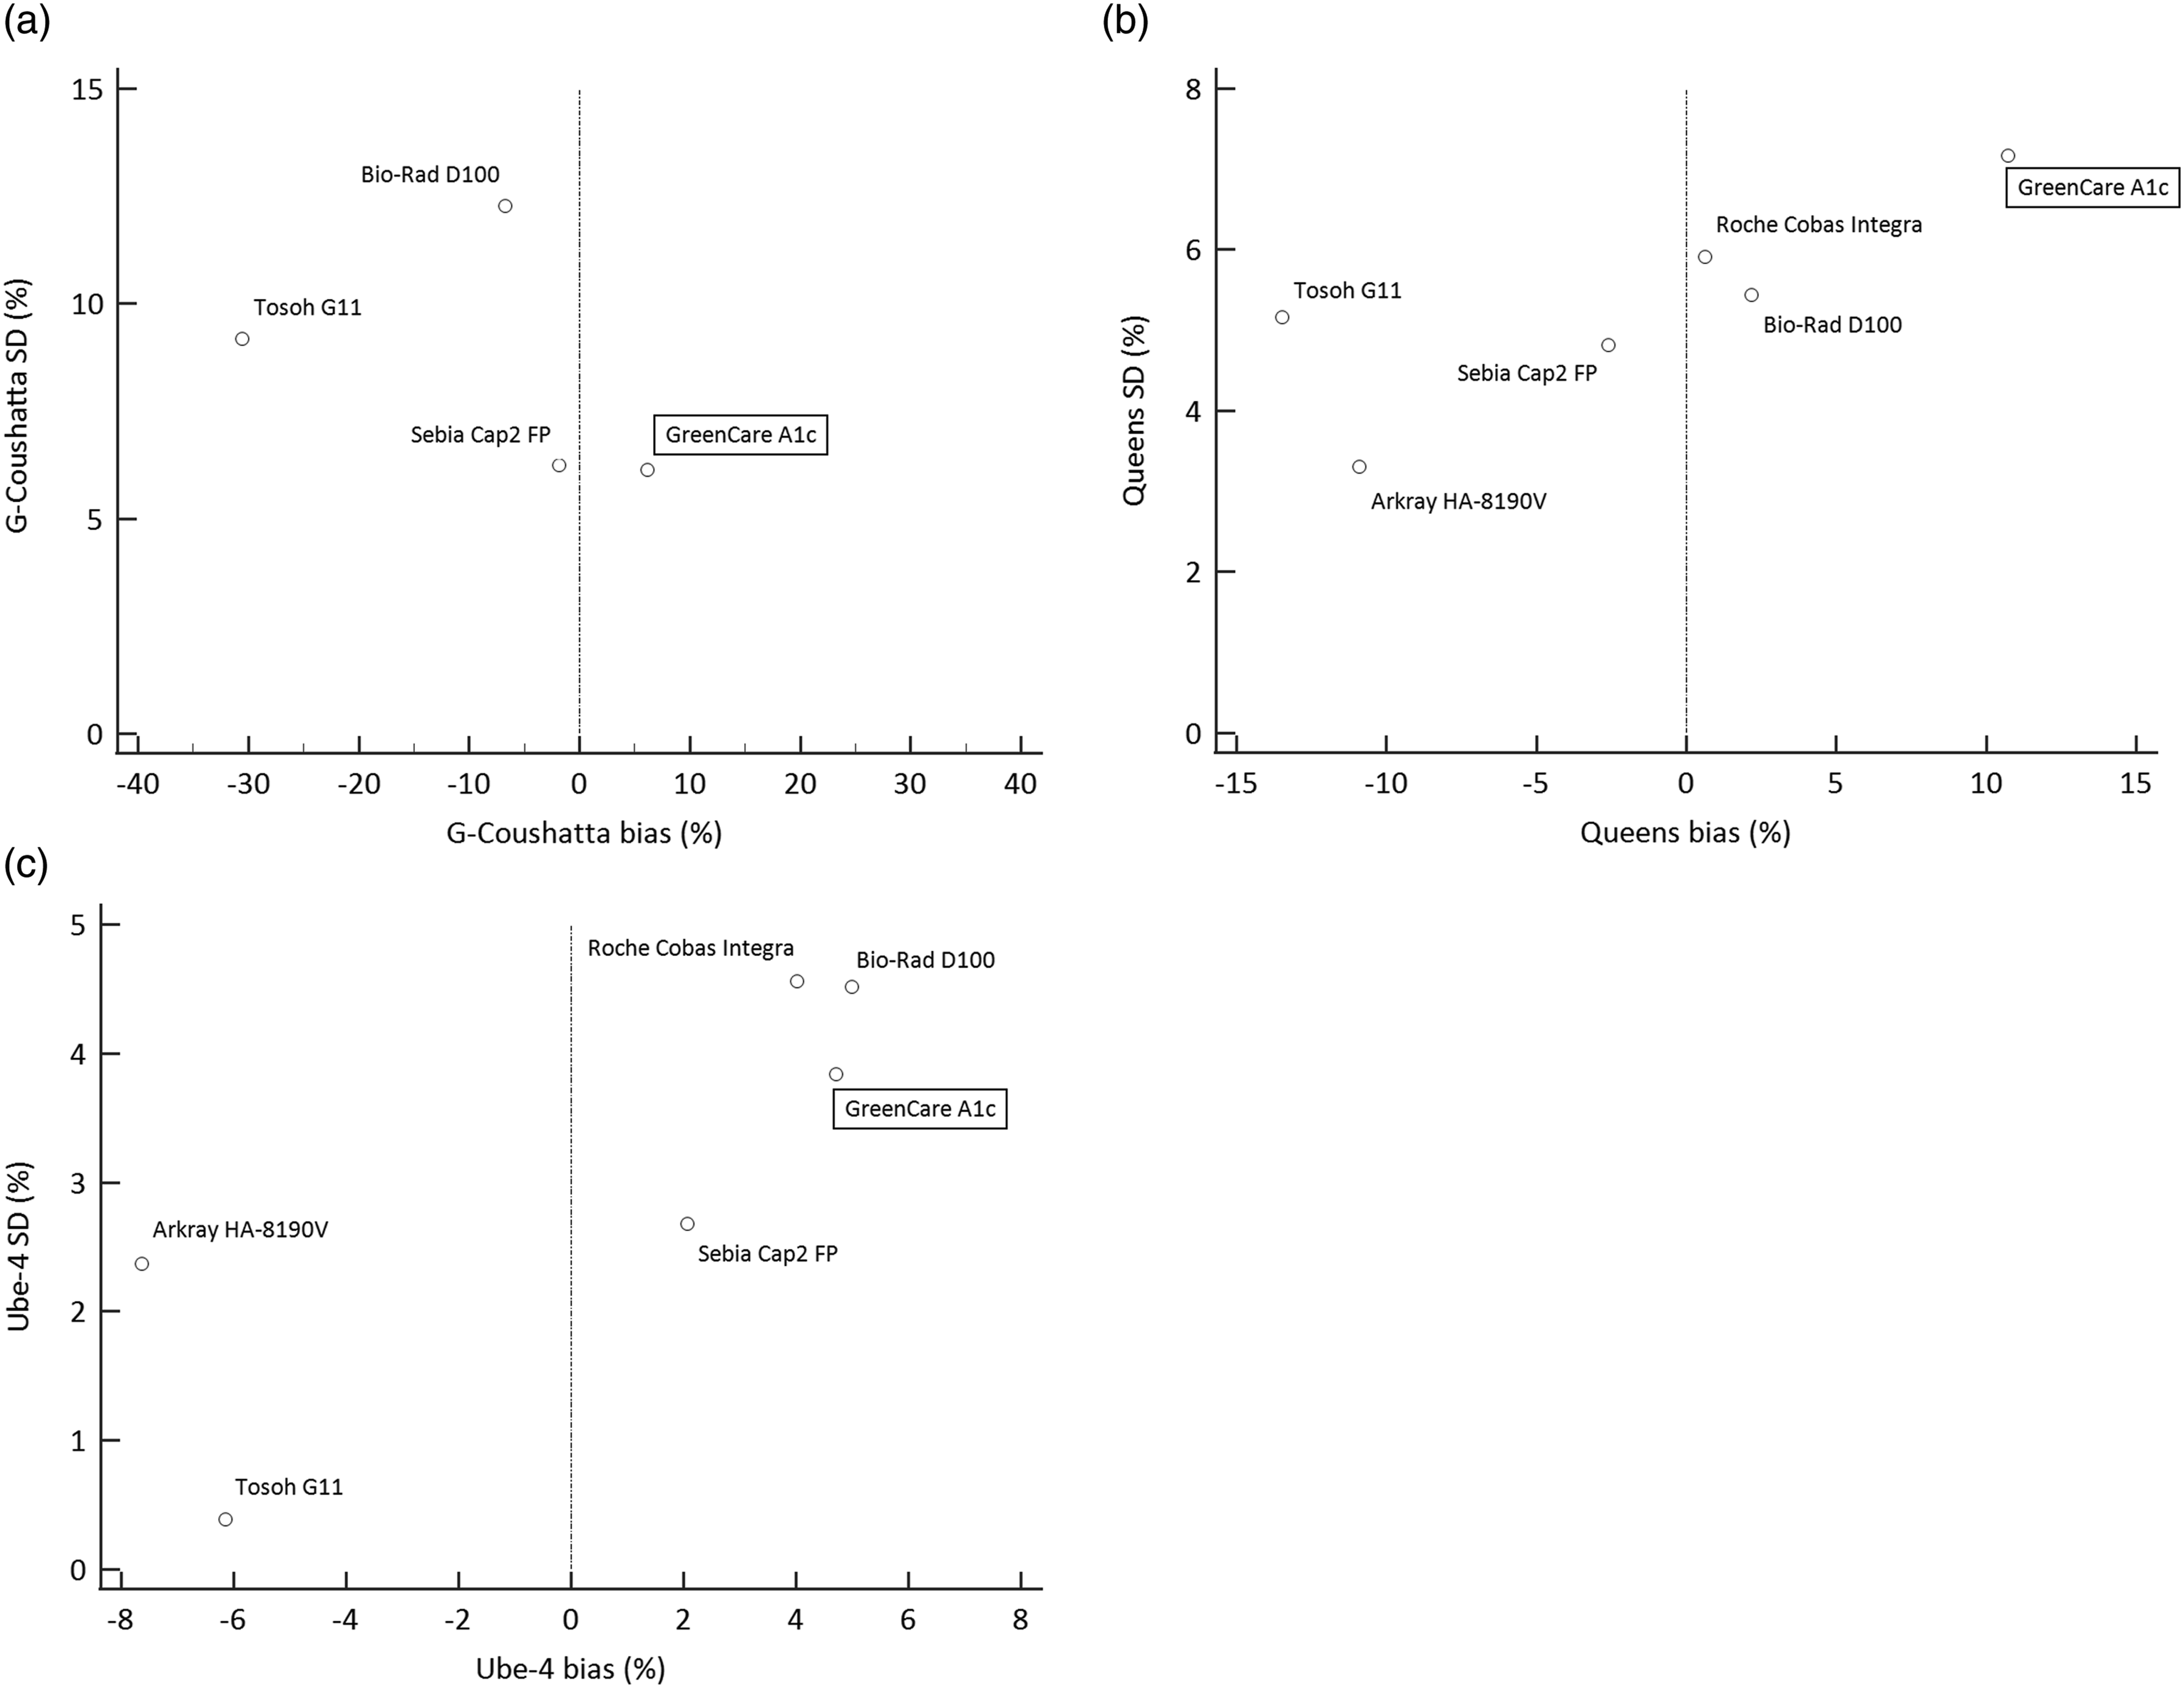
Scatter plot demonstrating % bias and SD of HbA1c values using frozen whole blood samples with the following known Hb variants: (a) Hb G-Coushatta (b) Hb Queens (c) Hb Ube-4. The vertical dotted lines represent the lines of 0% bias. Note: Data for Hb Yamagata not shown due to n = 1 (see Table 3).
Discussion
In this study, the analytical performance of two HbA1c POCT assays, the GreenCare A1c and Cera-Stat, were evaluated. Performance parameters including precision, linearity, and comparative analysis with an established HbA1c assay (Bio-Rad D100) was conducted for both POCT assays, and in the case of the GreenCare A1c, additional testing for accuracy and interference due to Hb variants was conducted. For convenience, HbA1c levels are reported primarily in NGSP (%) units, and corresponding values in IFCC (mmol/mol) units are given when deemed appropriate.
Both the GreenCare A1c and Cera-Stat showed good precision, the repeatability at low and high HbA1c yielded CVs of 1.5 and 1.7% for the GreenCare A1c, and 1.9 and 1.8% for the Cera-Stat. The total imprecision at low and high HbA1c yielded CVs of 1.6 and 1.8% for the GreenCare, and 2.2 and 2.0% for the Cera-Stat, respectively. Although the evaluated HbA1c levels are slightly discrepant, the imprecision results of the current study are mostly in accordance with or slightly better than the respective products’ claims (Table 1). Depending on the measure of unit (NGSP % vs IFCC mmol/mol), the acceptance criteria for analytical precision must be applied differently.16,23,24 The total imprecision of the GreenCare (at both low and high HbA1c levels) and Cera-Stat (at high HbA1c levels) POCT assays suffice not only the relatively lenient CV <5% (NGSP) criteria given by the CLSI guideline C44-A, 13 but also the more stricter CV <2% (NGSP; <3% in IFCC units) criteria recommended by the NACB. 14
Despite the advances in both the diagnosis and treatment of diabetes, patients with poor compliance can show dramatically high or low HbA1c values. Therefore, a good HbA1c assay ought to give reliable results over a wide range. In this study, both the GreenCare and Cera-Stat showed good linearity in the evaluated HbA1c range of 4.7%–12.2%, with conventional R2 values of 0.9996 and 0.9990, respectively (Figure 1). Furthermore, the more recent concept of ADL was implemented in this linearity evaluation, and all measurements of both the GreenCare and Cera-Stat met 3.35% ADL criteria (Table 2). These results are in line with both products’ claims of linearity (4.0%–15.0% for GreenCare, 3.0%–15.0% for Cera-Stat).
Comparison with a Bio-Rad D100, an HPLC-based HbA1c analyzer, which is one of the most commonly used analyzers in Korean clinical laboratories, was conducted for the 2 POCT assays. Both the GreenCare and Cera-Stat showed good correlation with the D100, with Pearson correlation coefficients of 0.982 and 0.978, respectively. Mean biases of both POCT assays were small, with 3.5% for the GreenCare and −0.6% for the Cera-Stat. As demonstrated in Figure 2, a gradual positive bias versus D100 for both POCT assays is observed in the higher levels of HbA1c. This observation is consistent with previous findings regarding negative biases of HPLC-based HbA1c assays at higher HbA1c levels.25,26 At the MDL of 5.7 and 6.5%, the bias versus D100 for the GreenCare were 4.21 and 4.05% respectively, while the bias versus D100 for the Cera-Stat were −1.51 and −0.37% respectively. For the few samples showing up as outliers in the Bland–Altman plots (Figure 2(b) and (d)), no particular cause or pattern could be identified, although some delays in measurement leading to decreased sample stability at room temperature could be one less likely, but not impossible cause. While the Cera-Stat versus D100 comparison used 40 residual, fresh EDTA whole blood samples, the GreenCare versus D100 comparison used 52 frozen EDTA whole blood samples to facilitate the simultaneous evaluation of accuracy. In future studies, it would be interesting see whether there is any significant change in the % difference of the GreenCare results if fresh whole blood samples are used.
As previously mentioned, 52 whole blood samples with known HbA1c values measured via an RMP at the NMRL-KDCA, were used to evaluate the accuracy of the GreenCare, which can handle both frozen and fresh samples. At an evaluated range of 4.99%–12.78% (31.04–116.19 mmol/mol), regression against the target values yielded a Spearman correlation coefficient of 0.975, and Bland–Altman plot showed a mean % bias of 2.6 (95% CI, 1.310–3.897) versus target HbA1c values (Figure 3). Although the mean % bias exceeded the target bias of 2%, the accuracy at MDL was much more impressive, with % bias of 1.12 and 1.94% at MDL of 5.7 and 6.5%, respectively. Similar to the comparative analysis, the few samples showing up as outliers in the Bland–Altman plots (Figure 3(b)) could not be attributed to any particular cause.
To evaluate the interference of Hb variants, HbA1c was measured using the GreenCare assay with frozen whole blood samples with known Hb variants and target HbA1c values measured via an RMP at the NMRL-KDCA. The evaluated Hb variant sample consisted of the following: 5 Hb G-Coushatta, 4 Hb Queens, 3 Hb Ube-4, and 1 Hb Yamagata, which are the relatively common Hb variants in the Korean population. These rare variants have been reported to interfere with HbA1c results, meaning that the resistance to variant-induced interference is important to an HbA1c assay’s performance. Specifically, Hb G-Coushatta and Hb Queens has been reported to show clinically significant biases (absolute differences >0.6% at HbA1c 6% and >0.7% at HbA1c 7%) for various commercial HPLC analyzers like the Bio-Rad Variant II and Variant II Turbo (Bio-Rad Laboratories, Inc., Hercules, CA, USA), Tosoh G7 (Tosoh Corporation, Tokyo, Japan), and Arkray HA-8160 (ARKRAY Inc., Kyoto, Japan), while Hb Ube-4 also could not be differentiated with a Tosoh G7. 27 In another study, Hb Queens gave incorrect results for a Diazyme Direct Enzymatic HbA1c assay (Diazyme Laboratories, Poway, CA, USA) on a Roche Cobas c501 system (Roche Diagnostics, Mannheim, Germany). 28
Measurements of the Hb variant samples with GreenCare, in addition to the following HbA1c analyzers: HA-8190V standard mode, G11, D100 fast mode, Cobas Integra and Cap 2FP, are shown in Table 3 and Figure 4. The GreenCare showed commendable performance in the presence of Hb variants, shown by mean % bias of 6.16 for G-Coushatta, 10.72 for Queens, 4.70 for Ube-4, and 6.93 for Yamagata, which are comparable to those of the other evaluated commercial HbA1c analyzers in this study. Also, the results were reliable for all variant samples, with no erratic outliers (e.g., bias >20%), as shown by a % SD of 6.13 for G-Coushatta, 7.17 for Queens, and 3.84 for Ube-4. Despite these results, the very limited number of samples means that no clear conclusion can be derived from the variant analysis, and should only be used for arbitrary reference.
Currently, both the GreenCare and Cera-Stat are listed as a certified method by both the NGSP
29
and IFCC.
30
Manufacturer certification by the NGSP requires a 40-sample comparison with a NGSP SRL, with 36 of 40 results within ±5% of SRL results.
29
The IFCC certification criterion is defined as “TE of 5 mmol/mol at an HbA1c concentration of 50 mmol/mol with a risk level of 2σ,” with further classification as standard, bronze, silver, and gold according to TE (mmol/mol) ≤5.0, ≤3.3, ≤2.2, and ≤1.1, respectively.31,32 The analytical performance from this evaluation verifies both POCT assays’ certification; based on our results, the GreenCare and Cera-Stat would both be classified as “standard” according to the IFCC model for quality targets for HbA1c (Figure 5). Considering that many new POCT analyzers/assays are often well-marketed with “new features” but come up short on actual performance,
33
the evaluation results of this study will hopefully encourage other POCT manufacturers to enhance the performance of their current and future products. The two assays evaluated in this study, GreenCare and Cera-Stat, each have their own advantages and disadvantages. The GreenCare A1c assay and corresponding analyzer (RT-100) is limited exclusively to HbA1c (and estimated average glucose), but can handle frozen and lyophilized samples in addition to fresh samples. It also has the big advantage of easy storage conditions (2°C–30°C) for the assay components, which will appeal to clinics with limited storage space. Meanwhile, the Cera-Stat HbA1c assay is one component of a kit that runs on its corresponding analyzer (CS4000), which can run tests for other analytes including CRP, glucose, hemoglobin, and lactate. However, the Cera-Stat HbA1c is limited to only fresh EDTA whole blood samples, and assay components require more stricter storage conditions (2°C–8°C). Due to their slight differences in clinical utility, clinicians can use which assay meets their clinical requirements and/or preferences. Classification of the evaluated HbA1c POCT assays according to the IFCC model for quality of targets for HbA1c.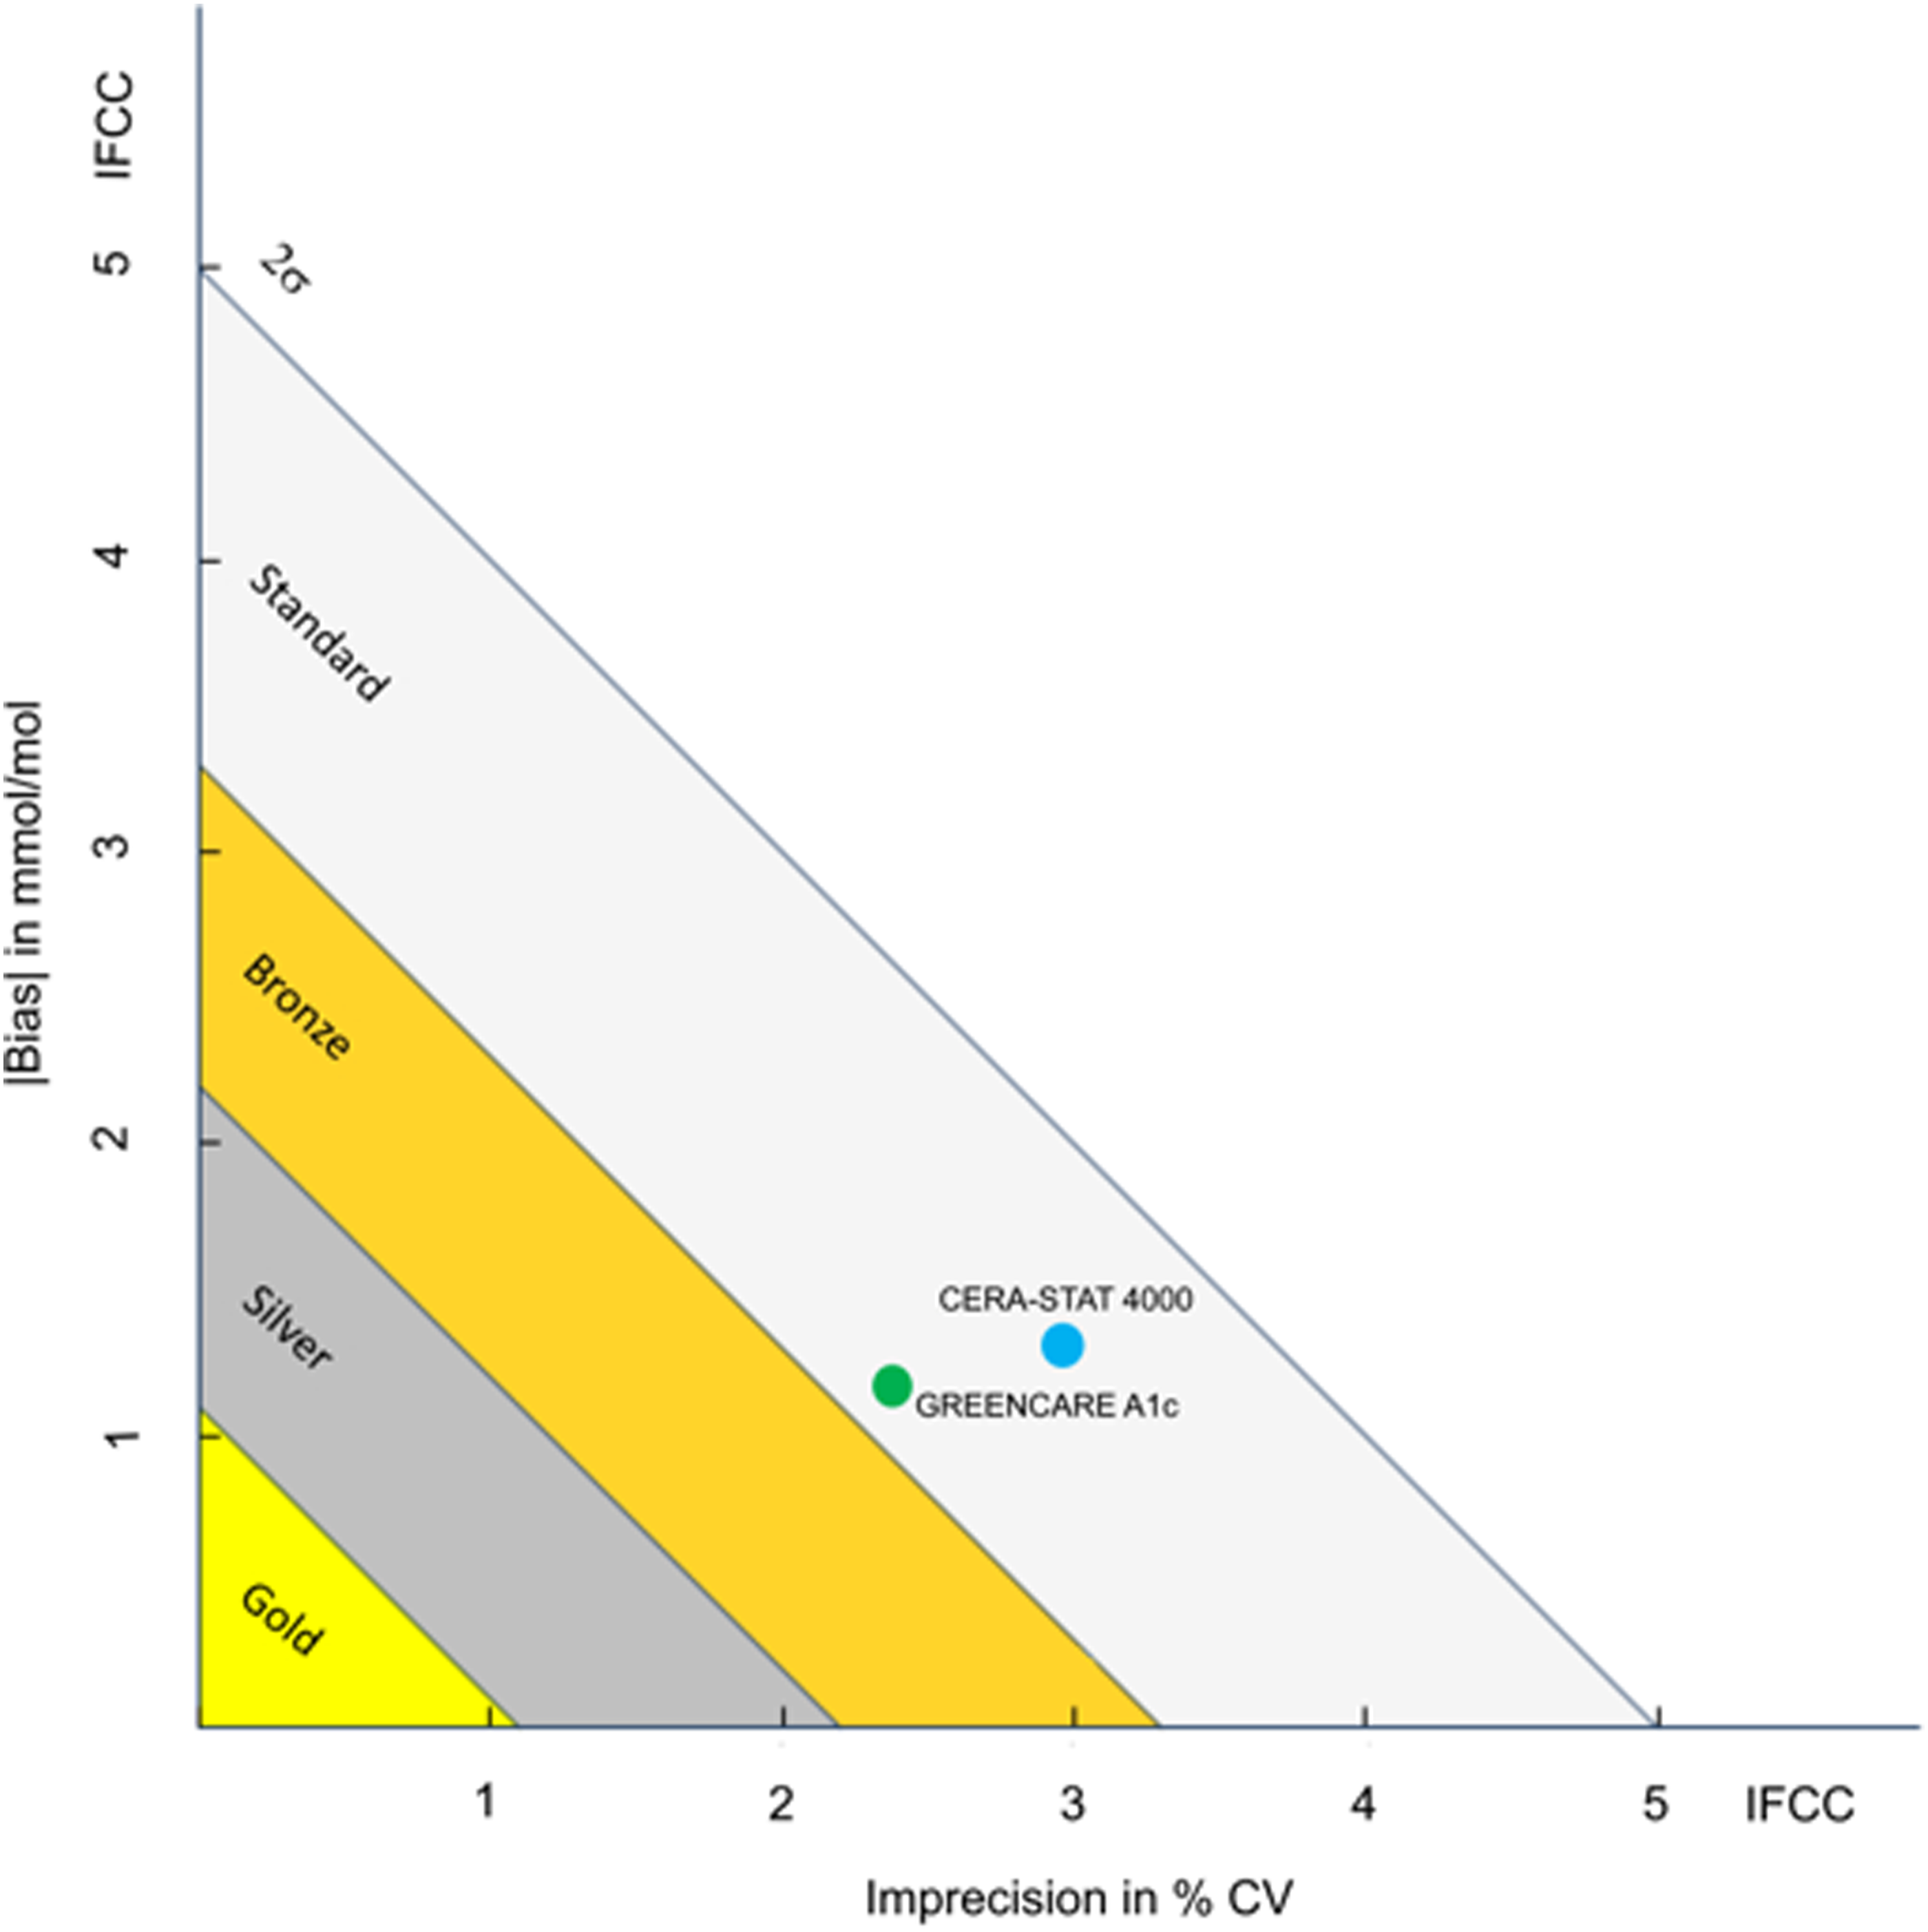
Although this study evaluated many factors of analytical performance of the 2 POCT assays, there are some limitations. Due to limited sample availability and intrinsic limitations of the assays, evaluation of the GreenCare was conducted primarily using frozen EDTA whole blood samples, while the Cera-Stat utilized fresh EDTA whole blood samples. Ideally, in order to be able to directly compare the two assays, evaluation of the GreenCare should be done using two sets of samples: One set of frozen EDTA whole blood and one set of residual, fresh EDTA whole blood samples. Another limitation is that comparative analysis with a routine HbA1c analyzer was only conducted against the D100. Although HPLC-based HbA1c methods are most commonly used in Korean laboratories, 34 further comparison, similar to the Hb variant evaluation, with another HPLC-based assay, and other methods (e.g., immunoassay, capillary-based, enzyme assays, etc.) would give a more thorough comparison. This is again due to limited sample availability, and if required, a future validation study should be conducted with an ample number and volume of samples. Furthermore, the Hb variants evaluated in this study (Hb G-Coushatta, Queens, Ube-4, and Yamagata) are limited to those which are relatively commonly found in the East Asians. This allows for good resistance against Hb variants in found in Korean clinical settings, but the interference due to other common Hb variants found in different ethnicities, such as Hb C, E, D and S, remains unevaluated. For clinical use in other regions of the world, evaluation for interference due to these Hb variants should be conducted. Finally, although HbA1c is a good long-term glycemic marker, there are a few exceptions where it does not accurately portray a patient’s glycemic history, such as hemolytic anemia or hemodialysis patients. In such cases, alternative glycemic biomarkers such as fructosamine and glycated albumin can be utilized. Although this study did not use samples were from hemolytic anemia or hemodialysis patients, future HbA1c evaluation studies should consider measuring fructosamine and glycated albumin in conjunction to HbA1c for a more complete evaluation.
In conclusion, a thorough evaluation of analytical performance was conducted on 2 HbA1c POCT assays evaluated in this study, GreenCare and Cera-Stat. Both showed commendable precision, linearity, and good correlation with another routine HbA1c analyzer especially at the important MDL of 5.7 and 6.5%. Moreover, the GreenCare showed good accuracy and resistance to Hb variants. These results affirm that both POCT assays can be reliably used in clinical settings for HbA1c measurements, and will hopefully enable faster clinical decision making and reduce referrals to unnecessary secondary care, ultimately leading to an increase in overall efficiency and quality of diabetes diagnosis and treatment.
Footnotes
Declaration of conflicting interests
The author(s) declared no potential conflicts of interest with respect to the research, authorship, and/or publication of this article.
Funding
The author(s) received no financial support for the research, authorship, and/or publication of this article.
Ethical approval
This research was approved by the Seoul National University Bundang Hospital Institutional Review Board (IRB number X-2402-885-902).
Guarantor
KL.
Contributorship
JH Lee drafted the manuscript. S Jun conducted the experiment and acquisited data. JH Lee and K Lee analyzed data and interpreted the results. JH Lee, J Lee, SH Song and K Lee designed the study. JH Lee and K Lee revised and approved the final manuscript. All authors reviewed the manuscript and provided critical feedback.
Data availability statement
All data generated and analyzed during this study are included in this published article. Please contact the authors for data requests.