
Abstract
Background
Examining the distribution of biochemical and haematological tests in different age groups of rural population is necessary to ensure that health care facilities are equipped to address the prevalent health conditions and manage age-related illness effectively. Hence, this study is aimed at seeing the distributions of blood biochemical and haematological parameters in rural population.
Methods
This cross-sectional study investigated the distribution of 26 different haematological and biochemical parameters in longitudinal cohort study (Srinivaspura Aging, NeuoSenescence and COGnition - SANSCOG), from the villages of Srinivaspura, Kolar district, India. A total of 2592 participants (1240 males and 1352 females), aged ≥45 years who are cognitively healthy were included for the analysis. Mean, 2.5th, 5th, 25th, 50th, 75th, 95th and 97.5th percentiles were calculated for the entire sample. Additionally, median and percentiles were determined for both gender and age categories (45-54, 55-64, 65-74, and ≥75 years).
Results
We observed the distinct distributions of various haematological and biochemical parameters, with elevated levels of glycaemic, lipid, liver, and thyroid parameters.
Conclusion
Findings revealed the notable variations from the established reference ranges, indicating the potential undiagnosed cases and highlighting the gaps in health awareness and health seeking behaviour.
Introduction
Aging is an universal and inexorable phenomenon. It is associated with gradual decline in physiological functions leading to increased vulnerability to disease, debility, and death. 1 Several biological changes underlie the aging process, which are mostly attributed to increasing cellular and molecular damage 2 and can manifest as decline in organ health 3 and metabolic dysfunction. 4 As the proportion of older people is growing rapidly across the world, efforts to facilitate healthy aging have taken the limelight. Countries like India, with a rising number of elderly individuals, are particularly challenged 5 ; it is estimated that by 2050, India will have 319 million persons above the age of 60 years (19.1% of its total population). 6 It is well known that aging is the major risk factor for most diseases, especially non-communicable diseases (NCDs). 7 In this scenario, the best approach to reduce health care burden would be prevention or early diagnosis and prompt management of medical conditions in the older population.
Analyzing the blood samples is essential for assessing an individual’s health, whether for routine check-ups or community-wide screenings, or clinical diagnosis. Both biochemical and haematological investigations help measure the functional capacity of organ systems, and thereby identify an array of diseases. Additionally, these tests aid in evaluating disease progression, treatment effectiveness, and monitoring chronic health conditions. However, variations in individual’s structural and physiological make-up exists due to factors such as age, 8 gender, 9 ethnicity,10,11 geographical region,12,13 lifestyle and dietary habits 14 and other socio-cultural factors. 15 Understanding these variations is crucial for specific populations.
India’s vast diversity encompasses ethnic origins, cultures, geographies, societal and family structures, languages, literacy, customs, and so on. Hence, knowledge of distribution of biochemical and haematological parameters for unique population groups within India is important. Though rural Indians comprises two-thirds of the nation’s population, there is a major lack of comprehensive biochemical and haematological data from these individuals. Even within rural Indians, aging rural Indians are grossly underrepresented. Therefore, data on blood parameters is useful from the public health perspective to make prompt diagnosis and initiate appropriate management of a variety of diseases, improve health status and quality of life in this vulnerable population.
The scarcity of data on aging Indian stems from lack of large-scale, rural, community-based studies focusing on healthy aging Indians. In this setting, we are conducting a large, prospective aging cohort study in southern India, namely, Srinivaspura Aging, NeuoSenescence and COGnition (SANSCOG) study. The cohort recruits cognitively healthy individuals aged 45 years and above from the rural area of Srinivaspura, a taluk (sub-district) in Kolar district, Karnataka. These individuals undergo detailed multimodal assessments that include clinical, cognitive, biochemical, genetic and brain imaging, and are followed-up over a long duration (at least 10 years). 16 SANSCOG study participants, are rural dwellers in Srinivaspura for a few generations, primarily consists of low socioeconomic strata farmers, with low levels of formal education as well as limited access to modern technology and health care. This homogenous group offers insight into aging among rural Indians. This study setting along with the extensive blood investigations conducted as part of the study gave us the unique opportunity to derive the distributions of blood biochemical and haematological parameters, which is the aim of the current study.
Methods
Study design
This study used cross-sectional data from the baseline assessments of the SANSCOG cohort.
Study sample and setting
The study sample comprised of 2592 participants (1240 males and 1352 females), aged ≥45 years, from the villages of Srinivaspura. The data which was collected between April 2018 and August 2021 was included for the analysis.
Recruitment
The SANCOG cohort is recruited with an area sampling strategy utilizing the framework of the existing rural primary health care system in India. Primary Health Centres (PHCs) are the health facilities which form the first point of contact between the village community and the doctor. Each PHC caters to a population of roughly 30,000 individuals. Srinivaspura taluk has 13 PHCs, out of which SANSCOG study recruits from villages attached to 6 PHCs. We collaborate with public health officials and take the support of ASHA worker (Accredited Social Health Activists – female health workers in every village, recruited and trained by the government to serve as a bridge between the public health care system and the local community) in order to create awareness about our study and facilitate smooth recruitment.
Inclusion and exclusion criteria
Inclusion criteria for this study were apparently cognitively healthy individuals aged 45 years and above, who are residents of Srinivaspura and have completed their baseline assessments including blood biochemical investigations in SANSCOG cohort. Participants with known diagnosis of dementia, psychosis, bipolar disorder, substance dependence (except nicotine) and any severe medical illness or significant hearing or vision impairment likely to limit the study evaluation, self-reported cases of hypertension, diabetes, hyperlipidemia, thyroid diseases or any other chronic diseases were excluded as per the exclusion criteria of the parent study (SANSCOG).
Ethics and consent
SANSCOG study has obtained ethics clearance from the Institutional Ethics Committee (Institutional Review Board) of the Centre for Brain Research, Indian Institute of Science, Bangalore, India. Written, informed consent was obtained from all participants before recruitment.
Blood sample collection
Periodic village-wise blood collection camps were organized in the study site. Under overnight fasting condition, 15 mL of peripheral venous blood was drawn with a single prick from antecubital fossa by a trained phlebotomist using a vacutainer syringe (Dickinson, Franklin Lakes, New Jersey, USA). Blood was collected into five different vacutainers (Becton-Dickinson, Franklin Lakes, New Jersey, USA). Sodium fluoride/Na2 Ethylenediamine tetraacetic acid (EDTA) tube (2 mL) was used for blood glucose estimation. K2 EDTA tube (2 mL) was used for complete haemogram and glycosylated haemoglobin (HbA1c) analysis, whereas two 5 mL gel tubes were used for Biochemical analysis. K2E EDTA tube (4 mL) was used for DNA isolation (2 mL) and plasma separation (2 mL). Serum separation was done at the camp site by centrifugation of blood at 2000 r/min for 10 min. Serum and blood samples were then distributed to two groups: one for biochemical and haematological investigations and another for genetic analysis and bio bank storage. For Haemogram, HbA1c, blood grouping and peripheral smear, 1.5 mL of whole blood was used. Blood biochemical parameters were tested using 1 mL of serum and 10 μL of plasma. 2 mL for DNA isolation (genotyping for GWAS – Genome Wide Association Studies and WGS – Whole Genome Sequencing), 1.7 mL serum and 300 μL plasma was utilized for bio bank storage. Blood samples were transported to the laboratory within 2 hour in an appropriate container under controlled temperature. All investigations were performed in NABL-accredited (National Accreditation Board for Testing and Calibration Laboratories) laboratories following principles of Good Laboratory Practice.
Biochemical analysis and estimation methods
Fasting blood sugar (FBS) was measured by hexokinase method, HbA1c by high-performance liquid chromatography (HPLC) method, fasting insulin and C-peptide by chemiluminescence method. Total cholesterol, triglycerides and high-density lipoprotein (HDL) were measured enzymatically and low-density lipoprotein (LDL) by direct method. Chemiluminescence method was adopted for vitamin D, vitamin B12, folic acid and homocysteine (Hcy). High sensitivity CRP (HsCRP) was analyzed by turbidimetric immunoassay method. Kinetic alkaline picrate and enzymatic methods were used for creatinine, enzymatic urease method for urea. Thyroid function tests, such as Thyroxine (T4), Triiodothyronine (T3) and Thyroid-stimulating hormone (TSH) were analyzed by chemiluminescence method. The following methods were used for liver function tests: total bilirubin – Diazo and Azobilirubin/dyphillin method (Direct bilirubin), serum glutamic-oxaloacetic transaminase (SGOT), serum glutamic pyruvic transaminase (SGPT) and gamma-glutamyl transferase (GGT) estimation – enzymatic kinetic method, alkaline phosphate – kinetic and enzymatic multipoint rate method. The estimated Glomerular Filtration Rate (eGFR) was determined by creatinine clearance (CrCl) using Crockroft-Gault formula. The formula is as follows, CrCl (mL/min) = (140-age) x weight ÷ 72 × serum creatinine (mg/100 mL) (x 0.85 if female). 17
Equipment used
Roche/Hitachi cobas c 311 and Vitros 5.1 FS analysers were used for analysis of FBS, lipid profile, liver function tests, creatinine and urea. Cobas e 801 immunoassay analyser and Vitros ECI analysers were used for C peptide, fasting insulin, thyroid profile, vitamin B12, vitamin D, folic acid and homocysteine analysis. G8 HPLC analyzer (Tosoh Bioscience) was used for HbA1c analysis. All haematological investigations were carried out with Sysmex KX-21, automated haematology analyser.
Statistical methods
Blood biochemical and haematological parameters were evaluated for the entire set of study individuals. The respective values were also compared between genders (male vs female) for each age groups (45-54, 55-64, 65-74, 75 and above). Normality was checked for the continuous variables using Kolmogorov–Smirnov test with Lilliefors significance correction. Normally distributed variables within each of the groups were then checked for equality of variance. For equal variances between two groups, independent t test was used; and for unequal variances, Welch’s t-test was used. Mann–Whitney U test was used for non-normally distributed variables for two group comparisons. Bonferroni corrections were done to account for multiple comparisons. Statistical significance was checked at 5% level of significance. All analyses were performed using scipy package in Python version 3.7.3. 18
Results
Socio demographic characteristics of the study sample.
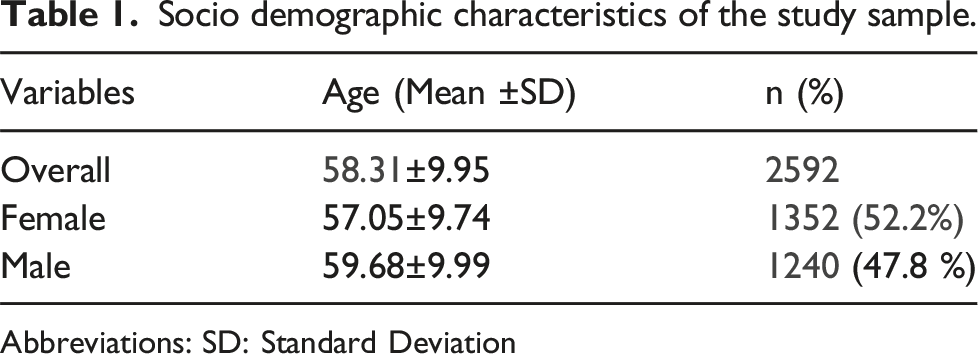
Abbreviations: SD: Standard Deviation
Haematological parameters
Distribution of (Mean and percentiles) haematological and biochemical parameters.
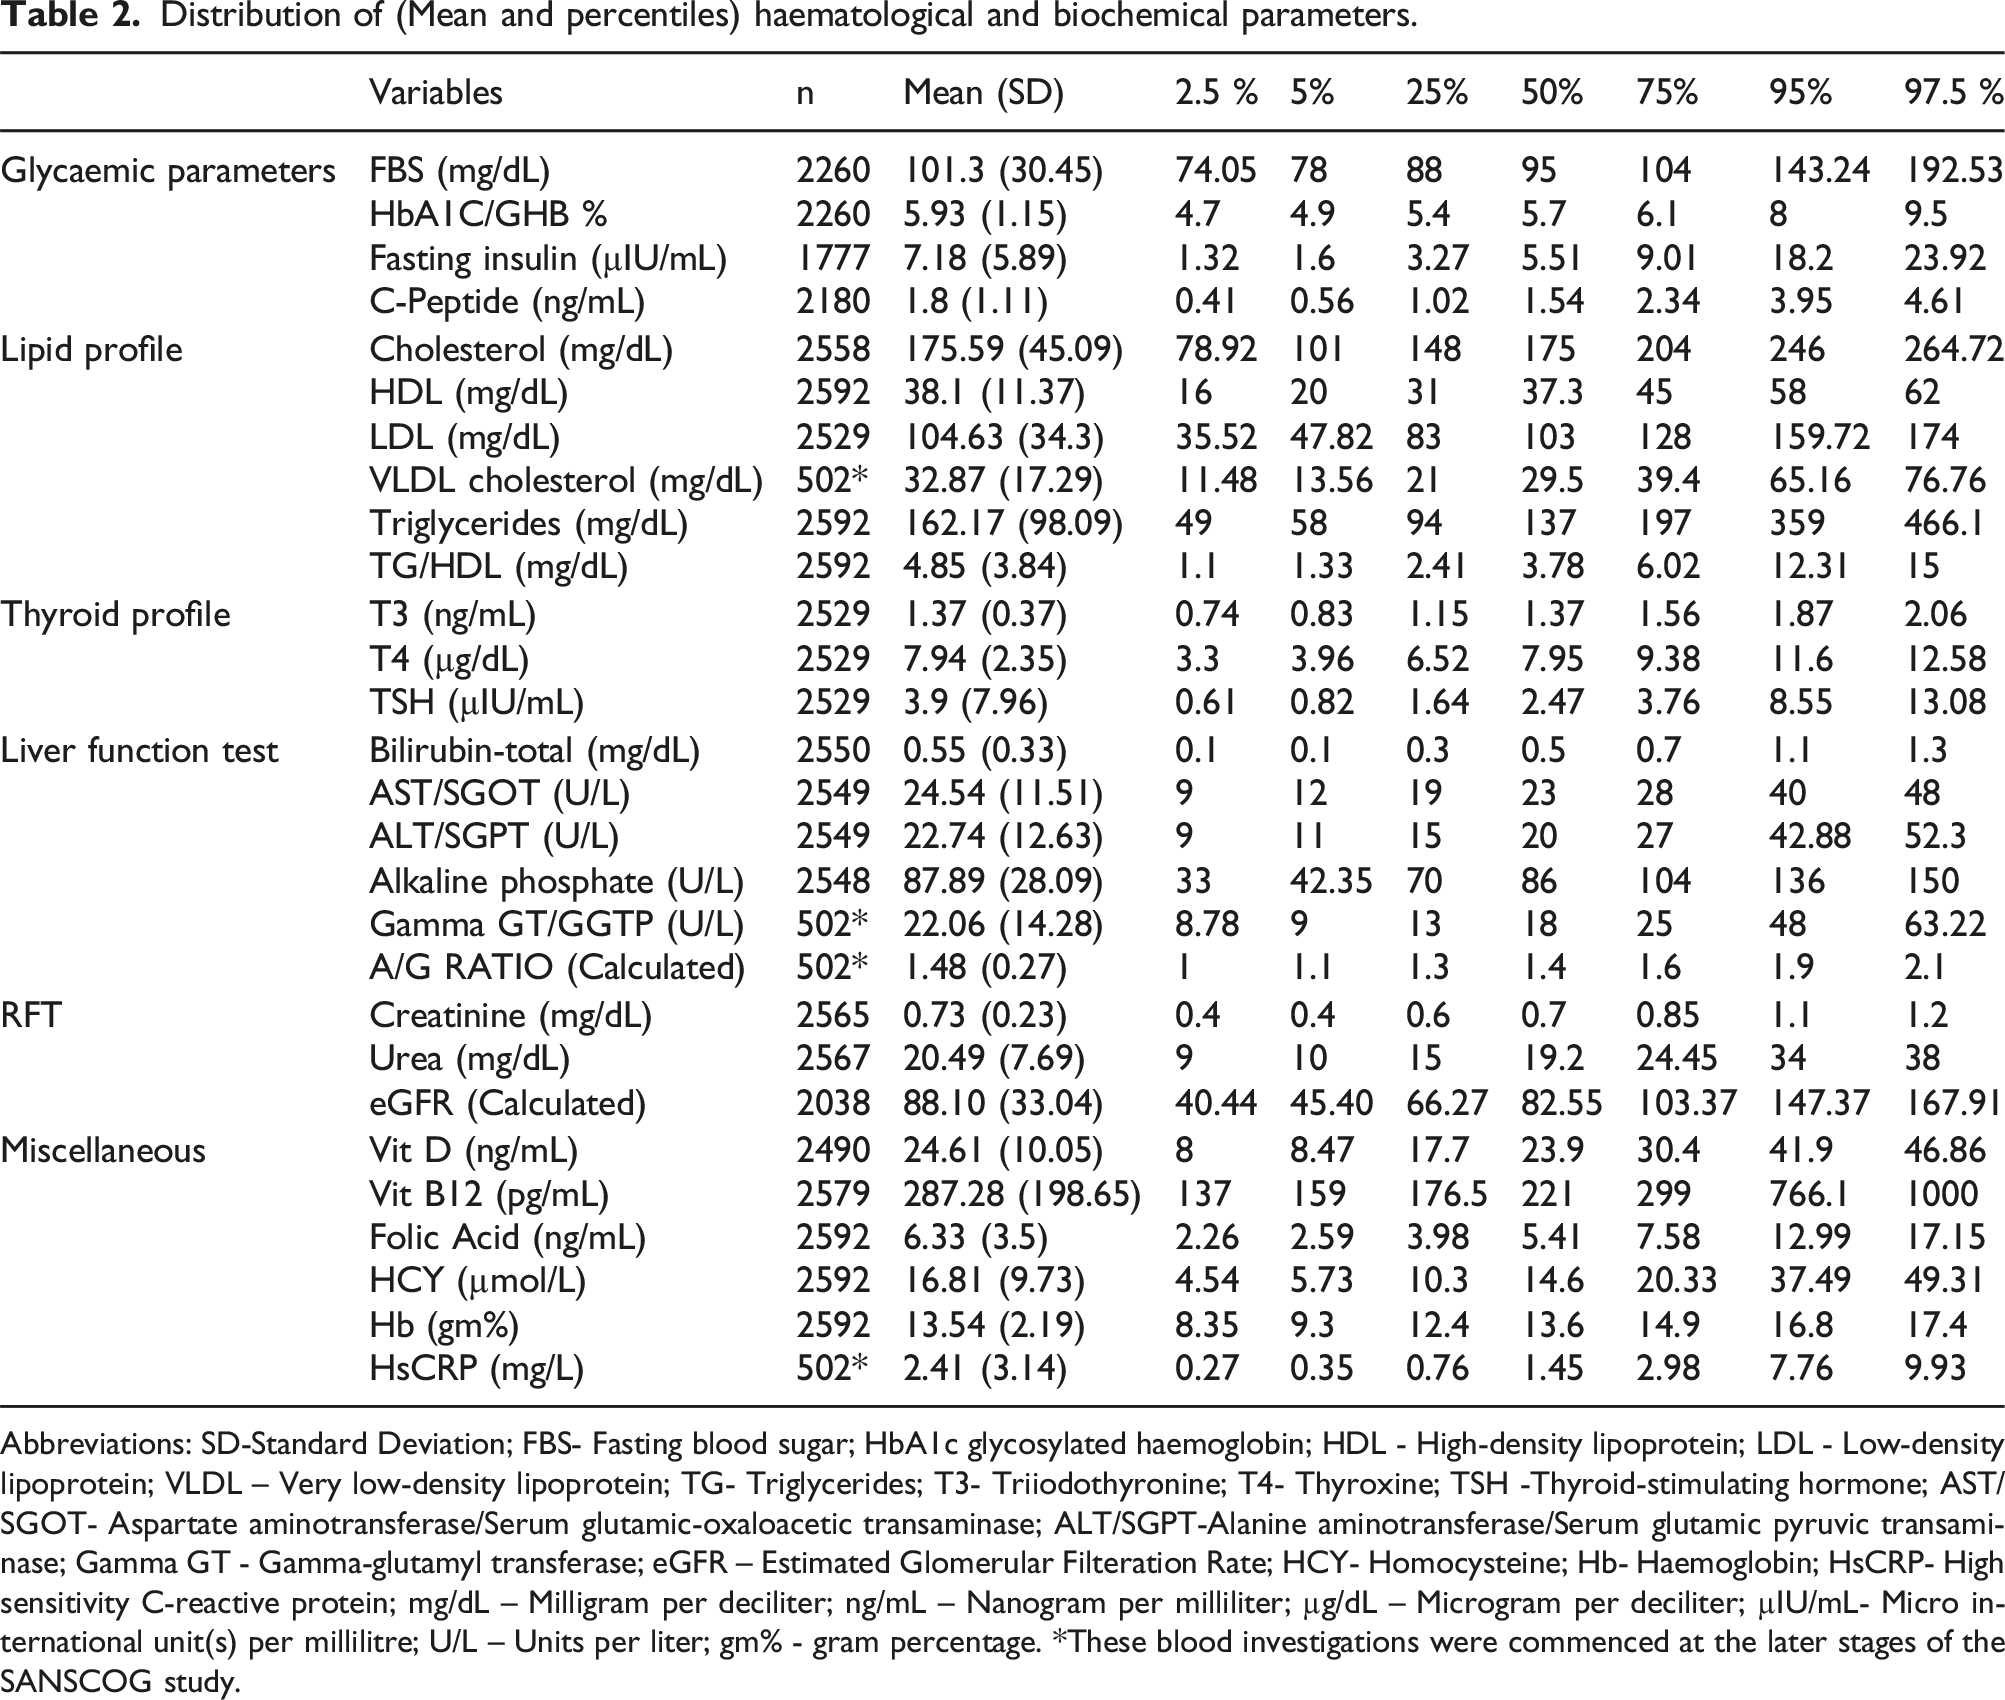
Abbreviations: SD-Standard Deviation; FBS- Fasting blood sugar; HbA1c glycosylated haemoglobin; HDL - High-density lipoprotein; LDL - Low-density lipoprotein; VLDL – Very low-density lipoprotein; TG- Triglycerides; T3- Triiodothyronine; T4- Thyroxine; TSH -Thyroid-stimulating hormone; AST/SGOT- Aspartate aminotransferase/Serum glutamic-oxaloacetic transaminase; ALT/SGPT-Alanine aminotransferase/Serum glutamic pyruvic transaminase; Gamma GT - Gamma-glutamyl transferase; eGFR – Estimated Glomerular Filteration Rate; HCY- Homocysteine; Hb- Haemoglobin; HsCRP- High sensitivity C-reactive protein; mg/dL – Milligram per deciliter; ng/mL – Nanogram per milliliter; µg/dL – Microgram per deciliter; µIU/mL- Micro international unit(s) per millilitre; U/L – Units per liter; gm% - gram percentage. *These blood investigations were commenced at the later stages of the SANSCOG study.
Glycaemic parameters
Supplemental table 1 shows the distribution of glycaemic parameters according to age and gender stratification. No significant gender difference were found in median fasting blood sugar, HbA1c, fasting insulin levels between the genders in both overall and age-wise comparison. There was no significant difference in the mean C-peptide levels between genders overall, males had higher levels in the age group of 45-54 years (P < 0.001). Further, we conducted analysis to determine the prevalence of undiagnosed diabetes within our cohort, following American diabetes Association (ADA) criteria, 19 which includes FBS ≥126 mg/dL or HbA1C ≥6.5%. Prevalence of diabetes with FBS ≥126 mg/dL is as follows: Across the entire sample it was 7%, with 5.5% in females, and 8.9% in males. When looking at the specific age categories, in 45–54 years of age group it was 5.3% in females and 8% in males; in 55–64 years age group, it was 6.4% in females and 10.5% in males; in 65–74 years of age group, it was 3.5% in females, and 7.5% in males; and for those ≥75 years of age, it was 10.7% in females and 11.4% in males. Similarly, prevalence of diabetes with HbA1C ≥6.5% is as follows: In the overall sample it was 13.9 %, with 12.2 % in females, and 15.9 % in males. When looking at the specific age categories in 45-54 years of age group it was 8.3% in females and 14% in males; in 55–64 years age group, it was 15.8% in females and 17.5% in males; in 65-74 years of age group, it was 16.4% in females, and 17.4% in males; and for those ≥75 years of age, it was 10.7% in females and 14.3% in males.
Lipid profile
Supplemental table 2 shows the distribution of Lipid profile according to age and gender stratification. Females exhibited the higher median total cholesterol levels than males in overall gender wise comparison (P < 0.001), as well as in the age group of 55–64 years (P < 0.001) and 65–74 years (P < 0.001). Females had significantly higher HDL levels than males in overall gender wise comparison (P < 0.001), also across all the age groups (P < 0.001). LDL levels were higher in females in overall (P < 0.001), again in the 55–64 years (P < 0.001) and 65–74 years (P < 0.001) of age group. VLDL levels did not differ significantly in both overall and age-wise comparison between the genders. Triglycerides levels were higher in males overall (P < 0.001) and in the age group of 45–54 years (P < 0.001). Males also showed a higher TG/HDL ratio in overall (P < 0.001), specifically in 45–54 years (P < 0.001) and 55–64 years (P < 0.001) of age group.
Thyroid function test
Supplemental table 3 shows the distribution of thyroid function tests according to age and gender stratification. The study found no significant gender based differences in mean T3, T4 and TSH levels overall. T3 levels did not differ significantly between male and female across the age groups. However, in the age group of 65–74 years, females showed the higher T4 levels compared to males (P < 0.001). Additionally, in the 45–54 and 55–64 years of age group females had higher median TSH levels than males (P < 0.001).
Liver function test
Supplemental table 4 shows the distribution of liver function tests according to age and gender stratification. Males had significantly higher levels of median total bilirubin, SGOT, SGPT and GGTP than females in overall sample. Males had higher level of bilirubin across all the age groups (P < 0.001). Higher level of SGOT was observed in 45–54 years (P < 0.001) and 65–74 years (P < 0.001) age groups. Males had higher SGPT levels than females in all the groups (P < 0.001) except for 75 and above. Alkaline phosphate levels were significantly higher in females than males (P < 0.001) in overall sample and in the age group of 65–74 years (P < 0.001). GGTP levels differed significantly only in the age group of 45–54 years (P < 0.001) and 55–64 years (P < 0.001), with higher levels in males than females. A/G ration did not differ significantly between the gender overall and also in age stratified analysis.
Renal function test
Supplemental table 5 shows the distribution of renal function tests according to age and gender stratification. Males showed a significantly higher levels of creatinine levels than females in over sample and also across all the age groups (P < 0.001). While, serum urea levels were higher in males in overall sample (P < 0.001), with no age-specific differences between the genders. There was no significant difference in eGFR between females and males, as gender was one of the component considered in computing the eGFR.
Miscellaneous
Supplemental table 6 shows the distribution of following parameters according to age and gender stratification. Higher vitamin D levels were observed in males than females in overall sample, as well as across all the age group (P < 0.001). No gender difference was found in vitamin B12 levels. Females had significantly higher folic acid levels than males overall, as well as in the age group of 45-54 years (P < 0.001) and 55-64 years (P < 0.001). Homocysteine levels were higher in males than females in overall gender wise comparison and also across the age groups (P < 0.001). Males had higher haemoglobin than females overall and in all the age groups. HsCRP showed no gender difference except in the age group of 65–74 years, where females had higher levels than males (P < 0.001).
Discussion
The present study was aimed at establishing the distribution of haematological and biochemical parameters in the longitudinal cohort study based in rural India.
Many studies have defined the reference ranges for biochemical parameters by incorporating the data from adulthood (>18 years) and in urban population. However, there is a significant gap in research dedicated to assess the distribution of haematological and biochemical parameters in individuals aged 45 years and above, categorised by decades. It is crucial to assess this distribution in rural Indian population due to the distinct lifestyle such as physical activity levels and dietary habits, environmental exposure, socioeconomic status and health care factors. This ensures that the health assessments are contextually relevant, leading to more accurate diagnosis and effective implementation of health care measures in rural settings.
Mean FBS level and distribution of FBS in our study was higher than the previously reported levels in Northeast Ethiopia population (n = 328, 18 to 57 years) 20 and much higher than that which is reported in the study conducted in Kerala (n = 420, 20 to 60 years) 21 . Similar findings were observed in both male and females. Reference intervals (RIs) for HbA1c were much higher in our cohort for overall sample, as well as for males and females compared to the previous study in Northeast Germany (20–79years). 22 Elevated levels of FBS, HbA1c along with increased fasting insulin and C-peptide 23 suggest the insulin resistance or impaired glucose metabolism. The prevalence of undiagnosed diabetes in our cohort exceeded that which is reported in the studies conducted in both Morocco (n = 4779, ≥18 years, with a mean age of 41.7 years) 24 and Bangladesh (n = 11,421, ≥18 years). 25
The findings indicated that the mean lipid values including total cholesterol and LDL, were similar to the results from study involving Korean population 26 (n = 1003, 65 to 74 years and n = 212, ≥75 years), mean HDL levels were lower and triglycerides were higher in comparison. We observed the elevated levels in all the lipid parameters when compared to the reference ranges by NCEP – ATP III guidelines. 27 We also observed that the females had higher levels compared to males. Elevated lipid levels in our cohort may be attributed to lack of awareness regarding the dietary habits leading to the consumption of diets that are rich in unhealthy fats, sugars and processed foods, while lacking in fruits, vegetables. Elevated lipid levels in females could be due to hormonal changes during menopause and in post-menopause period. 28
Creatinine levels for both males and females in our study aligned with those reported in the previous study (N = 10,665, 20-70 years) in India by Sairam et al. However, notable difference was observed in blood urea, 2.5th% was found to be lower, while 97.5th% was higher in our cohort for both the genders. 29 We found higher level of creatinine and urea in males compared to females, this could be due to higher muscle mass in males leading to increased production of creatinine and urea. Compared to the existing guideline for creatinine, 30 elevated levels were seen in the elderly age group (≥75 years). Mean eGFR in our study was higher in comparison with eGFR documented in Ravansar Non-communicable Disease Cohort Study (RaNCD) (n = 8927, 35 to 65 years), Iran, 31 but lower than the levels observed in cross-sectional survey (n = 20,930, ≥20 years) from china for both males and females. 32 According to the prevailing guideline for eGFR, our median values were lower across all the age groups. 33
In contrast to the earlier study conducted on elderly Chinese population 34 (n = 19,953, ≥65), we observed higher RIs for T3, T4 and TSH levels in both males and females, as well as in overall population. According to the cut-offs by Indian thyroid guidelines, 35 elevated levels of T4 and TSH were seen in our cohort, while T3 levels remained within the normal range. These findings may indicate the possibility of undiagnosed clinical hypothyroidism.
The total bilirubin, ALT, and GGT levels for both females and males in our cohort exceeded the RIs established for the population of Turkey 36 and China. 37 Additionally, 2.5% was lower and 97.5% exhibited the higher levels of AST and ALP in both the genders compared to the RIs of Turkey and China. Liver parameters tend to increase with the age. The observed elevation in the liver parameters could be attributed to the age, as previous studies have focused on the age group of 20–49 years, whereas our study included the individuals aged 45 years and above, other factors contributing to this could include to environmental factors like contaminated water sources, and alcohol consumption. Elevated levels of liver parameters along with increased lipid parameters strongly point to the influence of dietary habits.
In our cohort both males and females showed insufficient median vitamin D levels, falling below the guidelines set by the US Endocrine society. 38 The levels of vitamin B12 and folic acid were higher compared to the study by Tanyalcin T et al,. (N = 279, 18-40 years). 39 The reported prevalence of deficiency of vitamin D, vitamin B12 and folic acid are 39.1%, 42.3% and 11.1%, respectively, as per the previous study within our cohort, 40 details of which are given elsewhere. Hcy levels were higher in our cohort compared to the study from West Bengal (N = 1288, 20 to 81 years). 41 Possible reasons for higher Hcy levels in male include gender-specific variations in Hcy metabolism and lifestyle practices like smoking and alcohol consumption. The 2.5% and 97.5% of haemoglobin for both males and females in our cohort align with the findings of previously reported study in the age group of >40 years (N = 10,665, 20-70 years). 29 Higher levels of haemoglobin in male compared to female could be due to stimulation of erythropoiesis by androgens in males and its inhibition by oestrogens in females. 42 The 97.5th % of HsCRP was higher than 10 mg/L in females, especially in the age group of 45-54 and 55-64 years. As per the meta-analysis, an elevated hsCRP greater than 3 mg/L showed an independent association with a 60% higher risk of incident Coronary Heart Disease (CHD) compared to levels <1 mg/L. 43
Elevated levels of glycaemic, lipid and liver parameters, T4, and TSH, indicate the potential undiagnosed and untreated cases within our cohort. This could be associated with factors such as limited education and awareness about the health conditions, cultural beliefs and social norms which influences the health seeking behaviour and also relying on homemade remedies, delaying the professional medical intervention. These variations in haematological and biochemical parameters can collectively contribute to cognitive decline. The metabolic risks associated with these imbalances further exacerbate the situation.
Following up with the participants in our cohort is crucial for ongoing monitoring, enabling early detection of any worsening metabolic conditions and cognitive shifts. Implementing the comprehensive public health strategies, which involve awareness campaigns highlighting the importance of healthy eating habits, consistent physical activity and significance of routine medical check-ups is essential. Accessible health care services further facilitates the early detection of health conditions, enabling the timely intervention and contributing to a reduction in diseases prevalence, especially in rural areas.
Conclusion
Our study has revealed the distinct distributions of haematological and biochemical parameters, emphasizing the need for age and region specific reference ranges. Elevated levels of glycaemic, lipid, liver and thyroid parameters indicate the potential undiagnosed cases, highlighting the gaps in health awareness and health seeking behaviour. These variations pose metabolic risks and may contribute to cognitive decline. Public health strategies promoting healthy lifestyle and accessible health care services are important for reducing the disease burden in rural areas.
Supplemental Material
Supplemental Material - Distribution of biochemical and haematological parameters in an aging population from southern India – A cross sectional analysis
Supplemental Material for Distribution of biochemical and haematological parameters in an aging population from southern India – A cross sectional analysis by Divya N Mallikarjun, Shubham Jain, Palash Kumar Malo, Bratati Kahali, Jonas S. Sundarakumar, Latha Diwakar, Vijayalakshmi Ravindranath1 and SANSCOG study team in Annals of Clinical Biochemistry
Footnotes
Acknowledgements
We express our gratitude to the entire SANSCOG study team for their effort in conducting the assessments. Our sincere thanks to all our study subjects for their participation and kind co-operation.
Declaration of conflicting interests
The author(s) declared no potential conflicts of interest with respect to the research, authorship, and/or publication of this article.
Funding
The author(s) disclosed receipt of the following financial support for the research, authorship, and/or publication of this article: SANSCOG study is funded through the Centre for Brain Research, Indian Institute of Science by Pratiksha trust.
Ethical approval
SANSCOG study has obtained ethics clearance (Ref:CBR/42/IEC/2022-23) from the Institutional Ethics Committee of the Centre for Brain Research, Indian Institute of Science, Bangalore, India.
Guarantor
LD.
Contributorship
Divya N Mallikarjun- conceptualization, writing – original draft, interpretation of findings, manuscript editing; Shubham Jain - statistical analysis, manuscript review and revision; Palash Kumar Malo –Statistical analysis, interpretation of findings, manuscript review and revision; Bratati Kahali - conceptualization, interpretation of findings, critical review and revision of manuscript; Jonas S. Sundarakumar - conceptualization, interpretation of findings, critical review and revision of manuscript; Latha Diwakar - conceptualization, supervision, critical review and revision of manuscript. Vijayalakshmi Ravindranath - conceptualization, interpretation of findings, critical review and revision of manuscript. All authors have approved the final version of the manuscript for publication.
Data availability statement
Data extracted from this study can be obtained from the corresponding author, LD, upon reasonable request.
Supplemental material
Supplemental material for this article is available online.
References
Supplementary Material
Please find the following supplemental material available below.
For Open Access articles published under a Creative Commons License, all supplemental material carries the same license as the article it is associated with.
For non-Open Access articles published, all supplemental material carries a non-exclusive license, and permission requests for re-use of supplemental material or any part of supplemental material shall be sent directly to the copyright owner as specified in the copyright notice associated with the article.