
Abstract
Background
Mainstream haematology analysers (HAs) are reported to have low detection sensitivity for platelet clumps. In this study, a deep learning (DL) algorithm, convolutional neural network (CNN), was implemented to detect platelet clumps.
Methods
Adenosine diphosphate (ADP) was used to induce platelet aggregation to mimic platelet clumps detected (PCD) samples. Six types of leukocyte scattergrams were collected from the Sysmex XN-10. Then, multiple CNNs were trained and validated by scattergrams in a fivefold cross-validation (CV) method. Finally, the CNN model with the best CV accuracy was tested with practical routine work samples.
Results
A total of 386 samples (190 PCD and 196 negative samples) and 4253 samples (150 PCD and 4103 negative samples) were eligible for CNN training and practical test, respectively. The CNN with the highest CV accuracy was trained by using scattergrams of side scatter (SSC) vs. forward scatter (FSC) from the white count and nucleated red blood cells (WNR) channel, whose mean area under the curve (AUC), accuracy, specificity and sensitivity were 0.968, 0.940, 0.937 and 0.942, respectively, in the CV. In the practical test, the AUC, accuracy, specificity and sensitivity of the CNN were 0.916, 0.961, 0.860 and 0.965, respectively. The dispersed spots presenting around the leucocytes in the WNR channel may be a sign of platelet clumping.
Conclusions
This study demonstrates that the CNN algorithms can identify platelet clumps based on optical information from dedicated leukocyte channels and has a higher ability to detect platelet clumps than the XN-10 device’s internal algorithm under practical circumstances.
Introduction
The presence of platelet clumps in anticoagulated whole blood samples, which may cause falsely decreased platelet counts in a complete blood count (CBC), is one of the most frequent sample quality problems. Many of the mainstream haematology analysers (HAs), including those manufactured by Sysmex, Abbott, Mindray, Beckman and Siemens, have been reported to have poor sensitivity when detecting platelet clumps (with detection rates of approximately 60%), which requires laboratory staff to consume much time conducting microscopy to avoid reporting falsely decreased platelet counts.1–4 Such challenges seriously impede the progress of clinical laboratory automation. Therefore, it is worth the effort to develop detection algorithms that can improve sensitivity.
Our previous study demonstrated that a fully connected artificial neural network (FCN) can identify clotted samples by using five parameters from the coagulation test. 5 However, processing image data may require an FCN with a vast number of nodes and weights, which would be untrainable. Deep learning (DL) is a form of artificial intelligence in which computers imitate the working mechanism of the human brain to solve problems. It has shown tremendous promise in automatic speech recognition, text recognition and image classification. 6 Of the various DL algorithms, the convolutional neural network (CNN) is the type that is typically applied for image classification due to its advantages in automatic feature recognition and data downsampling. Several studies have shown that CNNs work well with the optical information from flow cytometry in cell population segmentation and identification.7–9 Such applications made us wonder if CNNs could identify platelet clumps directly by using the optical information from HA leukocyte differential channels, such as the white blood cell differential (WDF) and white count and nucleated red blood cells (WNR) channels because platelet clumps are resistant to Sysmex lysis reagents and will, therefore, be detected by those channels. 10
The aim of this study is to develop and validate a CNN model for identifying platelet clumps using scattergrams generated by the WDF and WNR channels of a Sysmex HA and attempt to visualize the evidential regions of platelet clumping on WNR scattergrams using the CNN model. Our study may, to some extent, facilitate the research progress of applying DL in sample quality control.
Materials and methods
Data preparation
The datasets used for training were the leucocyte scattergrams plotted by using two of three optical signals, namely, side scatter (SSC), side fluorescent light (SFL) and forward scatter (FSC), from the WDF and WNR channels of a Sysmex XN-10 (Sysmex Corp., Kobe, Japan) with information processing unit (IPU) version 22.11 (some scattergram types need to be set to the visible state in the research interface). Thus, six types of scattergrams were investigated in this study: SSC-SFL (WDF), SFL-FSC (WDF), SSC-FSC (WDF), SSC-SFL (WNR), SFL-FSC (WNR) and SSC-FSC (WNR). Platelet clumps detected (PCD) samples were imitated in our previous study. Briefly, platelet-rich plasma (PRP) was isolated from 190 citrated specimens and mixed with ADP at 37°C for 10 min. Then the PRP was gently transferred back into the sample tube and mixed with the blood cells to mimic a pseudothrombocytopenia. The platelet aggregation rate (PAR) of each imitated PCD sample was calculated using the formula PAR = (Pb – Pa)/Pb, in which Pb represents the platelet count before ADP induction and Pa represents the platelet count after ADP induction. 11 The criteria for a PCD sample to be used for training were as follows: (a) The PAR was higher than 10%. (b) At least 1 platelet clump (containing a minimum of 3 platelets) was observed in the blood smear within 50 high magnification fields. Samples with haemolysis, icterus, visible clot and lipaemia were excluded from this study. The Q-value threshold of the XN-10 for the platelet clumps flagging was 100. Finally, each of the scattergrams was exported from the IPU with CSV format files of the testing results. The scattergrams were then transformed from a three-channels image to a grey-scale image using the OpenCV module and were marked by a target value, where 0 and 1 represented the negative and the PCD samples, respectively.
CNN architecture
A CNN with three convolutional layers, three max-pooling layers, one flatten layer and two fully connected layers was modelled using the TensorFlow-GPU 2.9.1 module in the Python 3.9 environment. Each convolutional layer, which had 16 convolution kernels (3 × 3 pixels), was followed by a max-pooling layer with a 2 × 2 pooling window. Between the convolution module and fully connected layers, a flatten layer was employed to transform the 2-dimensional array into a 1-dimensional array to make the data stream accessible to the fully connected layers (Figure 1). The activation functions of the convolutional and fully connected layers were ‘ReLU’ and ‘sigmoid’, respectively. The Adam algorithm, which guides the neural network model on how to ‘learn’, was implemented for the optimizer with a learning rate of 1.5 × 10⁻⁴ and a batch size of 10. CNN architecture and the workflow. The scattergram is first input into the convolutional layer to extract features by using 16 randomly initialized filters (generating 16 feature maps). Then, the feature maps are downsampled by the max-pooling layer. After three convolution and pooling operations, the size of the input data is reduced from 281 × 281 (78,961 pixels) to 17 × 17 × 16 (4,624 pixels). The feature maps are subsequently flattened to a one-dimensional array by the flatten layer. Finally, two fully connected layers map the 4,624 pixel values to one output value ranging from 0 to 1.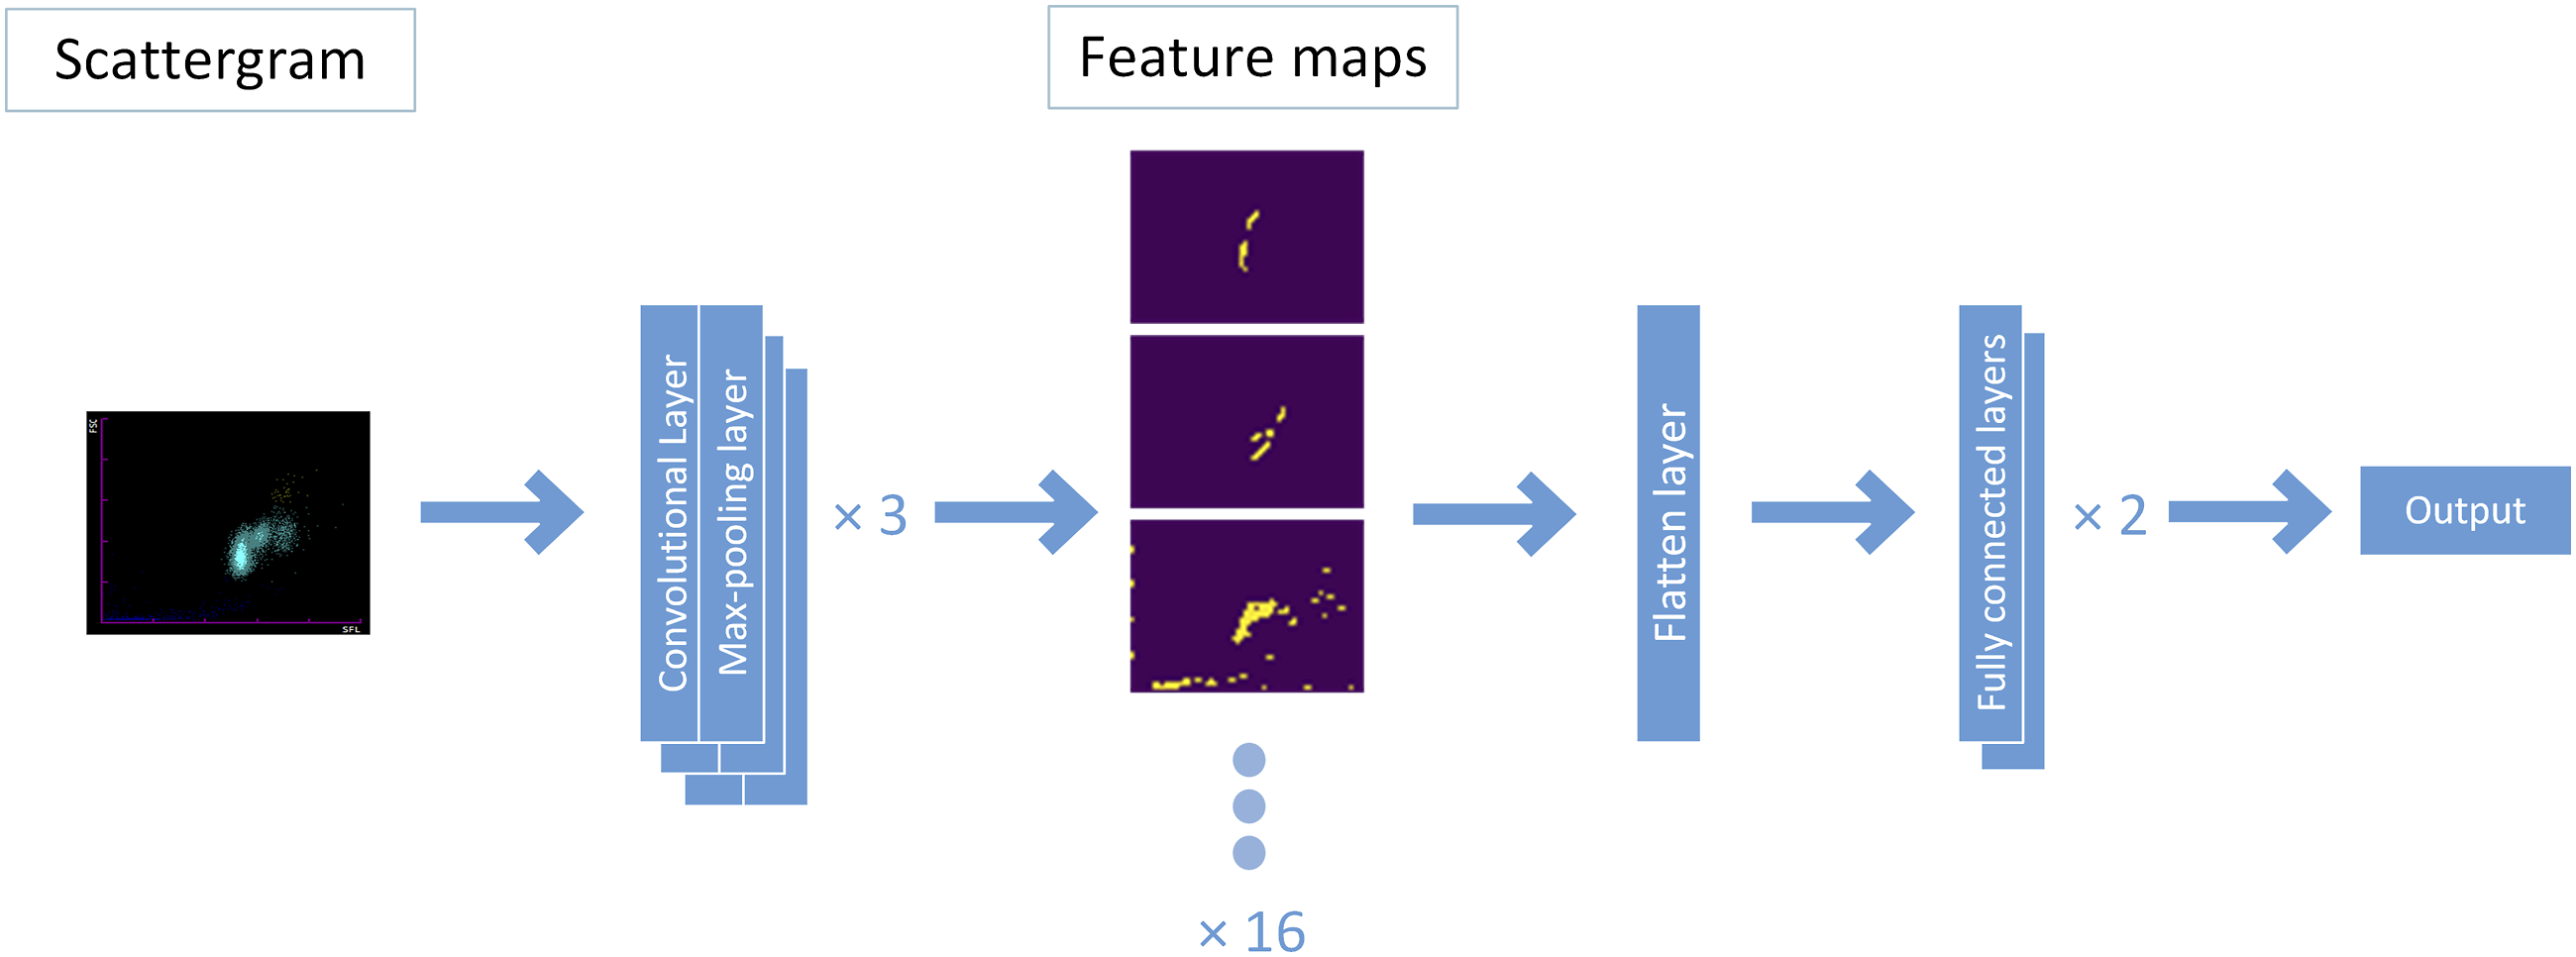
CNN training and cross-validation
Six training groups were established based on the six types of scattergrams. Each group was trained in a fivefold cross-validation (CV) manner, as described in our previous study. 5 Briefly, the scattergrams were randomly split into five subgroups, and each subgroup served as a validation dataset for assessing the predictive ability of the model, which was trained by using the rest of the subgroups (i.e. in each CV loop, five CNN models were achieved, and all the samples were validated once). With each fold, the validation was performed after every epoch (all the training data were ‘learned’ once by the CNN), and the training process would stop if the validation accuracy was not improved within 15 epochs. Then, the CNN model with the highest CV accuracy was retained as the final model. The fivefold CV was repeated five times for each group.
CNN assessments under practical circumstances
The predictions of each fold during CV were used to calculate the area under the curve (AUC) and the best threshold. The average receiver operating characteristic (ROC) curve was plotted based on the total predictions of each group. The continuous predictions of each fold were binarized as 0 or 1 based on the best threshold to obtain the confusion matrix, accuracy, sensitivity and specificity (binarization was also implemented on the outcomes of the CNN in the practical test when calculating the confusion matrixes). The definitions of accuracy, sensitivity and specificity are (TP + TN)/(TP + TN + FP + FN), TP/(FN + TP) and TN/(FP + TN), respectively, where TP represents true positive, TN represents true negative, FP represents false positive and FN represents false negative. The CNN with the highest CV accuracy was selected from all the retained CNNs to detect platelet clumps in routine work. CBC samples from The Third Affiliated Hospital of Zhejiang Chinese Medical University that were collected between January and August 2022 were randomly selected for the practical test. Each selected sample underwent CBC, automatic blood smearing using a Sysmex SP-10 (Sysmex Corp., Kobe, Japan), and CNN analysis. Internal quality control (IQC) was performed daily to guarantee the precision and stability of the XN-10. The blood slides were reviewed by two experienced technicians to detect platelet clumps. The criteria for PCD samples in this portion were the same as in the criteria for the training stage except for the requirement of the PAR value. Q-values of the platelet-clumps flag generated by the XN-10 and the predictions of the CNN were used to plot the ROC curve and calculate the AUC. Then, the Q-values were normalized to 1 to test the significance between the AUCs of the CNN and the XN. If the Q-value of a sample was ‘DISCRETE’, this sample was excluded from the practical test.
CNN visual explanations
The gradient-weighted class activation mapping (Grad-CAM) algorithm was implemented to explain the CNN model with the highest CV accuracy, which helped to highlight the class-discriminative regions in the scattergram involved in CNN prediction. All the contributing features of the PCD cases that were successfully predicted by the CNN were overlaid together to yield the general contributing features.
Statistical method
A permutation t-test was used to test the significance of accuracies, specificities and sensitivities. DeLong’s method was applied to test the significance between the average AUCs. p values < .05 were considered statistically significant in this study. Levene’s test was used for the homogeneity of variance between the age in the CV and the practical test. independent-samples t-test and chi-square test were used to test the significance of the age and the sex, respectively.
Results
Training and cross-validation of the CNNs
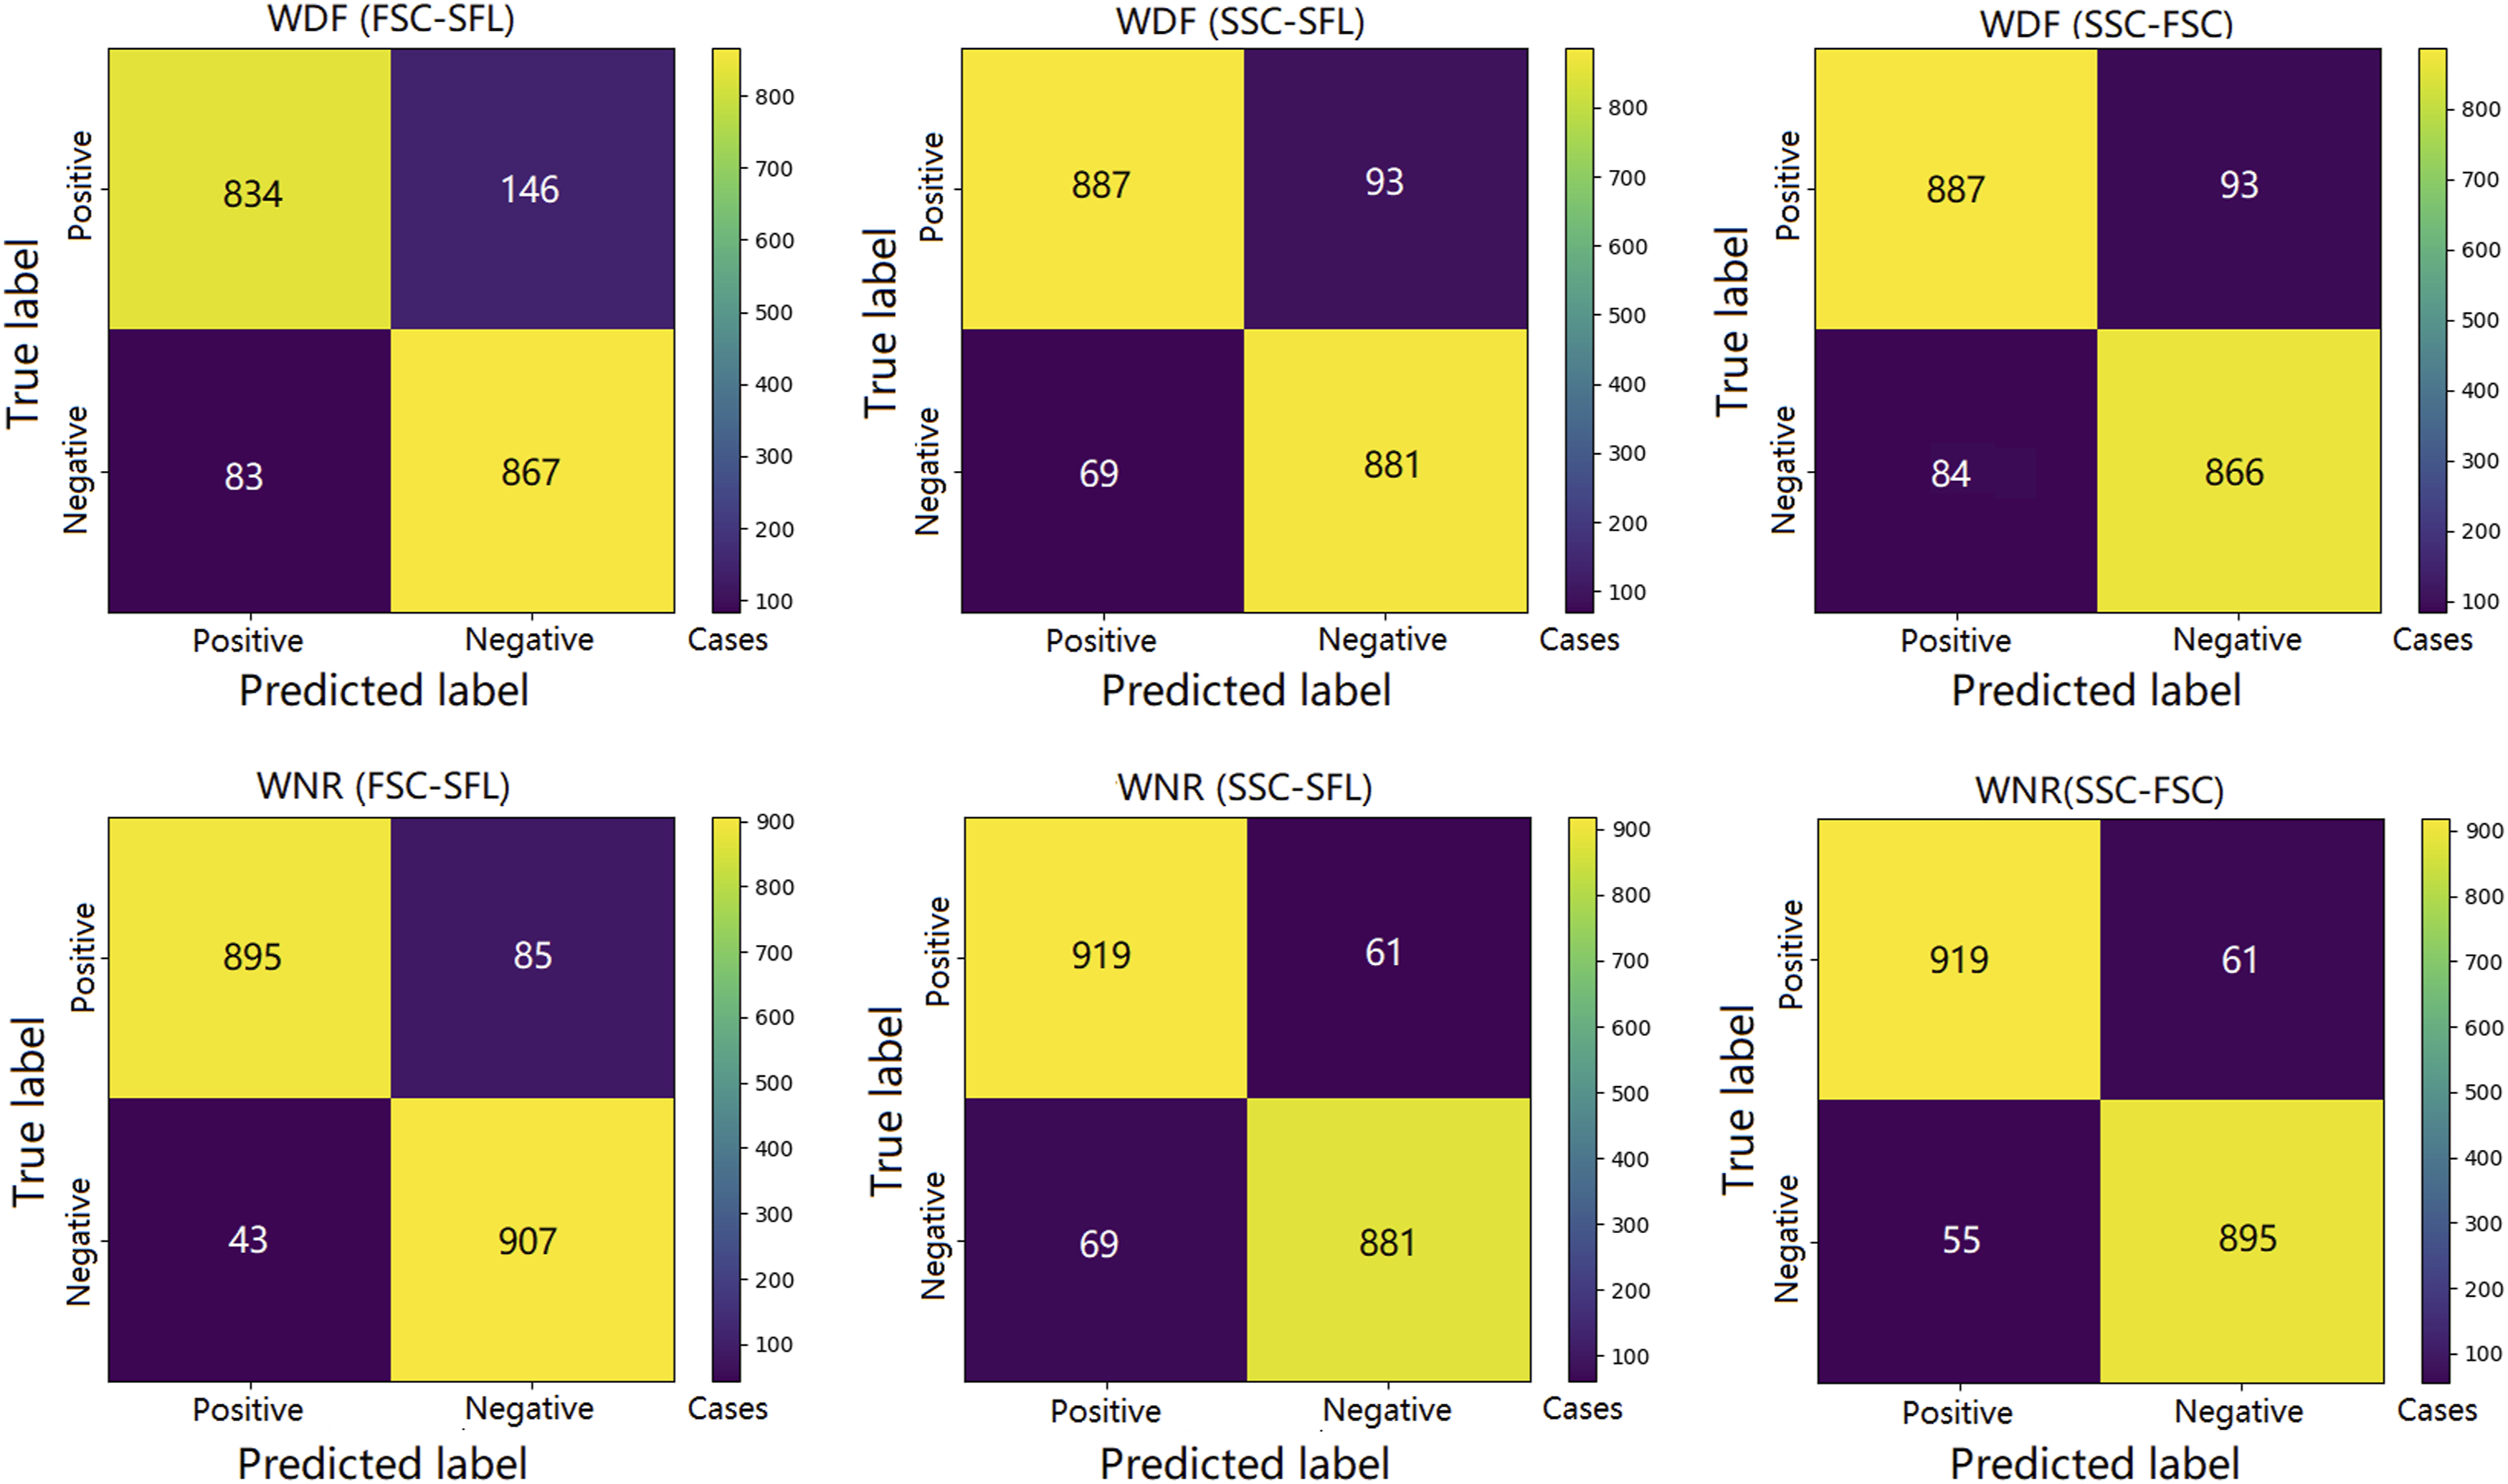
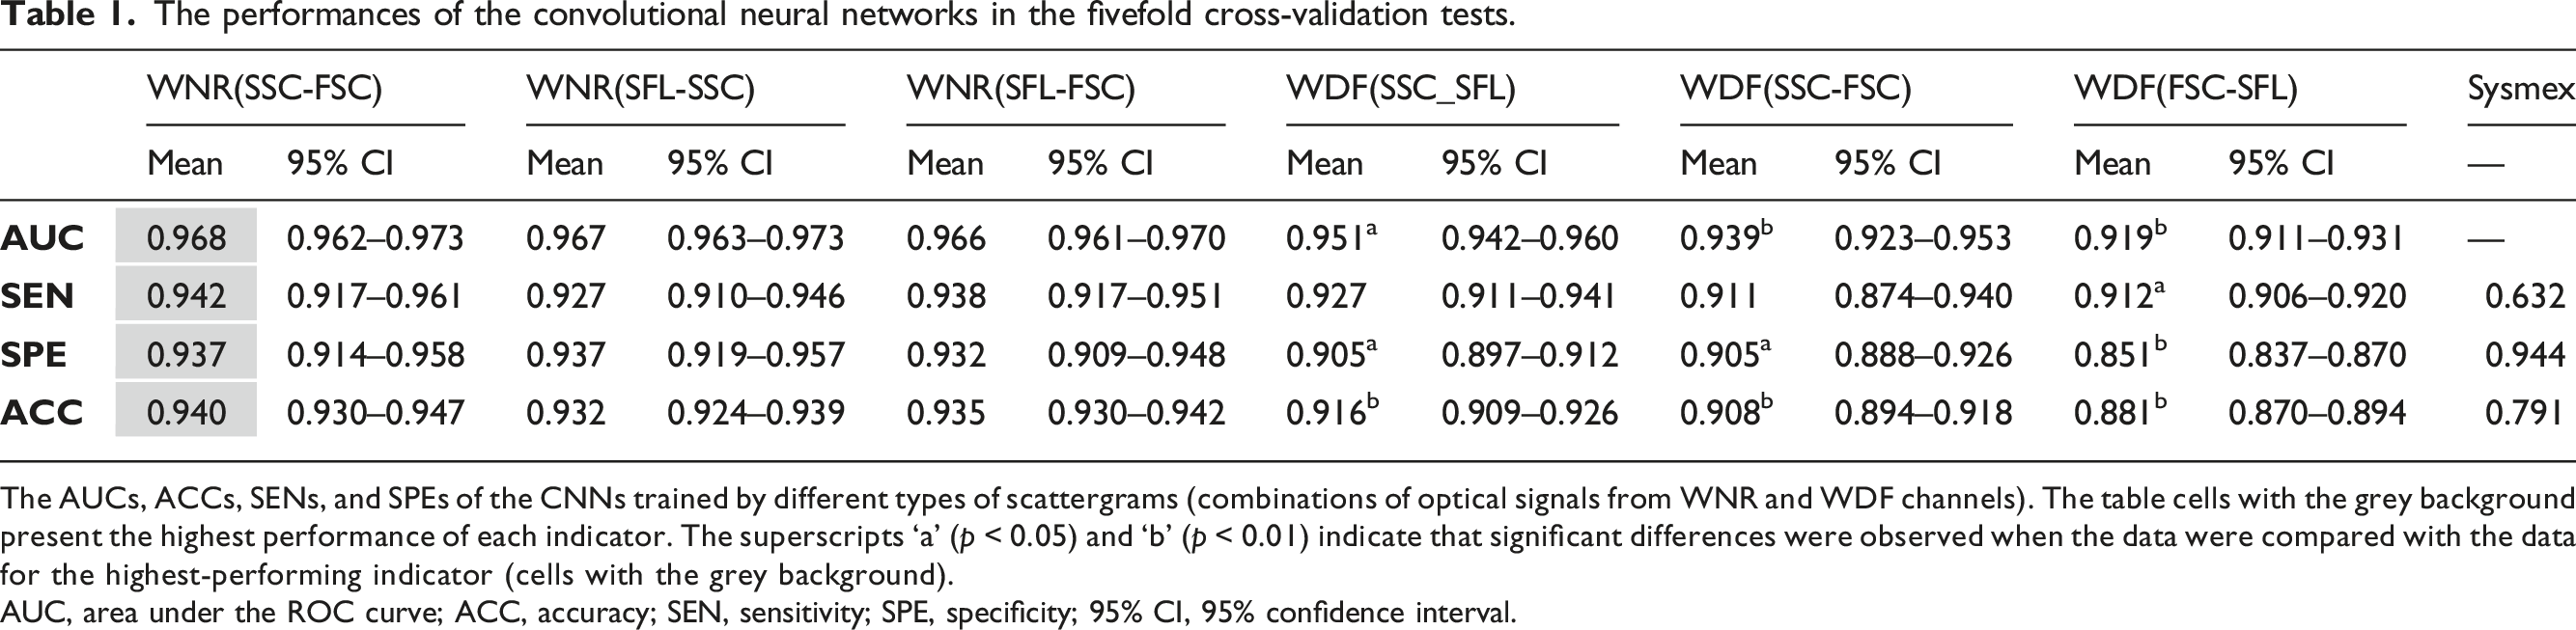
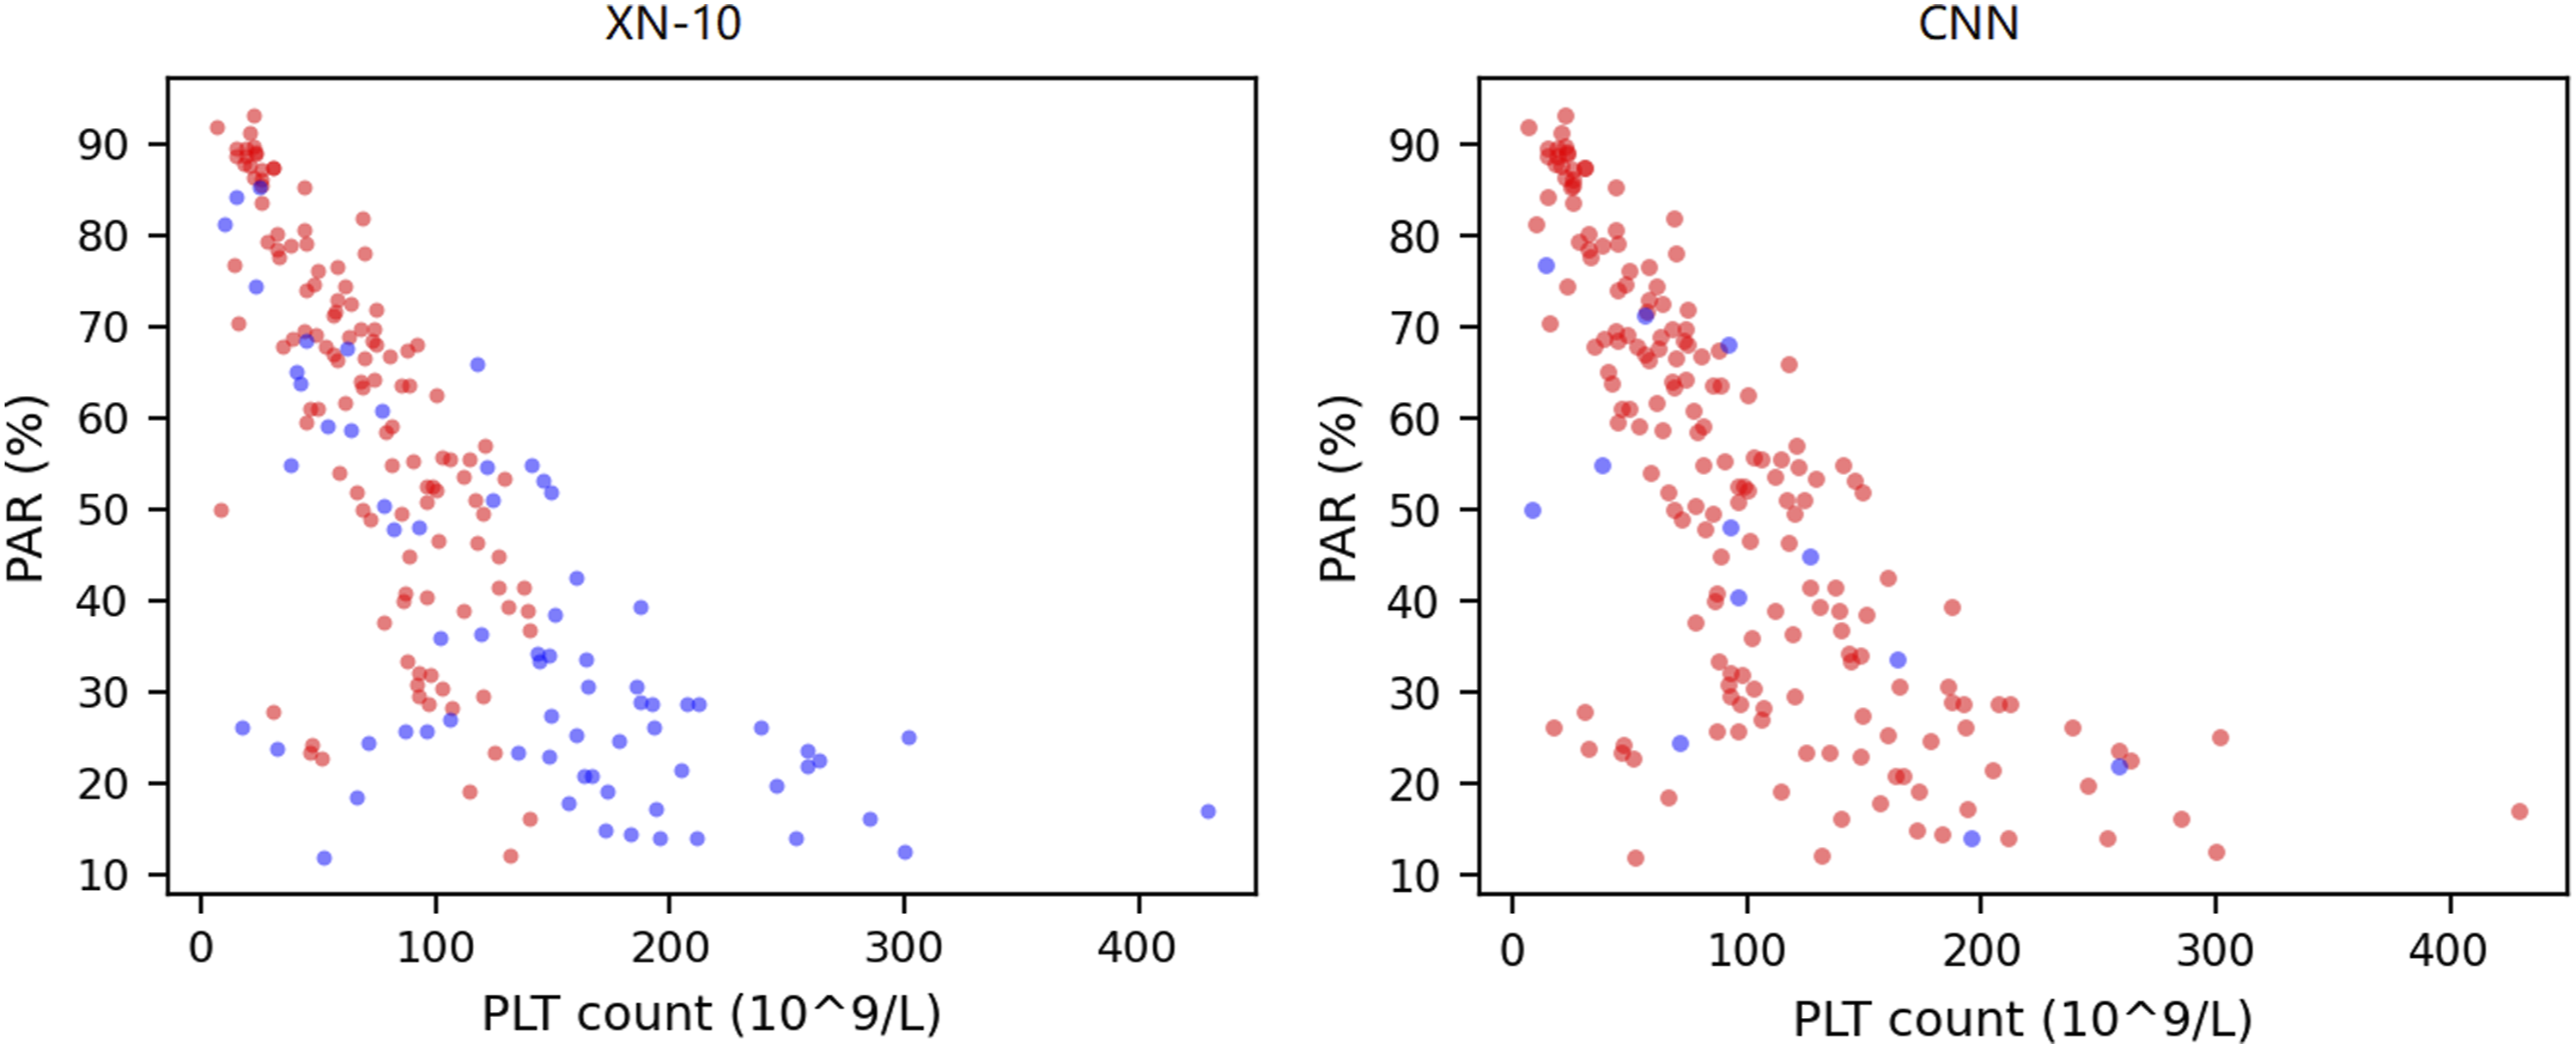
A total of 386 samples (190 PCD and 196 negative samples) were eligible for CNN training. After training and CV, 1930 predictions (five CVs) were generated for each training group. The average ROC curves and confusion matrixes of each group are shown in Figures 2 and 3, respectively. The AUCs, accuracies, specificities and sensitivities of the CV are summarized in Table 1. It was revealed that the optical information of the WNR channel was generally superior to that of the WDF channel for the purpose of training. The training groups with the highest and lowest mean AUCs were the SSC versus FSC of the WNR channel (mean = 0.968, 95% CI = 0.962–0.973) and the FSC versus SFL of the WDF channel (mean = 0.919, 95% CI = 0.911–0.931), respectively. The CNNs trained by the SSC and FSC of the WNR channel also had the best performance in terms of accuracy (mean = 0.940, 95% CI = 0.930–0.947), sensitivity (mean = 0.942, 95% CI = 0.917–0.961) and specificity (mean = 0.937, 95% CI = 0.914–0.958). The accuracy, sensitivity and specificity of the XN-10 were 0.791, 0.632 and 0.944, respectively. Figure 4 shows that the CNN algorithm has no positive threshold determined by the platelet count, which is an algorithmic limitation of the XN-10 that was discussed in our previous study.
11
The above results indicate that the CNN can accurately detect platelet clumps using the optical information from the dedicated leukocyte channels and that the SSC and FSC of the WNR channel are the most suitable data for CNN training. The average ROC curves of the training groups. The average ROC curves of the CNNs trained by scattergrams from the WNR and WDF channels are plotted as solid and dashed lines, respectively. The AUCs of the CNNs trained with the WNR channel scattergrams were all greater than those of the CNNs trained with the scattergrams of the WDF channel. The total confusion matrix for each training group. The predictions of each fold are binarized into 0 and 1 by the best threshold, and then the binarized values of each group are summarized to calculate the total confusion matrix based on the target values. The performances of the convolutional neural networks in the fivefold cross-validation tests. The AUCs, ACCs, SENs, and SPEs of the CNNs trained by different types of scattergrams (combinations of optical signals from WNR and WDF channels). The table cells with the grey background present the highest performance of each indicator. The superscripts ‘a’ (p < 0.05) and ‘b’ (p < 0.01) indicate that significant differences were observed when the data were compared with the data for the highest-performing indicator (cells with the grey background). AUC, area under the ROC curve; ACC, accuracy; SEN, sensitivity; SPE, specificity; 95% CI, 95% confidence interval. The XN-10 and the CNN algorithmic characteristics. Each dot represents a PCD sample after ADP stimulation. Blue and red dots are the false-negative and truepositive samples, respectively. The x-axis is the platelet count after ADP stimulation. The detection ability of the XN-10 algorithm is positively correlated to PAR and is restricted by platelet count. PAR, platelet aggregation rate; PLT, platelet; ADP, adenosine diphosphate; PCD: platelet clumps detected.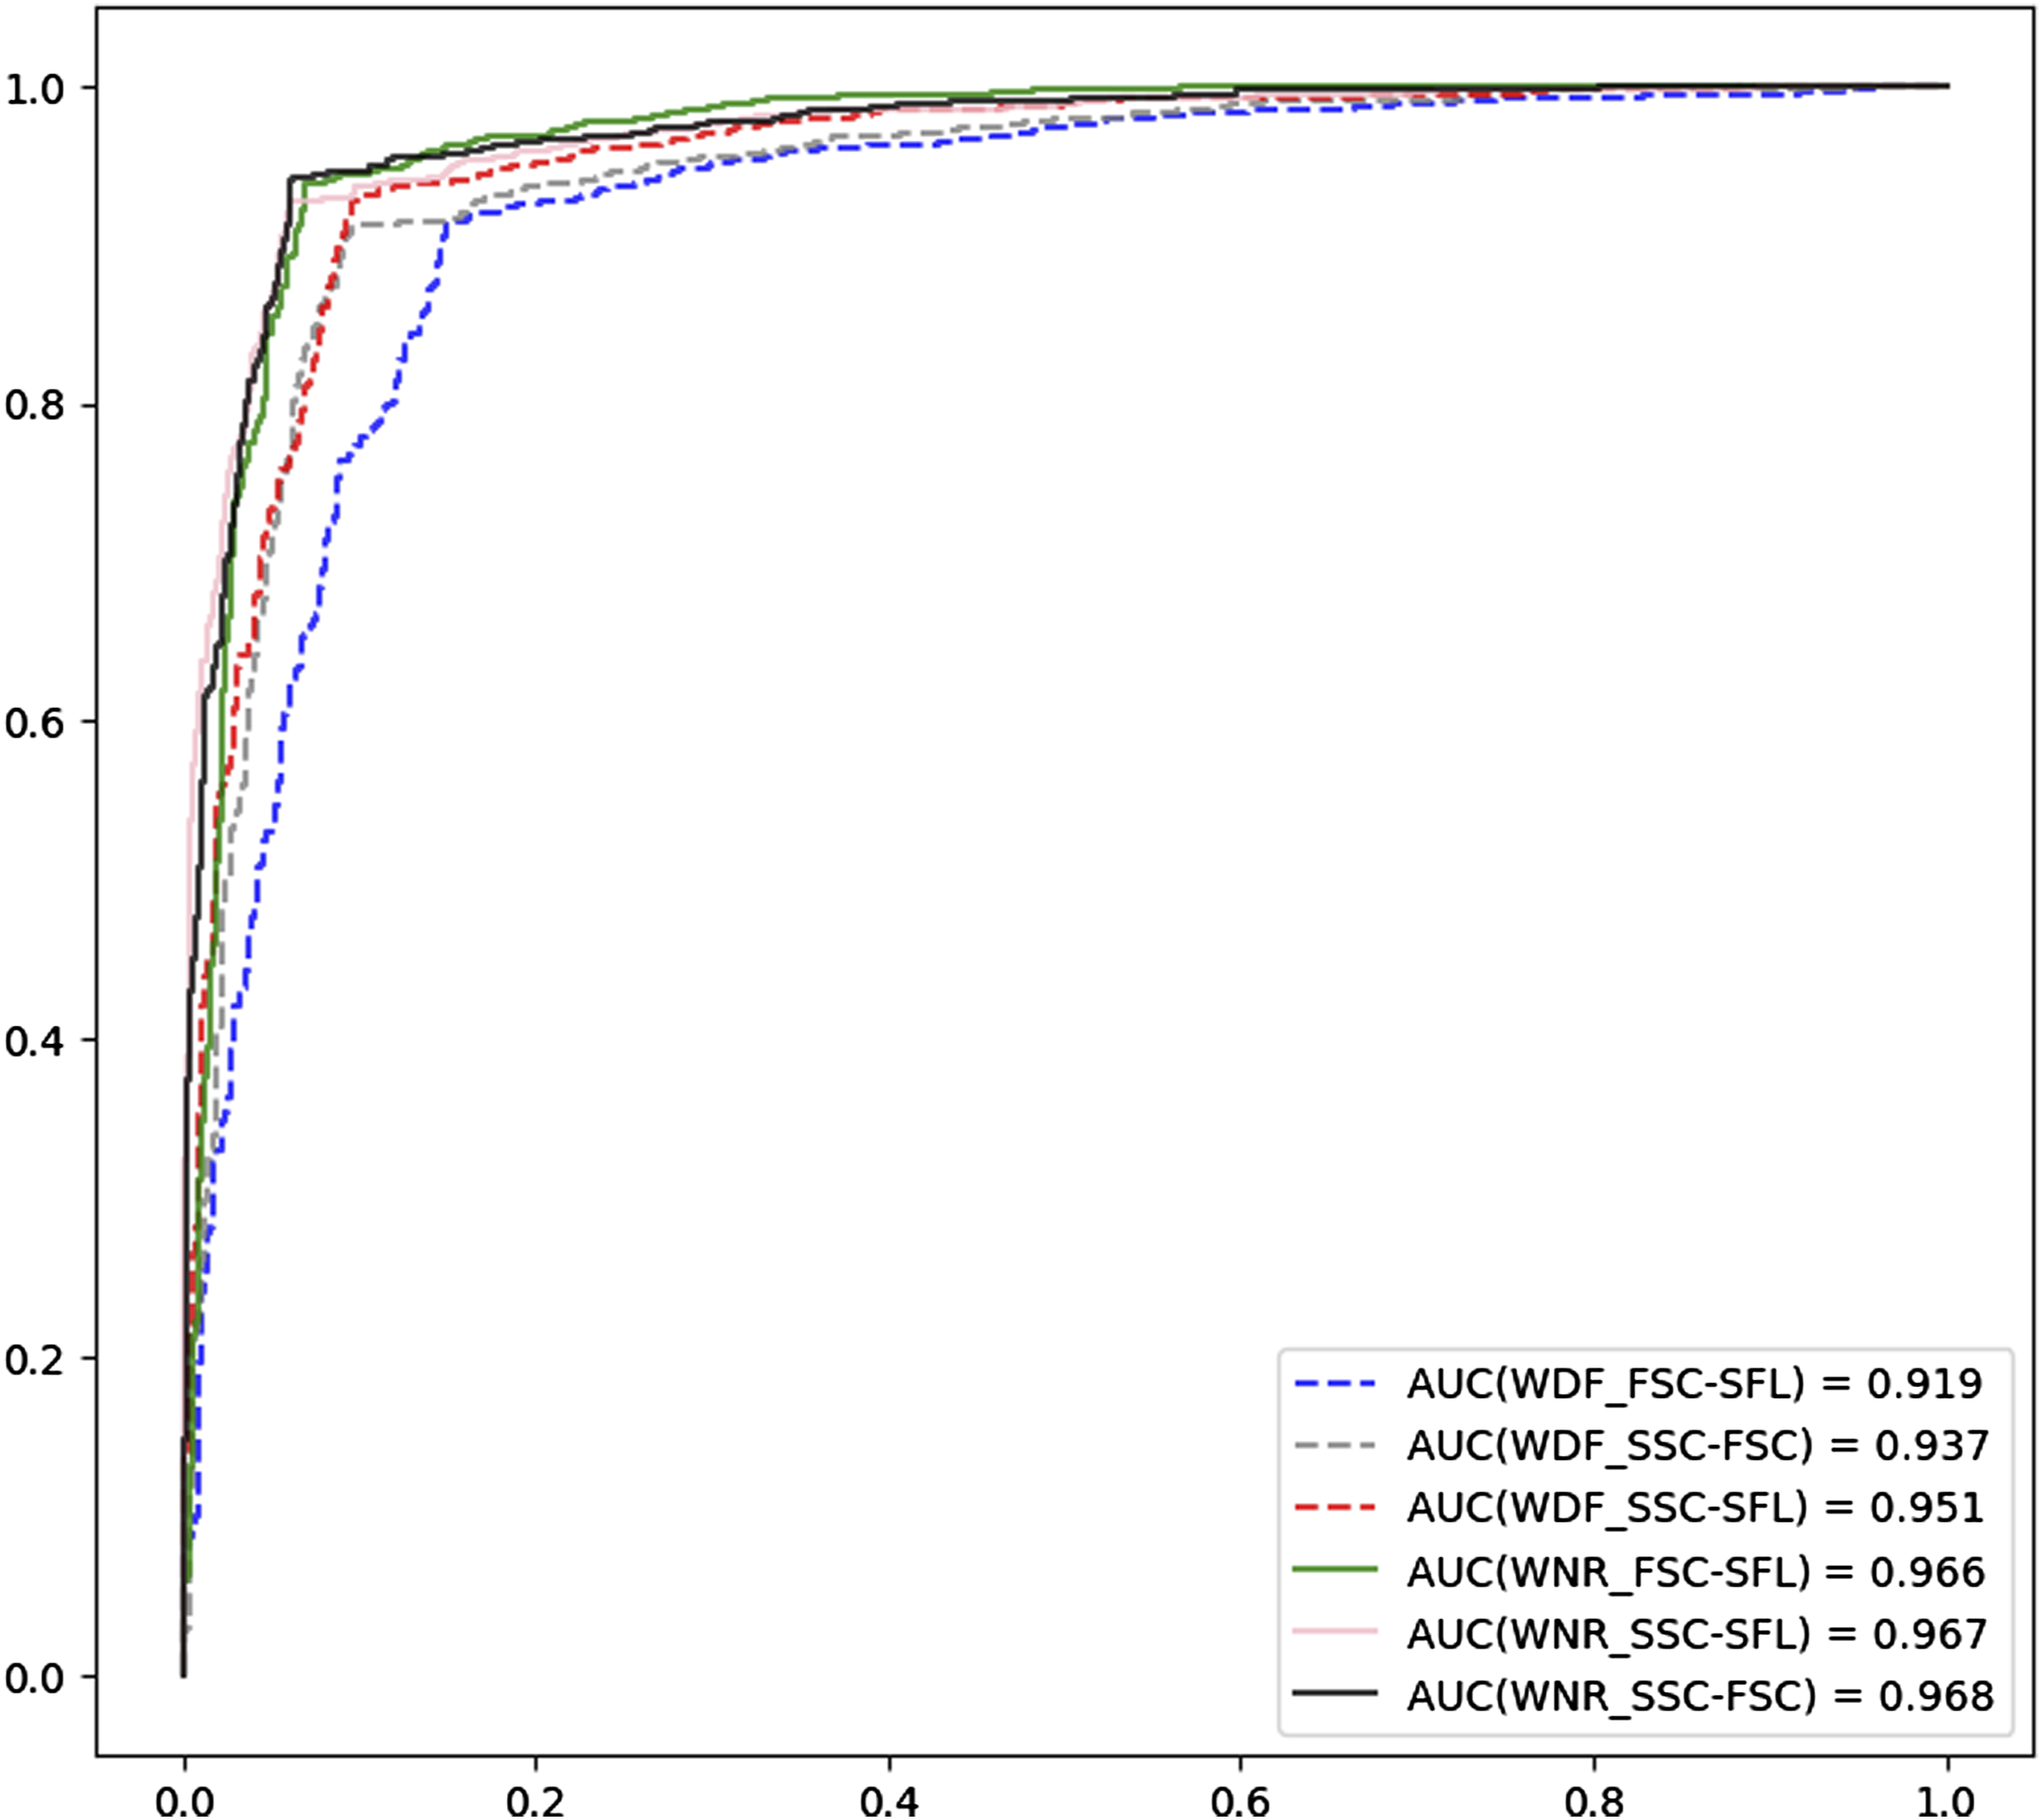
Performance of the optimal CNN in routine work
The performances of the XN-10 algorithm and the CNN in practical tests.
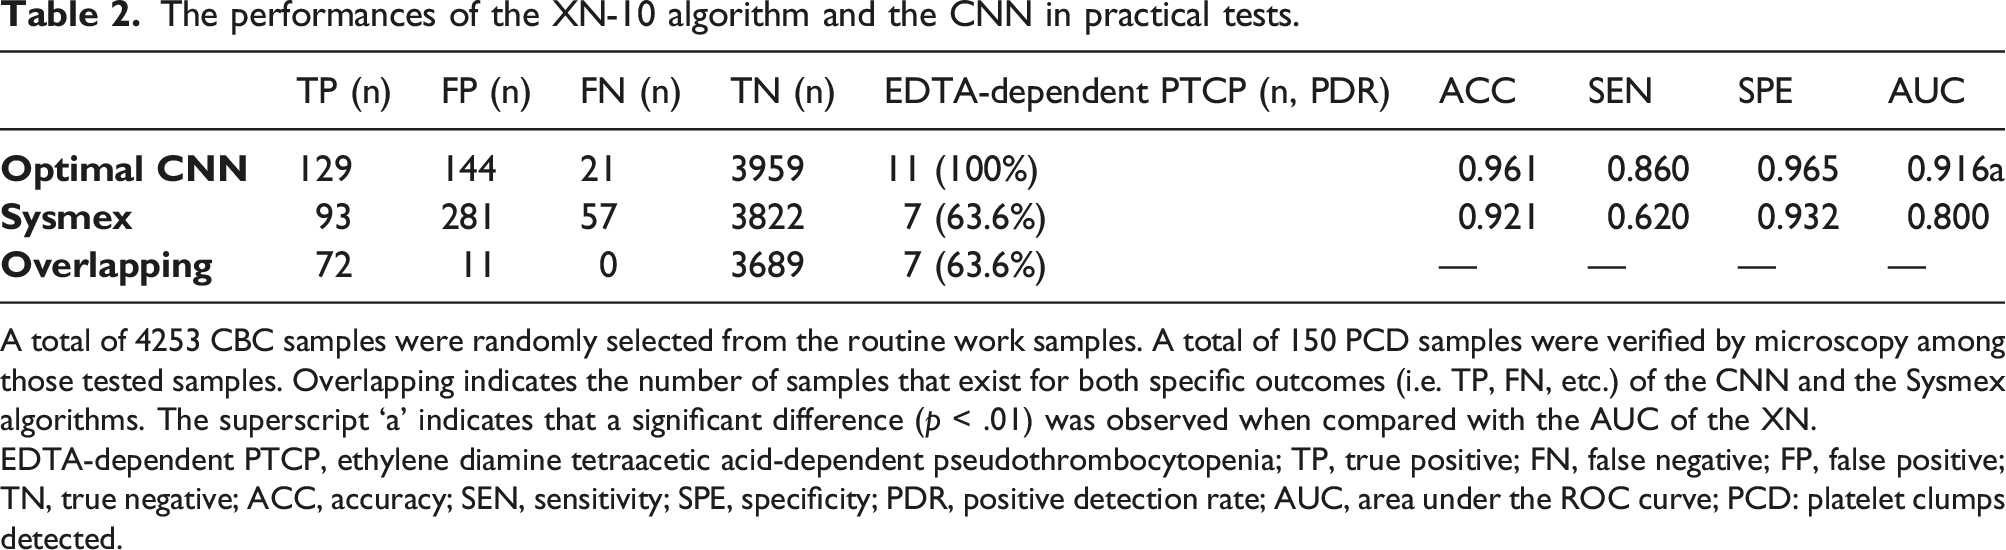
A total of 4253 CBC samples were randomly selected from the routine work samples. A total of 150 PCD samples were verified by microscopy among those tested samples. Overlapping indicates the number of samples that exist for both specific outcomes (i.e. TP, FN, etc.) of the CNN and the Sysmex algorithms. The superscript ‘a’ indicates that a significant difference (p < .01) was observed when compared with the AUC of the XN.
EDTA-dependent PTCP, ethylene diamine tetraacetic acid-dependent pseudothrombocytopenia; TP, true positive; FN, false negative; FP, false positive; TN, true negative; ACC, accuracy; SEN, sensitivity; SPE, specificity; PDR, positive detection rate; AUC, area under the ROC curve; PCD: platelet clumps detected.
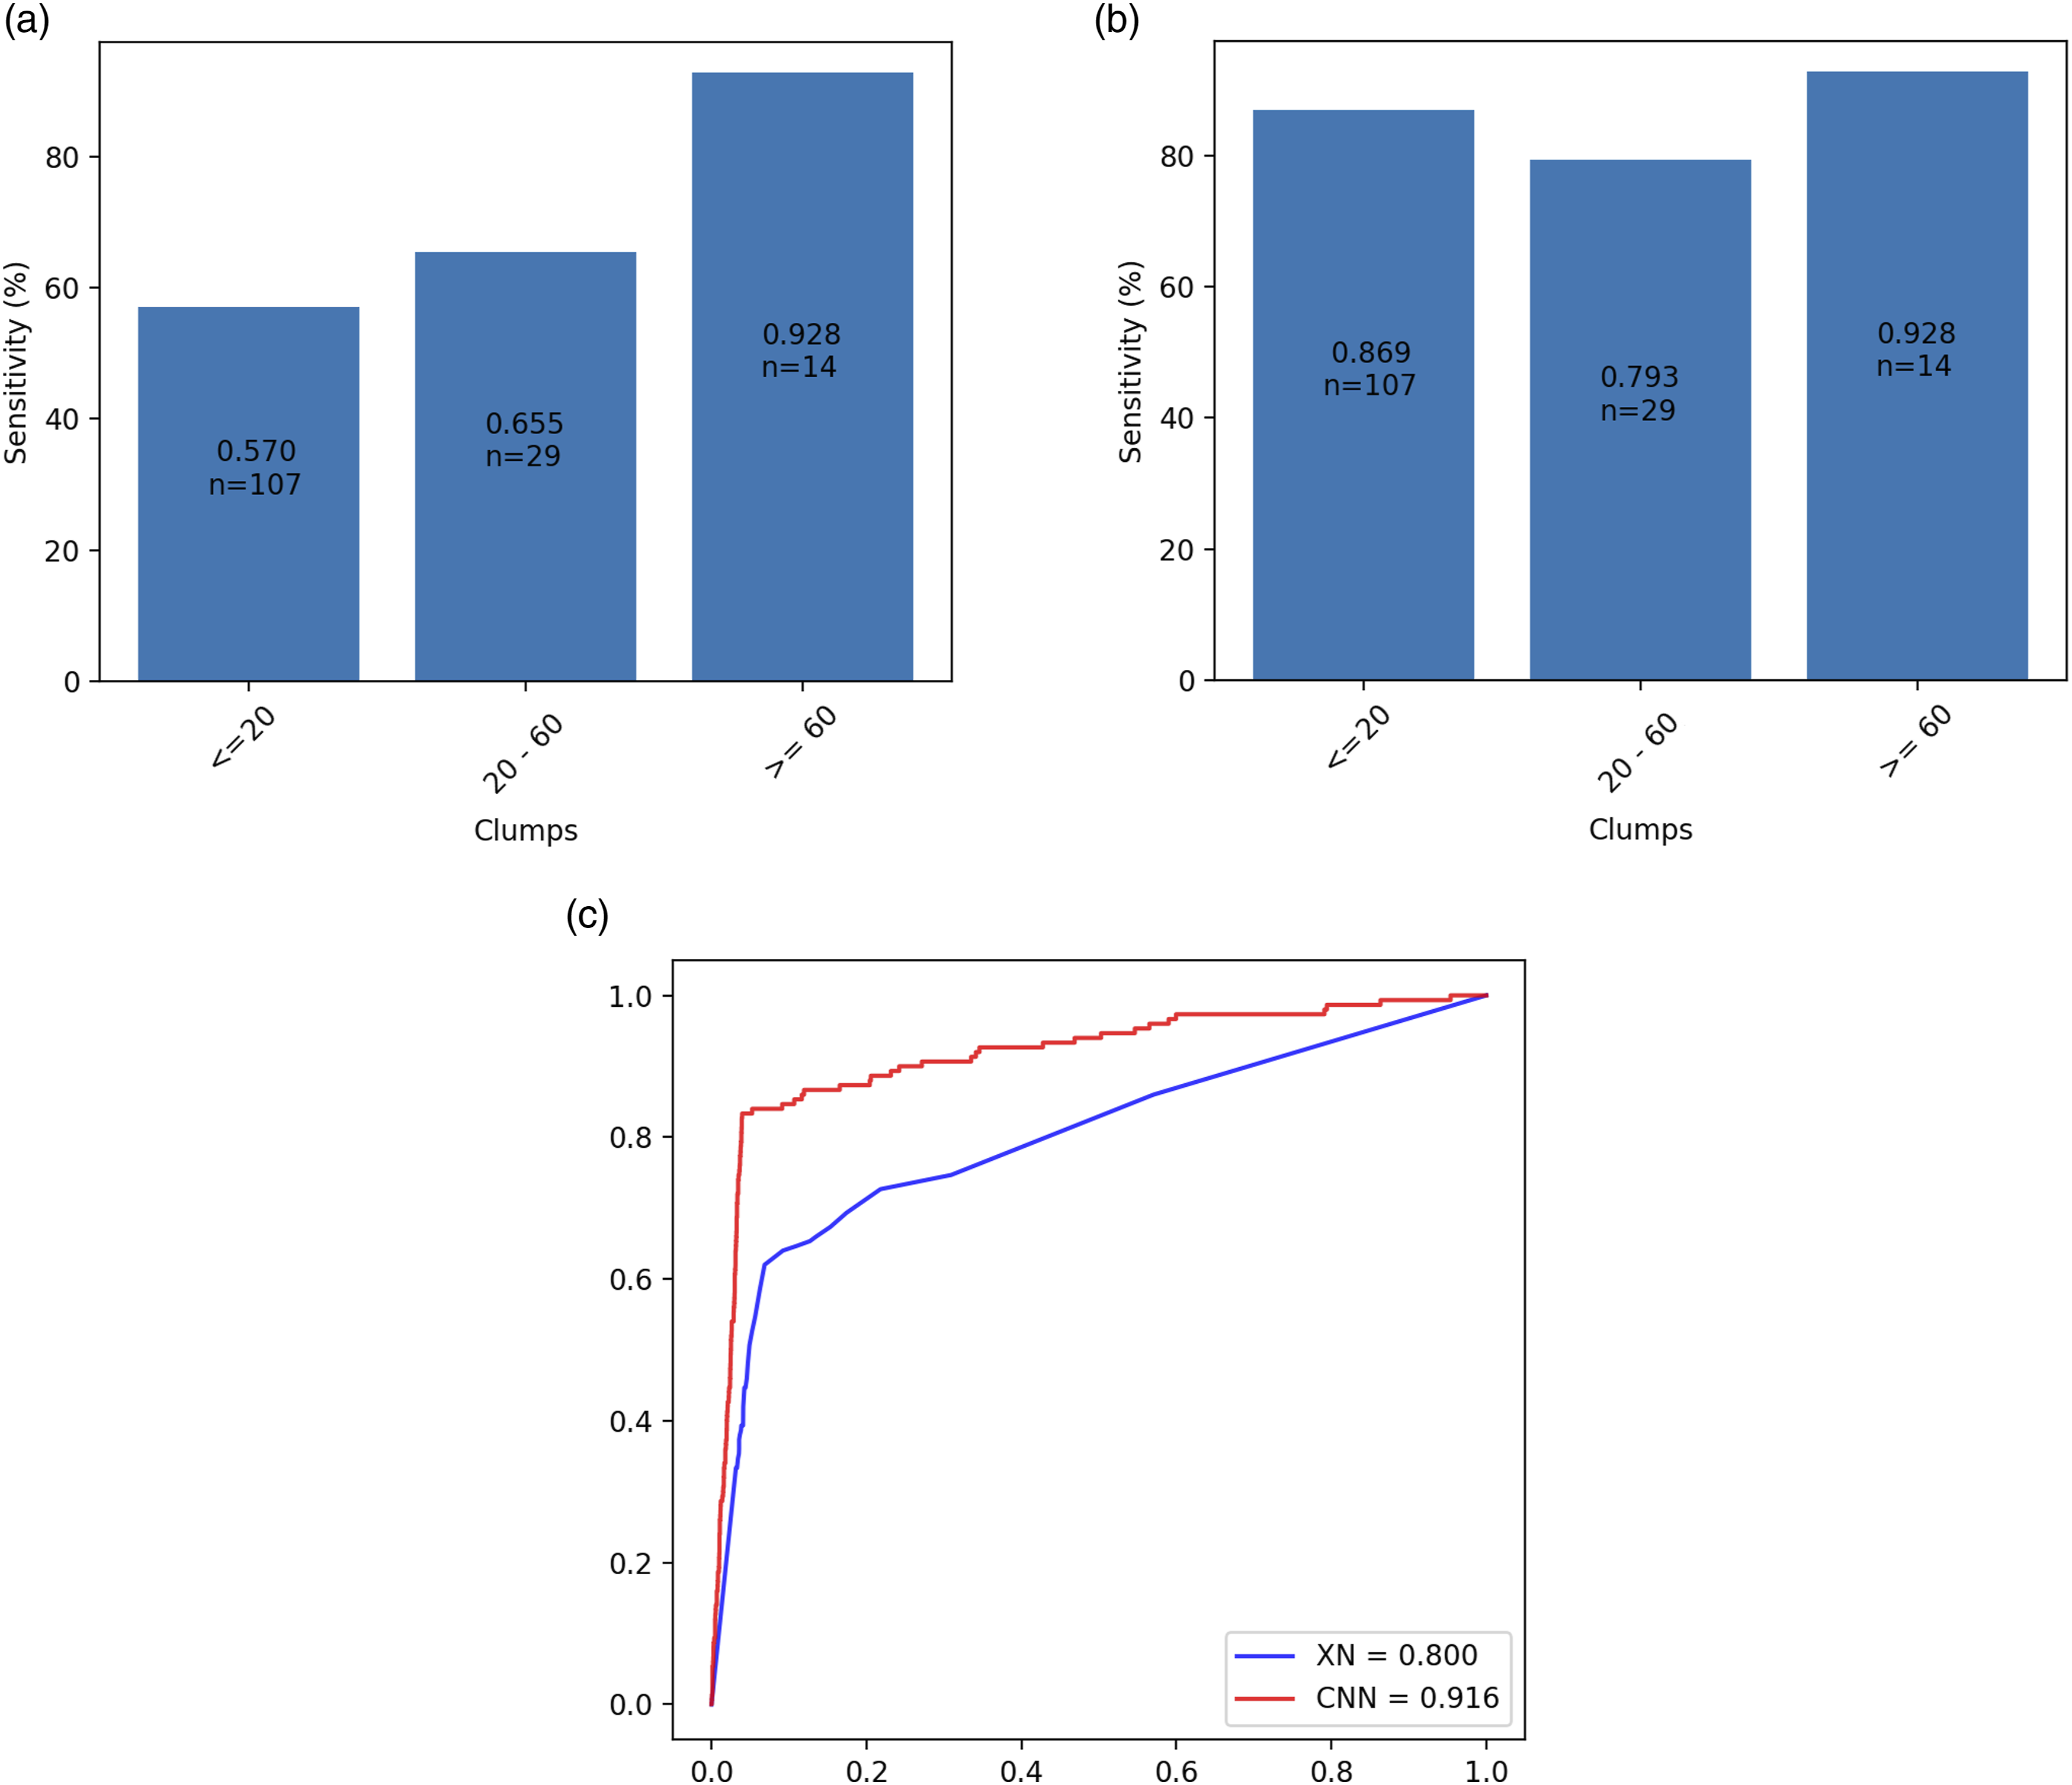
The performance of XN-10 and the CNN in the practical test. a and b are the sensitivities of the XN-10 and the CNN, respectively. The x-axis is the number of platelet clumps identified on the blood smear. c is the ROC curves of the XN-10 (blue line) and the CNN (red line). n: the number of cases.
CNN visual explanations
129 TP cases of the CNN were explained by the grad-CAM algorithm, and all the contributing features were obtained from the third convolutional layer. Two typical cases identified by the CNN and the general contributing features are shown in Figure 6. Those images of the contributing features show that the class-discriminative regions were mainly located around the leucocytes, which means the dispersed spots presenting around the leucocytes, especially in the lower left of the leucocytes area, may be a sign of platelet clumping. The class-discriminative regions of the WNR scattergrams. The class-discriminative regions of the WNR scattergrams retrieved from the last convolutional layer of the optimal CNN. a, b are the contributing features of two independent PCD samples. c is the general contributing features. PCD: platelet clumps detected.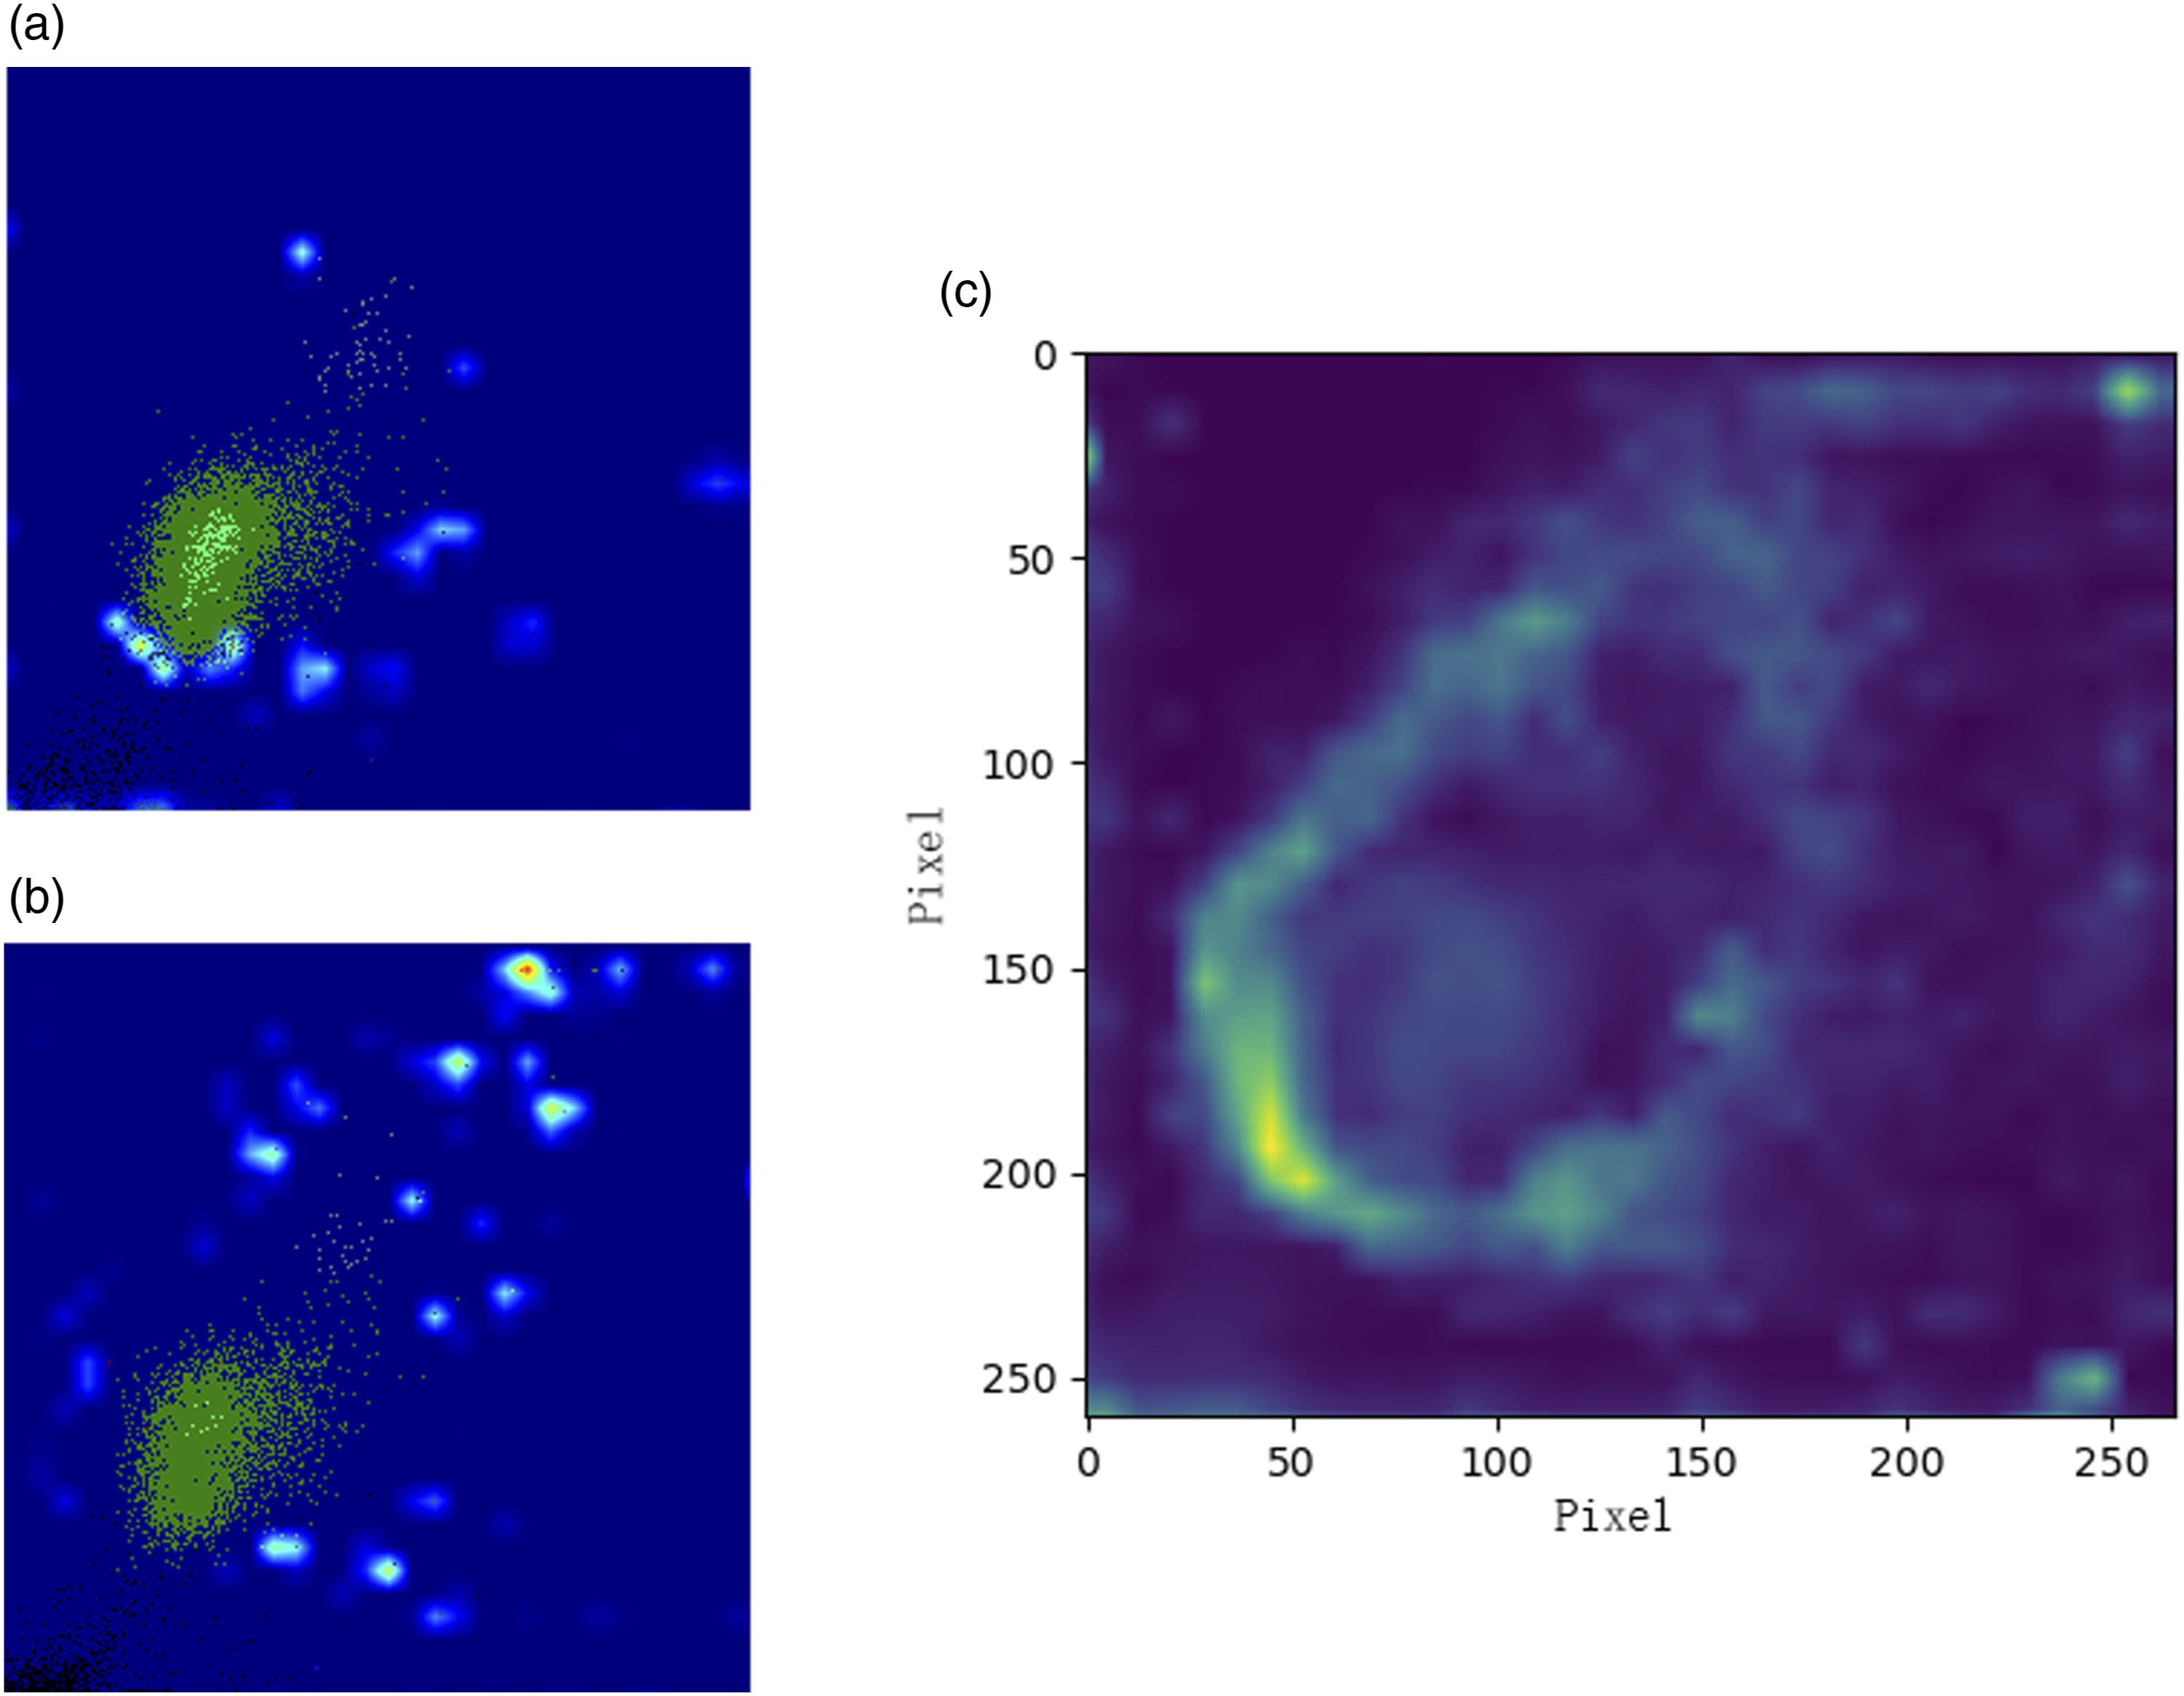
Discussion
Platelet count, which is routinely offered by automated HA, is important for evaluating haemostatic status and clinical decision-making. However, the platelet count is one of the most unstable parameters in CBC because many factors, such as anticoagulants and improper venepuncture, can cause platelet aggregation. The routine anticoagulant for CBC is EDTA, which chelates Ca2+ and dissociates the Ca2+-dependent glycoprotein IIb/IIIa (gpIIb‐IIIa) heterodimer on platelets. 12 This may allow autoantibodies to bind to several epitopes that are only revealed in the dissociated form of gpIIb and that result in platelet aggregation. 13 However, such a phenomenon, also known as EDTA-dependent pseudothrombocytopenia, is not common in clinical practice, with an incidence of 0.07%–0.2%. 14 Improper phlebotomy procedures, including insufficient mixing and sluggishness of the pumping flow, may also lead to platelet aggregation and may be more common in geriatric hospitals. In this study, the rate of PCD samples was as high as 3.55%, and the detection sensitivity of Sysmex XN-10 was only 62.0%. Such a low sensitivity can cost technicians much time in conducting microscopic examinations to guarantee the accuracy of HA reports.
Most Sysmex HAs have two dedicated leukocyte counts and differential channels, WNR and WDF. Both channels lyse erythrocytes and platelets using specific lysing reagents called ‘Lysercell-WNR’ or ‘Lysercell-WDF’. After lysis, the remaining cells, including leukocytes and nucleated erythrocytes, are stained with specific fluorescent dyes and irradiated by using a laser. Then, three optical signals, SSC, FSC and SFL, are collected by the photosensitive semiconductors of the HA. 15 Platelet aggregates are resistant to lysis reagents and remain in the measuring chamber together with leukocytes and nucleated erythrocytes. 10 Thus, the platelet clumps can also be reflected on the leukocyte scattergrams and can, therefore, be identified by the CNN. Our results showed that the optical signals of the WNR channel were more compatible with training the CNN in terms of accuracy. The reason may be that the lysing reagent of the WNR channel has a lower pH and oncotic pressure than that of the WDF channel, which may influence the fragility and permeability of the cells and may help the platelet clumps generate more optical characteristics.16,17
As far as we know, the XN-10 detection algorithm is a decision-making tree that involves the particle counts within five specific areas of the scattergrams of dedicated leucocyte channels. As the number of conditions that meet the requirement increases, the Q-value will correspondingly increase, and the platelet-clumps flag rises when the Q-value reaches the threshold. Such an inflexible algorithm may have a low fitting ability for complicated or extreme cases and may, therefore, exhibit poor performance. DL algorithms are now widely used in many fields of health care and demonstrate excellent fitting abilities when applied to complex medical problems. 18 CNNs are one of the DL algorithms that are especially good at image identification due to their low computational resource requirement and high precision. 19 One of the most important properties of CNNs is their convolution operations, which automatically extract features from the large-scale input data by means of multiple convolution filters, also called kernels. 20 The filter is a numerical matrix that slides over the whole image step by step to generate the feature map, which is subsequently downsampled by the pooling layer.21–23 In this process, the pixel values of the image are changed, but the positional information is still preserved in the feature map. 24 This property allows the convolutional layers to be visually explained by several interpretation algorithms, such as class activation mapping (CAM) and Grad-CAM.
So far, studies exploring the visible indications of platelet clumping on HA are limited due to the inaccessible raw data of the HA. The interpretations of the CNNs make it possible to study the particle populations on scattergrams without the raw data of the HA. Compared with the CAM, the Grad-CAM is applicable to a broader range of CNN model families without requiring architectural changes, re-training, or any secondary learning component. The key steps to this algorithm are to obtain the feature maps and their gradient matrices from the convolutional layer and to calculate the weighted sum of the feature maps. 25 The interpretation algorithms of the CNNs are now widely used to achieve the instructive locations of the medical image and to highlight the key factors in pathogenesis.26,27 However, the outcomes of those algorithms are only the evidence on which the predictions depend. Therefore, in this study, the particles in the highlighted areas of the WNR scattergram may not represent the platelet clumps but can be regarded as a sign of platelet clumping.
In addition to the above findings, there were significant differences in the intensities and distribution widths of the optical signals in the area of specific cell populations in the WDF channel between negative samples and PCD samples (data not shown). This optical information, such as the SFL intensities of the neutrophil (named NE_SFL in csv format file) and the lymphocyte area (LY_Y), the SSC intensity and distribution width of monocyte area (MO_X and MO_WX), may also have the potential to identify platelet clumping.
There are several defects that we must note. First, our PCD samples used for training were all induced by ADP, whereas the morphology of the platelet clumps might have been more variable in the practical test. Therefore, the homogeneity of the training dataset may be responsible for the reduction in the sensitivity of the CNN during the practical test. Second, the criteria for PCD sample in CV and in practical tests were not consistent, which might have influenced the consistency of the performance assessments. The PCD samples in the practical test were only confirmed by microscopy because the precise reduction of the platelet count is hard to calculate under practical circumstances. Third, the composition of the PCD samples was somewhat unbalanced. The PCD samples in this study were mainly caused by improper venepuncture procedures, which may be less common in other hospitals. Such an unbalanced constituent ratio may generate bias in the results of the practical test. To overcome this defect, a multicentre external validation is needed in future studies. Additionally, the criteria for platelet clumps identification in practical tests is strict. This may be one of the reasons for the high platelet clumping rate in our study.
To the best of our knowledge, this study is the first to apply a CNN algorithm to platelet clump detection using optical information from dedicated leucocyte channels, and the results showed that the CNN had a higher ability to detect platelet clumps than the XN-10 device’s internal algorithm even under practical circumstances. Although the fluorescent platelet channel is also reported to have outstanding flagging performance detecting platelet clumping, 28 the regent for this channel is expansive and could not be tested on every CBC sample. However, the CNN could replace the current algorithm used in the Sysmex HA without requiring any additional device or reagent.
Footnotes
Acknowledgements
None declared.
Declaration of conflicting interests
The author(s) declared no potential conflicts of interest with respect to the research, authorship, and/or publication of this article.
Funding
The author(s) disclosed receipt of the following financial support for the research, authorship, and/or publication of this article: This work was supported by the Science Fund of the Health Department of Zhejiang Province. Project ID: 2022KY931.
Ethical approval
The study was approved by the institutional research ethics committee of The Third Affiliated Hospital of Zhejiang Chinese Medical University. Approval ID: ZSLL-KY-2021-001-01.
Guarantor
PX.
Contributorship
All of the authors have accepted responsibility for the entire content of this submitted manuscript and have approved this submission.