
Abstract
Introduction
The human body relies on energy to maintain homeostatic processes. Food, containing sugars, proteins and fats, are efficiently converted through oxidative metabolism. During this process, acidic metabolites and CO2 are formed, which can disrupt the acid balance. To adjust temporary imbalances, the body relies on buffering systems, such as bicarbonate. 1
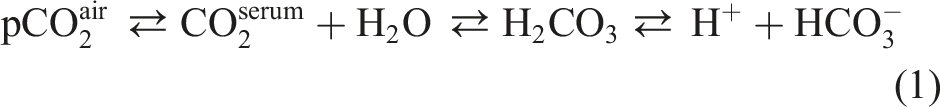
Total CO2 is a clinical chemistry parameter often applied to assess the equilibrium between respiratory and metabolic acid balances. The principle of most total CO2 measurements on routine chemistry analysers rely on the enzymatic incorporation of bicarbonate into pyruvate by phosphoenolpyruvate carboxylase, creating oxaloacetate. At alkaline pH, the equilibrium between dissolved CO2, carbonic acid and the bicarbonate ion is favoured to bicarbonate, allowing full conversion of all dissolved CO2 in the sample by the enzyme, hence the term ‘total CO2’ (equation 1). 2
Total CO2 measurements are notorious for their initial instability, as the atmospheric concentrations of CO2 are far below the concentrations present in the serum. This equilibrium can be described through several reactions, each with their own reaction constant equation (1). As the collection tube opens, the dissolved CO2 evaporates, decreasing the total CO2 in the sample at a rate up to 3 mmol/L in the first hour.2,3 The equilibrium constant according to Henry’s law states that the amount of dissolved gas is proportionate to the partial pressures of the gas, as a consequence, CO2 fluctuations may affect the total amount of CO2 in the blood.
As part of the laboratory quality assurance strategies, internal quality control measurements (QC) are applied. The use of QC materials as a proxy for human samples is a popular tool to monitor both bias and imprecision of an assay over an extended period of time. 4
During daily routine, a concerning instability of the assay was observed, and the potential causes were investigated.
Materials and methods
The total CO2 assay was compared on three Abbott Architect c8000 chemistry analysers using the carbon dioxide reagent (Abbott Laboratories, IL, US) in two laboratories within one hospital consortium. QC material comprised of two levels of Bio-Rad Unassayed Clinical Chemistry (Bio-Rad Laboratories, Belgium). Two chemistry analysers in the laboratory experiencing the parameter instability (analyser 1 and 2) were compared to a stable reference analyser in the alternative campus (reference analyser). The Levey–Jennings plot was generated using the Bio-Rad Unity Real Time software (v2.8.1.000 Bio-Rad Laboratories) and inspected over a period of 1 month to have a qualitative appreciation of potential causes.
To assess the potential impact of atmospheric CO2, a Vaisala GMW80 CO2 meter (Vaisala, Germany) was installed in the laboratory environment over a period of 6 weeks. Atmospheric CO2 concentrations were registered intermittently and classified as day (between 8 a.m. and 7 p.m.) or night shifts (between 8 p.m. and 7 a.m.). To assess a link between the environment and the assay result, atmospheric CO2 was correlated to the obtained value of quality control materials using a spearman correlation test. A rough estimation of the environmental impact was applied using linear regression. The impact of atmospheric CO2 was investigated on patient samples analysed in a 3-week period of unfavourable ventilation conditions, in which CO2 accumulated in the laboratory environment. Unfavourable ventilation conditions were defined as external weather conditions in which the lab was not exposed to draft, that is, wind speed <1.5 m/s, or wind direction different from south, south-west or west. Environmental data were obtained from the local weather station in Retie (KMI, Belgium)). Patient data were anonymously acquired from a single analyser in the routine chemistry lab during weekdays, the acquisition was classified to day or night shift as mentioned previously. Medians were compared using a Student’s t-test for unequal variance; the proportion of failed QCs in respect to the weather conditions is assessed using a Fisher Exact test.
In a follow-up experiment, atmospheric CO2 was monitored continuously for 5 weeks in both the lab environment and in the reaction chamber of the analyser. As atmospheric CO2 seemed dependent on weather conditions, curves were generated for both favourable and unfavourable ventilation conditions (as discussed above) and discussed qualitatively.
To reduce the variation of the total CO2 assays, several scenarios were investigated. The baseline scenario allowed free use of the chemistry analysers, implicating that reagent chamber lids were often not closed after loading reagent packs or QC materials. In scenario one, the passive ventilation of the laboratory was improved by opening the ventilation grids next to the windows. Scenario two comprised of a strict follow-up of Good Laboratory Practices, closing the lid of analysers as much as possible. This baseline and last scenario was monitored in a period with unfavourable and favourable weather conditions (respectively baseline month 1 and 2). Each implementation was followed for 1 month.
The variation between the scenarios was assessed using a Levene’s test for variance. When significant, post-hoc F tests were applied to assess which variance was different. The number of instable measurements were registered and compared using the Chi-squared test. Both Levene’s and Chi-squared tests were corrected for multiple analysers and QC materials. All figures and statistical analyses were performed using Analyse-it add-on tool in Microsoft Excel (version 4.95.1; Analyse-it software LTD, UK)
Results
Interpretation of QC fluctuations
Fluctuations in the control scenario as depicted in Figure 1 showed a considerable pattern. Several extreme values were observed, linked to moments of unacceptable stability. When performing calibration during these episodes, an overcompensation occurred. As a result, consecutive values were too low, introducing a new period of instability. The fluctuation seemed to correspond with day and night shifts, in which day shifts showed systematically higher values. The effect was only noticed on the main campus, on both analysers. The extent of the fluctuations were identical to both analysers, but were more pronounced on analyser 1 than on analyser 2. The variation of the analyser on the secondary campus did not show a circadian rhythm. As infrastructure on the secondary campus comprised of a different active ventilation infrastructure, the environmental CO2 accumulation was considered a potential cause of analyser instability. Internal Quality Control of Chemistry Analyser 1 for total CO2. Besides a daily fluctuation between morning and afternoon samples, extreme values were frequently registered. After calibration, an overcompensation was observed by a consecutive extreme value on the other end of the range.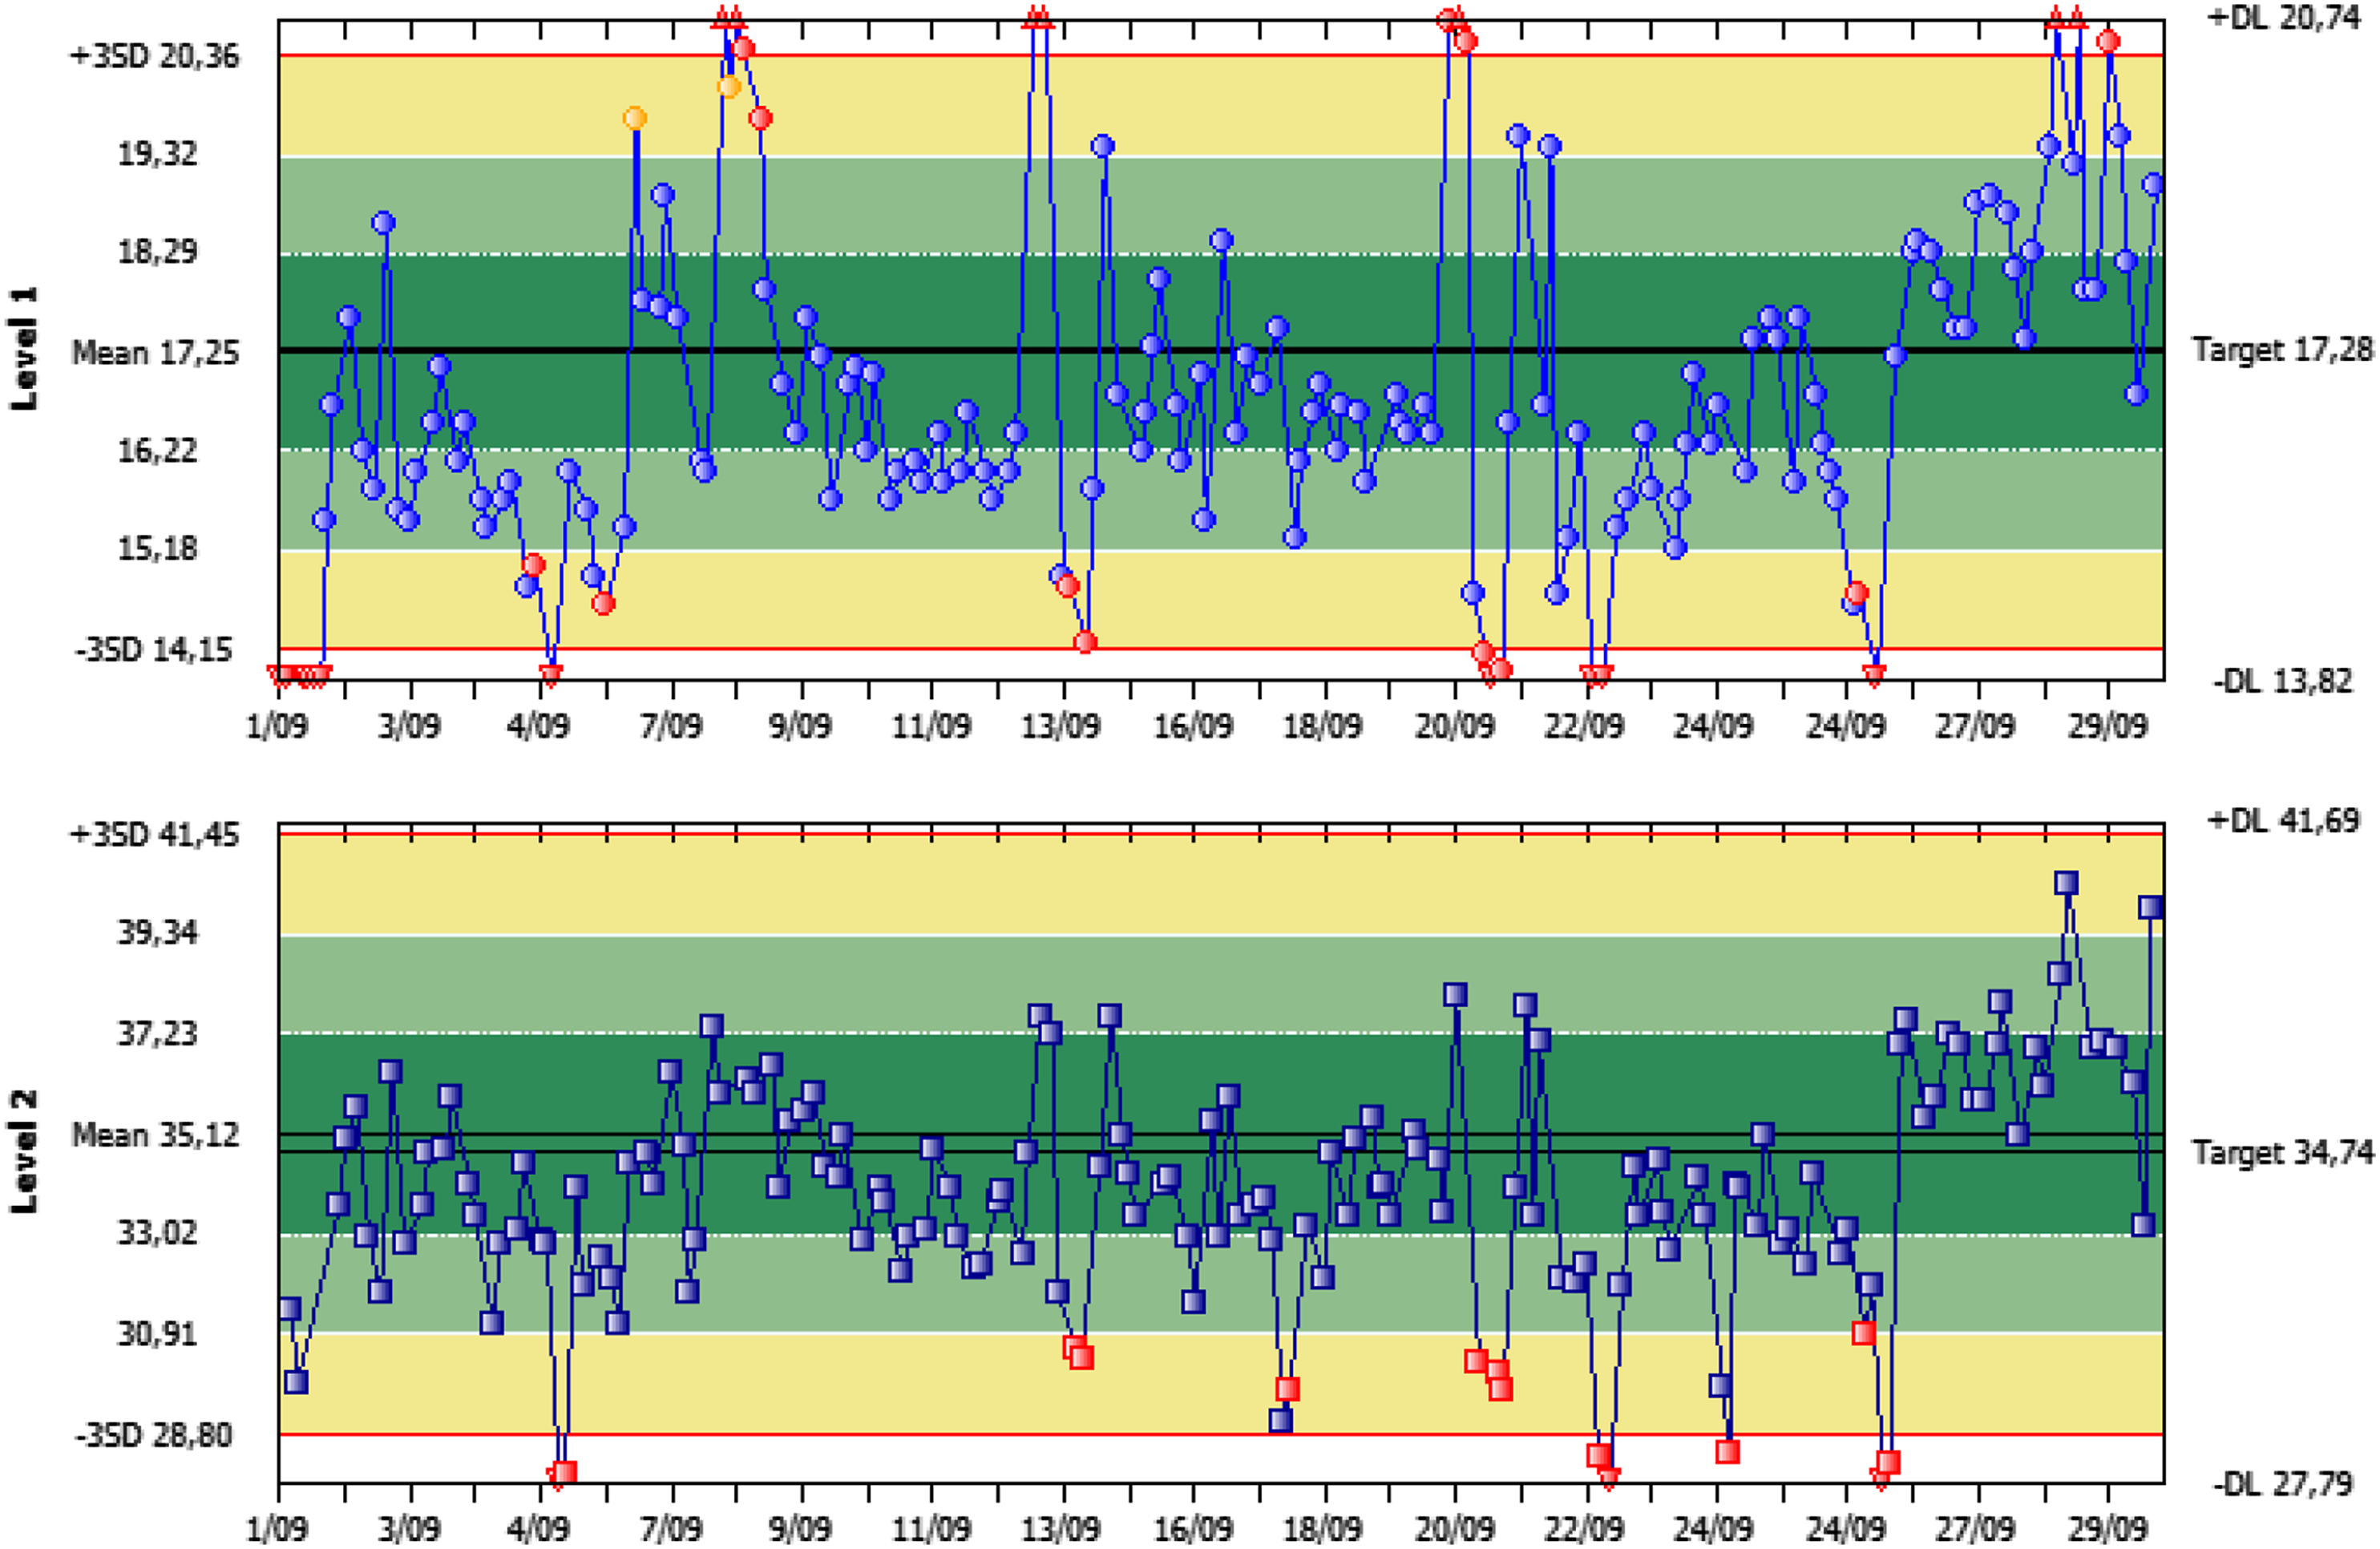
Atmospheric measurements
During a period of 6 weeks, 165 atmospheric CO2 measurements were obtained at the main campus, approximately equally distributed between day and night shifts (Figure SI-1). Because of unequal variance, a Mann–Whitney U test was applied, showing a significant higher atmospheric CO2 value during daytime (MWU, p-value 0.001, median difference 65 ppm, N = 165).
A correlation between the QC material and the atmospheric CO2 showed a good, significant correlation for the lower QC material (Spearman-rho 0.67, p < 0.001, n = 87). Similar effects could be observed for the higher QC, showing a moderately good, significant correlation (Spearman-rho 0.45; p < 0.001, n = 87) (Figure 2). The total CO2 in the sample seemed to saturate at higher atmospheric CO2 concentrations. Regression results were considered to be unreliable and not fit for corrective actions. Distribution of total CO2 measurements in correspondence to the atmospheric CO2 for the low-level (up) and high level (down) QC material. The atmospheric CO2 measurements were skewed to the right. The highest measurements of the low QC level (>19 mmol/L) were registered during moments of high atmospheric CO2 (>700 ppm). Although higher measurements were also observed for the higher QC level during moment with high atmospheric CO2 concentration, the impact was less noticeable.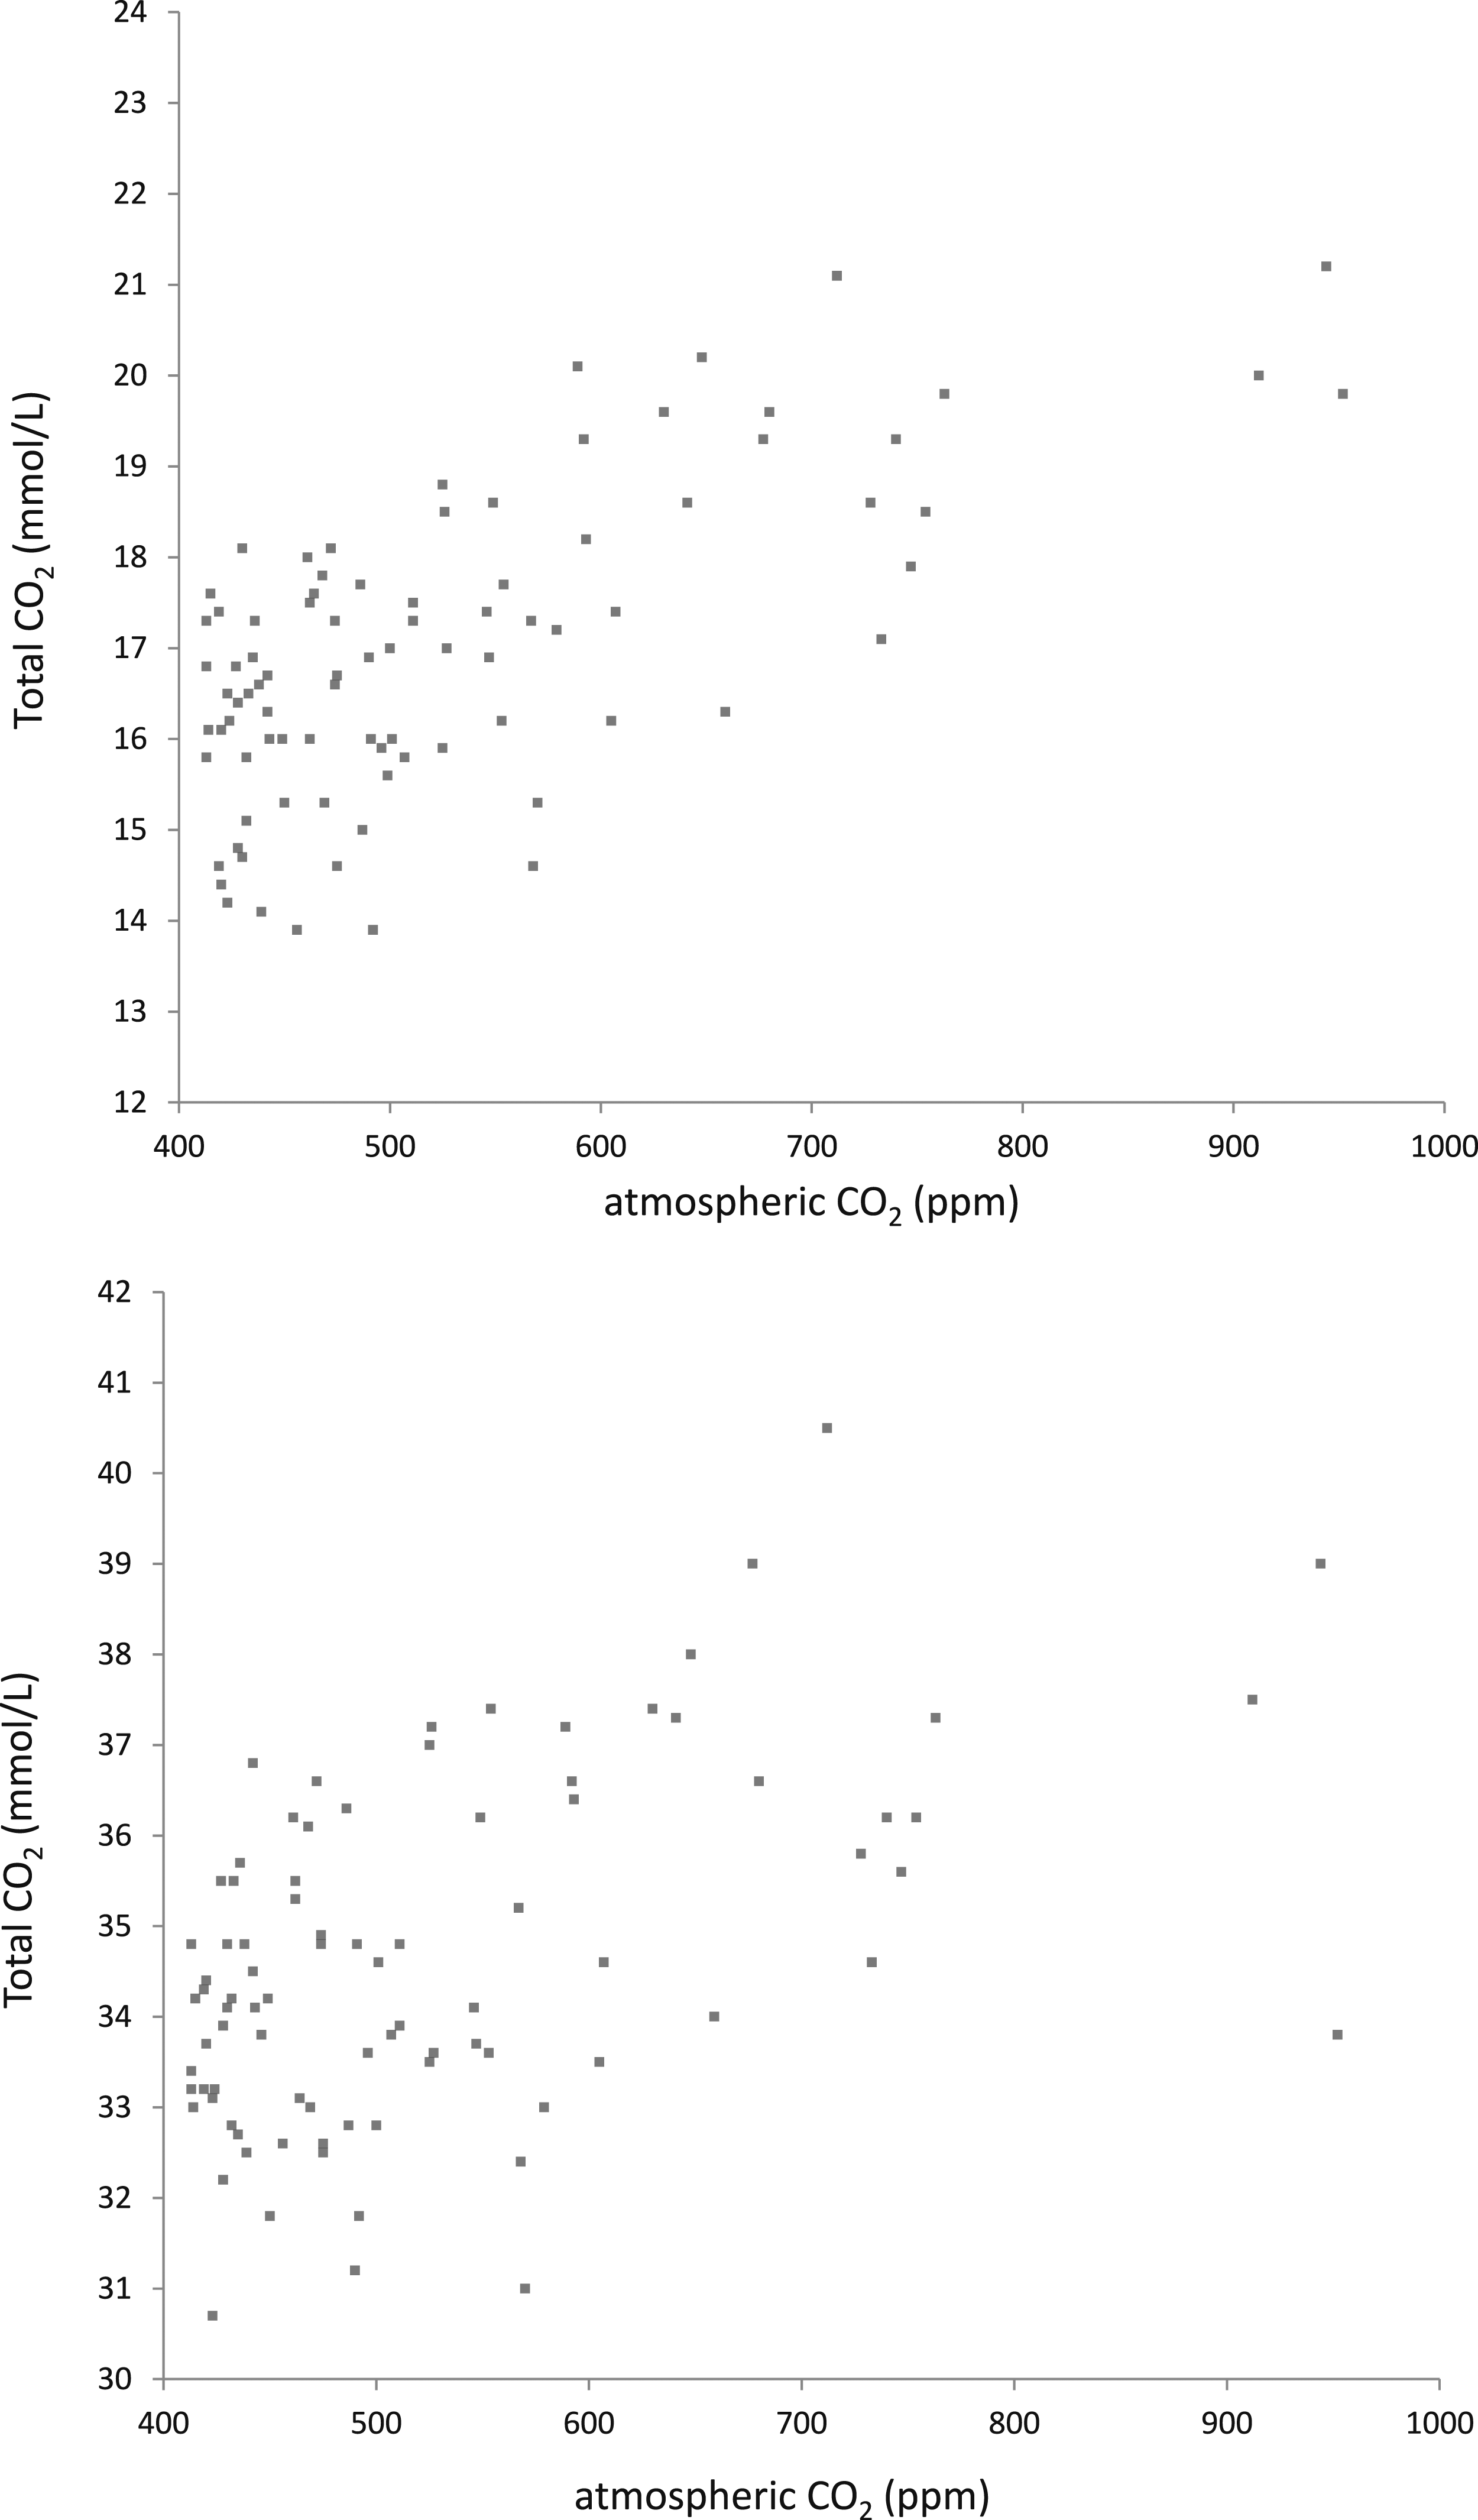
A follow-up continuous monitoring over a period of 6 weeks indicated the important CO2 fluctuations within the laboratory (Figure 3). CO2 levels were highest in the afternoon of weekdays, corresponding to the higher attendance of laboratory personnel. The effect was both noticeable in the general lab environment as within the analyser’s reagent room. Remarkably, there was a difference in CO2 fluctuations between weeks. A retrospective analysis of atmospheric pressure and wind speed and direction indicated that weather conditions were related to moments of analyser instability (Mann–Whitney U and Fisher exact p < 0.001 n = 727; Figures SI-2 and Table SI-3). Distribution of CO2 values during weeks with good (full line) and bad (dotted line) ventilation conditions. Ribbons indicate 1-SD confidence interval. Fluctuations are related to moments of high personnel attendance, such as weekday afternoons. No difference was observed between the atmospheric CO2 in the lab environment and within the analyser reagent room (box insert, full and dotted line, respectively).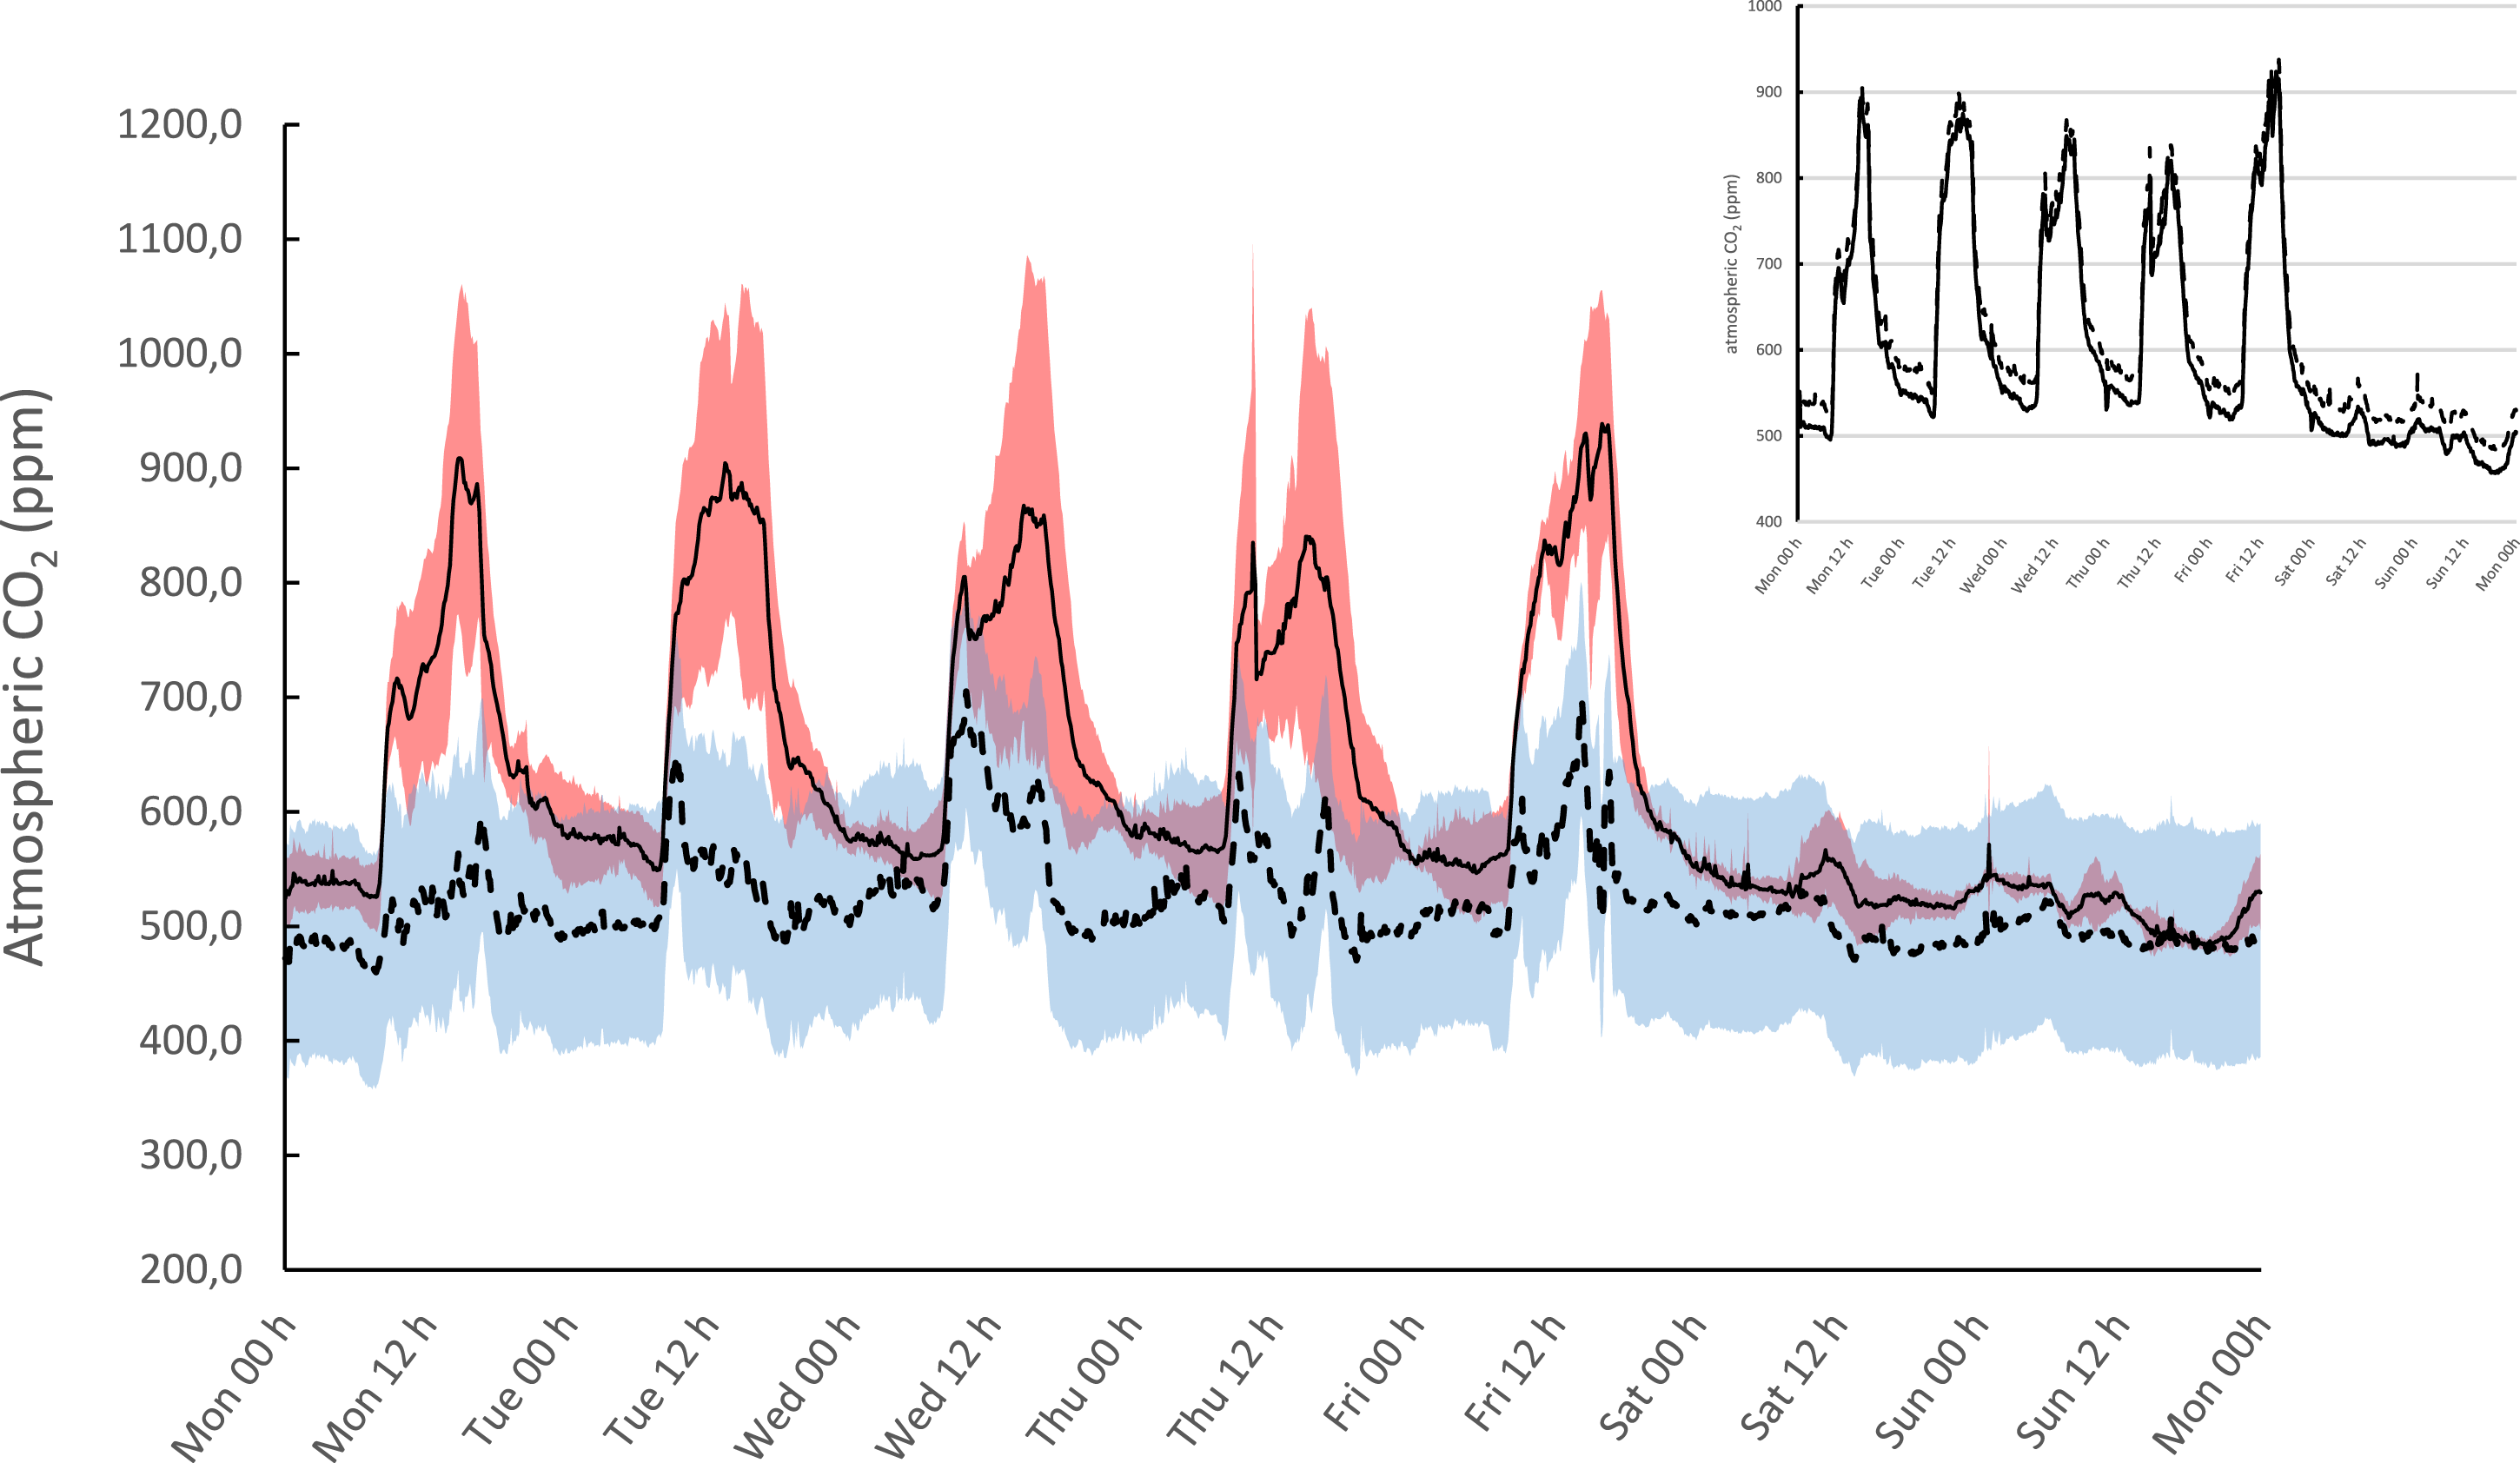
A total of 2540 patient samples acquired during weekdays in a 3 week period of high atmospheric pressure were collected from a single analyser in the routine chemistry lab and grouped according to day (N 2111) or night (N 429) shifts (Figure 4). Total CO2 values acquired during night shifts were significantly lower than during day shifts (Mann–Whitney U p-value < 0.001). The absolute difference was 2 mmol/L, or 8.7%. patient data of total CO2 acquired during a period of unfavourable ventilation conditions (wind speed <1.5 m/s or direction not south or west). Medians were significantly different between day and night shifts (absolute difference 2 mmol/L, Student’s t-test for unequal variance, p < 0.001, N 2540).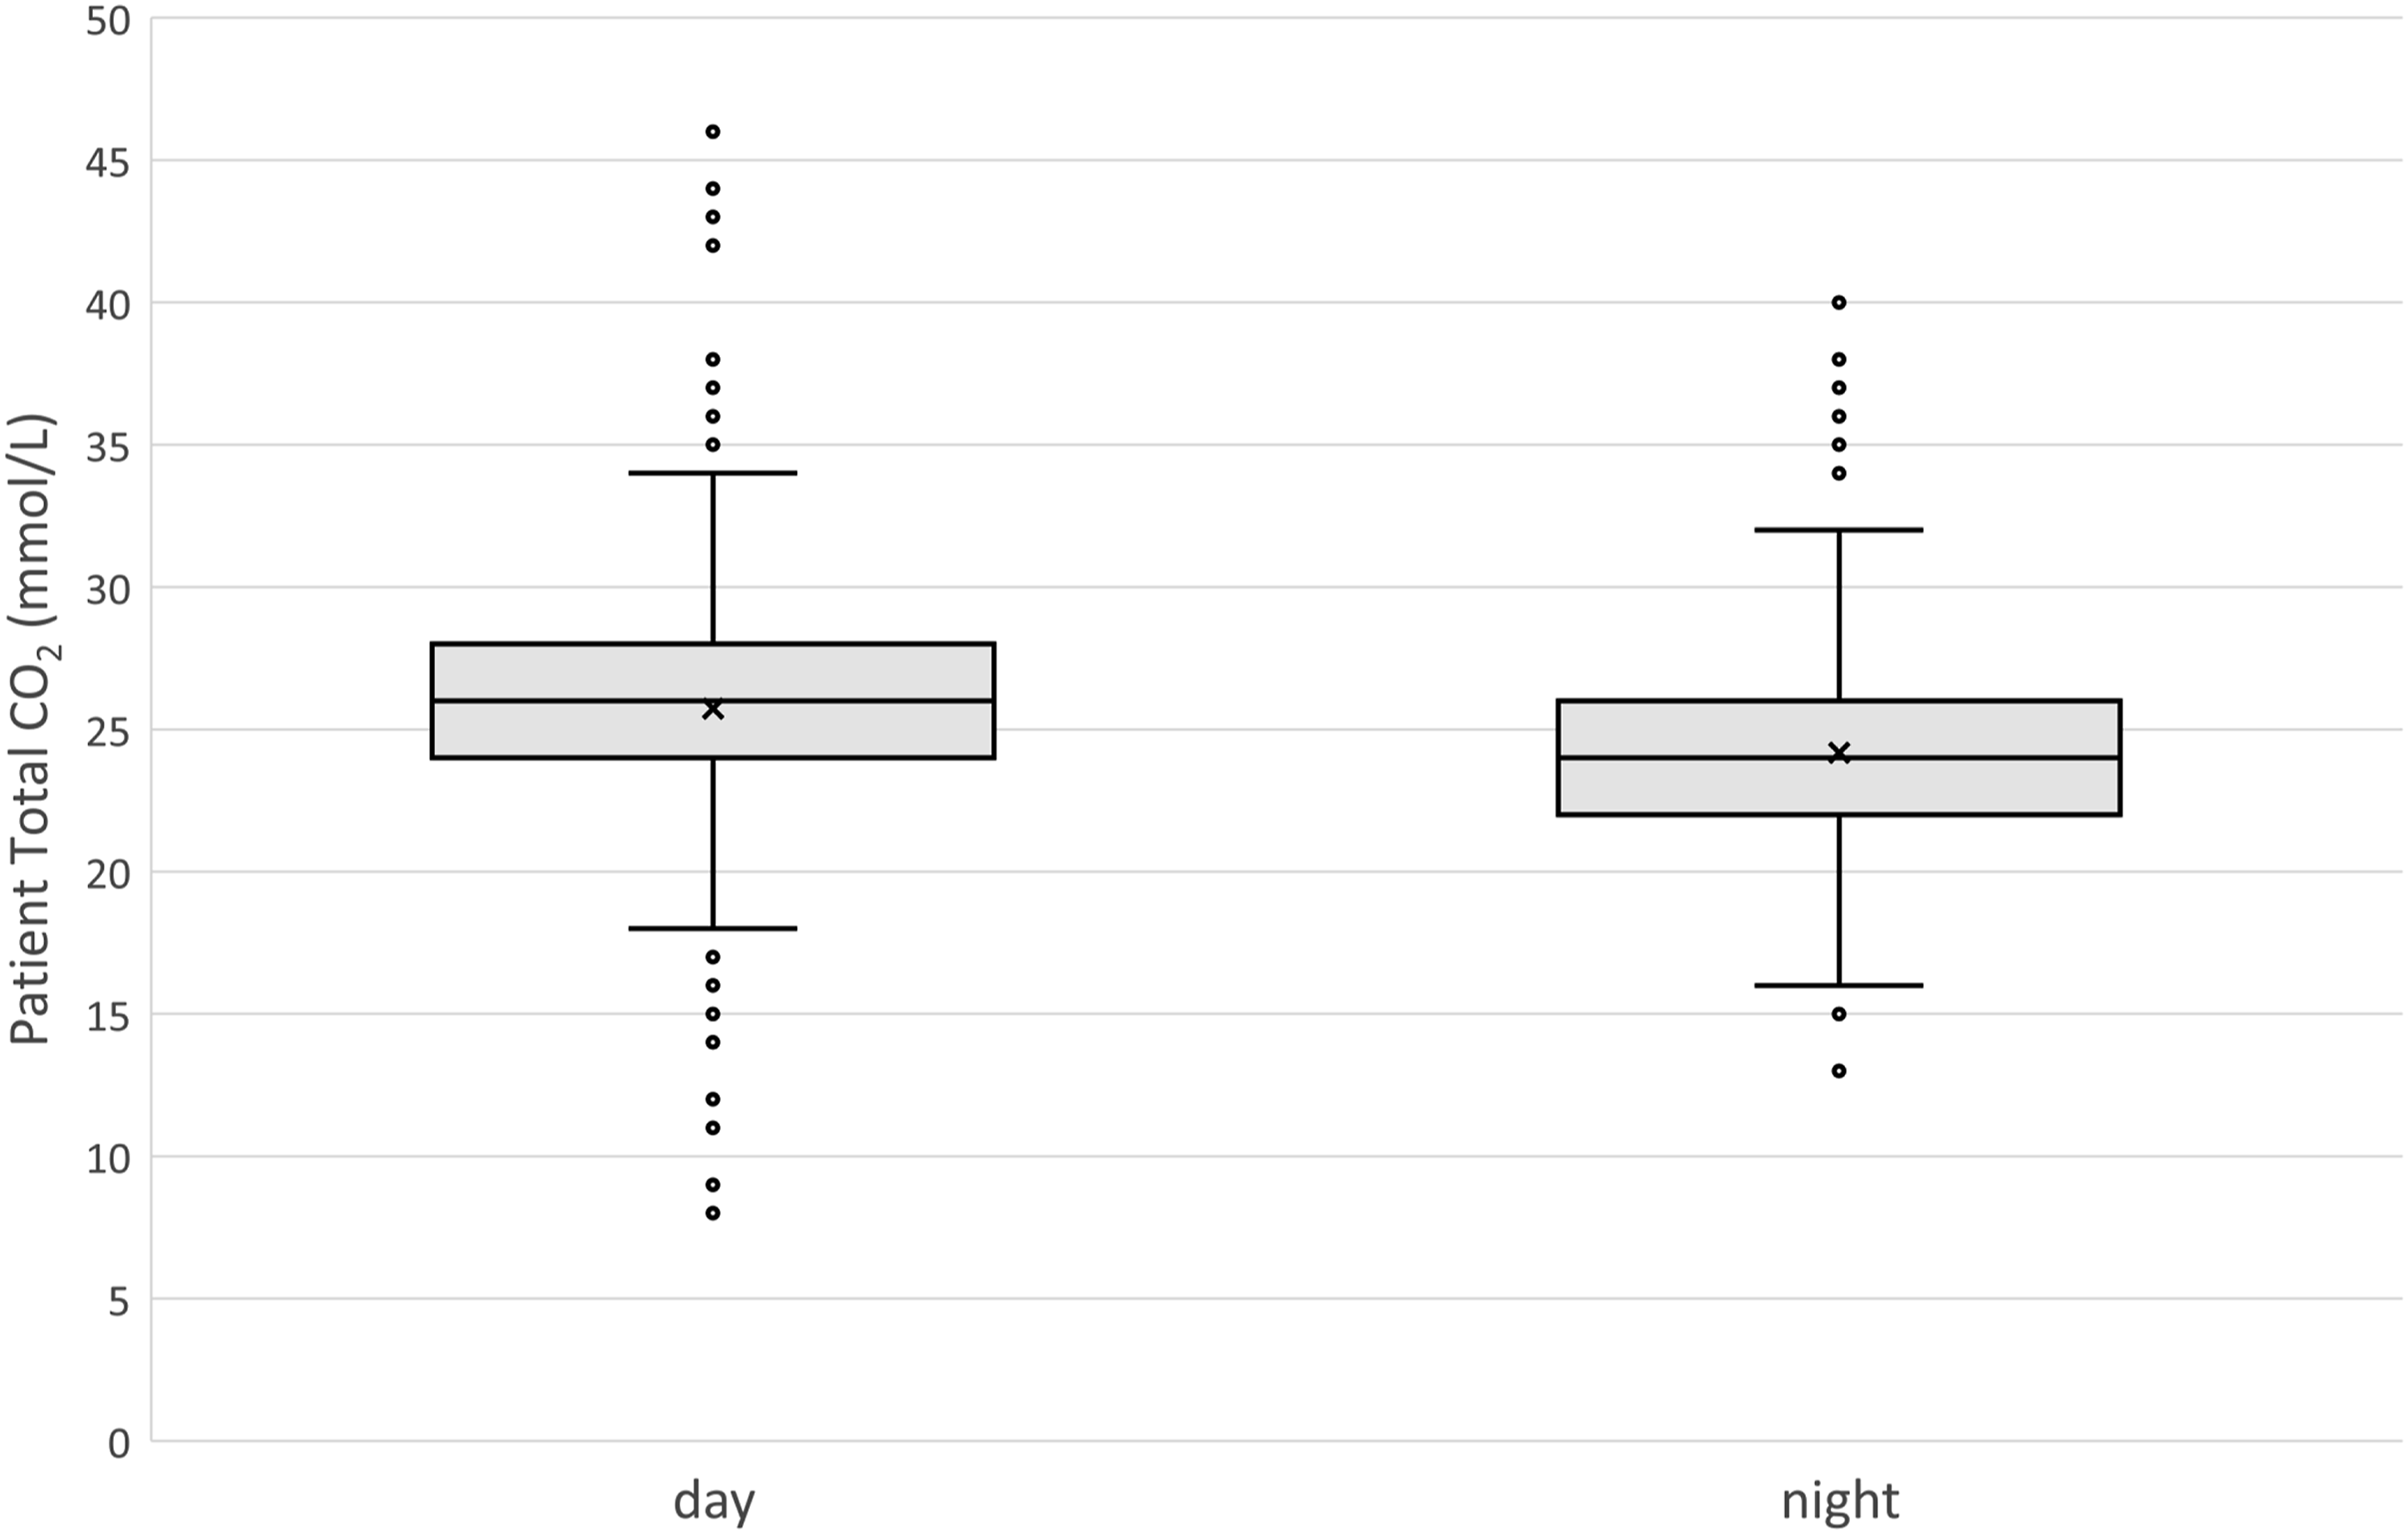
Effect of implementations on the precision of the assay
Boxplots in Figure 5 represent the QC measurements during both baseline scenarios, and after implementation of passive ventilation and the closing of the lids. Tables 1 and 2 represent summarising data, including SD, number of instable measurements and the number of QC points acquired. Boxplots representing of the low (up) and high (down) QC levels assayed on the analysers in the laboratory with high variance, compared to the stable analyser at the reference laboratory. The lower variance, and lower values for the QC of the reference analyser are related to the adequate, active ventilation infrastructure. Summary of the lower level QC material for total CO2 (target 17.8 mmol/L). Summary of the higher level QC material for total CO2 (target 34.7 mmol/L).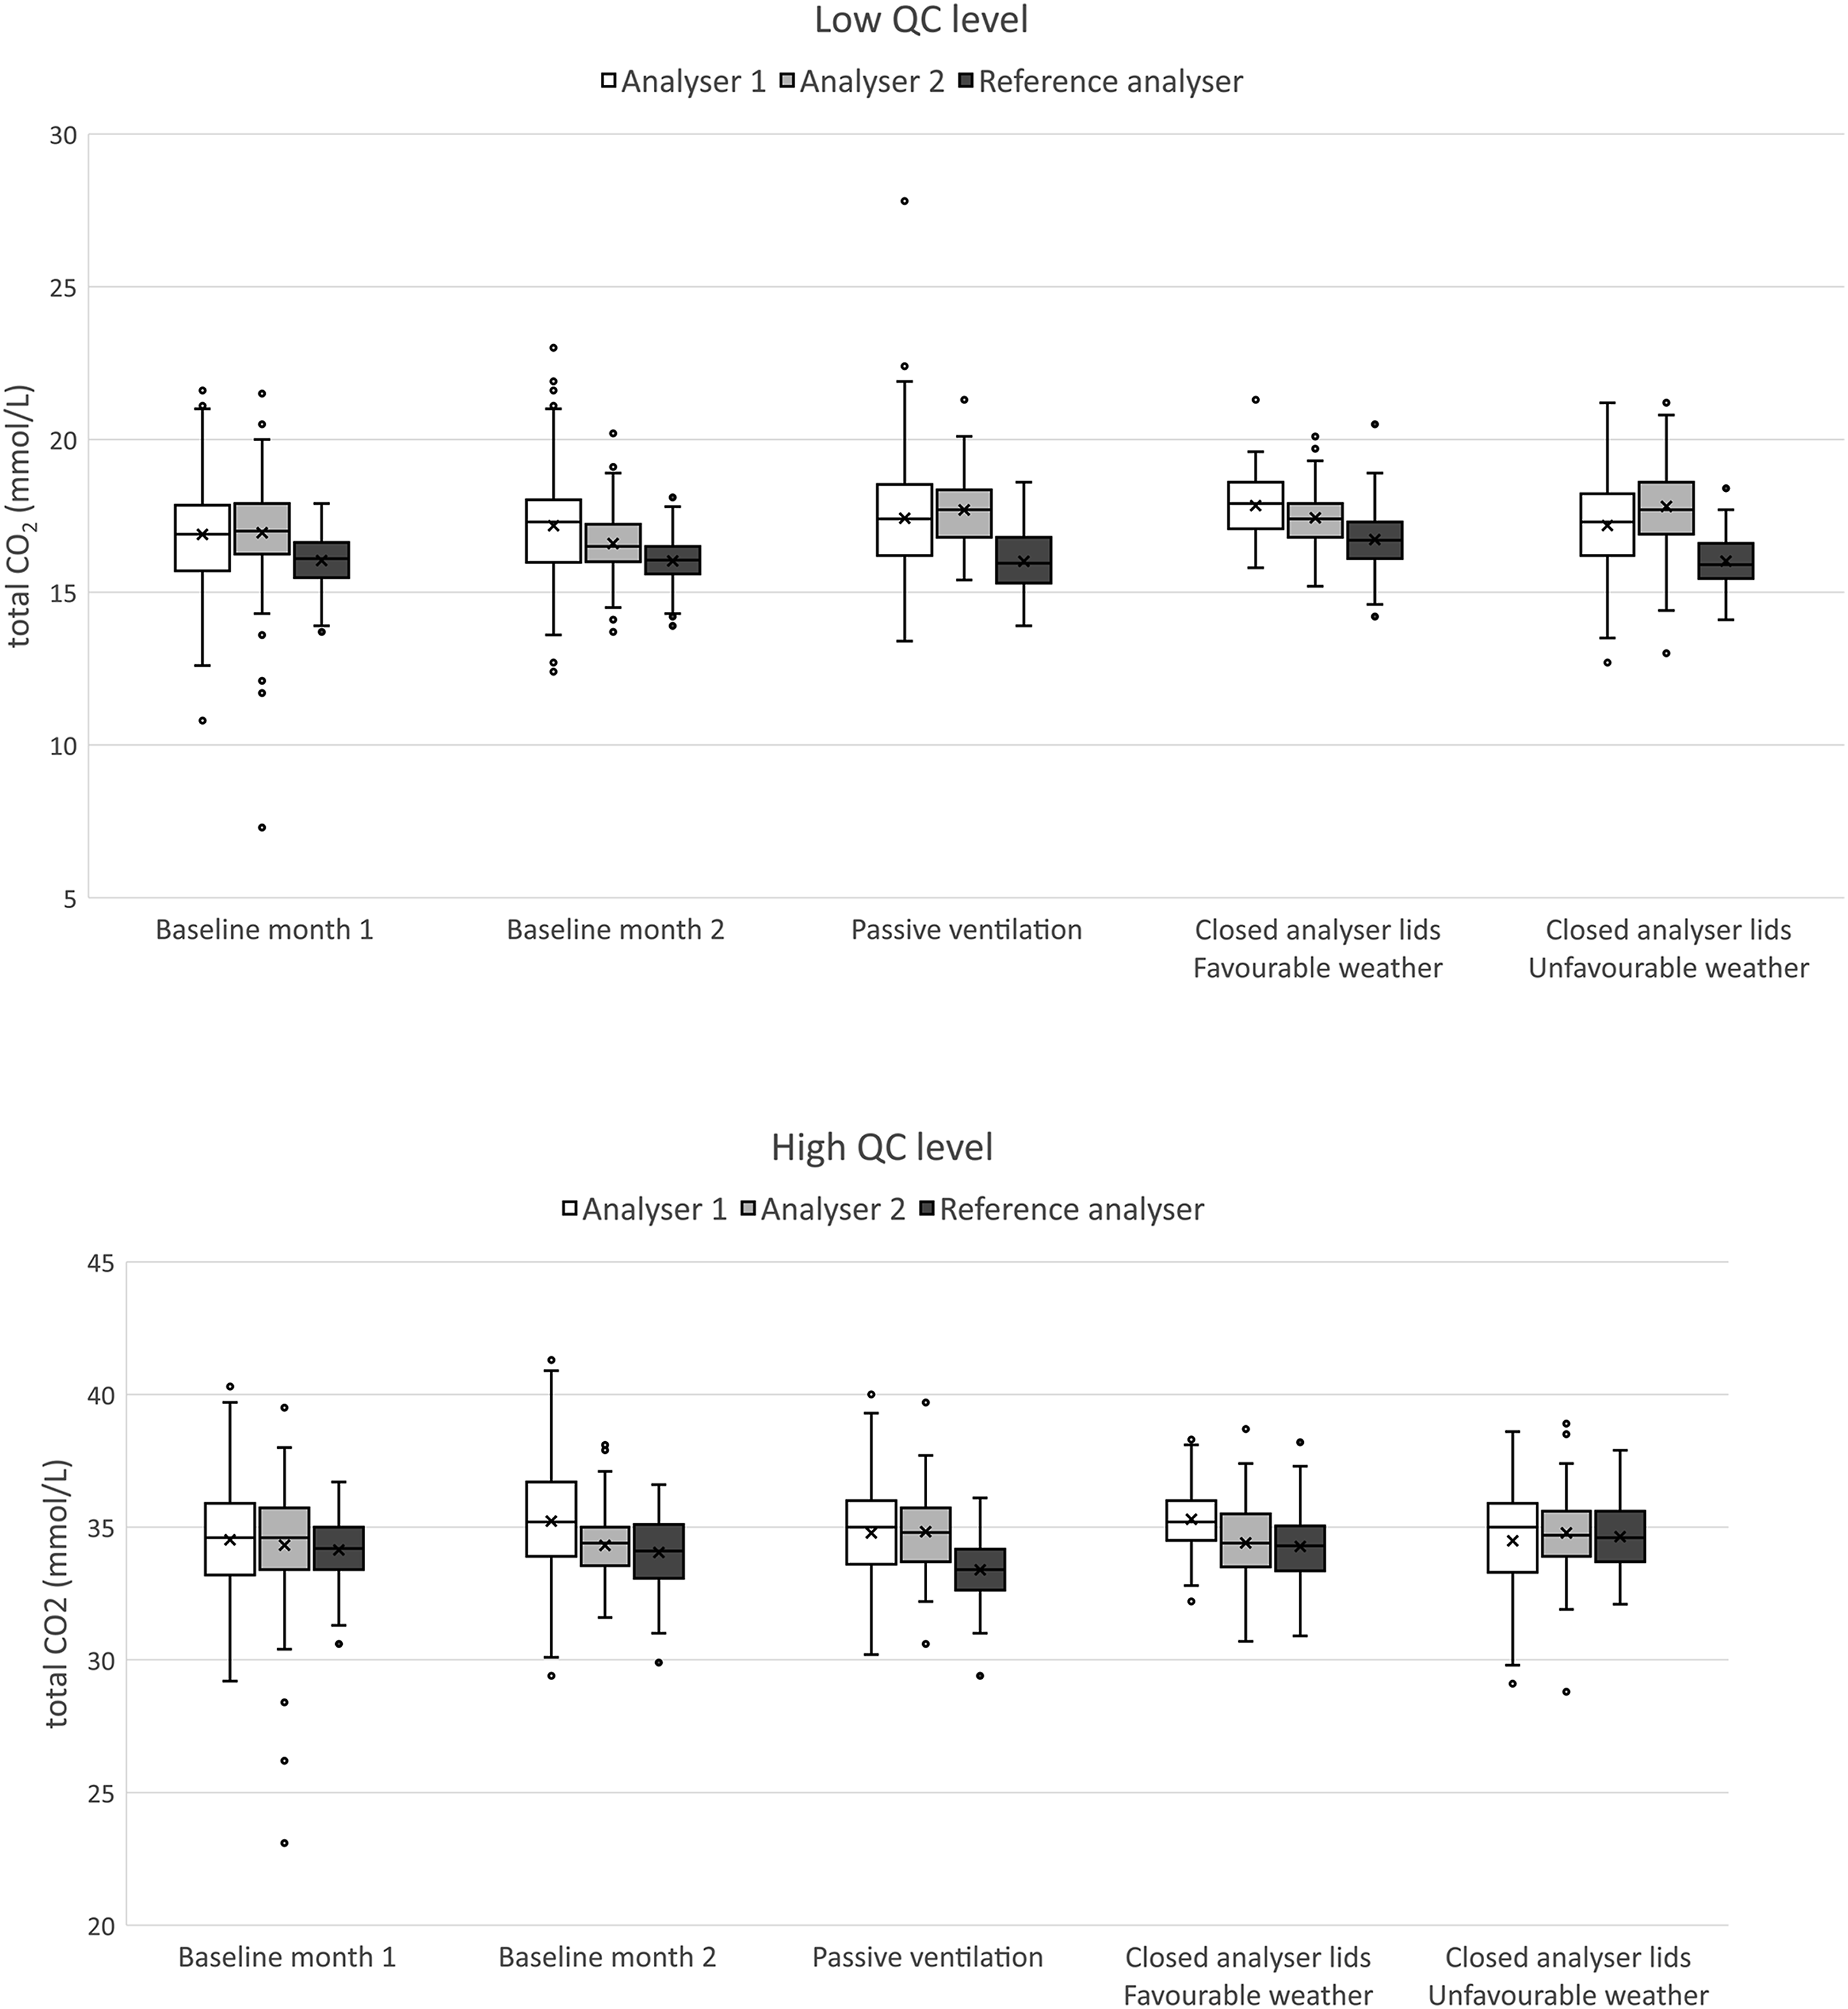
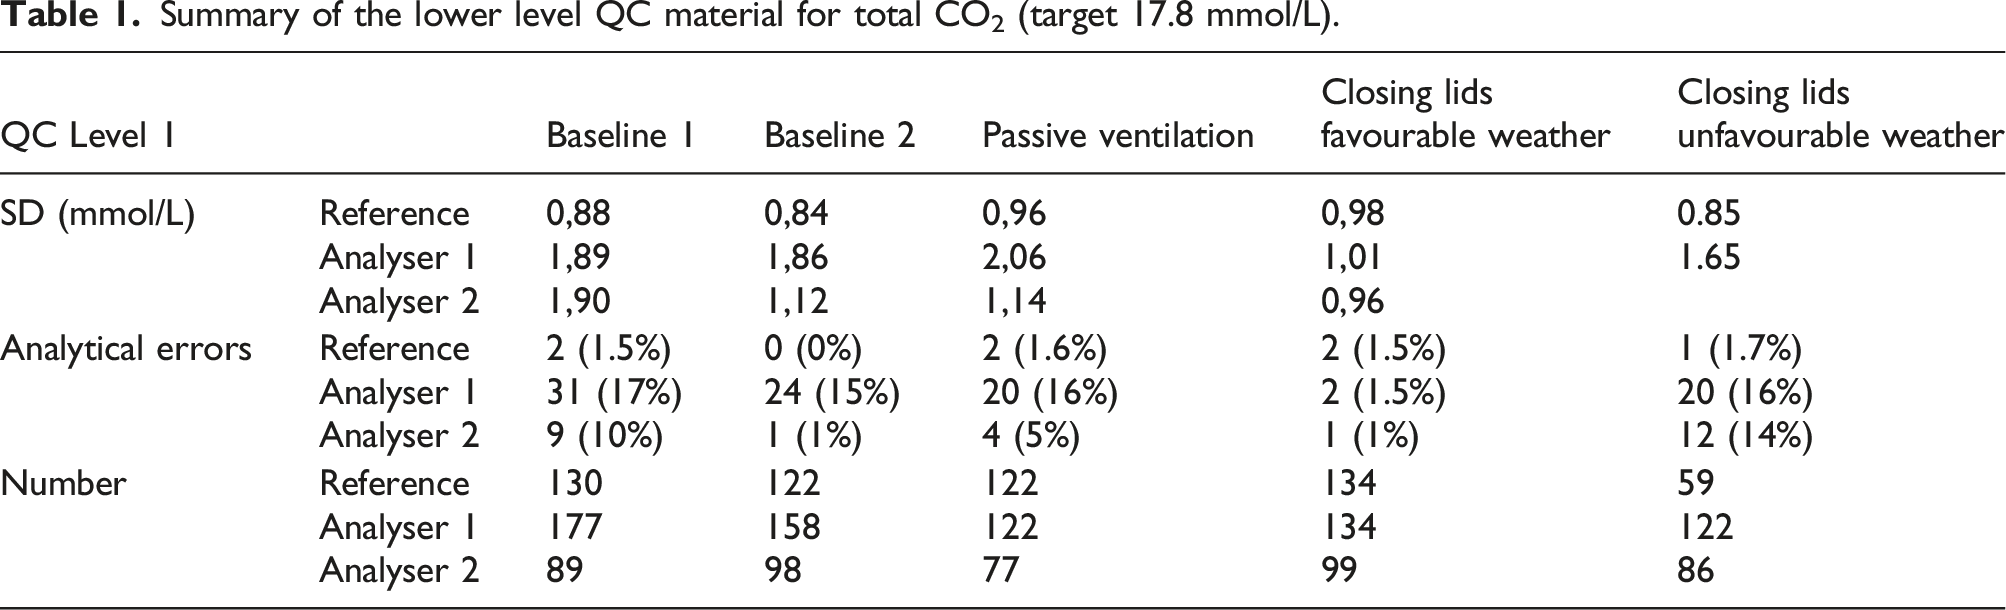
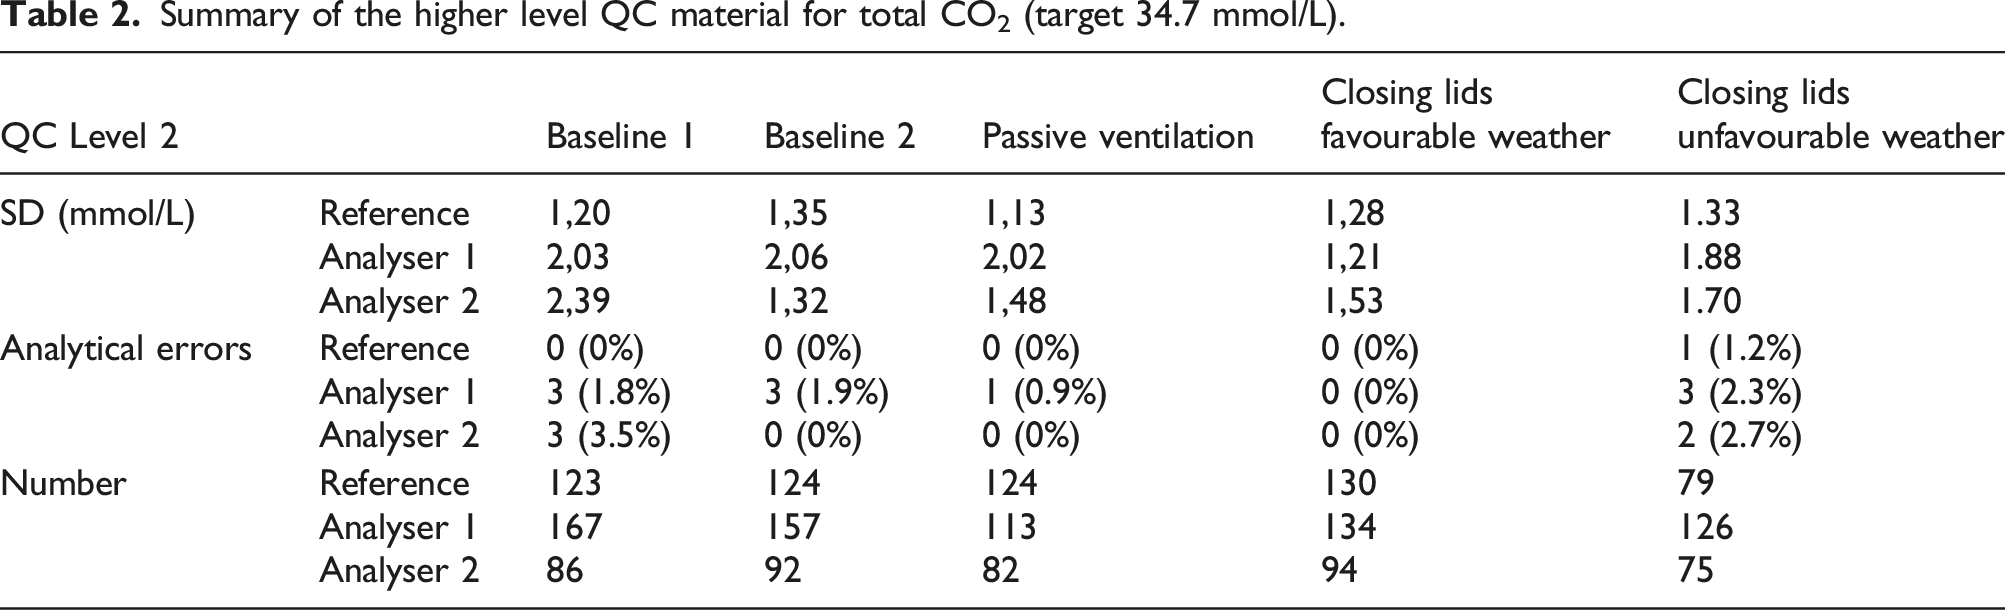
Based on the Levene’s test for variance testing, the scenario with favourable weather conditions and additional closing of analyser lids showed a significant beneficial effect on assay stability on analyser 1 for both high and low concentration QC materials (p < 0.0001, N 694 and 722, respectively, post-hoc F test < 0.001 for all comparisons). The number of inacceptable measurements decreased from ca. 20 episodes/month to 2 episodes/month (chi-square p = 0.002; N 727), no effect was noticed on the higher QC-concentration (chi-square p = 0.5). Closing the analyser lid, but with similar weather conditions as the baseline improved stability, but not significantly (p = 0.05 against baseline 1 and p = 0.08 against baseline 2) unless in comparison to the scenario of passive ventilation (p < 0.001). Similar trends were noticeable for the high QC material, but the results were not significant. Passive ventilation by opening ventilation grids did introduce a non-significant, higher variance in comparison to the baseline scenario (p = 0.14 and p = 0.11, respectively).
Variance on analyser 2 was especially higher during baseline 1 and unfavourable weather conditions (Levene’s test p < 0.001 and p = 0.06 for both low and high concentration QC, respectively, N 432 and 449, respectively; all post-hoc F tests p < 0.001). Closing analyser lids did improve on the lower concentration QC material, but did only reach significance against baseline 1 (post-hoc F test comparisons of closing analyser lid p < 0.001 against baseline 1, p = 0.08 against baseline 2 and p = 0.06 against passive ventilation). No significant effects were observed for the high QC material. The number of inacceptable measurements was only significantly higher during baseline 1 and unfavourable weather conditions (chi-square p < 0.001, N 449)
During the experiments, the reference analyser did not show any significant differences, indicating no impact of reagents and/or QC materials during the course of the experiment.
Discussion
The total CO2 assay applied in routine analysis was subjective to unacceptable variation, leading to frequent QC errors and subsequent actions. Frequent calibration could lead to overcompensation. When calibrating in an environment with high atmospheric CO2, the assay would underestimate the true total CO2 concentration in a sample during episodes with low atmospheric CO2, and vice versa.
Atmospheric CO2 values were higher during daytime in weekdays. This can be related to the higher personnel occupation during day shifts, as each lab member exhales CO2. Subsequently, the atmospheric CO2 could rise in poorly ventilated areas. The partitioning equilibrium between the atmospheric CO2 and the dissolved pCO2 in both serum and QC samples hence affect the total CO2 within the sample. The high total CO2 load in human samples equilibrates with the environment upon contact with the atmosphere containing lower CO2 concentrations. Consequently, total CO2 concentrations in a sample can drop significantly within as less as 4 h. 3 Probably, the presence of high concentrations in the environment slows down this diffusion gradient.
Chung et al. observed reagent instability by CO2 diffusion within reagent cassettes. The effect was reported to be related to the thorough homogenisation of the reagents, which resulted in an increased dissolution of CO2 in the reagent mixture and consecutively caused reagent degradation. 5
Fluctuations in atmospheric levels hence have an impact on the measured total CO2 in a sample. This effect is more noticeable in concentration with lower total CO2 concentrations. Considering the high gradient from total CO2 in the sample towards the environment, the amount of atmospheric CO2 could impact the speed on which the total CO2 evaporates from the QC sample. This would especially be noticeable on smaller volumes, such as the QC material dispensed in small cups. The implementation of closed containers (sealed lids) can be a valuable intervention to reduce QC variance. However, this might partially disrupt the commutability of the QC material to patient samples that are exposed to the environmental variation.
The effect was also noticeable on patient samples. The median patient difference between day and night shifts was 2 mmol/L, or ± 8.7%. Although the difference alone did not exceed the error limits, it does contribute to the total variance of the analytical system, increasing the risk of medically relevant errors. It has to be mentioned that underlying sampling bias might have been present, as the population characteristics during day shifts may have been different from night shifts. Paired analysis of samples was however not a possibility due to the instability of the parameter.
The rationale of an improved ventilation lies in reducing the variance of the atmospheric CO2, creating a stable environment. However, a reduced variance was not observed in the scenario of passive ventilation, as the infrastructure was inefficient to reduce atmospheric CO2 levels (and variation) to a minimum. It was possible that improper ventilation increased variance because it could not efficiently reduce peak concentrations, but did decrease through concentrations, actually increasing the range in atmospheric CO2 concentrations. The presence of wind (wind speed >1.5 m/s) from a favourable direction (south, south-west or west), in which the lab is exposed to the wind, created a draft in less isolated areas, increasing passive ventilation efficiency.
In poorly ventilated laboratories, ventilation can be improved by an appropriate ventilation system, increasing and optimising air flow. A case intervention showed the beneficial effect of improved ventilation on the CO2 QC measurement, which dropped from 22.3 mmol/L (5 SD) to 19.9 mmol/L (2.8 SD) (Data not shown). However, implementing thorough ventilation infrastructure, as in the reference laboratory, is the optimal choice to limit the amplitude of the CO2 fluctuations.
Closing analyser lids had a beneficial effect, especially on analyser 1. The precision of the assay could improve from 10% CV to 5% CV for the lower QC-value. Also the number of unstable episodes dropped significantly. Despite the rudimentary, not-airtight, enclosure, the lids of the analyser do protect the reagent chamber from environmental drafts, keeping a stable environment in which the reactions occur. Systematically, closing analyser lids can be considered a good laboratory practice, protecting users from moving needles and preventing contamination of dust within the reagent chamber. According to the reported results, it also improves assay stability. Although this report only reflects the effects of bicarbonate, it cannot be excluded that this effect might also influence other air and/or light sensitive parameters. Despite the recommendations, routine lab personnel often did not close analyser lids in order to reduce frequent opening/closing of the analyser. An open lid facilitated an easy loading of reagents, calibrators and QC materials. Personnel was instructed and trained to prevent further unnecessary opening of the reagent chamber during analyser on-time. New-generation machines, in which the reagent chamber does not need to be opened to load reagents, calibrators or QC materials, solve this conflict between operator comfort and instrument protection.
Conclusion
Total CO2 is a clinical chemistry parameter prone to variation. High levels of atmospheric CO2, caused by poor ventilation and high personnel attendance, influence the dissolution of dissolved CO2 into the gaseous phase. An adequate ventilation infrastructure is of utmost importance for stable bicarbonate assessment. Additionally, to an active ventilation infrastructure, closing analyser lids can have a beneficial effect on parameter stability.
Supplemental Material
Supplemental Material - Quality control of total carbon dioxide (CO2) in serum or plasma using the Abbott Architect is affected by environmental pCO2 concentrations
Supplemental Material for Quality control of total carbon dioxide (CO2) in serum or plasma using the Abbott Architect is affected by environmental pCO2 concentrations by Matthias Cuykx, Mieke Develter, Jan Verschaeren, Dorien Leenaerts, Johan Willemse, Juul Boes in Annals of Clinical Biochemistry
Footnotes
Acknowledgements
All research is performed using internal funds of the department of Laboratory medicine of the AZ Turnhout (Turnhout, Belgium). All research is performed with funds of the department of Laboratory Medicine of the AZ Turnhout (Turnhout, Belgium).
Declaration of conflicting interests
The author(s) declared no potential conflicts of interest with respect to the research, authorship, and/or publication of this article.
Funding
The author(s) received no financial support for the research, authorship, and/or publication of this article.
Ethical approval
Ethical approval was granted through the Ethics committee of AZ Turnhout (OG192).
Guarantor
Juul Boes and Matthias Cuykx.
Contributorship
Matthias Cuykx: main author, experimental design, data acquisition, data analysis, manuscript author. - Mieke Develter: experimental design, data acquisition, data interpretation, revision of manuscript - Jan Verschaeren: data interpretation, data acquisition, revision of manuscript - Dorien Leenaerts: data analysis, data interpretation and revision of manuscript - Johan Willemse: revision of manuscript, language check - Juul Boes: principal investigator, revision of manuscript.
Supplemental material
Supplemental material for this article is available online.
References
Supplementary Material
Please find the following supplemental material available below.
For Open Access articles published under a Creative Commons License, all supplemental material carries the same license as the article it is associated with.
For non-Open Access articles published, all supplemental material carries a non-exclusive license, and permission requests for re-use of supplemental material or any part of supplemental material shall be sent directly to the copyright owner as specified in the copyright notice associated with the article.