
Abstract
Background
Vancomycin, norvancomycin, methotrexate, paclitaxel, and imatinib are five commonly used drugs which are all recommended to therapeutic drug monitoring in clinical settings. However, the blood concentration monitoring of these drugs and the interpretations of the test results are limited to some extent due to the differences of testing instruments and testing methods.
Methods
We established an ultra-performance liquid chromatography with tandem mass spectrometry (UPLC-MS/MS) method for simultaneous quantification of vancomycin, norvancomycin, methotrexate, paclitaxel, and imatinib in human plasma. The method was validated according to the guideline for bioanalytical method validation and applied in clinical therapy.
Results
The calibration ranges of vancomycin, norvancomycin, methotrexate, paclitaxel, and imatinib were 0.5–100 μg/mL, 0.5–100 μg/mL, 5–1000 ng/mL, 10–2000 ng/mL, and 5–500 ng/mL, respectively. Inaccuracy and imprecision of every drug were less than 15%. The internal standard normalized recovery rates of vancomycin and norvancomycin were about 45%, while which of methotrexate, paclitaxel, and imatinib were almost 100%. No obvious carryover effect was observed. Samples were stable for at least 24 h in the automatic sampler, 72 h at 4°C, and 1 week in −80°C. There were no differences of concentrations between plasma and serum for the five drugs. Moreover, there were positive correlations between methotrexate and vancomycin concentrations and creatinine, as well as positive correlation between imatinib concentration and age of the patient.
Conclusions
The UPLC-MS/MS method was competent for the simultaneous monitoring of vancomycin, norvancomycin, methotrexate, paclitaxel, and imatinib because of its short analysis time, high specificity, and accuracy.
Introduction
Therapeutic drug monitoring of vancomycin, norvancomycin, methotrexate, paclitaxel, and imatinib are commonly applied because these are the basis of individual drug administration and dose adjustment in clinical settings, especially in the hospitals specialized in antimicrobial and antitumor.
Vancomycin and norvancomycin, glycopeptide antibiotics, are first-line drugs for the treatment of methicillin-resistant Staphylococcus aureus (MRSA). Norvancomycin, demethylated vancomycin, has been in use for more than 20 years in China. The antibacterial spectrum, antibacterial activity, and adverse reactions of norvancomycin are similar to those of vancomycin. 1 Blood concentrations of vancomycin and norvancomycin vary greatly in different patients. Additionally, renal insufficiency can slow down the elimination of both drugs. Therefore, the monitoring of them is essential in clinical settings, especially for patients with renal dysfunction. 2 The reference ranges of blood steady trough concentrations of the vancomycin and norvancomycin are generally determined to be 10–20 μg/ml considering the effectiveness and nephrotoxicity.3,4 At present, the main methods for the detection of vancomycin are chemiluminescence immunoassay (CMIA) and enzyme multiplication immunoassay (EMIT). 5 However, there is no CMIA test kit for norvancomycin. High performance liquid chromatography (HPLC) method can be used to detect vancomycin and norvancomycin simultaneously, but the pretreatment is cumbersome. 6 Notably, the immunoassay results of vancomycin are higher than those of HPLC because of cross-immune response. 7
Methotrexate, an anti-metabolic drug, inhibits dihydrofolate reductase and blocks folic acid metabolism, thus affects the synthesis of DNA, and finally results in cancer cell death. The high dose of methotrexate is defined as more than 1 g/m2 which is widely used in acute lymphoblastic leukemia, lymphoma, and osteosarcoma. 8 Common adverse effects of high dose methotrexate include skin and mucosal injury, bone marrow suppression, and renal dysfunction. 9 Normal plasma concentration of methotrexate should be lower than 10 μmol/L at 24 h, 1.0 μmol/L at 48 h, and 0.1 μmol/L at 72 h after high dose administration, while higher blood concentration suggests liver or renal dysfunction, not excluding irreversible organ damage if the blood concentration could not be reduced to lower than 0.1 μmol/L. 8 Moreover, it is recommended that the rescue dose of calcium folinate should be adjusted according to methotrexate blood concentration. 9 Currently, there are two kinds of methotrexate immunoanalysis methods, EMIT and fluorescent polarization immunoanalysis (FPIA). 10 However, the lowest limit of quantitation (LLOQ) of EMIT is 0.3 μmol/L which is higher than the reference value at 72 h after methotrexate administration. Additionally, the results of FPIA are higher than HPLC because of cross-immune response. On the other hand, despite HPLC is more sensitive and accurate, the use of ceftretrasone, acosonosine, and other drugs that overlap methotrexate absorption peak, as well as tedious pretreatment, restricts the application of HPLC in monitoring methotrexate blood concentration. 11
Paclitaxel is one of the microtubule-stabilizing drugs for the treatment of breast, ovarian, and lung cancer. There is positive correlation between efficacy, as well as toxic reactions, with paclitaxel blood exposure. It is noteworthy that the drug exposure is highly variable among patients and themselves. 12 A nonlinear pharmacokinetic study showed that the maintenance time of paclitaxel plasma concentration above 0.05 μmol/L was a more reliable parameter for efficacy and adverse consequences. 13 The main methods for the detection of paclitaxel are time-resolved immunofluorescence and HPLC. 14 Currently, albumin paclitaxel is more common in clinical application than paclitaxel injection, but there is no reference interval of blood drug concentration for albumin paclitaxel.
Imatinib is a kind of protease inhibitor and is used in the treatment of gastrointestinal stromal tumors and chronic myeloid leukemia. The blood concentration of imatinib is closely related to the drug reaction and the clinical benefit of the patients. It was reported that the effective plasma trough concentration was more than 1000 ng/mL in the treatment of chronic myeloid leukemia, while which was higher than 1100 ng/mL in the treatment of gastrointestinal stromal tumors.15,16 However, the effective concentration range of imatinib is not definite at present. Polymorphisms in genes encoding metabolic enzymes and transporters between different races and individuals lead to differences in imatinib metabolic levels, resulting in different concentrations of imatinib in different individuals. 17 The combination of drugs, such as rifampicin and warfarin, can also affect the blood concentration of imatinib. 18 At present, the main detection of imatinib blood concentration is liquid chromatography with tandem mass spectrometry (LC-MS/MS).
Collectively, we think that LC-MS/MS is the most appropriate method for concentration detection of the five drugs due to its high sensitivity, simple pretreatment, and few interference factors. Since the five drugs belong to antimicrobial and antitumor drugs, respectively, they are usually divided into different detection conditions, and consequently the detection efficiency is reduced. Therefore, this study established an UPLC-MS/MS method for simultaneous concentration quantification of the five drugs.
Materials and methods
Reagents and instrument
Methotrexate (100138-201104, 99.4%), norvancomycin (130338-201704, 87.7%), paclitaxel (130382-201603, 99.9%), imatinib methyl sulfonate (420020-201702, 99.3%), and tinidazole (100336-200703, 99.8%) were purchased from China Food and Drug Research Institute (Beijing, China). Vancomycin (DRE-C1790050, 96.5%) was purchased from LGC Lobor GmbH (Berlin, Germany). Ultrapure water was purchased from Watsons (Guangzhou, China). Chromatographic pure methanol and formic acid were purchased from Thermo Fisher Scientific Company (Waltham, USA).
Ultra-performance liquid chromatography with Triple Quad 4500 Mass Spectrometry System (AB SCIEX, CA, USA) was used for detection. Data were acquired and processed by the analyst software attached to the instrument.
Preparation of stock and work solutions
Stock solutions and work solutions were prepared with 50% methanol. Stock solutions of vancomycin, norvancomycin, methotrexate, paclitaxel, and imatinib were 4000 μg/mL, 4000 μg/mL, 200 μg/mL, 200 μg/L, and 200 μg/L, respectively. Work solutions of vancomycin, norvancomycin, methotrexate, paclitaxel, and imatinib were 4000 μg/mL, 4000 μg/mL, 40 μg/mL, 80 μg/mL, and 20 μg/mL, respectively. All stocks and working solutions were stored at −20°C for no more than 1 month. 100 ng/mL tinidazole was prepared with methanol as internal standard (IS). The calibration and quality control (QC) samples were prepared separately. Calibration and QC samples were prepared by work solutions, and please refer to Supplemental Table S1 if necessary.
Sample preparation
Blood was collected into EDTA anticoagulant vessel and centrifuged at 4°C, 3000 rpm for 10 minutes to separate plasma.
Samples were prepared as follows: ① Double blank sample: 90 μL blank plasma, 10 μL 50% methanol, and 500 μL methanol. ② Blank sample: 90 μL blank plasma, 10 μL 50% methanol, and 500 μL IS. ③ Calibration sample: 90 μL blank plasma, 10 μL calibration solution, and 500 μL IS. ④ QC sample: 90 μL blank plasma, 10 μL QC solution, and 500 μL IS. ⑤ Patient plasma sample: 100 μL plasma and 500 μL IS.
Sample was mixed and shaken for 3 minutes, and then centrifuged for 5 minutes at 12000 rpm. Next, 50 μL supernatant was separated, added into 200 μL water, mixed and shaken for 1 min, and centrifuged for 3 minutes at 12000 rpm. Finally, 200 μL supernatant was separated, and 3 μL of the supernatant was injected for analysis.
LC and MS conditions
Water with 0.2% formic acid (A) and methanol (B) was used for sample separation on a Kinetex C18 column (Phenomenex, 2.1 × 50 mm, 1.7 μm particle size) at a flow rate of 0.25 mL/min in a run time of 5.0 min under gradient elution as follows: initial, 10% B; 0–0.5 min, 10% B-40% B; 0.5–1.0 min, 40% B-90% B; 1.0–3.0 min, 90% B; 3.0–3.5 min, 90% B-10% B; 3.5–5.0 min, 10% B. The autosampler and the column oven were set at 20°C and 40°C, respectively.
MS/MS conditions of analytes and IS.
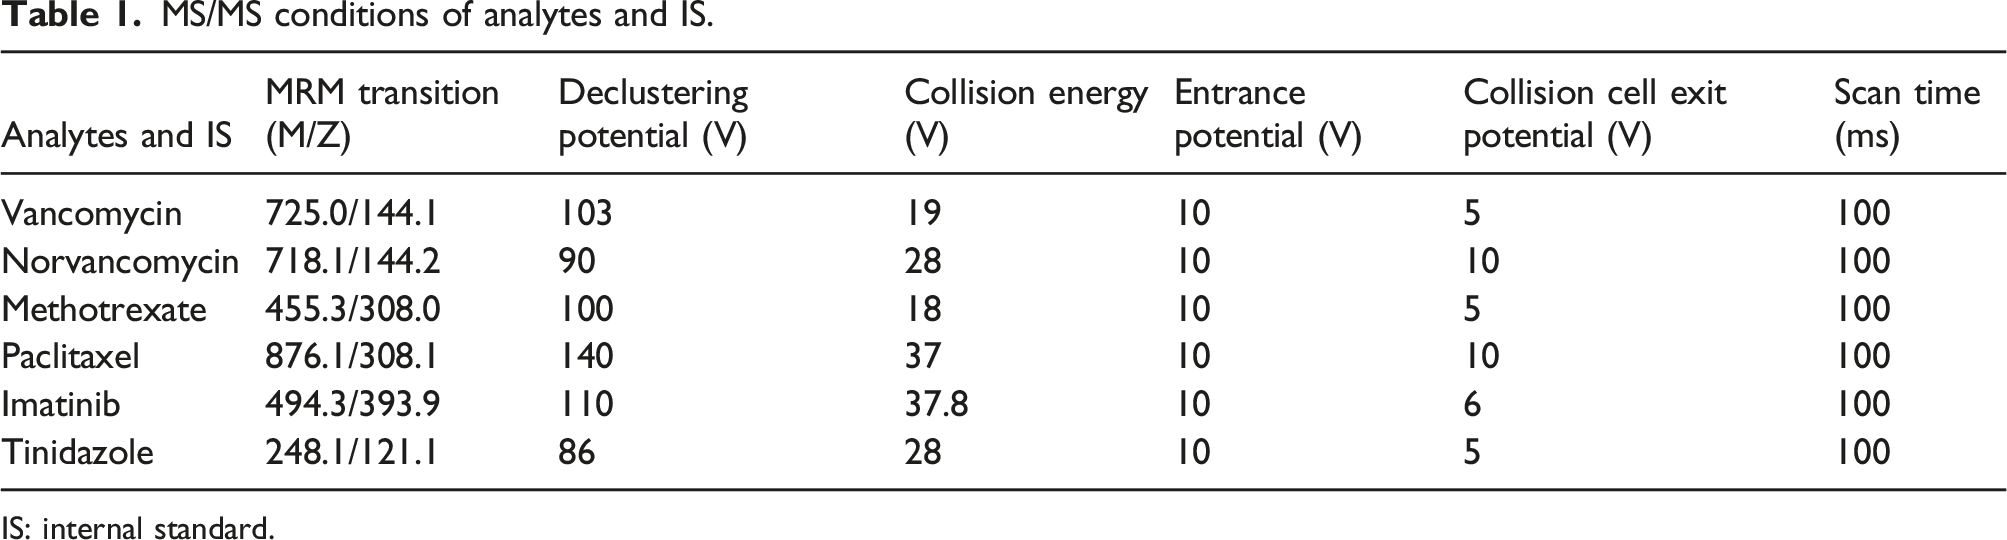
IS: internal standard.
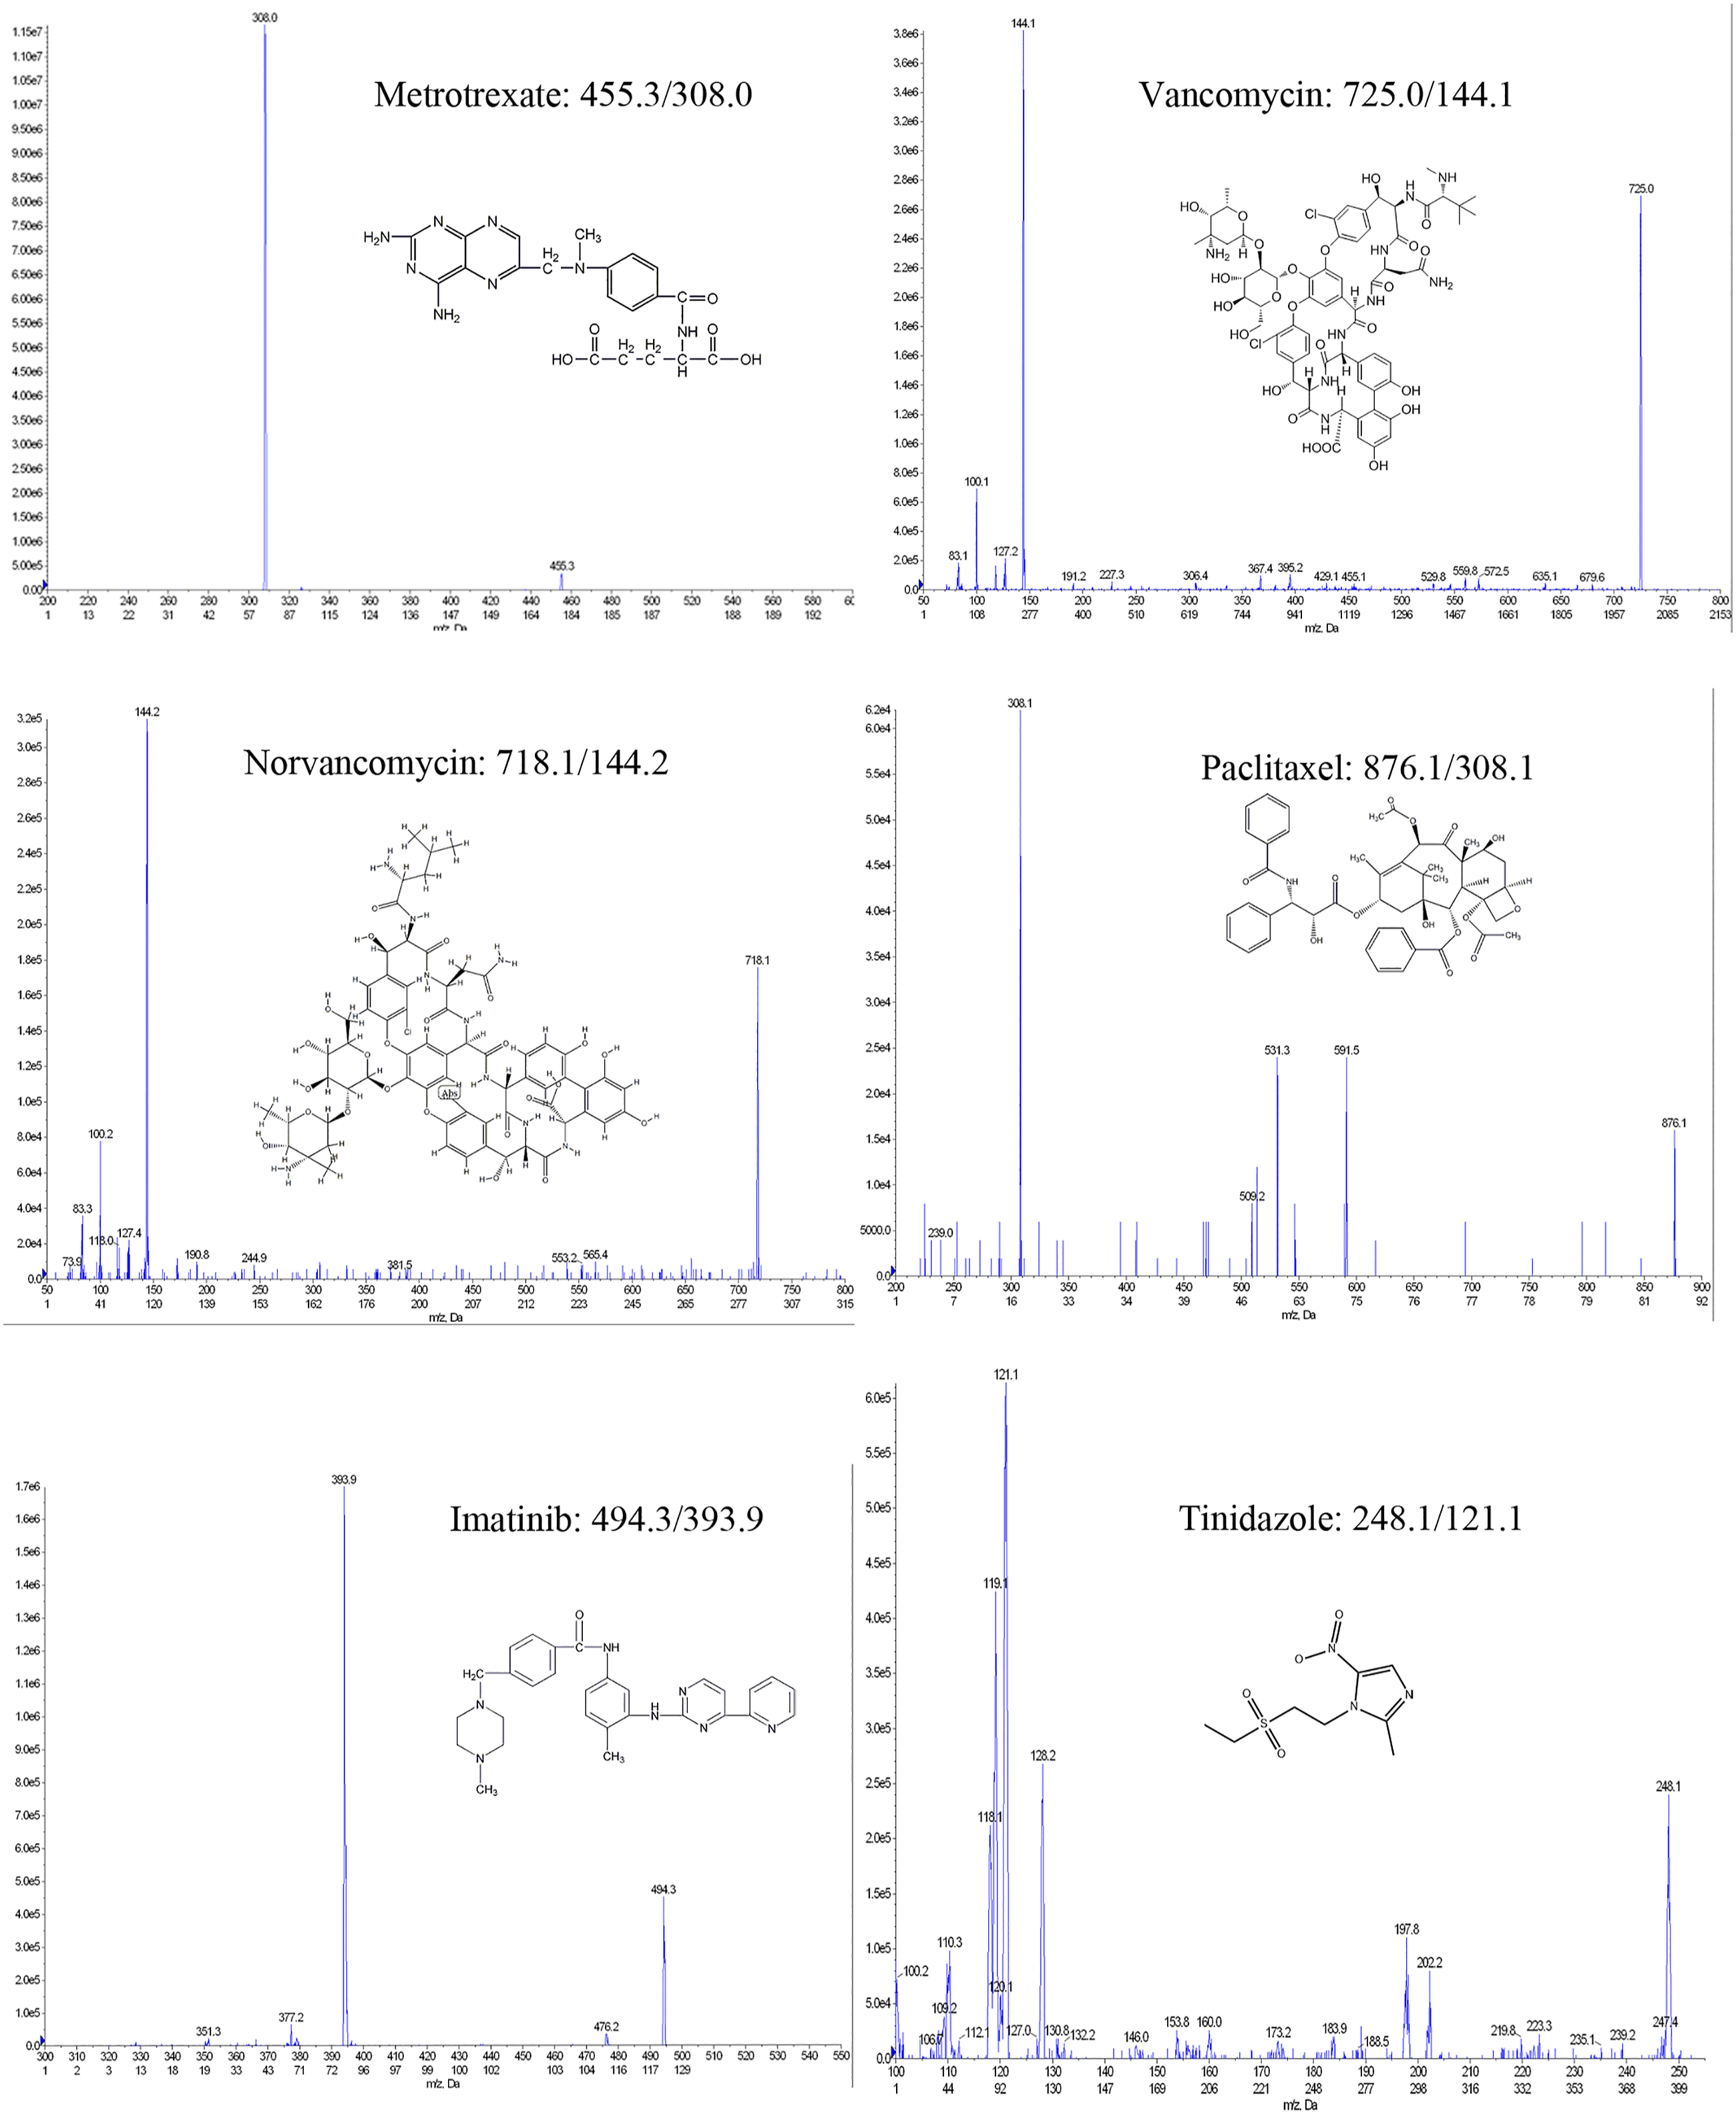
MS/MS conditions.
Method validation
The method was validated according to the guideline for bioanalytical method validation.19,20 Selectivity, LLOQ, linearity, carryover effect, inaccuracy, imprecision, recovery, matrix effect, dilution integrity, and stability were evaluated as follows.
Calibration curves
Calibration standards were prepared in free plasma with different concentrations. Vancomycin and norvancomycin: 0.5, 1, 2, 5, 10, 20, 50, and 100 μg/mL. Methotrexate: 5, 10, 20, 50, 100, 200, 500, and 1000 ng/mL. Paclitaxel: 10, 20, 40, 100, 200, 400, 1000, and 2000 ng/mL. Imatinib: 5, 10, 20, 50, 100, 200, and 500 ng/mL. QC standards were also prepared in free plasma. Vancomycin and norvancomycin: 0.8, 8, and 80 μg/mL. Methotrexate: 8, 80, and 800 ng/mL. Paclitaxel: 16, 160, and 1600 ng/mL. Imatinib: 8, 40, and 400 ng/mL. Quadratic calibration curves were based on peak area ratios of the analytes relative to corresponding IS using weighted (1/x2) regression, excluding the origin. The acceptance criteria for the back-calculated concentrations were set to 100% ± 15%, and the coefficient of determination (R) should be >0.99.
Limit of detection and lowest limit of quantitation
Selectivity was tested by using vancomycin, norvancomycin, methotrexate, paclitaxel, imatinib, tinidazole, and blank plasma from six individuals. For limit of detection (LOD) sample, signal-to-noise (S/N) was ≥3. The LLOQ was the lowest concentration of the calibration curve, and the interfering peak area should be less than 20% of the peak area of the analyte in the LLOQ sample.
Inaccuracy and imprecision
Within-assay imprecision was determined by analysis of five replicates of three QC concentration levels and LLOQ in a single assay. Between-assay imprecision was determined by analysis of one replicate of QC and LLOQ among 5 days. For QC, the relative error should be less than ± 15%, while the coefficient variation (CV) should also be less than 15%. For LLOQ, the relative error should be less than ± 20%, and the CV should also be less than 20%.
Extraction recovery and matrix effect
Extraction recovery was determined with six replicates for each QC concentration. For matrix effect test, blank plasma was from six different individuals.
(A) Vancomycin, norvancomycin, methotrexate, paclitaxel, imatinib, and IS in blank plasma from six different individuals with protein precipitation, (B) all these compounds in post-protein precipitated blank plasma from six different individuals, and (C) all these compounds in methanol. The IS normalized recovery and matrix factor were defined as (A/B)/(AIS/BIS)×100% and (B/C)/(BIS/CIS)×100%, respectively. The IS normalized recovery at all QC levels should be consistent and precise, and the CV of IS normalized matrix factor should be less than 15%.
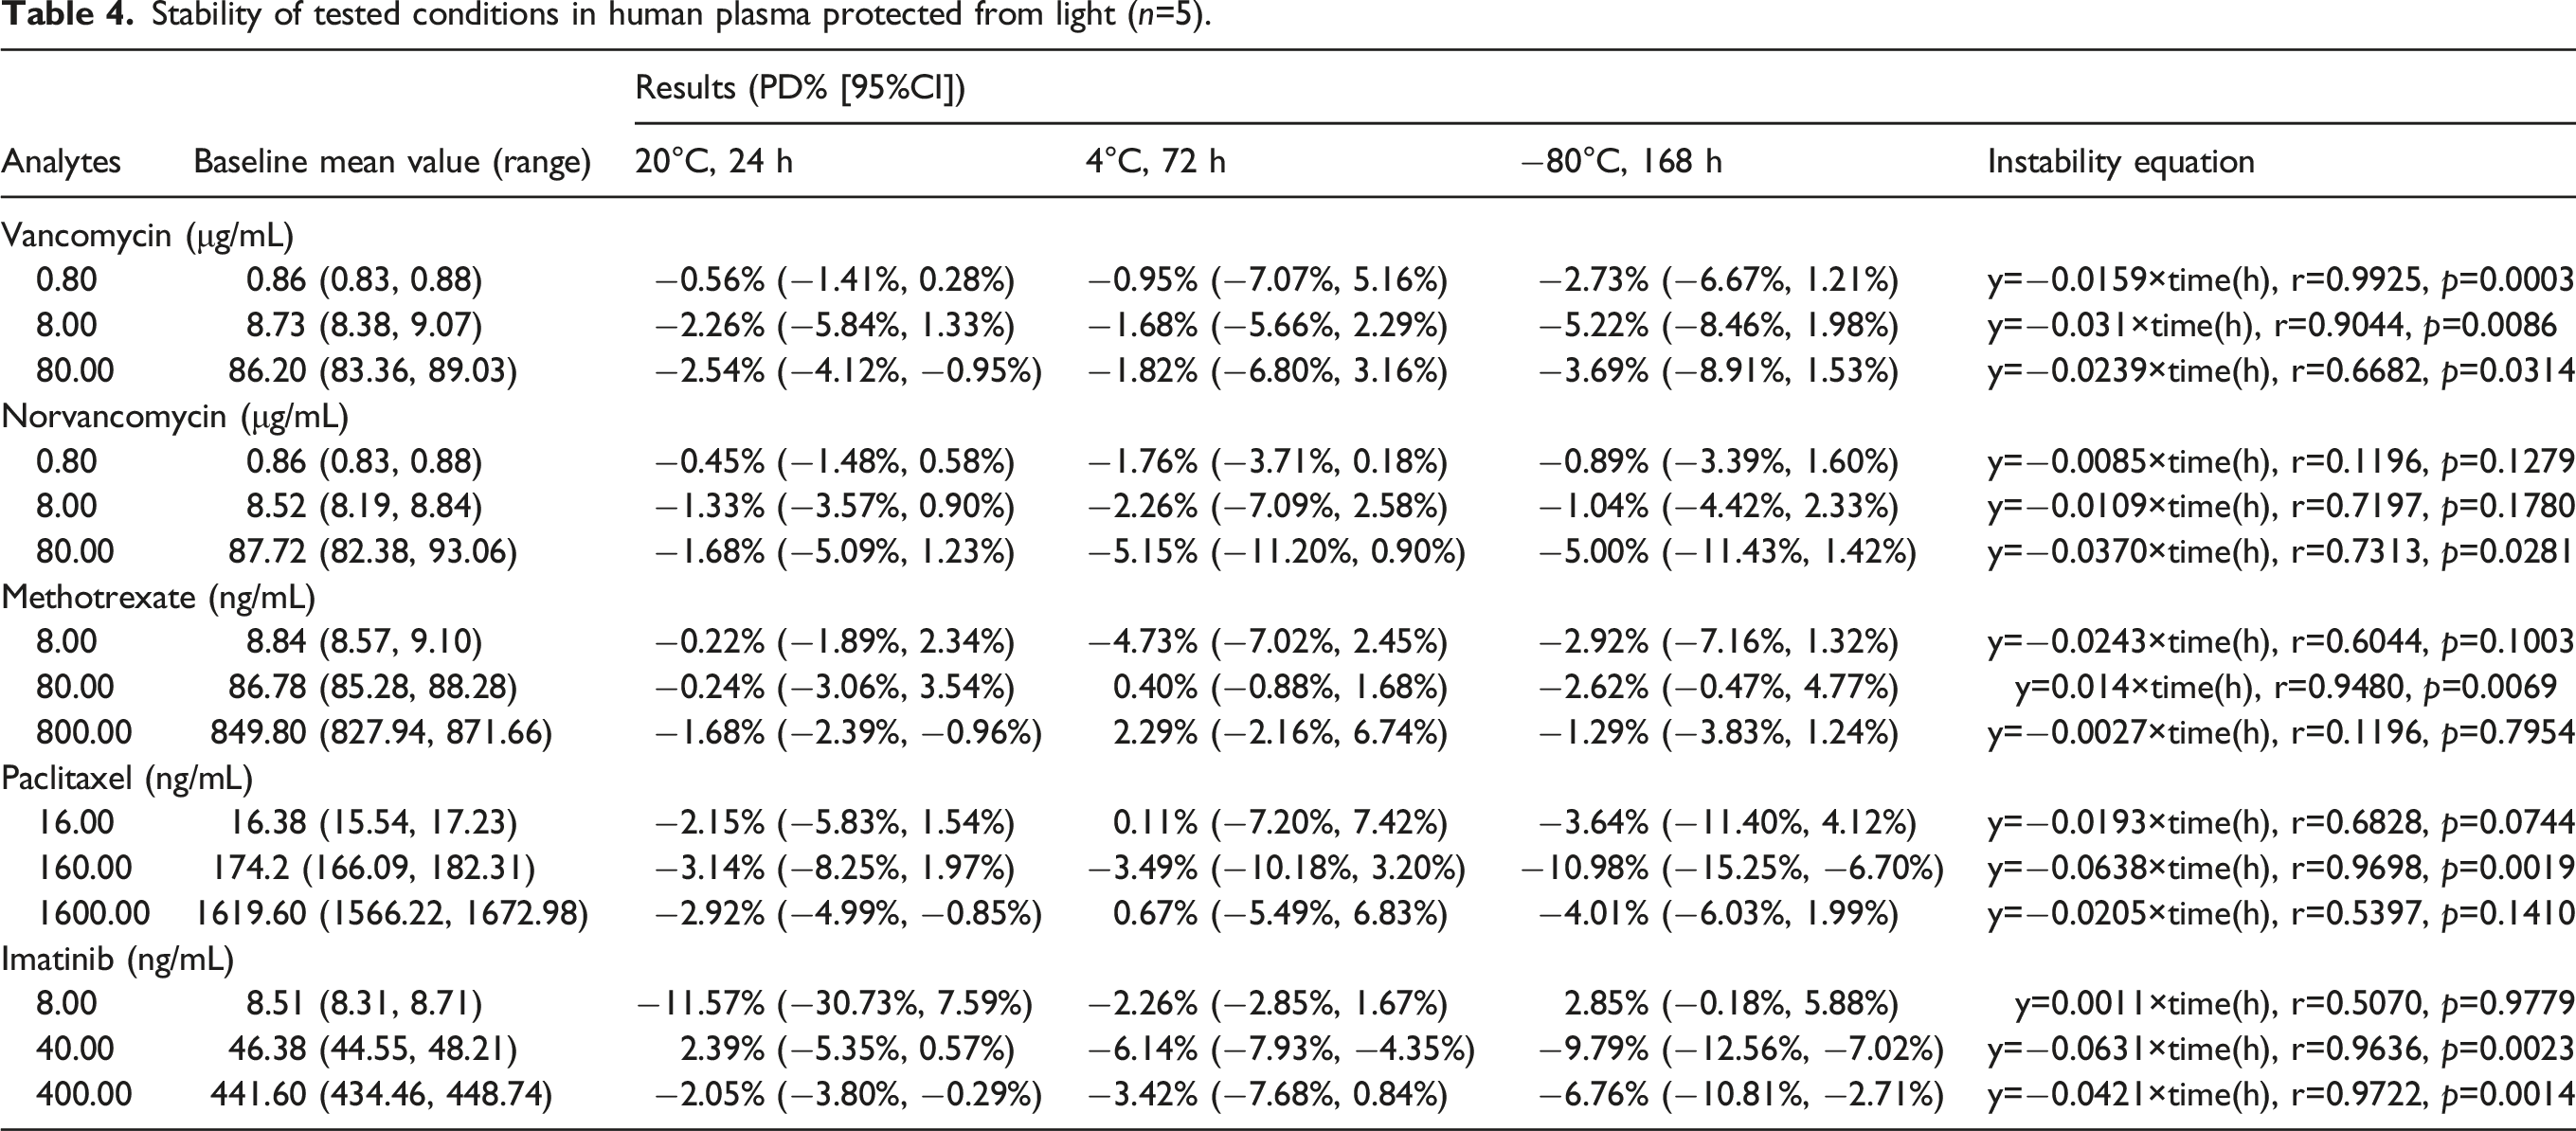
Stability
The stability studies of vancomycin, norvancomycin, methotrexate, paclitaxel, and imatinib were evaluated at different storage temperatures. The stability studies of QC samples were evaluated at 20°C at 24 h, 4°C at 72 h, and −80°C at 1 week. The storage conditions were considered as stable if the relative errors of QC samples were less than ± 15% compared with 0-hour value. The results were presented as the Checklist for Reporting Stability Studies (CRESS). 21
Dilution integrity and stability
Dilution was needed during clinical application. The acceptable inaccuracy and imprecision of the diluted samples were accepted if the relative deviations and CVs were less than ± 15%.
Method application
We used this method to detect vancomycin, norvancomycin, methotrexate, paclitaxel, and imatinib concentrations in patient plasma. The blood collection times were 24, 48, or 72 h after administration for methotrexate, 24 h after administration for albumin–paclitaxel, and 0.5 h before administration when the drugs reached steady state for vancomycin, norvancomycin, and imatinib, respectively.
On the other hand, blood samples used for methotrexate, vancomycin, and paclitaxel testing were serum and plasma samples during common clinical application in many medical institutions. Therefore, we investigated the concentrations of the five drugs between serum and plasma samples to elucidate whether the sample species affected the drug concentration results. Six cases were collected for each drug, and each patient’s peripheral blood was collected into anticoagulant tube and non-anticoagulant tube, respectively, and then serum and plasma were separated.
Statistical analysis
Results are presented as the mean ± standard deviation. All the experimental data were analyzed with GraphPad Prism 5.0 statistical software package (GraphPad Software, Inc., La Jolla, CA, USA). The chi-square test and Fisher’s exact test were used to analyze the correlation between different groups; paired T test was used to analyze the difference between groups. p < 0.05 was considered as statistical difference.
Results
Linearity, Limit of detection, and lowest limit of quantitation
Carryover effect was not observed during the verification experiment at the highest concentration of calibration sample. The typical linear regression equations were as follows. Vancomycin: y = 0.0172 x + 0.0005, R = 0.9974; norvancomycin: y = 0.0121 x + 0.00211, R = 0.9973; methotrexate: y = 0.00288 x + 0.000646, R = 0.9979; paclitaxel: y = 0.000286 x + 0.000763, R = 0.9956; imatinib: y = 0.00569 x + 0.00577, R = 0.9970; IS did not affect the measurement. For LOD samples, S/N were 16.1, 6.3, 9.3, 12.3, and 8.1 for 0.02 μg/ml vancomycin, 0.02 μg/ml norvancomycin, 0.2 ng/mL methotrexate, 4.0 ng/mL paclitaxel, and 0.5 ng/mL imatinib, respectively.
Inaccuracy and imprecision
Inaccuracy and imprecision (mean±standard deviation).
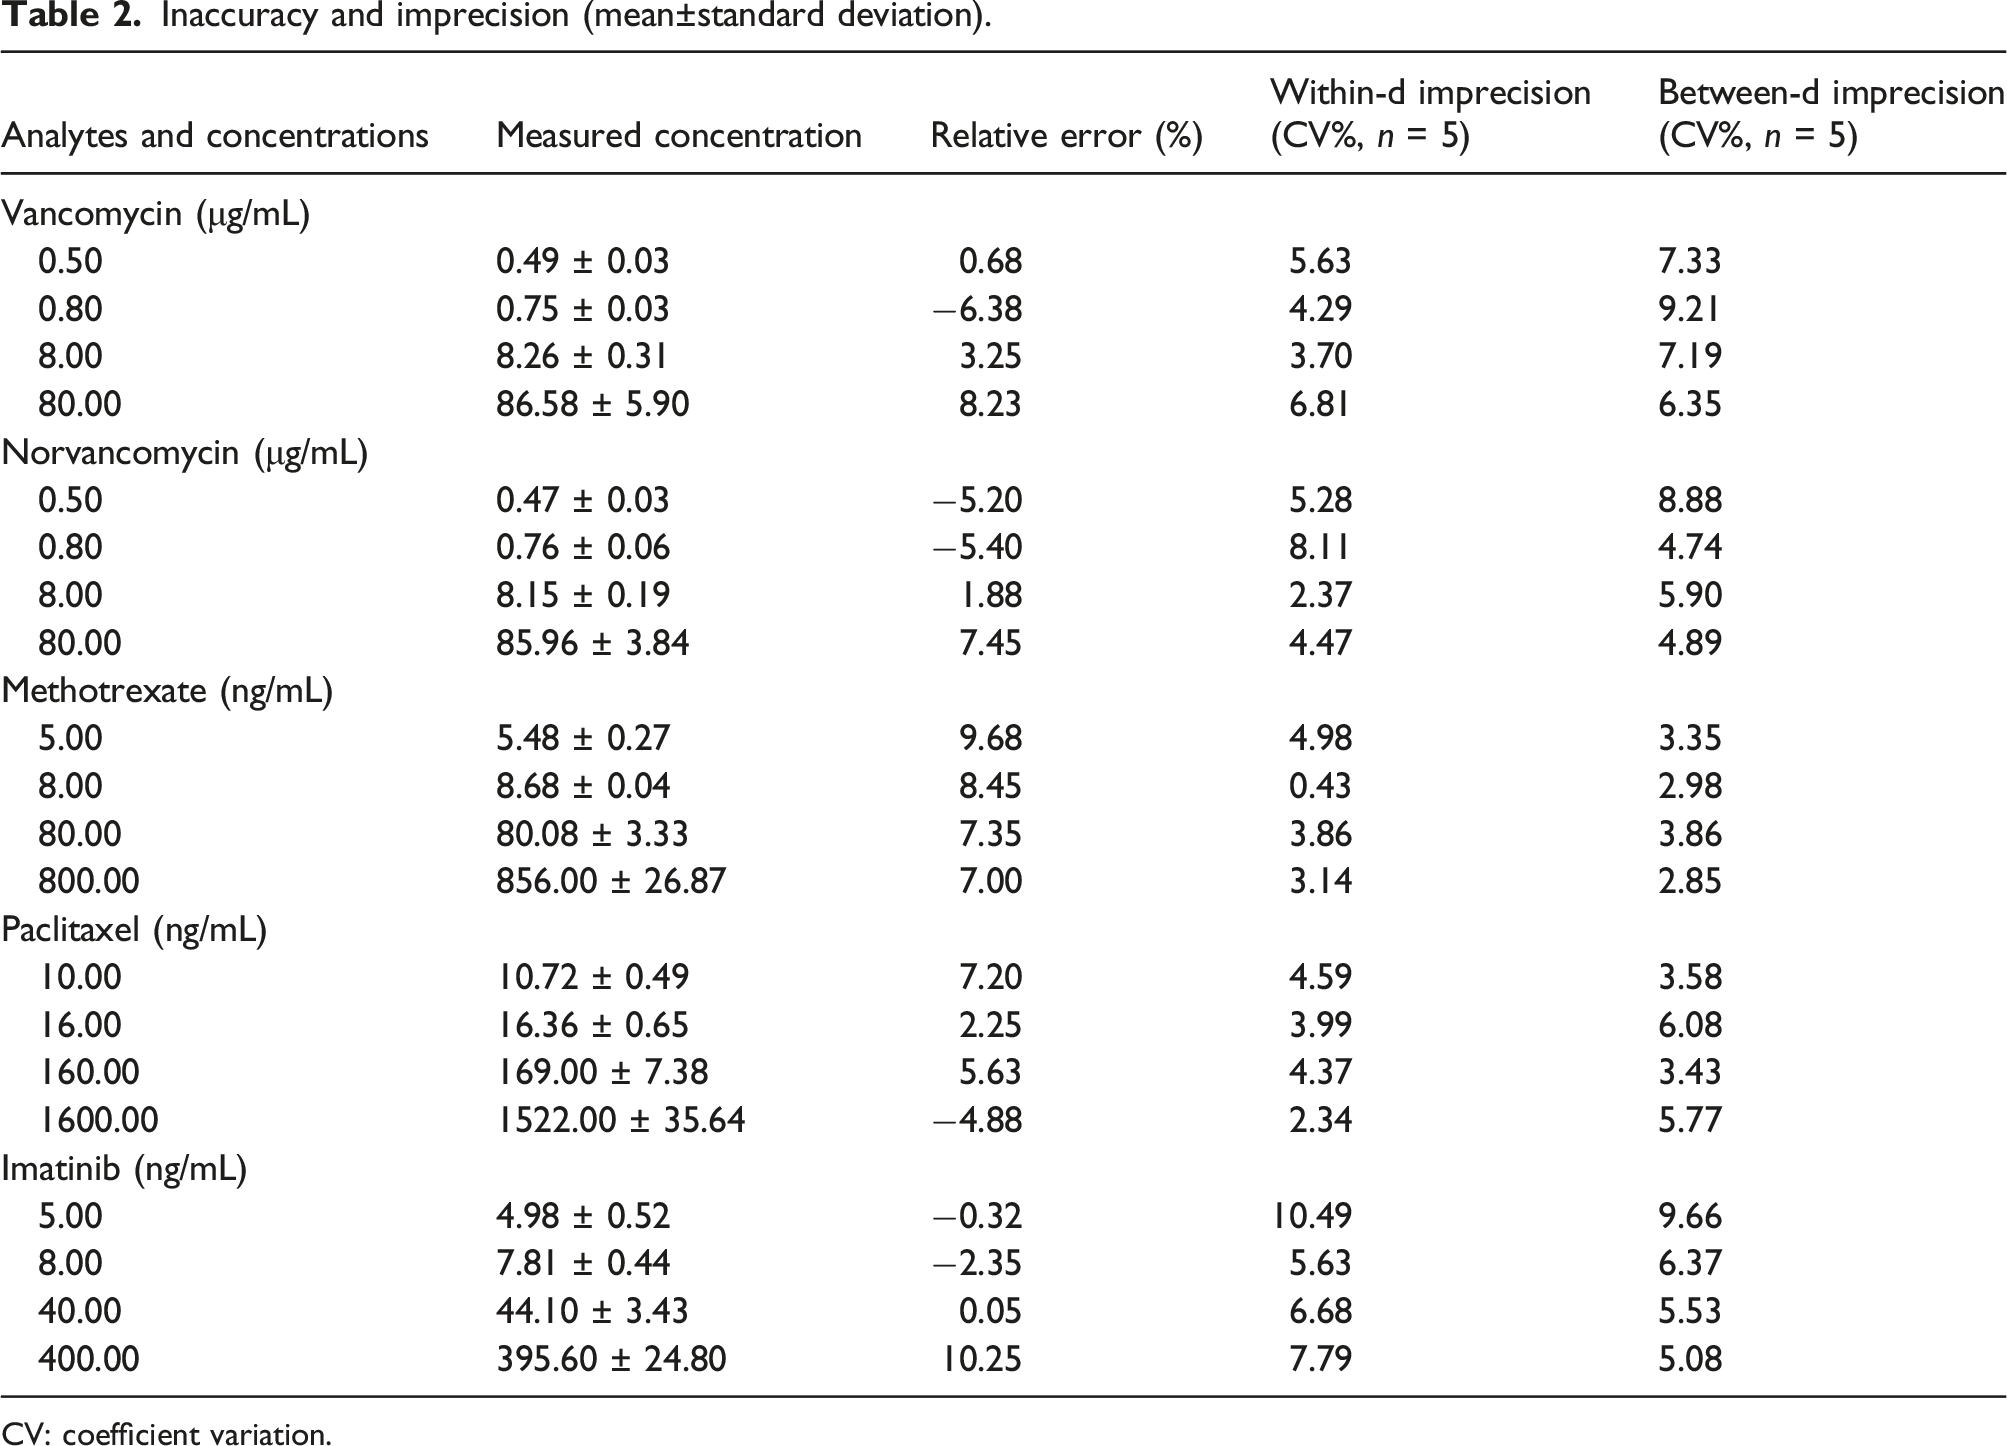
CV: coefficient variation.
Recovery and matrix effects
At the methotrexate three QC levels, the extraction recovery rates were 103.16%, 103.13%, and 102.97%, respectively. The CVs of IS normalized recoveries were 8.15%, 6.09%, and 9.94%, respectively. Similarly, the extraction recovery rates of paclitaxel and imatinib were almost 100%, and the CVs of IS normalized recoveries were less than 15%.
At the vancomycin three QC levels, the extraction recovery rates were 44.89%, 43.91%, and 45.42%, respectively, and CVs of IS normalized recoveries were 9.49%, 4.74%, and 5.59%, respectively. Similarly, the extraction recovery rates of norvancomycin three QC levels were 42.57%, 46.16%, and 47.66%, respectively, and CVs of IS normalized recoveries were 12.77%, 6.97%, and 6.80%, respectively.
Extraction recoveries and matrix effects in human plasma (mean±standard deviation).
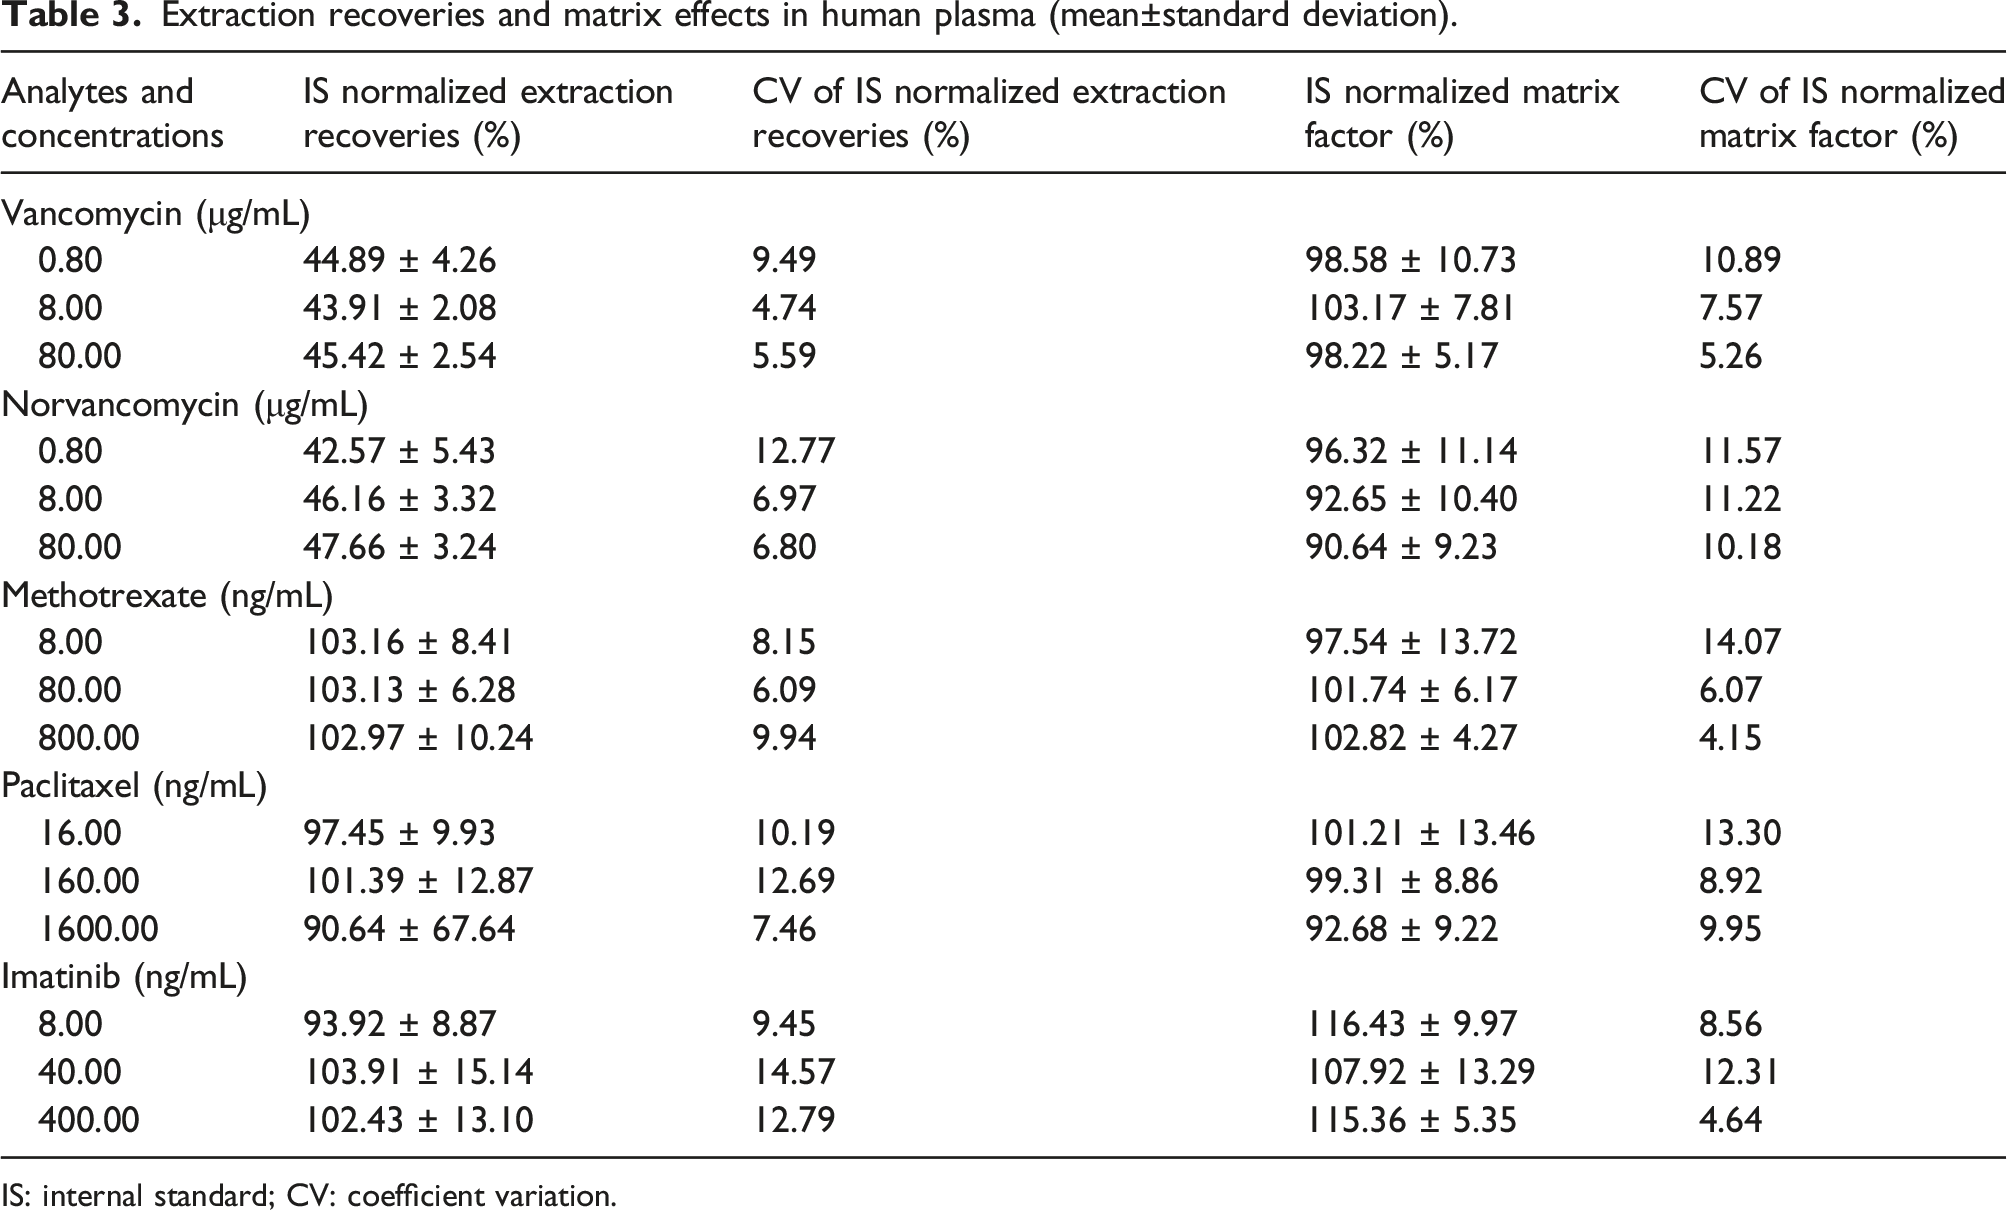
IS: internal standard; CV: coefficient variation.
The IS normalized matrix factors of the five compounds were all almost 100%, and the CVs were all less than 15%. It was suggested that there was no obvious matrix effect, as shown in Table 3.
Dilution integrity and stability
Stability of tested conditions in human plasma protected from light (n=5).
5000 ng/mL methotrexate, paclitaxel, and imatinib, as well as 500 μg/mL vancomycin and norvancomycin, were diluted 10-fold with blank plasma. Test results showed that the relative errors of vancomycin, norvancomycin, methotrexate, paclitaxel, and imatinib were −1.15%, 1.74%, 0.45%, −0.73%, and 3.15%, respectively. The CVs of vancomycin, norvancomycin, methotrexate, paclitaxel, and imatinib were 3.97%, 4.22%, 2.57%, 1.48%, and 0.89%, respectively. So, the dilution integrities were also acceptable.
Method application
As shown in Figure 2, we found that there were no significant concentration differences between serum and plasma samples for all the five drugs, p all <0.01. Serum and plasma concentrations.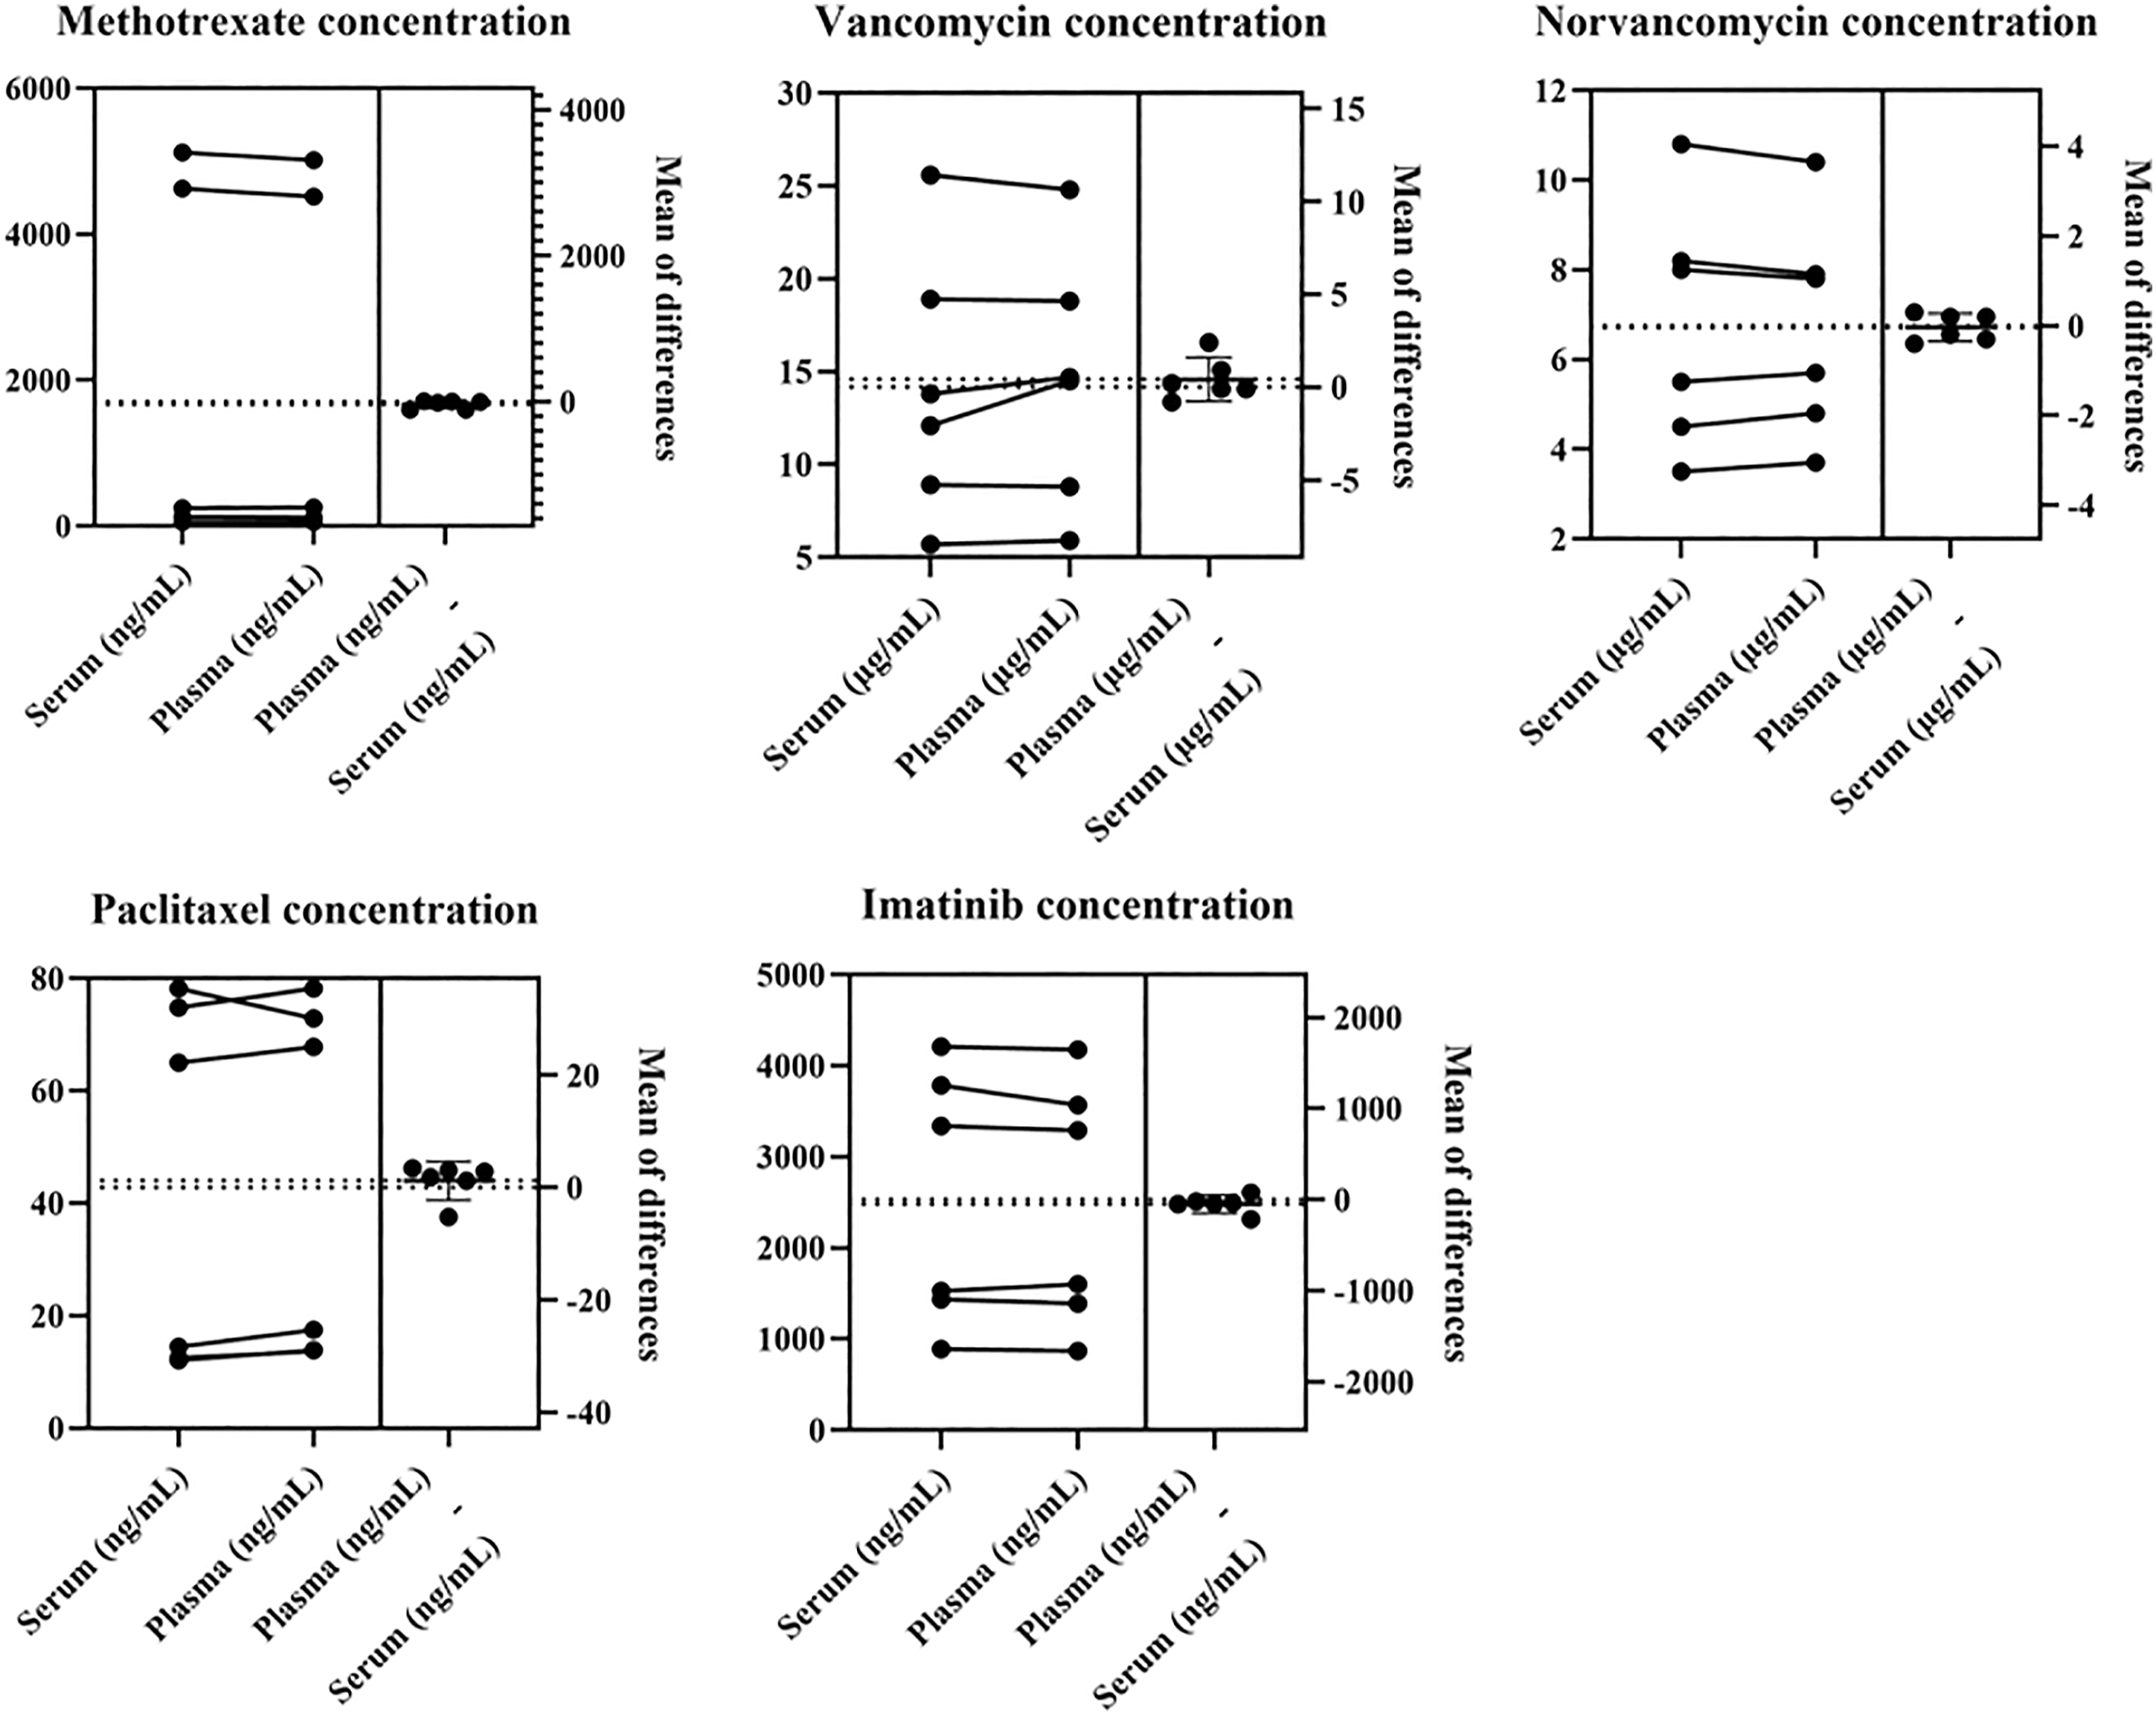
As shown in Supplemental Table S2 to Supplemental Table S6, during the clinical application process, we found that concentrations of methotrexate and vancomycin were relative with serum creatinine, which was an indicator of renal function, while paclitaxel and imatinib concentrations were not obviously correlated with renal function. The injection dose of albumin paclitaxel was 0.4 g, as well as the oral daily dose of imatinib was 0.4 g. However, the plasma concentrations of the same dose of albumin paclitaxel or imatinib varied greatly. It was noteworthy that compared with the low concentration of imatinib (<1100 ng/mL), the high concentration (≥1100 ng/mL) of imatinib group was older, which suggested that advanced age might be a risk factor affecting imatinib clearance. Norvancomycin was used in infectious diseases of patients with stage 5 nephropathy. The blood concentrations of norvancomycin varied widely among individuals, and there were no significant correlations of it with sex, age, body weight, daily dose, or creatinine.
Discussions
In this study, the UPLC-MS/MS method was developed to simultaneously detect the blood concentrations of vancomycin, norvancomycin, methotrexate, paclitaxel, and imatinib. The method was simple, rapid, precise, and stable. Kinetex C18 (Phenomenex, 2.1×50 mm, 1.7 μm particle size) was one of the most commonly used columns, available in almost every laboratory. The flow phases were methanol and 0.2% formic acid, no buffer salt, which was a protection for chromatographic column. Methanol precipitation deprotein was fast and simple. These factors ensured the detection was simple, fast, and suitable for large number detection of clinical samples, therefore facilitated the promotion and application.
In this study, after protein precipitation, 50 μL supernatant was separated, added into 200 μL water, mixed and shaken, centrifuged for 3 min, and finally, 3 μL supernatant was injected for analysis. During the process, adding the water was necessary. On the one hand, it could reduce pollution to detection system by diluting with water. On the other hand, water could not be replaced to other solvents and the volume of water was fixed. We found that different volumes of water could affect the response value of the compound, especially that of vancomycin and norvancomycin. Reducing the proportion of water significantly reduced the response values of vancomycin and norvancomycin.
The recoveries of vancomycin and norvancomycin were about 45%. In order to improve recovery, we tried to replace the precipitator with acetonitrile or different proportion of methanol acetonitrile mixture, but unfortunately, it did not solve the problem. We considered the possible reason was that vancomycin and norvancomycin were water-soluble and were missed to some extent in the precipitation process of organic solvents such as methanol and acetonitrile. During the process of protein precipitation, high proportion of organic solvent was necessary to ensure the effect of protein precipitation, so the low recovery rates of vancomycin and norvancomycin were inevitable. Despite of many methods to remove protein, the organic solvent method was simple and fast, which was suitable for the detection of large number of clinical samples. On the other hand, according to the guidelines for bioanalytical methodological validation of the FDA Drug Evaluation Research Center, recovery experiments must be conducted at high, middle, and low concentrations, and recoveries of analytes do not need reach 100%, but the analytes and standard compounds should be precise and reproducible. 19 Therefore, we accepted this method at the base of all results of method verification meeting the requirements.
During clinical application, the plasma concentration of imatinib approximately ranged from 500 to 4000 ng/mL, while the highest quantitative limit of imatinib in the method was 500 ng/mL; so the plasma samples were needed to be 10-fold diluted. The reason why the highest quantitative limit could not be improved was that higher concentration of imatinib had carryover effects. In this study, 500 ng/mL imatinib had a peak area of 5×10⁵, while 1000 ng/mL imatinib produced a certain carryover effect.
Generally speaking, it was no more than 24 h for the blood samples from being collected to being tested. In addition, some blood samples requiring repeated testing were needed to be stored at 4°C and must be tested within 72 h. Test-completed blood samples were generally stored for a week at −80°C. Therefore, we examined the stability of the QC samples at 20°C for 24 h, 4°C for 72 h, and −80°C for 1 week. The results showed that the imprecision and inaccuracy results of samples were satisfactory. Additionally, the PD%, 95%CI, and instability equation were presented in Table 4. Not all PD% decay over time had a significant linear relationship. The possible reasons we considered were different preservation conditions (20°C, 4°C, and −80°C) and random error of experiments.
Vancomycin is widely used in Intensive Care Unit (ICU) in many medical institutions. Matrix effect was found in vancomycin concentration monitoring in an ICU patient. Large number of clinical drugs, including pethidine, morphine, cephalosporin, papaverine, nitroglycerin, rabeprazole, nicodil, furosemide, metoprolol, nifedipine, and more than 10 other drugs were prescribed for the patient. Although we could not determine which drug it was, we speculated that some drug or drugs had affected the response value of tinidazole and vancomycin. We diluted the sample for 10 folds and the matrix effect disappeared. It was suggested that this method had a certain limitation in some patients, and sample dilution was one possible solution.
During the therapeutic monitoring of methotrexate, vancomycin, and paclitaxel, serum and plasma samples were both used. However, test results among immunoassay, HPLC, or LC-MS/MS differ to some extent.7,11 Therefore, in this experiment, we compared the drug concentrations between serum sample and plasma sample from the same patient at the same time, and the results showed that there were no significant differences in drug concentrations between serum and plasma. In the general physiological state, fibrinogen is 2.38–4.98 g/L and albumin is 65–85 g/L in the blood. That is, the concentration of fibrinogen is about 5% of the concentration of albumin. No study has shown whether fibrinogen can bind to drugs, even if some drugs are combined and precipitated during centrifugation, the reduced drug concentration in serum compared with plasma could not be reflected under the existing detection techniques. Therefore, it was suggested that the differences of concentrations between different detected methods were not caused by blood samples, serum, or plasma.
Albumin paclitaxel is one of the most commonly used drugs to treat breast cancer. Borgå et al. 22 compared the characteristics of albumin paclitaxel and paclitaxel injection. Albumin paclitaxel was eliminated faster and more widely distributed than paclitaxel injection, and albumin paclitaxel had fewer clinical adverse reactions. 23 In this study, we found no significant adverse reactions of albumin paclitaxel, without leukocyte lower levels higher than II Level. In addition, we found no better treatment effect in patients with blood concentration higher than 0.05 μmol/L at 24 h after administration. Besides, we examined 20 patients with stromal tumors treated with imatinib, and we found that the blood concentration of imatinib was associated with the age of patient. The results suggested that advanced age may be an obvious risk factor for clearing of imatinib. Both glutamylaminase and glutaminal transaminase were normal in patients treated with paclitaxel or imatinib, which suggested that neither drug showed significant impairment to liver function. Due to the small sample size, the results were needed to be further confirmed. Further studies remain to investigate the relationships between drug concentrations and clinical efficacies, adverse effects or other clinical parameters, and we hope that this method will play a role in the future studies.
Conclusions
An UPLC-MS/MS method was developed and validated for the therapeutic drug monitoring of vancomycin, norvancomycin, methotrexate, paclitaxel, and imatinib. The method was competent and stable during the method verification and clinical application. Therefore, it can be daily applied during the therapeutic drug monitoring of vancomycin, norvancomycin, methotrexate, paclitaxel, and imatinib.
Supplemental Material
sj-pdf-1-acb-10.1177_00045632221077183 – Supplemental Material for Development, validation, and application of an UPLC-MS/MS method for vancomycin, norvancomycin, methotrexate, paclitaxel, and imatinib analysis in human plasma
Supplemental Material, sj-pdf-1-acb-10.1177_00045632221077183 for Development, validation, and application of an UPLC-MS/MS method for vancomycin, norvancomycin, methotrexate, paclitaxel, and imatinib analysis in human plasma by Xinran Chen, Liying Du, and Mingfeng Liu in Annals of Clinical Biochemistry
Footnotes
Acknowledgements
We would like to thank Juan Hou, Liman Huo, Jing Bai, and Ping Liang for their reference opinions of the clinical significances of the drug plasma concentrations.
Declaration of conflicting interests
The authors declared no conflict of interest with respect to the research, authorship, and publication of this article.
Funding
The author(s) disclosed receipt of the following financial support for the research, authorship, and/or publication of this article: This research was funded by the Fourth Hospital of Hebei Medical University and key research and development plan program from the Science and Technology Department of Hebei Province (Program number: 20377757D) and the key project plan of health and medical science research in Hebei Provincial Health Commission (Program number: 20190745).
Ethical approval
The study was approved by the Ethics Committee of the Fourth Hospital of Hebei Medical University (REC number: 2021KS017)
Guarantor
XC.
Contributorship
Xinran Chen: Experimental protocol design, experimental manipulation, paper writing and modification. Liying Du: Experimental manipulation, data analysis, and paper modification. Mingfeng Liu: Patient data collection, patient medication guidance, and paper modification.
Supplemental material
Supplemental material for this article is available online.
References
Supplementary Material
Please find the following supplemental material available below.
For Open Access articles published under a Creative Commons License, all supplemental material carries the same license as the article it is associated with.
For non-Open Access articles published, all supplemental material carries a non-exclusive license, and permission requests for re-use of supplemental material or any part of supplemental material shall be sent directly to the copyright owner as specified in the copyright notice associated with the article.