
Abstract
Background
Retinol-binding protein4 (RBP) assays using polyclonal antibodies (pRBP) have major problems of non-linearity of dilution and a very small useable dynamic range. Our objective was to develop a specific assay with a wider dynamic range to detect tubular proteinuria.
Methods
mRBP (monoclonal capture and second antibody with colorimetric detection) and fluoroimmunoassays for RBP (fRBP) (polyclonal capture and monoclonal second antibody with fluorescence detection) were developed and compared with pRBP. Four hundred and eighty-eight patient samples were collected; 290 samples were analysed by mRBP and 198 samples with fRBP and compared with pRBP.
Results
mRBP assay has the advantages of better linearity on dilution and wider analytical range over pRBP. It is limited by poor signal in the patients with albuminuria and glomerular proteinuria and inferior discrimination between patient groups. fRBP had an intra-assay and inter-assay CV of <6% and <8%, respectively, and analytical range was 2.3–599 µg/L. fRBP was linear on dilution within the analytical range. Correlation (r) was 0.8722 (95% CI 0.7621 to 0.9333, P< 0.0001); Mann-Whitney test revealed no significant difference (U = 18,877, n = 198, P = 0.5244) asserting that the medians of the two samples were identical. Bland-Altman test between pRBP and fRBP showed a mean negative bias of 16.43 (CI –994 to 1027) µg/mmol.
Conclusions
The combination assay with fluorescence detection (fRBP) proved more discriminatory than a purely monoclonal system especially in patients with significant proteinuria and has advantages of better linearity on dilution and wider analytical range than the existing pRBP assay and compared extremely well with pRBP.
Introduction
Retinol-binding protein (RBP) is a 21 kDa plasma protein.1–3 RBP4, the major circulatory form, is present in the serum as holo-RBP4 (RBP4 bound to retinol), apo-RBP4 (RBP4 bound to transthyretin following delivery of retinol), free-RBP4 (quickly loses its affinity for transthyretin after the release of retinol), RBP4-L which is truncated at one C-terminal leucine molecule (Leu-183) and RBP4-LL, which is truncated at a second leucine molecule (Leu-182 and Leu-183). 2 Excretion of RBP4 in urine is not directly proportional to the plasma concentration of RBP; only the free form, RBP4-L and RBP-LL are freely filtered at the glomerulus and present in the urine in a ratio of 2:2:1. 4 In the proximal tubules, RBP4 binds to receptors, is internalized into endocytic vesicles, is subsequently proteolysed and the amino acids are released into the circulation. Decreased proximal tubular reabsorption results in increased excretion of RBP and other low-molecular weight proteins (LMWP) in the urine. The role of megalin receptors has been demonstrated in megalin knock out mice which develop significantly increased excretion of urine RBP with no demonstrable reabsorption of RBP in the proximal tubule. 5
Other markers of tubular proteinuria include beta-2 microglobulin (β2-m) and α-1 microglobulin (A1M), but urine RBP is considered to be one of the most sensitive markers for proximal tubular damage.6,7 The concentration of urine RBP may vary from the reference range in healthy controls to 10–100 times the upper reference limit in diabetes mellitus 8 and 10,000 times in patients with significant tubular proteinuria. Previous assays using polyclonal antibodies (RBP assay using polyclonal antibodies [pRBP]) have the major problems of non-linearity of dilution and a very small useable dynamic range. Antibody affinity to different forms of RBP, including that bound to transthyretin is unknown. Therefore, their contribution to the total amount filtered through the kidney is difficult to judge. An assay using monoclonal antibodies to RBP (RBP assay using monoclonal antibodies [mRBP]) has the potential for being technically more robust. 4 It has been shown to have much wider dynamic range with almost equimolar recognition of different forms of RBP (free-RBP4, RBP4-L and RBP4-LL) in urine and better linearity on dilution. It is therefore likely to be more sensitive and specific for the detection of minor degrees of proteinuria for example, in patients with kidney stones or diabetes.
Our aim was to develop a sensitive and specific assay for urinary RBP-4 using monoclonal antibodies (mRBP). However, during the course of the study, it became clear that patients with albuminuria and glomerular proteinuria showed lower than expected responses in the monoclonal assay. Hence, further experiments were conducted to identify the source of interference and further improve specificity of the assay by using a time-resolved fluorescence detection system.
Fluoroimmunoassay is based on labelling antibody with the fluorescent probe.9,10 Fluorescent molecules can be distinguished by absorptivity (ε), absorption and emission spectra, quantum yield (Q, ratio between absorbed light and emitted light) and fluorescence life time (τ), meaning decay rate of the excited state. A longer τ of the probe in comparison to the background decay is the basis of the time-resolved fluorescence immunoassay. Specific signal is integrated following decay of the background fluorescence. 11 Time-resolved fluorescence immunoassays provide high detection sensitivity compared with conventional fluorescent probes. Therefore, fluoroimmunoassays for RBP (fRBP) was set up and evaluated. Lanthanides including europium [Eu(III)] form highly fluorescent chelates with organic ligands. The fluorescence of the chelate has broad excitation (250–360 nm), a large stokes shift (>250 nm), emission (590, 613 nm) and a long fluorescence lifetime (100–1000 µs).
Our main objective was to develop a more sensitive assay using different combinations of antibodies to detect urine RBP with better linearity of dilution and wider analytical range. We used urine samples from patients with type 2 diabetes mellitus (T2DM) and kidney disease, who are known to have a significantly higher incidence of increased excretion of LMWP to evaluate the assays.12–14 Patients with T2DM may have raised urine RBP with albuminuria which is possibly glomerular in origin or without albuminuria when it is more likely to be tubular.15,16
Materials and methods
Ethics permission was granted from the NRES Committee East Midlands – Nottingham 2 (REC reference: 13/EM/0142). Patients attending the renal stone metabolic clinic for biochemical evaluation of kidney stone formation at Epsom and St Helier Hospitals NHS trust (ESTH) were invited to participate. Patients with T2DM and renal disease who had urine samples sent for microalbuminuria or proteinuria analysis in the biochemistry laboratory at ESTH along with samples referred from other laboratories (mainly for primary tubular disorders) for measurement of RBP were included in the study. Patients from the renal stone clinic and healthy controls were included following appropriate information and their consent. Initially, 290 urine sample were collected, including 62 with kidney stones, 104 with T2DM (53 samples with albumin:creatinine ratio (ACR) < 3 mg/mmol and 51 samples with ACR 3−30 mg/mmol), 60 with renal disease with protein creatinine ratio (TPCR) ≥ 100 mg/mmol), 12 samples with tubular proteinuria (referred from other hospitals) and 52 healthy controls which were used for mRBP assay. Additionally, further 198 fresh urine samples were tested with fRBP as RBP deteriorates in frozen samples – 8 with kidney stones, 10 with T2DM (five samples with ACR < 3 mg/mmol and five samples with ACR 3–30 mg/mmol), five with renal disease (TPCR ≥100 mg/mmol), 165 samples referred from other hospitals querying tubular proteinuria and 10 healthy controls. Potential healthy controls were excluded if there was a history of use of medication, diabetes or kidney disease or other known medical disorder. All the samples tested negative for haematuria by dipstick (Combur7 Test, Roche) and patients with renal stones, T2DM and renal disease had serum creatinine <180 µmol/L and were not on insulin. Healthy controls and samples received from external laboratories did not have measurements of serum creatinine. Midstream samples were collected, aliquoted and stored at –80°C within 6 h.
A fresh aliquot from healthy controls was used for measuring urine albumin, whereas patients with kidney stones, T2DM and renal disorders had albumin and serum creatinine measured as a part of routine care. All protein results were expressed as a ratio to creatinine to account for variations in urine concentration. A manual enzyme-linked immunosorbent assay (ELISA) for mRBP and fRBP were developed and evaluated for plate drift, intra-assay and inter-assay precision, detection limit, limit of quantitation or precision profile, linearity, analytical range, recovery, stability and reference range. Urine RBP was measured by the existing manual ELISA using polyclonal antibodies 17 ; albumin by immunoturbidimetry using polyclonal antibodies and creatinine by enzymatic assay on an Abbott Architect. The internal and external quality controls for albumin and creatinine were acceptable, whereas there is no external control for RBP.
Statistics were done on Graph Pad Prism (Version 6.04). RBP values were calculated with lowess-spline fit. Data was checked for normality by the Shapiro-Wilk test. All assay results including mRBP, fRBP and pRBP demonstrated a non-parametric distribution (P < 0.0001). Hence, data was log transformed to achieve a near parametric distribution for further statistical analysis. Further experiments were conducted to identify the cause of interference in mRBP assay using serum albumin, proteinase inhibitor, sodium dodecyl polyacrylamide gel electrophoresis (SDS-PAGE) and Western blotting. Spearman rank correlation was used for the method comparison. Mann-Whitney test was used to test the null hypothesis that there is no difference between new and pRBP assays. Bland-Altman was used to assess bias.
mRBP assay
MaxiSorp™, Nunc-immuno plates (cat#439454 Sigma-Aldrich) were coated with 100 µL of a freshly prepared dilution (1/2000) of unconjugated mouse monoclonal antihuman RBP4 RB48 antibody (cat#4RB2 HyTest, Finland) in coating buffer (sodium bicarbonate/carbonate buffer, pH 9.6) and incubated overnight in a refrigerator (2–8°C). Coated plates were washed four times with 200 µL TWEEN wash buffer containing phosphate-buffered saline (PBS), pH 7.4 and 1 mL/L TWEEN 20 and finally with 200 µL PBS wash buffer (pH 7.4) using a multichannel pipette. After every wash, plates were dried on an absorbent tissue on the bench. Standards were prepared as follows: 0.5 mg of the free form RBP4 from human plasma (cat#8RF9, HyTest, Finland) was reconstituted with 1 mL with deionized water (Millipore) to 0.5 mg/mL and stored in 10 µL aliquots at –80°C. The working concentration 1000 µg/L of the standard was prepared freshly by diluting 10 µL of the 0.5 mg/mL solution with 5 mL assay buffer (cat#1244–106, pH 7.8, Delfia). Doubling dilutions were performed and an additional concentration equivalent to 750 µg/L was prepared to obtain a 10-point standard curve. Controls and urine from patients were diluted in Delfia assay buffer in two dilutions (1/6, 1/11, 1/21, 1/51 or 1/101).
One hundred microlitres of blank (Delfia assay buffer), standards, controls and samples were added in duplicates using a microtube racked system (cat#15082, Thermoscientific) with multichannel pipettes in rotational symmetry. The plates were covered with self-adhesive seal-plate and kept on a plate shaker (Crouzet, England) with medium shaking rate at room temperature for 2 h. Plates were washed four times with TWEEN buffer followed by PBS once and 100 µL of biotinylated antihuman RBP4 monoclonal antibody RB42 (cat#4RB2, HyTest, Finland) diluted in Delfia assay buffer (1/4000) was added, covered with self-adhesive seal-plate and incubated for 1 h on the shaker. Plates were washed again four times with TWEEN buffer followed by PBS once and 100 µL of horseradish peroxidase (HRP)-conjugated streptavidin (cat#N100, Thermoscientific) diluted in assay buffer (1/4000) was added, covered with self-adhesive seal-plate again and kept on the shaker for 1 h at room temperature. The plate was washed six times with 200 µL TWEEN wash buffer and finally with 200 µL of PBS wash buffer. The substrate solution (cat#DY999, R & D systems) was prepared by mixing reagent A (stabilized hydrogen peroxide, Part# 895000) and reagent B (stabilized tetramethylbenzidine, Part# 895001) in equal quantity and 100 µL added. Plates were sealed and kept on the shaker at medium shaking rate in the dark for 10–12 min. The reaction was stopped by the addition of 50 µL of stopping reagent (98% sulphuric acid, one in nine dilution) and gently shaking the plate with caution for a couple of seconds to mix the solutions well. The absorbance was measured at 450 nm with a reference wavelength of 620 nm on a Tecan microplate reader.
mRBP method evaluation
Intra-assay variation across the plate was evaluated by running five patient samples between concentration 7.4 and 365 µg/L for more than 48 times each on the same plate; mean, standard deviation (SD) and coefficient of variation (CV) of the absorbances were calculated in rotational symmetry; two outliers at the extreme ends were removed. Further duplicates of reconstituted standards (cat#8RF9, HyTest, Finland) at concentration 3.9 µg/L and 7.8 µg/L were run 11 times each on one plate. Inter-assay precision was measured by running two patient samples in duplicates, on three different days; one of which was a patient with tubular proteinuria. Mean absorbance, SD and CV of the absorbances and concentration based on each absorbance were calculated. To assess trueness or accuracy, BBI controls at concentration 648 µg/L were diluted in 1/11. 1/21, 1/51 and 1/101 and analysed for mRBP; mean bias was calculated between measured and expected concentration of the control samples.
The absorbance reading (A) that is 2.6 SD above mean background signal is the limit of detection (LoD). Fourteen duplicates of blanks were run and the mean absorbance (ALoD) was calculated; the concentration corresponding to ALoD is the LoD read off the standard curve.
Two urine samples on patients with serum creatinine >200 µmol/L (that should have significantly increased RBP excretion) and a third with renal tubular disorder were collected from the biochemistry laboratory, anonymized, checked for haematuria and analysed for mRBP; measured concentration was divided with the dilution factor to achieve the expected concentration to check for linearity of dilution.
To assess recovery, 10 µL aliquots of 500 µg/mL standard were diluted by adding 800 µL of urine from two healthy volunteers to give a working concentration of 6693 µg/L (U1). This was further diluted in doubling dilutions by adding equal quantity of U1 to urine sample to give U2, U2 to U3 and so on. Further, a urine sample was collected from a patient with ACR of 97.2 mg/mmol, PCR 154 mg/mmol and serum creatinine 122 µmol/L. Eight microlitres aliquot of 0.5 mg/mL standard were diluted by adding 800 µL of urine to give a working concentration of 5000 µg/L (U1). Further dilutions were performed as above to assess recovery.
To check the effect of freeze–thaw cycle, a patient’s sample was frozen and thawed in one, two, three and four cycles and analysed in 1 in 11, 1 in 21, 1 in 51 and 1 in 101 dilutions.
Reference range was calculated on 50 healthy volunteers and defined by 2.5–97.5% percentile.
Setting up of combination assay
Half of two MaxiSorp™, Nunc-immuno plates (cat#439454 Sigma-Aldrich) were coated with unconjugated mouse monoclonal antihuman RBP4 RB48 (cat#4RB2 HyTest, Finland) and the other half with unconjugated polyclonal rabbit antihuman RBP (cat#A0040, Dako) coating antibodies. Standards included a free form RBP4 from human plasma (cat#8RF9, HyTest, Finland) in concentrations between 3.4 and 500 µg/L and highly purified RBP collected from human urine (BBI Solutions) in concentrations between 19 and 599 µg/L; controls from human urine (BBI Solutions) in concentrations between 2 and –162 µg/L and four patient samples including one with tubular proteinuria and three with T2DM with microalbuminuria were run on the mRBP and pRBP assays. In the first plate, biotinylated antihuman RBP4 monoclonal antibody RB42 (cat#4RB2B, HyTest, Finland) was added, followed by HRP-conjugated streptavidin (cat#N100, Thermoscientific), whereas in the second plate, HRP-conjugated rabbit antihuman RBP polyclonal antibody (cat#P0304, Dako) was added. The substrate solution (cat#DY999, R & D systems) was added to produce the colour in both plates.
Further, 11 urine samples were analysed by monoclonal (mRBP), polyclonal (pRBP) and combination assays using a monoclonal capture antibody with polyclonal detection antibody and with a polyclonal capture antibody with monoclonal detection antibody using both plasma-derived free RBP and urine-derived RBP preparations as standards.
Samples spiked with serum albumin and proteinase inhibitor
Some patients with glomerular proteinuria and albuminuria had falsely low RBP concentrations using a monoclonal (mRBP) assay. The use of stored urine samples has been questionable for analysis, as proteinases present in urine degrades albumin in the stored sample. 18 Proteinases can degrade RBP4 which may possibly be prevented by proteinase inhibitors. We therefore investigated if either glomerular proteinuria, albuminuria and or proteinases was/were interfering with RBP analysis.
Urine samples from a healthy volunteer, two patients with T2DM without albuminuria and a patient with tubular proteinuria were spiked with serum albumin (cat# A3782-1G, Sigma-Aldrich). Serum albumin (12.5 mg) was diluted in the 25 mL of Delfia assay buffer giving a concentration of 500 mg/L. This was utilized for diluting the samples as per mRBP protocol. Urine samples from two patients with glomerular proteinuria, two patients with T2DM with albuminuria and a patient with tubular proteinuria were treated with proteinase inhibitor (Complete™, Mini, EDTA-free Protease Inhibitor Cocktail – cat# 040693124001, Roche). One tablet of proteinase inhibitor was added to 10 mL of Delfia assay buffer which was utilized for diluting the samples. RBP was measured using mRBP in all the above samples and compared with untreated mRBP concentrations.
SDS-PAGE and Western blot analysis
The protein samples were prepared for Western blotting under denaturing and reducing condition by heating at 70°C for 10 min in a solution containing NuPAGE LDS sample buffer (1×) and Neupane sample reducing agent (1×). An equal amount of protein –urine-derived RBP preparations: Sciapac standard and Sciapac quality control, BBI standard (BBI Solutions) and plasma-derived free RBP (HyTest) at a concentration 200 and 50 µg/L and molecular ladder (7 µL) were subjected to SDS-PAGE. Proteins were transferred onto PVDF membrane for 4 h in NUPAGE transfer buffer at 30 V using the Xcell II Blot Module (Life Technology). Following the transfer, the blots were washed with TBS-T buffer (Tris-buffered saline/20 mM Tris/HCl, 150 mM NaCl and 0.1% [v/v] TWEEN 20, 5% [w/v]) on the shaker for 15 min. Blots were blocked with TBS-T fat-free milk 5% (w/v) for 60 min, washed for 10 min X3 with TBS-T buffer on a shaker and incubated with appropriate primary capture antibody either in TBS-T with 5% (w/v) BSA (polyclonal rabbit antihuman RBP) or TBS-T with 5% 9w/v) fat-free milk (mouse monoclonal antihuman RBP4 RB48 antibody) at 4°C overnight. Blots were washed for 10 min X3 with TBS-T buffer on a shaker and incubated with HRP-labelled secondary antibody for 1 h at room temperature and visualized with Chemi-Doc Touch Imaging System, Bio-Rad (cat#161–0376). Blots were stripped and re-probed for house-keeping tubulin protein as a loading control.
In another experiment, plasma-derived free RBP (HyTest) at concentration 0.5 mg/mL, urine-derived RBP preparations (BBI) at concentrations 1.1988 µg/mL and 648 µg/L, urine-derived RBP Siemens standard, samples with proteinuria of 700 mg/mmol and tubular proteinuria with RBP 5567 mg/mol, a healthy volunteer and molecular ladder (7 µL) were subjected to SDS-PAGE in Mini-PROTEAN gels (cat#456–8025, BioRad) with NuPAGE MOPS SDS running buffer using the XcellSureLock mini-cell tank for 1 h at 200 V constant under reducing condition. Proteins were transferred onto PVDF membrane and Western blotting undertaken as described above. Blots were blocked with TBS-T fat-free milk 5% (w/v) for 60 min, washed for 10 min X3 with TBS-T buffer on a shaker and incubated with mouse monoclonal antihuman RBP4 RB48 antibody TBS-T with 5% 9w/v fat-free milk at 4°C overnight.
fRBP assay
Black, MaxiSorp, Nunc FluoroF96 (cat#437111, Thermoscientific) was coated with 100 µL of a freshly prepared dilution (1/500) of unconjugated polyclonal rabbit antihuman RBP (cat#A0040, Dako) in a coating buffer (sodium bicarbonate/carbonate buffer, pH 9.6) and incubated overnight in a refrigerator (2–8°C). Coated plates were washed four times with 200 µL TWEEN wash buffer containing PBS, pH 7.4 and 1 mL/L TWEEN 20 and finally with 200 µL PBS wash buffer (pH 7.4) using a multichannel pipette. After every wash, plates were dried on an absorbent tissue on the bench.
The standard was processed as follows: 1.2 mg of the RBP(>96%) collected from human urine from patients with tubular proteinuria (cat#P124-1, BBI Solutions) was reconstituted with 1 mL with deionized water (Millipore) to 1.1988 µg/mL (1198.8 µg/L) and stored in 500 µL aliquots at –80°C. The working concentrations between 2.34 and 599 µg/L were prepared freshly by doubling dilutions with assay buffer (cat#1244–106, pH 7.8, Delfia) to obtain a 10-point standard curve. Controls (donated by BBI Solutions) at concentration 648 µg/L were stored at –80°C and diluted fresh in Delfia assay buffer to give four concentrations between 6.42 and 324 µg/L. Urine from patients were diluted in Delfia assay buffer in two dilutions (1/6, 1/11, 1/21, 1/51 or 1/101).
One hundred microlitres of blank (Delfia assay buffer), standards, controls and samples were added in duplicates in rotational symmetry. The plates were covered with self-adhesive seal-plate and kept on a plate shaker (Crouzet, England) with medium shaking rate at room temperature for 2 h. Plates were washed four times with TWEEN buffer followed by PBS once and 100 µL of biotinylated antihuman RBP4 monoclonal antibody RB42 (cat#4RB2B, HyTest, Finland) diluted in Delfia assay buffer (1/4000) was added, covered with self-adhesive seal-plate and incubated for 1 h on the shaker. Plates were washed again four times with TWEEN buffer followed by PBS once and 100 µL of streptavidin-conjugated to Europium (cat.#1244–360, PerkinElmer) diluted in assay buffer (1/1000) was added, covered with self-adhesive seal-plate and kept on the shaker for 40 min at room temperature. The plate was washed six times with 200 µL TWEEN wash buffer and finally with 200 µL of PBS wash buffer. Using a multichannel pipette, 100 µL of the Delfia enhancement solution (cat.#1244–105, PerkinElmer) was added, plates were sealed and kept for 5 min on the shaker and for 5 min further without shaking.
Fluorescence was measured on a FLOUstar Omega (BMG LABTECH, Germany) using excitation filter 320/340 nm, emission filter 615 nm, delay 400 µs, window 400 µs, cycle 1000 µs, high flash energy, number of flashes 100, orbital averaging off and gain start at 3000. RBP concentration was calculated with a lowess-spline fit using prism software.
fRBP method evaluation
Intra-assay variation across the plate was evaluated by running controls (BBI Solutions) 12 times at four concentrations. Mean, SD and CV of the fluorescence and concentrations were calculated; precision profile for the assay was plotted by running controls at least four times at concentrations between 3.2 and 432 µg/L. Inter-assay precision was measured by running duplicates of controls (BBI Solutions) on 10 different days. To assess trueness or accuracy, BBI controls at concentration 5.0 to 108 µg/L were analysed for fRBP; mean bias was calculated between measured and expected concentration of the control samples.
To analyse LoD, blank was run 15 times; highest and lowest values were removed. The concentration corresponding to fluorescence (FLoD) is the LoD read off the standard curve.
To assess linearity of dilution, one urine sample on a patient with proteinuria of 519 mg/mmol and serum creatinine 112 µmol/L (that should have significantly increased RBP excretion) and second with renal tubular disorder were collected from the biochemistry laboratory, anonymized, checked for haematuria, diluted in assay buffer and analysed for fRBP. Expected fRBP was calculated by choosing a concentration for which absorbance was on the straight line of the standard curve. Measured concentration was divided with the dilution factor to achieve the expected concentration.
To assess recovery, urine samples were collected from four healthy volunteers and pooled together. Thirty microlitres aliquots of 9900 µg/L standard were diluted by adding 1000 µL of urine to give a working concentration of 288 µg/L (U1). This was further diluted in doubling dilutions by adding equal quantity of U1 to urine sample to give U2–U6.
Results
mRBP method evaluation and comparison
The intra-assay CV for mRBP was <10% at mean concentrations 25 µg/L, 109 µg/L, 149 µg/L, 365 µg/L; a sample with mRBP of 7.5 µg/L had a CV of 19%. The CV of the standard at concentration 7.8 µg/L was <10% but was higher at 3.9 µg/L; therefore, lower working limit for the assay was considered as 7.8 µg/L; inter-assay CVs were 8.3% and 3% in two samples with mRBP concentrations of 425 µg/L and 7454 µg/L, respectively. Accuracy studies showed a calculated bias of –8.77, –7.77, –5.16 and –1.01 at concentrations 59 µg/L, 30.8 µg/L, 12.7 µg/L and 6.4 µg/L, respectively, reflecting a negative bias for mRBP assay. Analytical range for mRBP was 7.8 − 450 µg/L. The LoD was 5.5 µg/L; mRBP was linear on dilution within the analytical range using samples from patients with tubular proteinuria. Recovery of standard diluted with urine from healthy volunteer increased with increasing dilutions of the urine, whereas diluted with a patient sample with ACR of 97.2 mg/mmol, PCR 154 mg/mmol and serum creatinine 122 µmol/L was less than 20%. There was a significant difference observed between mRBP concentrations of one freeze–thaw cycle from the rest on one-way ANOVA and Tukey’s multiple comparison test (P = 0.0019).
The reference range as calculated as 2.5–97.5 centile on 50 healthy volunteers was <39 µg/mmol. Mann Whitney test did not show significant difference between healthy males and females (P = 0.0550).mRBP and pRBP were used to measure RBP in 290 patients with mean age of 48 years, males 58% and females 42%. Two healthy controls with high ACR and five patients referred for possible tubular proteinuria with normal mRBP/creatinine and pRBP/creatinine were excluded from all further analysis. Results in the various groups are shown in Table 1.
Clinical characteristics in various groups of samples used for measuring mRBP.
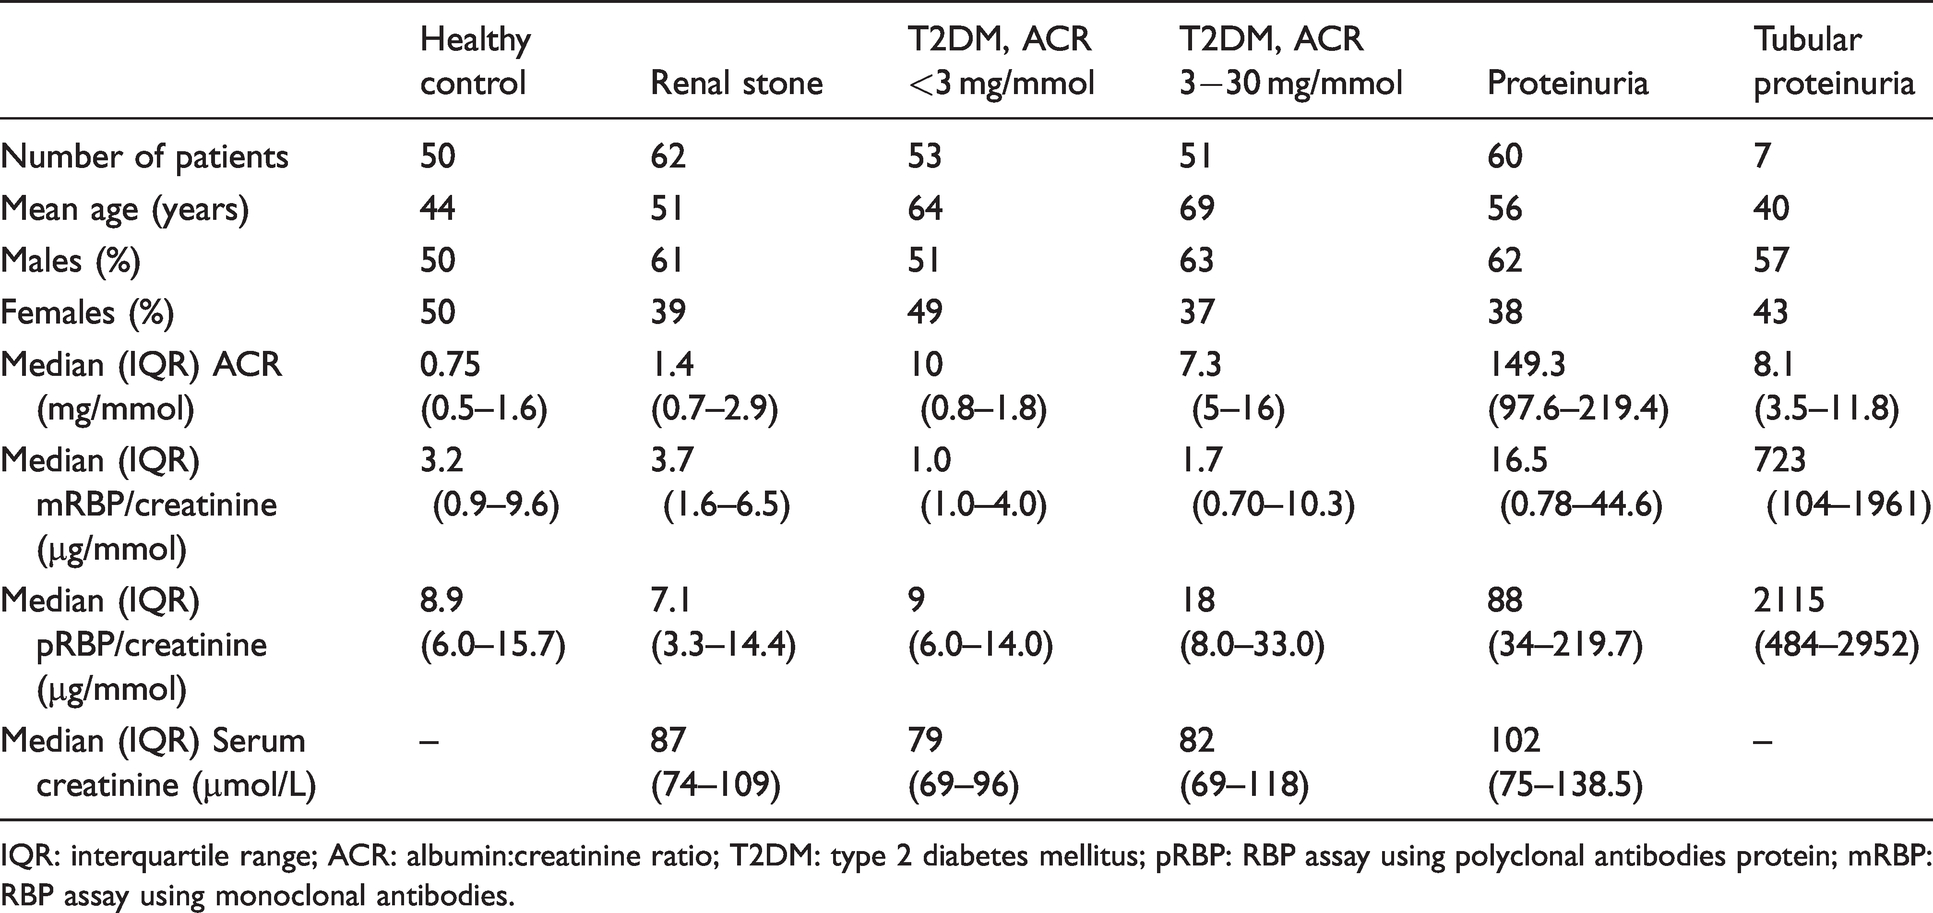
IQR: interquartile range; ACR: albumin:creatinine ratio; T2DM: type 2 diabetes mellitus; pRBP: RBP assay using polyclonal antibodies protein; mRBP: RBP assay using monoclonal antibodies.
All mRBP and pRBP results were creatinine corrected and log transformed. Spearman rank correlation (r) was 0.3868 (95% CI 0.2808 to 0.4835, P < 0.05) and Mann-Whitney test revealed significant difference (P < 0.0001) between mRBP and pRBP results. On Bland-Altman comparison, mRBP showed a mean negative bias of 38.52 µg/mmol with 95% limits of agreement between (–490.5 and 567.5) for all patient groups. The negative bias was 4.4 (95% limits of agreement –13.02 to 21.75) in healthy volunteers, 92 µg/mmol (95% limits of agreement –431 to 615) and 270 µg/mmol (95% limits of agreement –2620 to 3542) in patients with glomerular and tubular proteinuria, respectively. There is a significant bias between the two methods, which increases proportionately with the concentration of RBP4 with large variation in individual samples.
The reference ranges for the mRBP and pRBP assay calculated in the healthy volunteers were <39 µg/mmol for mRBP and <40 µg/mmol for pRBP, respectively. All the urine samples were categorized as positive or negative for tubular proteinuria based on these ranges (Table 2).
Patient groups which were divided as positive or negative for tubular proteinuria based on the reference range calculated from the healthy volunteers.
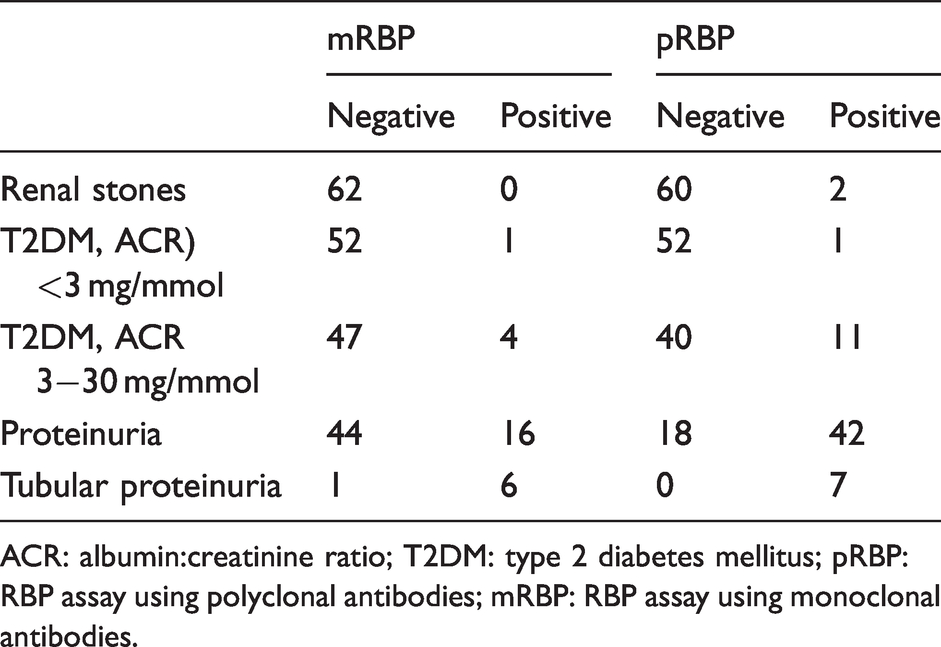
ACR: albumin:creatinine ratio; T2DM: type 2 diabetes mellitus; pRBP: RBP assay using polyclonal antibodies; mRBP: RBP assay using monoclonal antibodies.
Combination assay
Signal was achieved when free form RBP4 from human plasma (HyTest), highly purified RBP from human urine (BBI), four urine controls (BBI) and patient samples were run on the plate with polyclonal coating antibody and monoclonal detection system but not with monoclonal coating and polyclonal detection. Apart from the free form RBP4 from human plasma, all other samples produced signal with polyclonal coating antibody and polyclonal detection.
Results similar to the polyclonal assay were achieved when samples were analysed with combination assay using polyclonal capture antibody and monoclonal detection system but not with the reverse. Urine-derived purified RBP and control preparations and a few patient samples showed no response on the mRBP assay (monoclonal coating and detection) (Table 3). In addition, calibration with plasma standard resulted in consistently five-fold higher RBP concentrations in comparison to urine standard, r2 = 0.9989 and Y = 4.94×X + 12.5; 95% CI of Y-intercept –19.79 to 44.8 and slope 4.808 to 5.072 (Figure 1(a)).
Results of the 11 urine samples tested on the combination assays using a polyclonal capture and monoclonal detection antibody along with pRBP (urine standard) and mRBP (plasma standard) assays. For the combination assay, patient results were calculated based on both plasma and urine-derived RBP standards.
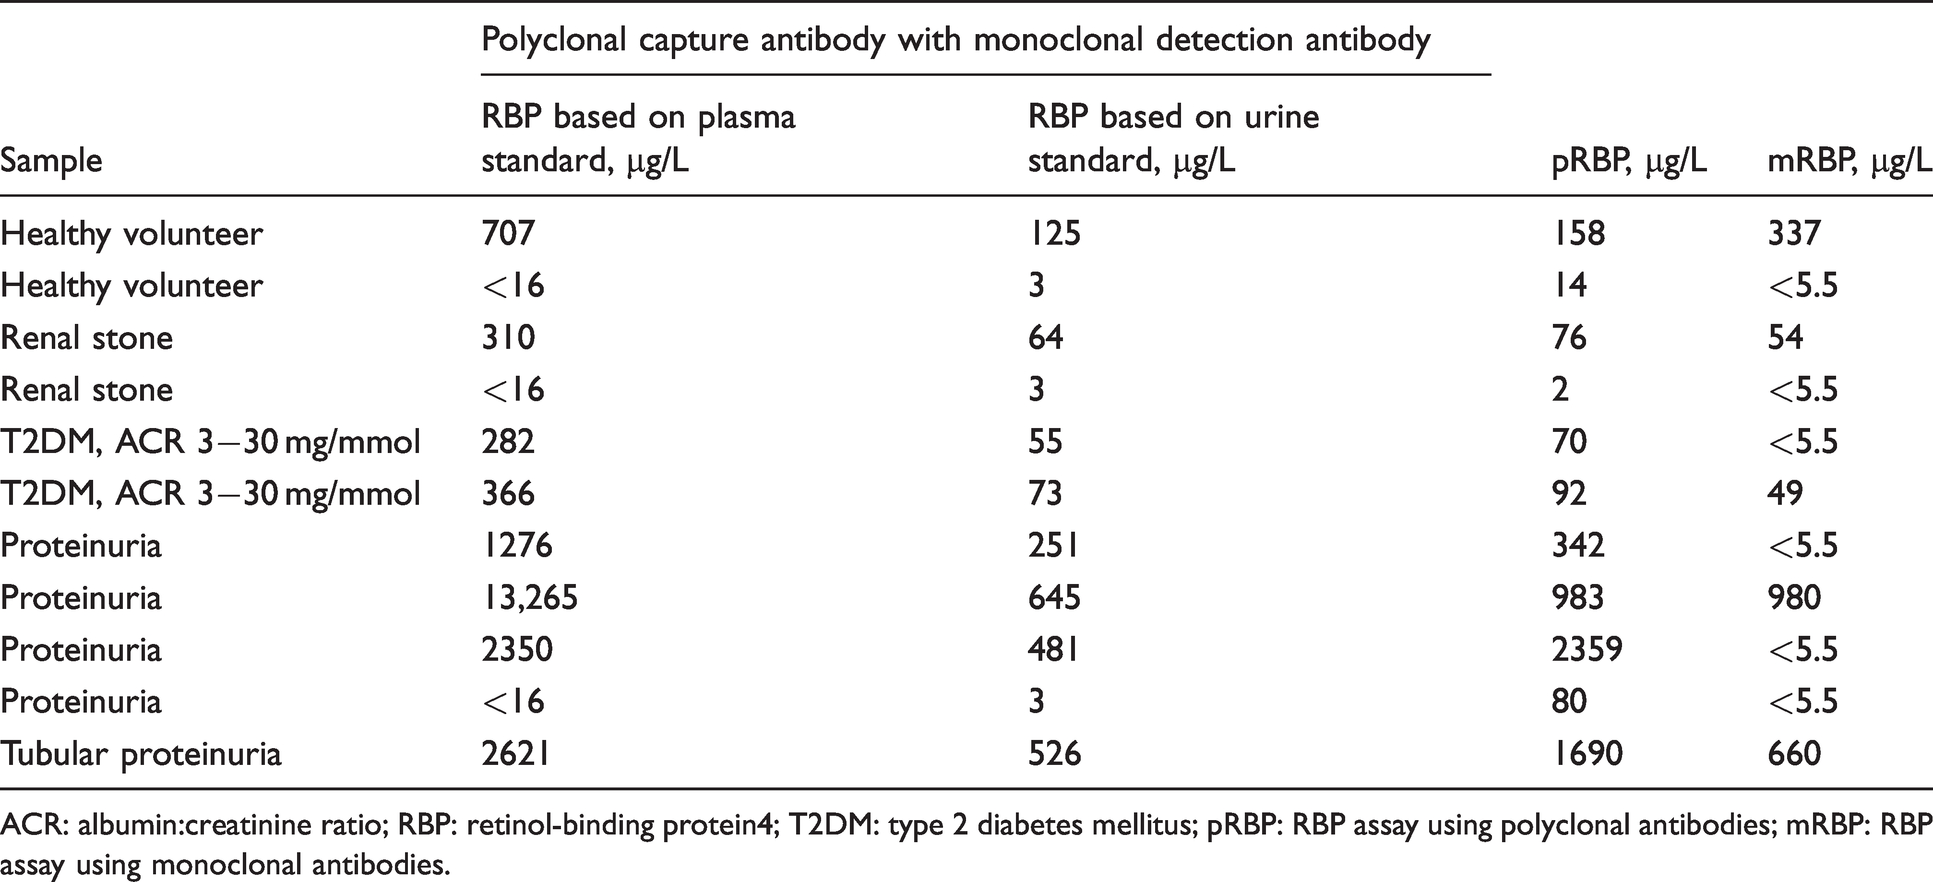
ACR: albumin:creatinine ratio; RBP: retinol-binding protein4; T2DM: type 2 diabetes mellitus; pRBP: RBP assay using polyclonal antibodies; mRBP: RBP assay using monoclonal antibodies.
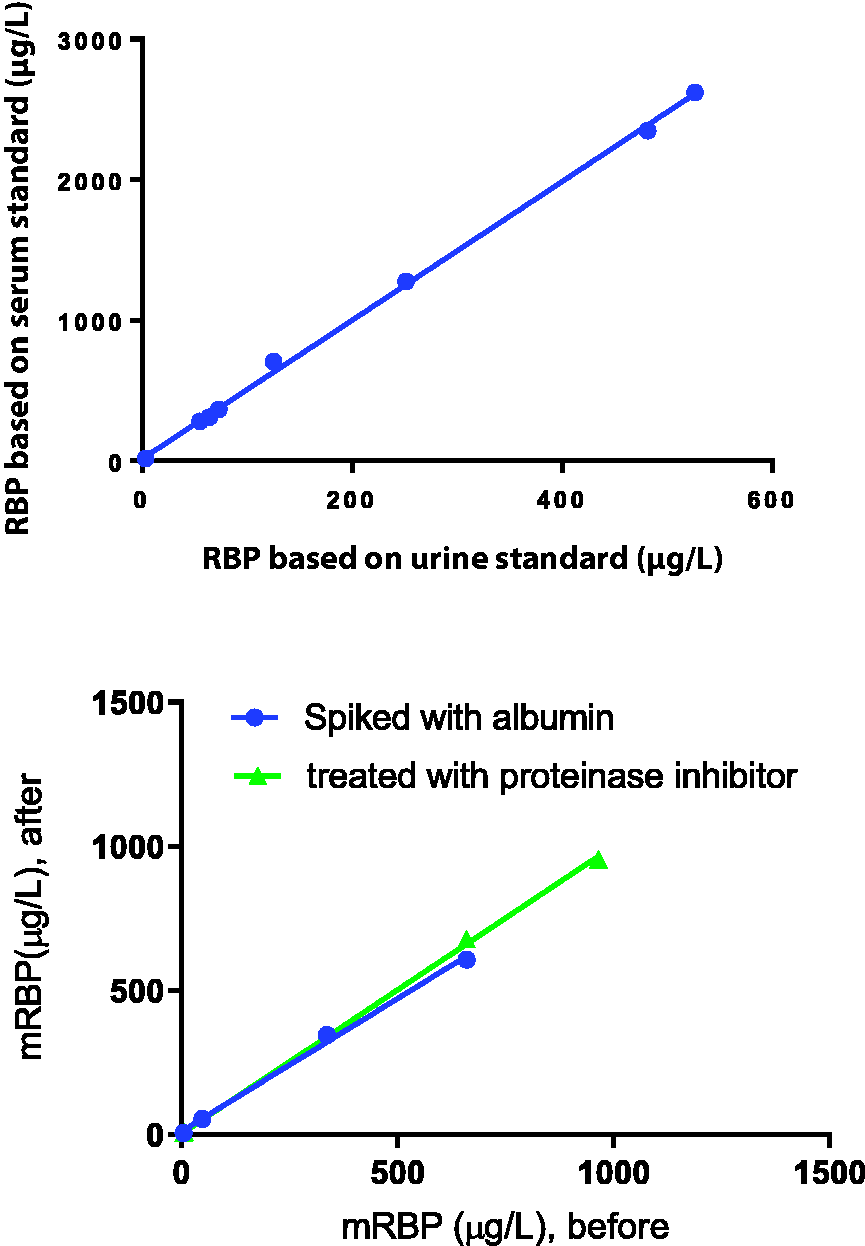
(a) Linear regression plot of the RBP measured in urine samples tested by combination assays using a polyclonal capture and monoclonal detection antibody. RBP based on urine and serum standards demonstrated r2 = 0.9989 and Y = 4.94×X + 12.5 (95% CI of Y-intercept –19.79 to 44.8 and slope 4.808 to 5.072). One of the high RBP results in a proteinuria patient was removed from analysis for clarity. (b) mRBP concentration (µg/L) of urine samples, before (X axis) and after (Y axis) with samples were spiked with albumin or treated with proteinase inhibitor.
Samples spiked with serum albumin and proteinase inhibitor
Samples spiked with serum albumin showed no significant difference in RBP concentrations compared with unspiked samples in the monoclonal assay (r2 = 0.9965 and Y = 0.9218×X + 10.56; 95% CI of Y-intercept –50.9 to 72.03 and slope 0.7563 to 1.087) ruling out albumin as a likely source of interference (Figure 1(b)).
Samples treated with proteinase inhibitor showed no significant difference in RBP concentrations compared with untreated samples in the monoclonal assay (r2 = 0.9994 and Y = 0.9977×X + 2.693; 95% CI of Y-intercept –41.47 to 46.85 and slope 0.9222 to 1.073 for proteinase inhibitor), suggesting that proteinases are not a likely source of interference (Figure 1(b)).
SDS-PAGE and Western blot analysis
SDS-PAGE and Western Blot analysis demonstrated that under reducing and denaturing conditions, the polyclonal rabbit antihuman RBP antibody was able to detect serum and urinary RBP, but mouse monoclonal antihuman RBP4 RB48 antibody failed to detect urine-derived RBP (Figure 2(a)); PVDF membrane demonstrated that monoclonal capture antibody detected urine standards and controls with much lower affinity in comparison to polyclonal antibody (Figure 2(b)).
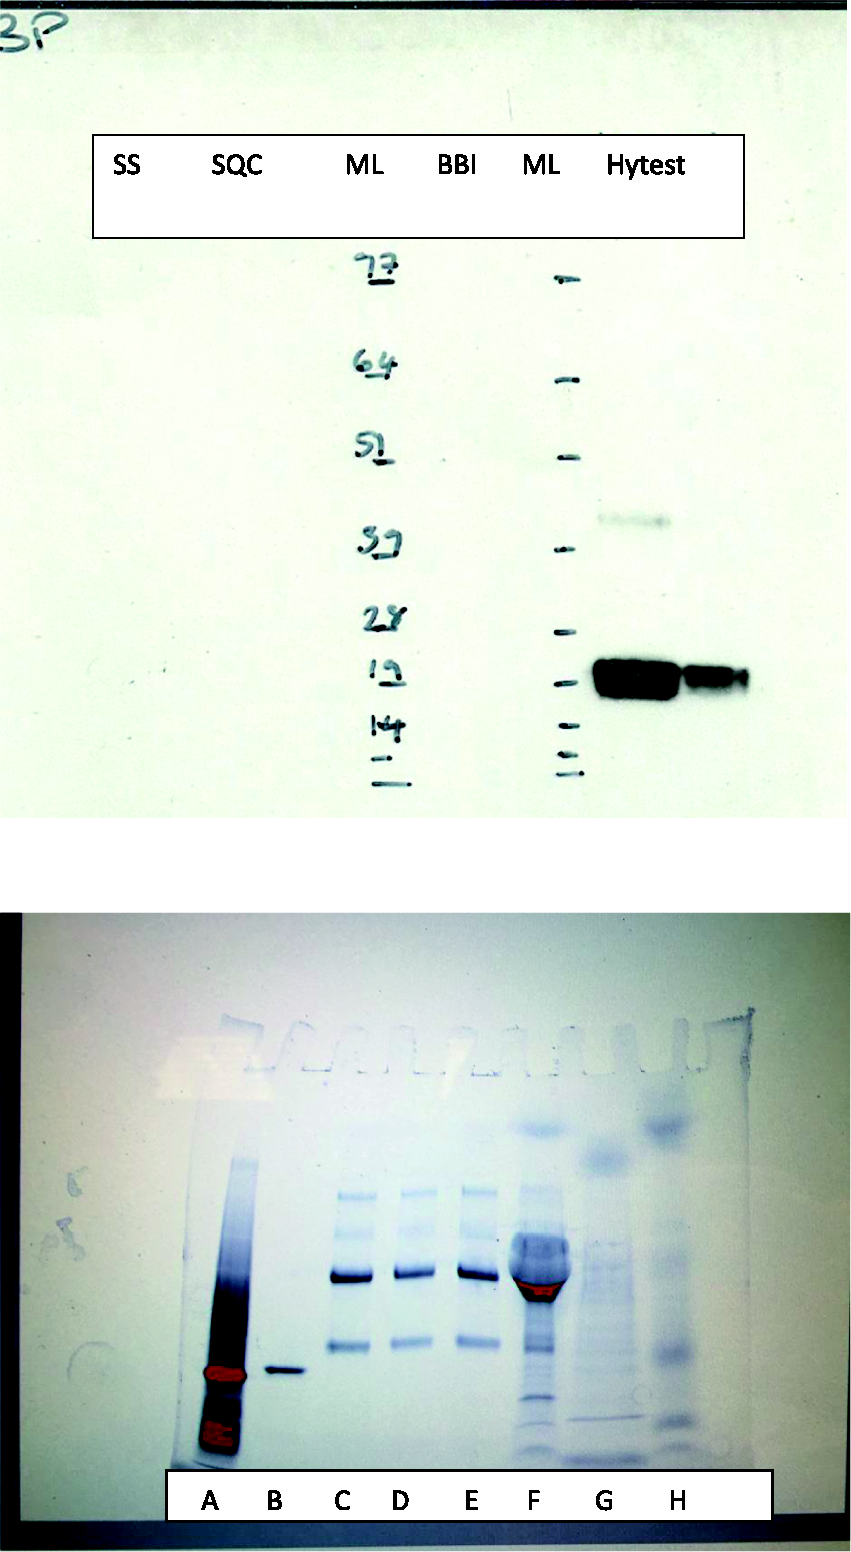
(a) Western blot analysis of urine-derived RBP-Sciapac standard and Sciapac quality control, BBI standard and plasma-derived free RBP (Hytest) at a concentration 200 and 50 µg/L showed that mouse monoclonal antihuman RBP4 RB48 antibody was able to detect plasma-derived RBP but failed to detect urine-derived RBP. (b) PVDF visualized with Chemi-Doc Touch Imaging System, Bio-Rad demonstrated that monoclonal capture antibody detected urine standards and controls with much lower affinity in comparison to polyclonal antibody.
Fluorescence immunoassay
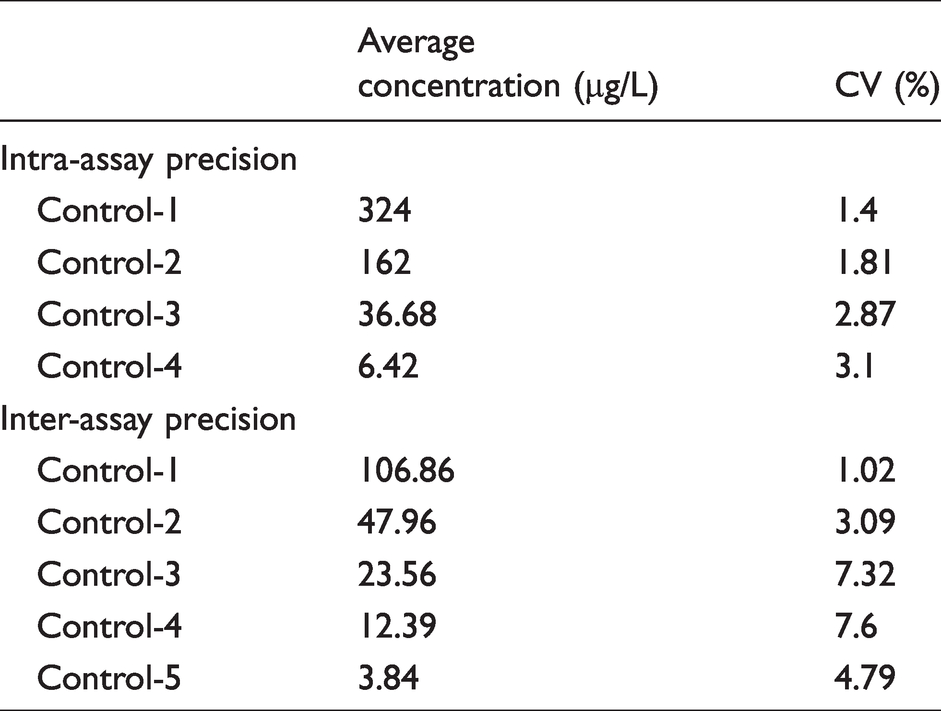
fRBP had an intra-assay CV of <6% between 15 and 323 µg/L, an inter-assay CV of <8% using controls between 3.8 and 107 µg/L (Table 4); there was no significant difference when paired up in rotational symmetry. The precision profile was plotted by running controls at least four times at concentrations 3.2, 6.42, 37, 162, 324 and 432 µg/L and calculated CV was <6% at all concentrations except 432 µg/L.
Inter-assay CV of <8% using controls between 3.8 and 107 µg/L and intra-assay CV of <6% between 15 and 323 µg/L.
Accuracy studies showed a calculated mean negative bias of –8.9 at concentrations between 5.0 and 108 µg/L (Figure 3).
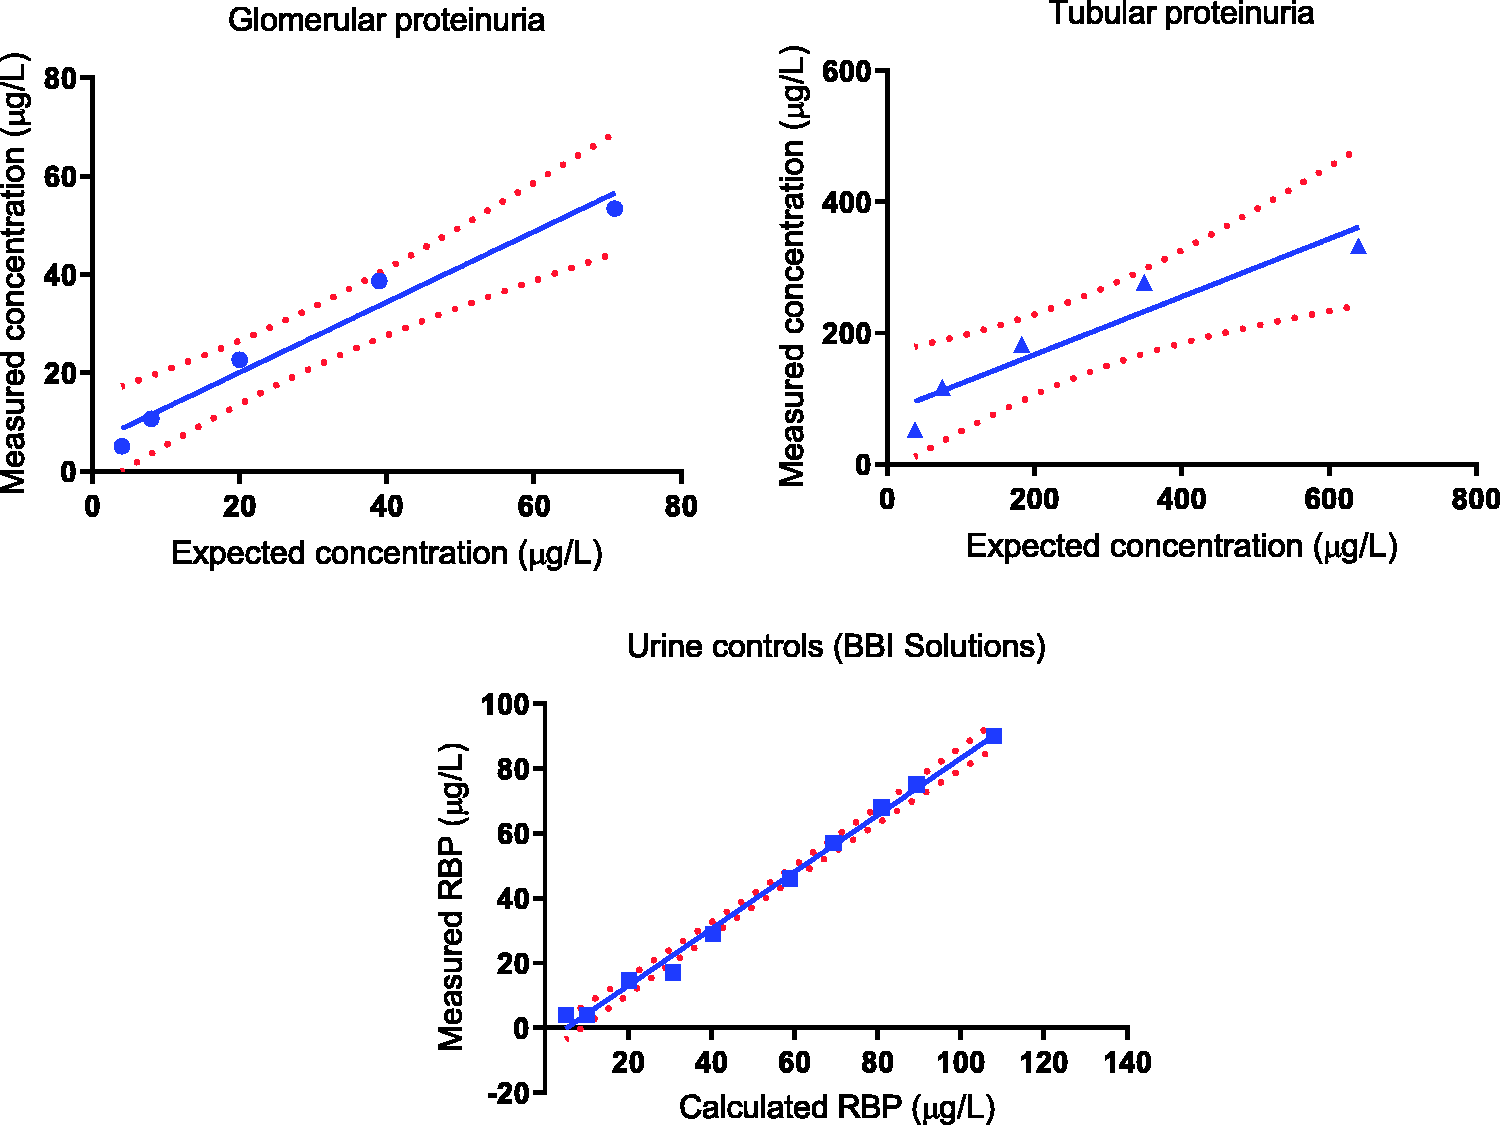
(a) Linear regression plot on a patient with proteinuria showing expected and measured concentrations of fRBP in 8, 11, 21, 51 and 101 dilutions. r2 = 0.9653 and Y = Y = 0.7150×X + 5.813 (95% CI of Y-intercept –3.532 to 15.16 and slope 0.466 0 to 0.9640). (b) Linear regression on a patient with tubular proteinuria showing slope with 95% CI between expected and measured concentrations of fRBP in 8, 11, 21, 51 and 101 dilutions. r2 = 0.9001 and Y = 0.4414×X + 78.87 (95% of CI of Y-intercept –12.51 to 170.3 and slope 0.1712 to 0.7115). (c) Linear regression on a control sample showing slope with 95% CI between expected and measured concentrations of fRBP in 10 dilutions. r2 = 0.9933 and Y = 0.8769×X –4.554 (95% of CI of Y-intercept –8.151 to –0.9570 and slope 0.8183 to 0.9356).
FLoD was much lower than the fluorescence of the lowest standard used and the analytical range was 2.3–599 µg/L. fRBP was linear on dilution within the analytical range using samples from patients with glomerular proteinuria, tubular proteinuria and urine controls (BBI Solutions) (Figure 3).
Recovery was above 80% at all dilutions.
fRBP and pRBP were measured in 198 patients with mean age of 64 years, males 58% and females 42%. Spearman rank correlation (r) was 0.9749 (95% CI 0.9666 to 0.9811, P < 0.0001); Mann-Whitney test revealed no significant difference (U= 18877, n = 198, P = 0.5244) asserting that the medians of the two samples were identical. Bland-Altman test between pRBP and fRBP showed a mean negative bias of 16.43 (CI –994 to 1027) µg/mmol (Figure 4); further, Bland-Altman test for RBP concentration less than 100 µg/mmol showed a negative bias of 2.164 (CI –14.20 to 18.53) which is clinically insignificant for RBP concentration close to reference range.
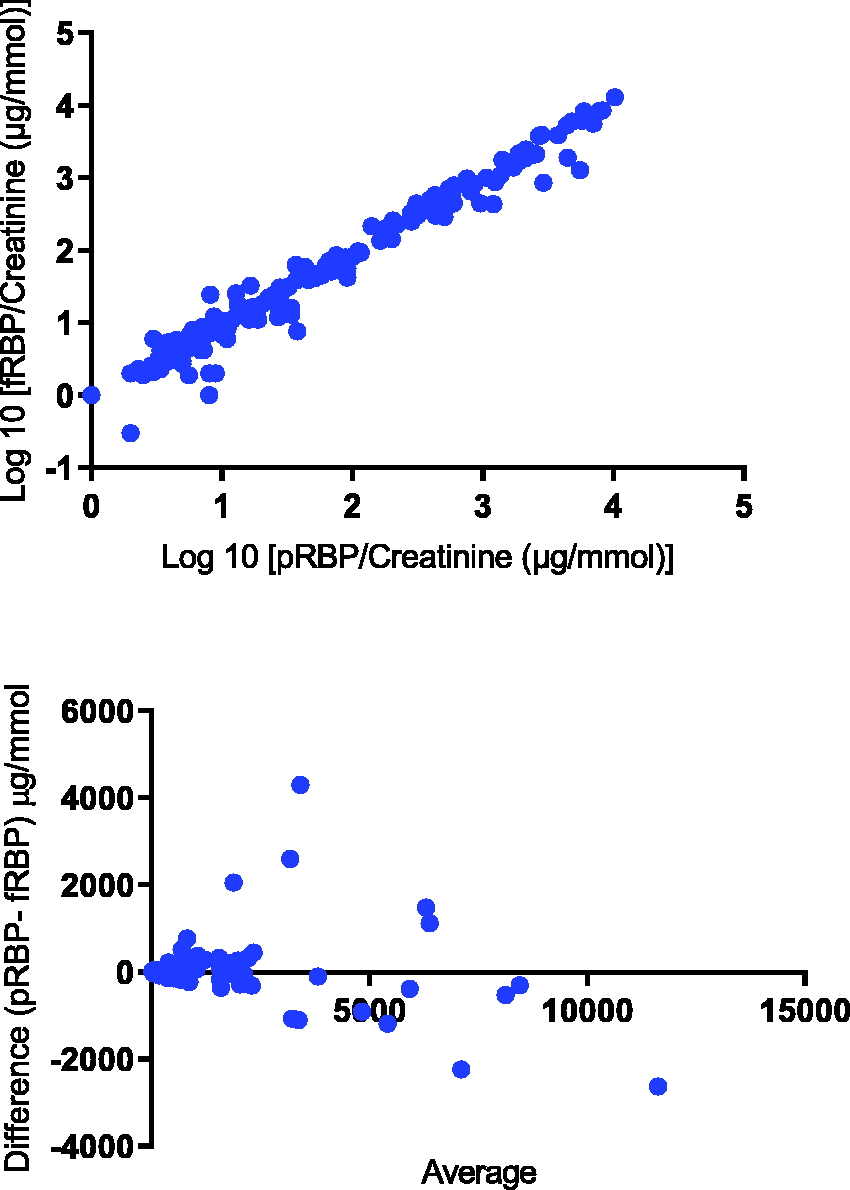
(a) Scatter plot of the pRBP/creatinine with fRBP/creatinine in 198 samples. Spearman rank correlation was significant where (r) was 0.9749 (95% CI 0.9666 to 0.9811, P < 0.0001). (b) Bland-Altman plot showing average of pRBP and fRBP on the X-axis and difference between pRBP and fRBP on the Y-axis. The mean bias 16.43 µg/mmol with 95% limits of agreement between –994 and 1027.
Discussion
Urine RBP4 has been shown to be a better marker than many other low-molecular weight proteins for the diagnosis of tubular proteinuria.6,7 Disorders associated with tubular proteinuria and kidney stones include Dent’s disease, Lowe syndrome and dRTA, although some authors have suggested that more subtle changes in tubular physiology may also lead to an increase risk of stone disease. 19 Urinary excretion of RBP4 and β2-m reflects the reabsorptive mechanism of the proximal tubules and both proteins have renal reabsorption thresholds.20,21 However, RBP4 is more stable than β2-m in acid urine or in the presence of white cells because of degradation of β2-m by the proteolytic enzymes. 22 This effect is particularly pronounced in patients with severe tubular injury, as it is associated with release of proteolytic enzymes from damaged tubular cells. 6 Variation in plasma concentration of RBP4 has a small effect on the performance of urinary RBP4 as a marker of tubular dysfunction as the major part in serum is present as a complex with transthyretin which is not filtered by the glomerulus and 14% of the RBP which is the free form is filtered. 6 In comparison, there is a huge variation in reabsorption in tubular disorders; 99.99% is normally reabsorbed so a small decrease in reabsorption, say to 99.98% will double the excretion. Further, a decrease to 99.90% will increase it 10-fold. In contrast, increased systemic production of β2-m can result in increased urinary excretion, as β2-m is present in almost every cell including renal cells; an increased cell membrane turnover due to renal injury results in increased excretion in urine. Hence, urinary RBP4 is considered to be a better marker for assessing tubular proteinuria compared with β2-m. However, different forms of RBP in urine at different concentrations make quantitative analysis of RBP4 potentially challenging. Although in the normal population the ratio of the free form (free-RBP), RBP4-L and RBP-LL in the urine is 2:2:1, 4 it is likely to be altered in conditions like chronic renal failure and insulin resistance in which there is an increase in serum RBP-LL and RBP-L, respectively.23,24 The affinity of polyclonal antibodies to different forms of RBP, including that bound to transthyretin is unknown, 25 and more evidence is required. The monoclonal antihuman RB48 and RB42 antibodies used in the assay recognize holo-RBP4 (RBP4 bound to retinol), RBP4 complexed with transthyretin, free-RBP4, which remains after the release of retinol and apo-RBP (cat#4RB2 HyTest, Finland). The concentration of urine RBP varies from the reference range in healthy controls to 10–100 times the upper reference limit in diabetes and 10,000 times in patients with tubular proteinuria. Hence, the useable dynamic range must be wide enough to encompass RBP4 within the reference range as well as the very high values seen in patients with tubular proteinuria, yet maintain precision along with linearity on dilution. We excluded patients with serum creatinine concentration ≥180 µmol/L, which is the renal threshold for RBP4 known to result in increased urinary losses. 6
An existing method to analyse urinary RBP4 using polyclonal antibodies described by Lapsley et al. 17 was modified to incorporate monoclonal antibodies. Initial experiments while establishing a useable standard curve showed non-specific binding with the use of antibody diluents containing PBS and protein matrix, which was overcome by using the specific Delfia assay buffer. The new method for mRBP was then evaluated and compared with the existing pRBP assay. The mRBP assay precision profile showed CVs of <10% between 25 and 364 µg/L which is comparable to that found by Burling et al. 4 and compares well with pRBP assay Lapsley et al. 17 Inter-assay precision showed a CV of 8% and 3% at a mRBP concentration of 425 µg/L and 7454 µg/L, respectively, which is also comparable to the pRBP assay by Lapsley et al. 17 The LoD for the mRBP assay (5.5 µg/L) was rather higher than for the pRBP assay (0.5 µg/L).
Studies on the linearity of dilution using urine from a patient with tubular proteinuria with RBP concentration of 9009 µg/L showed that the mRBP assay has a useable range up to 500 µg/L, much higher than the pRBP assay which demonstrates linearity only up to a maximum of 40 µg/L. 17 The analytical range of the mRBP assay is therefore around eight times higher than pRBP assay. However, the expected and measured concentrations in 6, 8, 11, 21, 51 and 101 dilutions of mRBP on two patients with serum creatinine >200 µmol/L (a surrogate marker for patients likely to have significant glomerular proteinuria) were not linear, which suggests interference from other kinds of proteins in the mRBP assay; measured concentrations were far lower (unpublished data). These two patients were not included in method evaluation as per the exclusion criteria. It may be hypothesized that other higher molecular weight proteins can block the capture or detection antibody, thereby reducing the signal. Serum creatinine >200 µmol/L is above the renal threshold for RBP and patients with chronic renal failure have an increased and changed proportion of free RBP4 in serum as previously discussed. Kiernan et al. demonstrated that a patient with diabetes mellitus had an increased excretion of RBP-L and relative lack of free-RBP and RBP-LL in comparison to healthy subjects. 26 All the above-mentioned reasons are likely to change the ratios of various forms of RBP excreted in patients with renal failure, which can affect the binding with monoclonal antibody. Since the same pathway is utilized for reabsorption of filtered albumin and LMWPs, an increase in one (i.e. albumin) in the tubule will theoretically result in increased excretion of others because of competitive inhibition of uptake.27,28 This type of non-linearity is not seen in the pRBP assay, so is specific to one or both of the monoclonal antibodies. Recovery of the plasma-derived RBP was good from the urine samples; however, samples with higher concentration of RBP, i.e. at lower dilutions (i.e. containing less diluent) exhibited poorer recovery (unpublished data). This phenomenon may be compared with the high-dose hook effect at high analyte concentration more likely to be associated with one-step immunoassays; when analyte concentration increases to very high values, either or both capture and signal antibodies become saturated with analyte, limiting the antibody complex formation.29,30 Our assay is a two-site, two-step sandwich ELISA which in theory should not suffer from this effect. It is unlikely to be due to the presence of RBP with different affinity in the plasma standard as the Hytest calibrant is 95% free form RBP4. 31 Although manufacturer claims that the monoclonal antihuman RB48 and RB42 antibodies recognizes holo-RBP4 (RBP4 bound to retinol), free-RBP4 and RBP4 complexed with transthyretin, but Burling et al. showed that as a calibrant, native RBP4 isolated from human plasma had a better response than plasma RBP complexed with transthyretin when tested with these monoclonal antibodies. 4 Therefore, a change in proportion of these forms can potentially affect antigen recognition. Recovery of the highly purified plasma-derived RBP was poor in a urine sample with albuminuria even at higher dilutions, re-emphasizing the previous finding of probable interference in the mRBP assay from either higher molecular weight proteins, or change in the ratio of various forms of RBP excreted due to increased filtration – increased excretion of RBP4 complexed with transthyretin.
It has been shown previously that RBP4 degrades in urine when stored at –70°C for several months. 32 Experiments to check sample and standard stability at different temperatures showed a significant difference after four freeze–thaw cycles compared with measurement after one freeze–thaw cycle. Similarly standards reconstituted and stored at 2–4°C in the fridge overnight showed a significant reduction in concentration, confirming that RBP4 in reconstituted standard is not stable in the fridge (unpublished data).
The Spearman rank correlation between mRBP and pRBP was significant; however, Wilcoxon matched-pairs signed-ranks test showed a significant difference in absolute values. The mean bias within healthy volunteers (4.4 µg/mmol creatinine) is perhaps not clinically significant; nonetheless, it increases proportionately with increasing concentration of RBP4 in urine. The difference in results could be because of the source of the standards, as the mRBP assay uses standards derived from plasma, whereas the pRBP assay uses protein derived from urine. Intriguingly, the mRBP assay did not produce any signal with urine derived standards; this is discussed further later. The reference range expressed as creatinine ratios for the mRBP assay is similar to pRBP, despite the negative bias observed in other patient groups for the mRBP assay. This may be explained by the possibility that monoclonal capture antibody detects-free RBP better than bound, as healthy volunteers should have only free RBP whereas polyclonal is detecting both free and bound RBP.
The sensitivity of detection of abnormal RBP excretion was similar for both assays in healthy volunteers, patients with a history of renal stones, T2DM without microalbuminuria and those with tubular proteinuria; however, patients with T2DM with microalbuminuria and proteinuria had lower rates of detection with the mRBP assay. Patients with T2DM with microalbuminuria and glomerular proteinuria did not have high mRBP in contrast to pRBP. This correlates with findings in the urine samples from two proteinuric patients mentioned previously with serum creatinine >200 µmol/L with poor linearity on dilution and another patient with albuminuria that showed poor recovery of the standard. In contrast, patients with primarily tubular proteinuria, with little albuminuria, demonstrated good linearity of dilution. Possible explanations include direct interference from larger proteins with antibody binding during measurement or a change in the configuration of the RBP4 molecule in urine in the presence of albuminuria/proteinuria, causing a reduction in antibody recognition or likely change in the proportion of various forms of RBP, i.e. free RBP excreted in comparison to RBP–transthyretin complex. Such interference is likely to have a greater effect on a monoclonal antibody system than in a polyclonal system if the interference or change affects the site at which the monoclonal antibody binds. Another explanation may be a change in the affinity of monoclonal antibodies for free RBP versus bound in the presence of other proteins.
A more recently highlighted issue of biotin interference 33 is less likely to be implicated, as both mRBP and fRBP utilize biotinylated antihuman RBP4 monoclonal antibody RB42 which combines with HRP-conjugated streptavidin and streptavidin-conjugated to europium, respectively.
The mRBP assay has various advantages over the pRBP assay including better linearity on dilution, much wider analytical range and is more specific for free RBP; however, the poor signal generation in the urine of patients with albuminuria and or glomerular proteinuria and inferior discrimination between patient groups makes the assay impractical in its current configuration. These patients are likely to suffer from potential negative interference. This is in contrast to the findings in patients with primarily tubular proteinuria, in whom there was little albuminuria and good linearity of dilution.
Further work was performed to improve the assay so as to maintain higher analytical range and better linearity of the mRBP assay. Options include using a monoclonal capture antibody with polyclonal detection antibody and vice versa. Preliminary studies showed that good signal was achieved when samples were run on the plate with polyclonal coating antibody and monoclonal detection system but not with monoclonal coating and polyclonal detection. This finding was consistent with free RBP4 derived from human plasma, purified RBP from human urine (not detected in the mRBP assay) and patient samples. This suggests that there is interference at the monoclonal capture antibody stage. Interestingly, the mRBP assay in its original format showed poor response with some commercially available purified standards (highly purified RBP from human urine pRBP controls, BBI Solutions). These urine standards are prepared by concentrating samples from patients with tubular proteinuria – RBP is fractionated and purified from urine, further verified by radial immunodiffusion, quantified by optical density and calibrated against pure RBP; purity is defined by SDS-polyacylamide gel electrophoresis. 34 Following on, RBP is diluted with BSA to its desired concentration. The use of polyclonal antibody and or BSA in the initial purification may be a reason for the poor signal achieved in the monoclonal system, although a conformation change during the purification process that affects the monoclonal binding site is another likely explanation. Conformational change has been described during apo-halo transition in RBP 35 likely to affect monoclonal recognition more than polyclonal. Our own experience showed PBS and protein matrix used as a diluting agent at various stages of the mRBP assay resulted in high blank readings and no calibration curve was achieved. Further experiments identified the assay buffer as the cause of the high blank values, which was solved by changing to a commercial assay buffer.
Some patients with glomerular proteinuria and albuminuria had unexpectedly low RBP concentrations using a monoclonal (mRBP) assay. The use of stored urine samples has been debatable for analysis proteinases present in urine degrades albumin in the stored sample. Possible explanations include direct interference from larger proteins with antibody binding during measurement or a change in the configuration of the RBP4 molecule in urine in the presence of albuminuria, proteinuria or proteinase enzyme causing a reduction in antibody recognition. Such interference is likely to have a greater effect on a monoclonal antibody system than in a polyclonal system if the interference or change affects the site at which the monoclonal antibody binds. Hence, further experiments were conducted to identify the source of interference and further improve the specificity of the assay.
Hypothetically, proteinases may degrade RBP4 which may be possibly prevented by proteinase inhibitors. Interference studies where samples spiked with serum albumin or treated with proteinase inhibitor showed no significant difference in RBP concentrations from controls, suggesting that there was little effect on the monoclonal antibodies from albumin in vitro as a high molecular weight protein or degradation of RBP by proteinases. This does not rule out competitive inhibition in the tubules in vivo from increased albumin filtration in patients with proteinuria. Western blotting experiments demonstrated that under reducing and denaturing conditions, the polyclonal antibody detected plasma and urinary RBP, but monoclonal antibody failed to recognize urine-derived RBP and was able to detect plasma-derived RBP. PVDF membrane demonstrated that monoclonal capture antibody detected urine standards and controls with much lower affinity in comparison to polyclonal antibody. Mouse monoclonal antihuman RBP4 RB48 antibody is not picking up urine RBP which correlates with the fact that highly purified RBP from human urine did not produce signal with monoclonal capture and detection system (mRBP assay). As the Hytest antibody is raised against plasma RBP, it may recognize an antigen only present in that particular three-dimensional conformation, if the tertiary structure in urine does not present the same antigen, it will not be recognized. Therefore, it was concluded that monoclonal capture antibody was less suitable for patients with albuminuria and proteinuria, although had good sensitivity in patients with tubular proteinuria perhaps related to better detection of free RBP. Polyclonal capture antibody recognizes both serum- and urine-derived RBP. Further experiments carried out showed promising results by combining polyclonal coating antibody and monoclonal detection system.
Based on the results of the combination assay with polyclonal coating and monoclonal detection antibody as ELISA, fRBP was set up utilizing polyclonal coating antibody and monoclonal detection by fluorimetry and evaluated for the following reasons.
Conventional fluorimetry has decreased sensitivity due to light scattering from soluble molecules, small particles, or the solid phase material; background florescence from impurities in the cuvettes and reagents, optics and fluorescence. 9 A fluoroimmunoassay incorporating europium which is a chelate of a rare earth metal, along with good filters and time-resolved excitation and detection achieves sensitivities in comparison to radioimmunoassay. 36
Colorimetric ELISAs have an additional step to detect enzyme activity which prolongs the test, adds to the cost, complexity and imprecision. Furthermore, improved sensitivity resulting from amplification due to enzymes also magnifies any error and small changes in temperature greatly influences enzyme activity.37,38
In colorimetry, light absorbed by the sample is directly related to the concentration of the analyte (the Beer-Lambert law) and involves comparison of the sample beam with the reference. The intensity of fluorescence emission is not only dependent on extinction coefficient (capacity for light absorption at specific wavelength) but on quantum yield (number of fluorescence photons emitted per excitation photon absorbed) and to the intensity of the incident light, and fluorimetry sample is detected against a zero background.9,39
Additionally, fluorescent assay is amenable to automation.fRBP had an intra-assay CV of <6% between 15 and 323 µg/L, an inter-assay CVs of <8% using controls between 3.8 and 107 µg/L and a wider analytical range in comparison to pRBP assay. fRBP was linear on dilution within the analytical range using samples from patients with glomerular and tubular proteinuria in contrast to the mRBP assay hence as suitable assay for patients with tubular proteinuria. The combination assay with fluorescence detection proved more discriminatory than a purely monoclonal system especially in patients with significant proteinuria and had advantages of better linearity on dilution and wider analytical range than the existing pRBP assay while maintaining good sensitivity.
Correlation between fRBP and pRBP was very good; Mann-Whitney test revealed no significant difference in the medians of the two tests. Since the number of healthy volunteers was small in the fRBP group, it was not practical to calculate a reference range. Bias between fRBP and pRBP as shown in Bland-Altman analysis was small and clinically not significant; hence, the pRBP reference range was used.
Time duration to run fRBP assay was less than mRBP, which is an added advantage.
Further work is required to check the feasibility of producing the fRBP assay in kit form for other researchers to use and suitability to automate the assay for bigger patient groups within clinical laboratories.
Conclusions
mRBP assay has the advantages of better linearity on dilution and wider analytical range over pRBP. However, it is limited by poor signal in the patients with albuminuria and glomerular proteinuria and inferior discrimination between patient groups. The development of improved RBP assays would be of great benefit, but care must be taken in precisely identifying the antigen recognized by the antibodies used. Urine RBP in patients with glomerular proteinuria may be significantly underestimated in a sandwich monoclonal antibody assay.
The combination assay with fluorescence detection (fRBP) proved more discriminatory than a purely monoclonal system especially in patients with significant proteinuria and has advantages of better linearity on dilution and wider analytical range than the existing pRBP assay. fRBP compared extremely well with pRBP while maintaining a good sensitivity.
Footnotes
Acknowledgements
I would like to thank South West Thames Institute for Renal Research for funding, scientific, technical resources and providing laboratory facilities where all the analytical work was done; and BBI Solutions for providing of purified urine proteins.
Declaration of conflicting interests
The author(s) declared no potential conflicts of interest with respect to the research, authorship, and/or publication of this article.
Funding
The author(s) disclosed receipt of the following financial support for the research, authorship, and/or publication of this article: This work was supported by the South West Thames Institute for Renal Research and Department of Clinical Biochemistry, Epsom and St Helier Hospitals NHS Trust- Chemical Pathology Research Fund, reference number 91940.
Ethical approval
Ethics permission was granted from the NRES Committee East Midlands - Nottingham 2 (REC reference: 13/EM/0142).
Guarantor
MD.
Contributorship
All authors have made substantial contributions to all of the following: (1) the conception and design of the study, or acquisition of data, or analysis and interpretation of data, (2) drafting the article or revising it critically for important intellectual content, (3) final approval of the version to be submitted.