
Abstract
Background
Methylmalonic acid (MMA) can detect functional vitamin B12 deficiencies as it accumulates early when intracellular deficits arise. However, impaired clearance of MMA from blood due to decreased glomerular filtration rate (eGFR) also results in elevated plasma MMA concentrations. Alternative to clinical trials, a data mining approach was chosen to quantify and compensate for the effect of decreased eGFR on MMA concentration.
Methods
Comprehensive data on patient’s vitamin B12, eGFR and MMA concentrations were collected (n = 2906). The relationship between vitamin B12, renal function (eGFR) and MMA was modelled using weighted multiple linear regression. The obtained model was used to estimate the influence of decreased eGFR on MMA. Clinical impact was examined by comparing the number of patients labelled vitamin B12 deficient with and without adjustment in MMA.
Results
Adjusting measured MMA concentrations for eGFR in the group of patients with low-normal vitamin B12 concentrations (90–300 pmol/L) showed that the use of unadjusted MMA concentrations overestimates vitamin B12 deficiency by 40%.
Conclusions
Through a data mining approach, the influence of eGFR on the relation between MMA and vitamin B12 can be quantified and used to correct the measured MMA concentration for decreased eGFR. Especially in the elderly, eGFR-based correction of MMA may prevent over-diagnosis of vitamin B12 deficiency and corresponding treatment.
Introduction
Vitamin B12 deficiency is a worldwide public health issue which can result in various haematological and neurological disorders.1,2 Lack of vitamin B12 can result from insufficient intake or malabsorption of the vitamin due to gastrointestinal conditions.1–3 Until a significant vitamin B12 deficiency is developed in the tissue, patients often remain asymptomatic. Prevalence of vitamin B12 deficiency increases with age, but numbers vary widely due to differences in population samples and the use of different criteria.2,3 Usually, vitamin B12 concentrations in serum are measured to identify vitamin B12 deficiency. However, serum concentrations of vitamin B12 are a poor predictor of functional vitamin B12 deficiency as they correlate poorly with the bioavailable intracellular vitamin B12 content.1–5 Although multiple guidelines suggest that serum vitamin B12 concentrations below 140 pmol/L reflect a vitamin B12 deficiency, latent deficiencies could be present with serum concentrations between 140 and 300 pmol/L.6–8 Conversely, functional deficiencies could be absent with serum vitamin B12 concentrations between 90 and 140 pmol/L.8,9 Although it is difficult to diagnose vitamin B12 deficiencies, treatment should not be initiated too late as neurological manifestations may be irreversible.
Other methods to measure vitamin B12, either active or total, exist. For example, holotranscobalamin (holoTC) has been reported to represent the metabolically active fraction of vitamin B12. However, circulating active holoTC not necessarily reflects vitamin B12 function in the tissue.2–4,7,10 Measuring metabolites that accumulate due to deficiency of vitamin B12 in tissues overcomes this issue. For example, both homocysteine (HCy) and methylmalonic acid (MMA) accumulate in case of vitamin B12 deficiency. However, HCy is not specific to vitamin B12, as it is influenced by many other factors. Unlike HCy, MMA is a specific biomarker for vitamin B12. Although being financially less attractive due to relatively high running costs, MMA is adopted in the diagnostic process as an additional biomarker of choice when total vitamin B12 measurements give indeterminate results.10,11
Measurement of MMA was introduced to improve diagnosing vitamin B12 deficiencies, especially in the ‘grey-zone’ of serum vitamin B12 concentrations between 90 and 300 pmol/L. MMA can detect functional vitamin B12 deficiencies as it accumulates when intracellular availability of vitamin B12 is insufficient.1–7,11,12 In addition, MMA concentrations increase relatively early in the course of vitamin B12 deficiency, i.e. when the serum vitamin B12 concentration falls below 400 pmol/L, MMA concentration starts to increase. 13 This vitamin B12-related effect makes MMA a sensitive metabolic marker for functional vitamin B12 deficiencies. It is known that other, vitamin B12-unrelated factors like renal failure result in an increase in MMA concentrations.3,5,7,12–16 These vitamin B12-unrelated factors increasing circulating concentrations of MMA result in overestimation of number of diagnoses of vitamin B12 deficiency. Therefore, if renal function is normal and methylmalonic aciduria is absent, MMA can be considered as best mimic of ‘gold standard’ marker to monitor functional vitamin B12 status. The age-related decline in renal function may particularly compromise the use of MMA for the assessment of vitamin B12 status in the elderly. Using increased MMA concentrations as criterion for vitamin B12 deficiency without adjustment for renal function may lead to overdiagnosis and unnecessary treatment when a uniform MMA cut-off level is used. Thus, to determine if a vitamin B12 deficiency is present based on MMA serum concentration measurements, it is evident that vitamin B12-unrelated factors influencing MMA concentrations have to be taken into account.
The most described vitamin B12-unrelated factor influencing the interpretation of observed MMA concentrations is renal function. However, the effect of renal function on MMA has never been quantified so that it can be applied to improve the diagnosis of vitamin B12 deficiency. In this study, the effect of renal function on MMA concentration is quantified with the aim to adjust measured MMA serum concentrations for a decrease in renal function. As a suitable alternative to a clinical trial, a data mining approach was chosen. In our hospital, hundreds of MMA measurements are performed annually. Using comprehensive MMA measurements accompanied with serum vitamin B12 and creatinine concentrations, we were able to build a three-dimensional model. Renal function is implemented by estimating the glomerular filtration rate (eGFR), combining previous identified influential variables creatinine concentration, age and gender.13,17 The obtained model is used to estimate the adjustment in MMA under the influence of decreased eGFR. This adjustment is assumed to be independent of the observed concentration of MMA, i.e. when measured concentrations of vitamin B12 and eGFR are similar, both an measured MMA of 400 nmol/L and of 670 nmol/L receive an equal correction. The clinical impact of correcting MMA concentrations for eGFR is reflected in the proportion of patients currently being diagnosed of being vitamin B12 deficient but who potentially are not vitamin B12 deficient according to the eGFR-corrected MMA concentrations and a uniform MMA cut-off level.
Materials and methods
Data
Routine patient care data were retrospectively collected from patients referred to the laboratory (Catharina Hospital Eindhoven, the Netherlands) for assessment of vitamin B12 status. The data-set consists of measurements in adult patients (age ⩾18 years), i.e. serum vitamin B12, plasma creatinine (both Cobas 8000, Roche DX) and plasma MMA (UPLC-MS/MS Xevo TQ-S, Waters) 9 concentrations, performed in the period from July 2010 up till and including April 2016. Of each patient, only the first measurement of vitamin B12 in time was included because having multiple measurements of vitamin B12 is suspicious for vitamin B12 supplementation which is confounding the studied effect.
At our laboratory, the lower reference concentration of vitamin B12 is 140 pmol/L. However, patients with vitamin B12 concentrations below 140 pmol/L are not necessarily vitamin B12 deficient because the sensitivity at this level is maximal at 90%. 18 Using a lower cut-off value for vitamin B12 will decrease the number of falsely diagnosed vitamin B12 deficiencies. Below a concentration of 90 pmol/L, this number of false diagnoses is negligible (based on internal analysis). Conversely, in patients with vitamin B12 concentrations above 300 pmol/L, vitamin B12 deficiency can be excluded with maximal probability. In the intermediate range of vitamin B12 concentrations of 90–300 pmol/L, vitamin B12 itself is not a perfect indicator of functional vitamin B12 deficiency. Therefore, in this range, an additional measurement of MMA serum concentration is performed (reflex test), where MMA concentrations above 430 nmol/L indicate vitamin B12 deficiency.9,19 The outcome of this two-step algorithm will in this paper be considered as routine diagnostic algorithm (RDA). Although extreme vitamin B12 and MMA concentrations beyond the measuring range, i.e. vitamin B12 <22 and >1475 pmol/L and MMA <100 and >1500 nmol/L, are informative with respect to the presence or absence of vitamin B12 deficiency, these measurements were excluded from our analysis as the model for determining the MMA correction for individual patients could not handle data beyond the measuring range.
Renal function can be described by the estimated glomerular filtration rate (eGFR). In this study, eGFR values were calculated according to the chronic kidney disease epidemiology collaboration (CKD-EPI) formula, using creatinine serum concentration, gender and age as input variables. The CKD-EPI formula is not validated for estimates of GFR in the region >90 mL/min/1.73 m2, where values calculated by the CKD-EPI equation vary up to 30 mL/min/1.73 m2 compared with measured GFR. 17 Nevertheless, values of eGFR >90 mL/min/1.73 m2 were included upon modelling to anchor the fitted plane in the region of normal renal function. As the variance in calculating eGFR by CKD-EPI results in both overestimated as well as underestimated renal function, the use of 2906 patients to create our model will average out this effect. Because not all biomarkers are always ordered at the same time, eGFR values were only included when measured within 90 days before or after the vitamin B12 measurement. For MMA concentrations, the window of inclusion was within 14 days after the vitamin B12 measurement. The resulting data-set consisted of 2906 records of combined vitamin B12, MMA and eGFR measurements.
Model building
The data-set was divided into a training set and a test set by a 25% stratified holdout. The training set (n = 2180) was used in a 10-fold stratified cross-validation in order to build models on 10 different subsets of the data. The test set was used for validation of the developed model (n = 726). A second degree polynomial surface was fit using a weighted linear least-squares regression method on logarithmically transformed training data. The weight put on each data point was determined by combined assessment of data density and eGFR concentration, putting more weight to data points with lower frequency and upon decreasing eGFR. With respect to data density, the training data were two-dimensionally binned in bins of size 25 pmol/L for vitamin B12 in the range of 50 to 600 (n = 23) and of size 5 mL/min/1.73 m2 for eGFR in the range 20 to 145 (n = 26). The weight factor was determined by the inverse of the number of data points per bin multiplied by the inverse of eGFR concentration of each bin.
Model building was repeated 10 times using a different combination of nine sets for fitting and remaining set for testing upon each fold. The mean of each coefficient of each of the 10 obtained models was used to define the final model. The standard deviation of the final model was determined by the variance in predicted MMA values by each of the 10 models. The final model was validated by comparing MMA concentrations predicted by the model with the measured MMA concentrations in the unseen test set data (n = 726). The quality of the model was assessed by calculating the mean absolute error (MAE).
Clinical relevance
The first order partial derivative in eGFR of the obtained model was used to determine the concentration of eGFR where a decrease in renal function starts to have effect on MMA. This threshold level was used to calculate the difference in MMA concentration due to decreased eGFR. The correction in MMA was given by subtracting the MMA predicted with eGFR at threshold level from the predicted MMA using the measured eGFR. Under the assumption that the effect of renal function on MMA is similar in patients with similar vitamin B12 concentrations, this correction in MMA was applied for all patients in the total data-set. The improvement potential of the model was determined by comparing the number of diagnoses of vitamin B12 deficiency based on the current reference value for MMA used at the Catharina hospital, i.e. concentrations above 430 nmol/L are taken as proof of vitamin B12 deficiency, with the number of diagnoses after adjusting MMA by the model.
Statistical analysis
Data were retrospectively collected, preprocessed, and analysed. Two-sided two-sample Wilcoxon Rank Sum test with continuity correction was used to compare differences in baseline characteristics. Association between vitamin B12, eGFR and MMA were tested through a partial linear correlation analysis using Spearman correlation. Data analysis and modelling were performed using MATLAB (version R2016b, MathWorks) and R (version 3.4.1, The R Foundation for Statistical Computing). 20
Results
Exploratory data analysis
The mean age of the population in the total data-set was 49.8 years, of which 68.3% was female and 9.7% was vitamin B12 deficient (Table 1). Plotting the raw data revealed high variance in MMA concentrations for equal concentrations of vitamin B12 or eGFR (Figure 1 and Supplemental Figure 1). Also, data were inhomogeneously distributed over variables’ ranges, i.e. less data points upon lower eGFR. However, the expected relations between vitamin B12 and MMA and also between eGFR and MMA were observed. Partial linear correlation analysis revealed moderate correlations between both vitamin B12–MMA and eGFR–MMA (Spearman correlation coefficients [ρ] of, respectively, −0.29 [P < 0.0001] and −0.36 [P < 0.0001]). In addition, a weaker correlation was observed between vitamin B12–eGFR (ρ = −0.11 [P < 0.0001]). The observed correlation between elevated vitamin B12 concentrations and reduced eGFR (<60 mL/min/1.73 m2) has not been well studied, and the mechanism remains unclear.21,22 Although the observed correlation was weak, this interaction could not be ignored within our model.
Population characteristics.
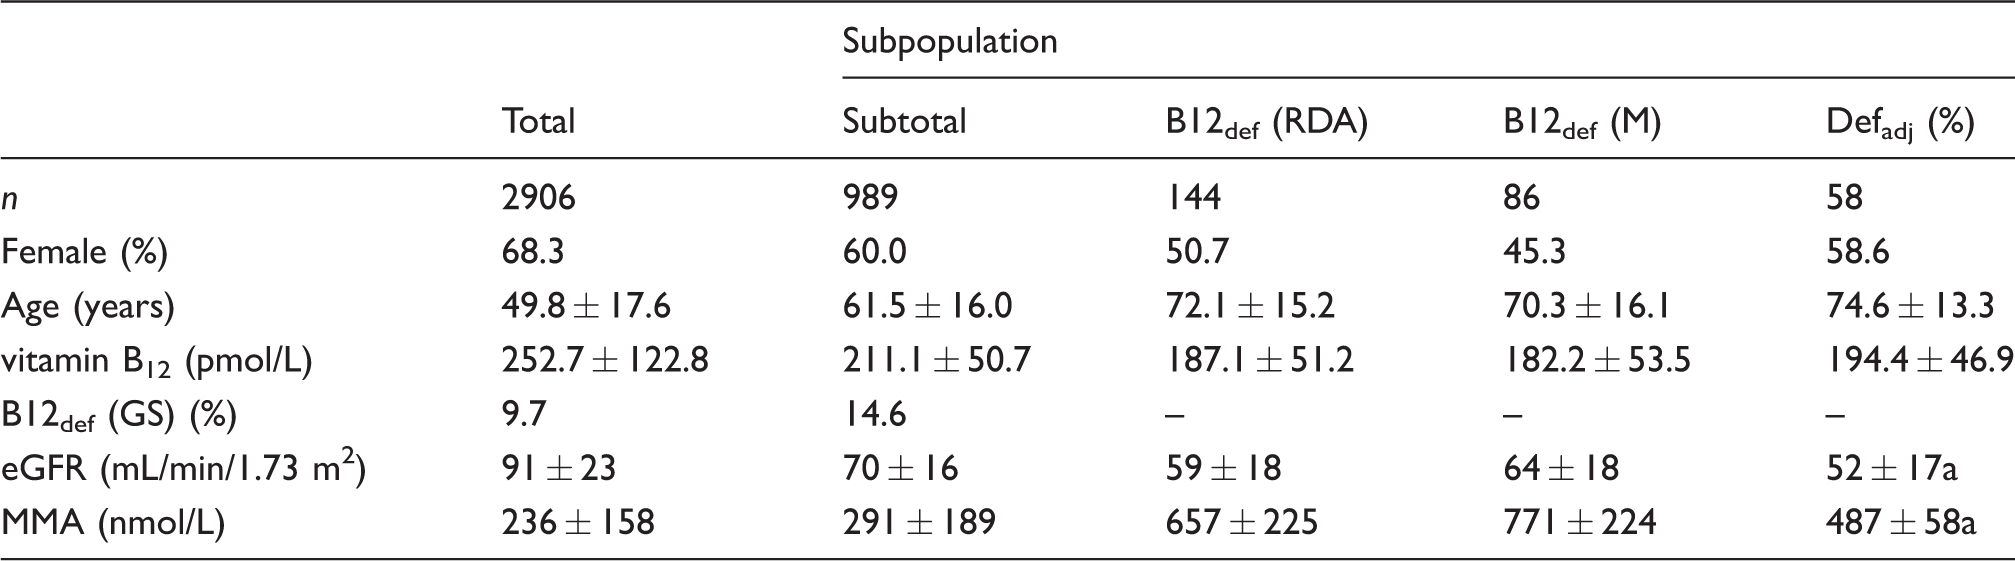
Note: Population characteristics of the total population and of the subpopulation with vitamin B12 concentration within laboratory reflex test range (90–300 pmol/L) and eGFR <90 mL/min/1.73 m2. Shown are mean ± standard deviation.
MMA: methylmalonic acid; eGFR: glomerular filtration rate; B12def (RDA): vitamin B12-deficient patients based on routine diagnostic algorithm (RDA), B12def (M): vitamin B12-deficient patients based on model, Defadj: patients where diagnosis of vitamin B12 deficiency could be adjusted based on the model.
aSignificant differences between Defadj and B12def (M) population (P <0.01).
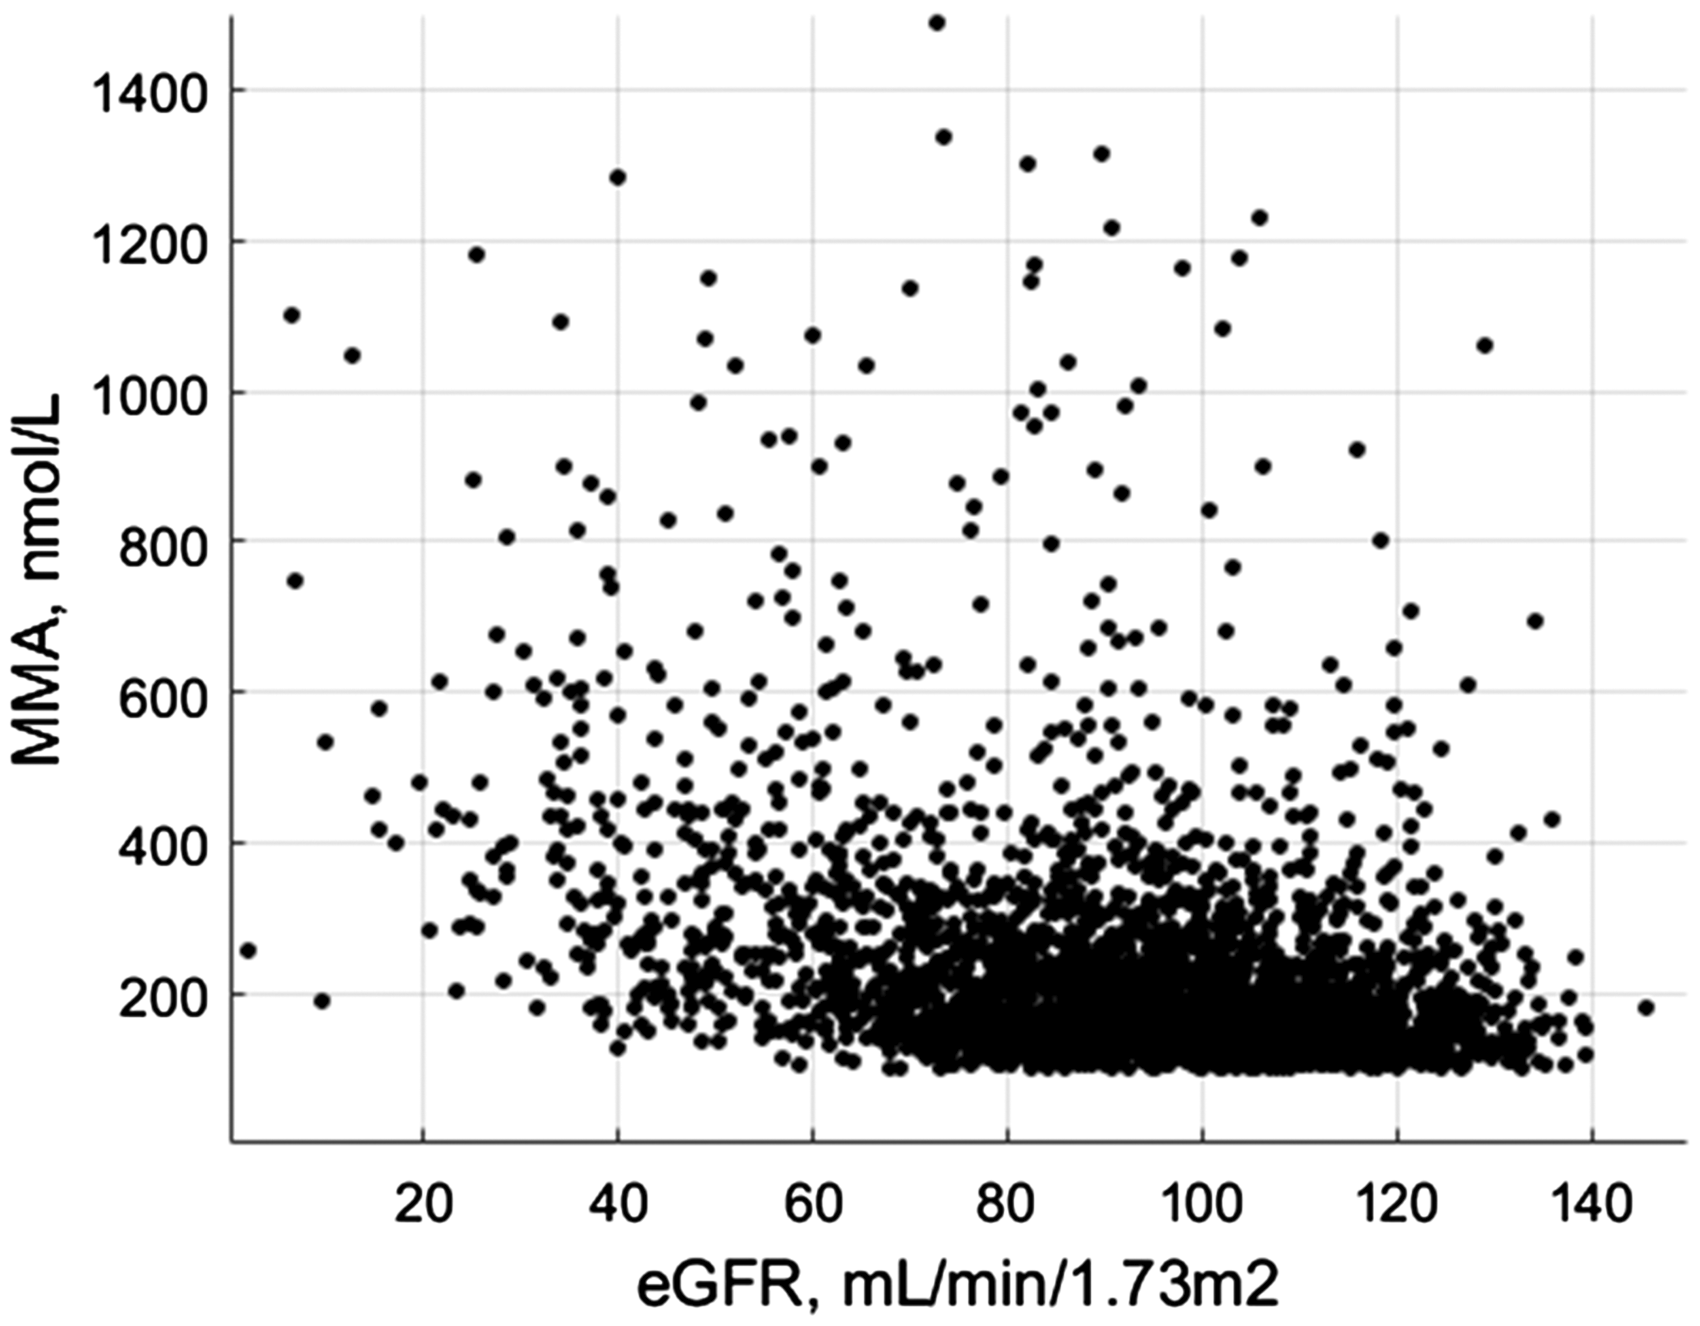
Data distribution eGFR and MMA. MMA data points (n=2906) plotted against eGFR, showing the relation of eGFR with MMA. The plot displays high variance in data density in both dimensions.
Model
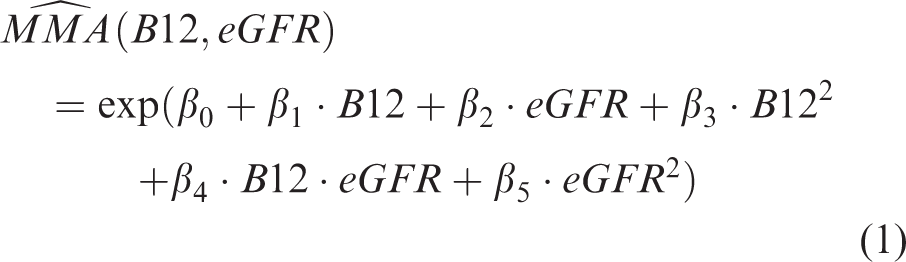
The inhomogeneity in data-density was quantified by binning the data in two dimensions and counting the number of data points per bin (Supplemental Figure 2). This quantification showed a relatively high frequency of data points in the area of normal eGFR (>90 mL/min/1.73 m2) and vitamin B12 reflex testing (90–300 pmol/L). Each data point was assigned a weight factor based on the number of data points in its bin and corresponding eGFR concentration. The final obtained model was defined as the average of 10 models obtained through 10-fold stratified cross-validation on the training set. The model describing the relation between vitamin B12, eGFR and MMA is given by the following formula
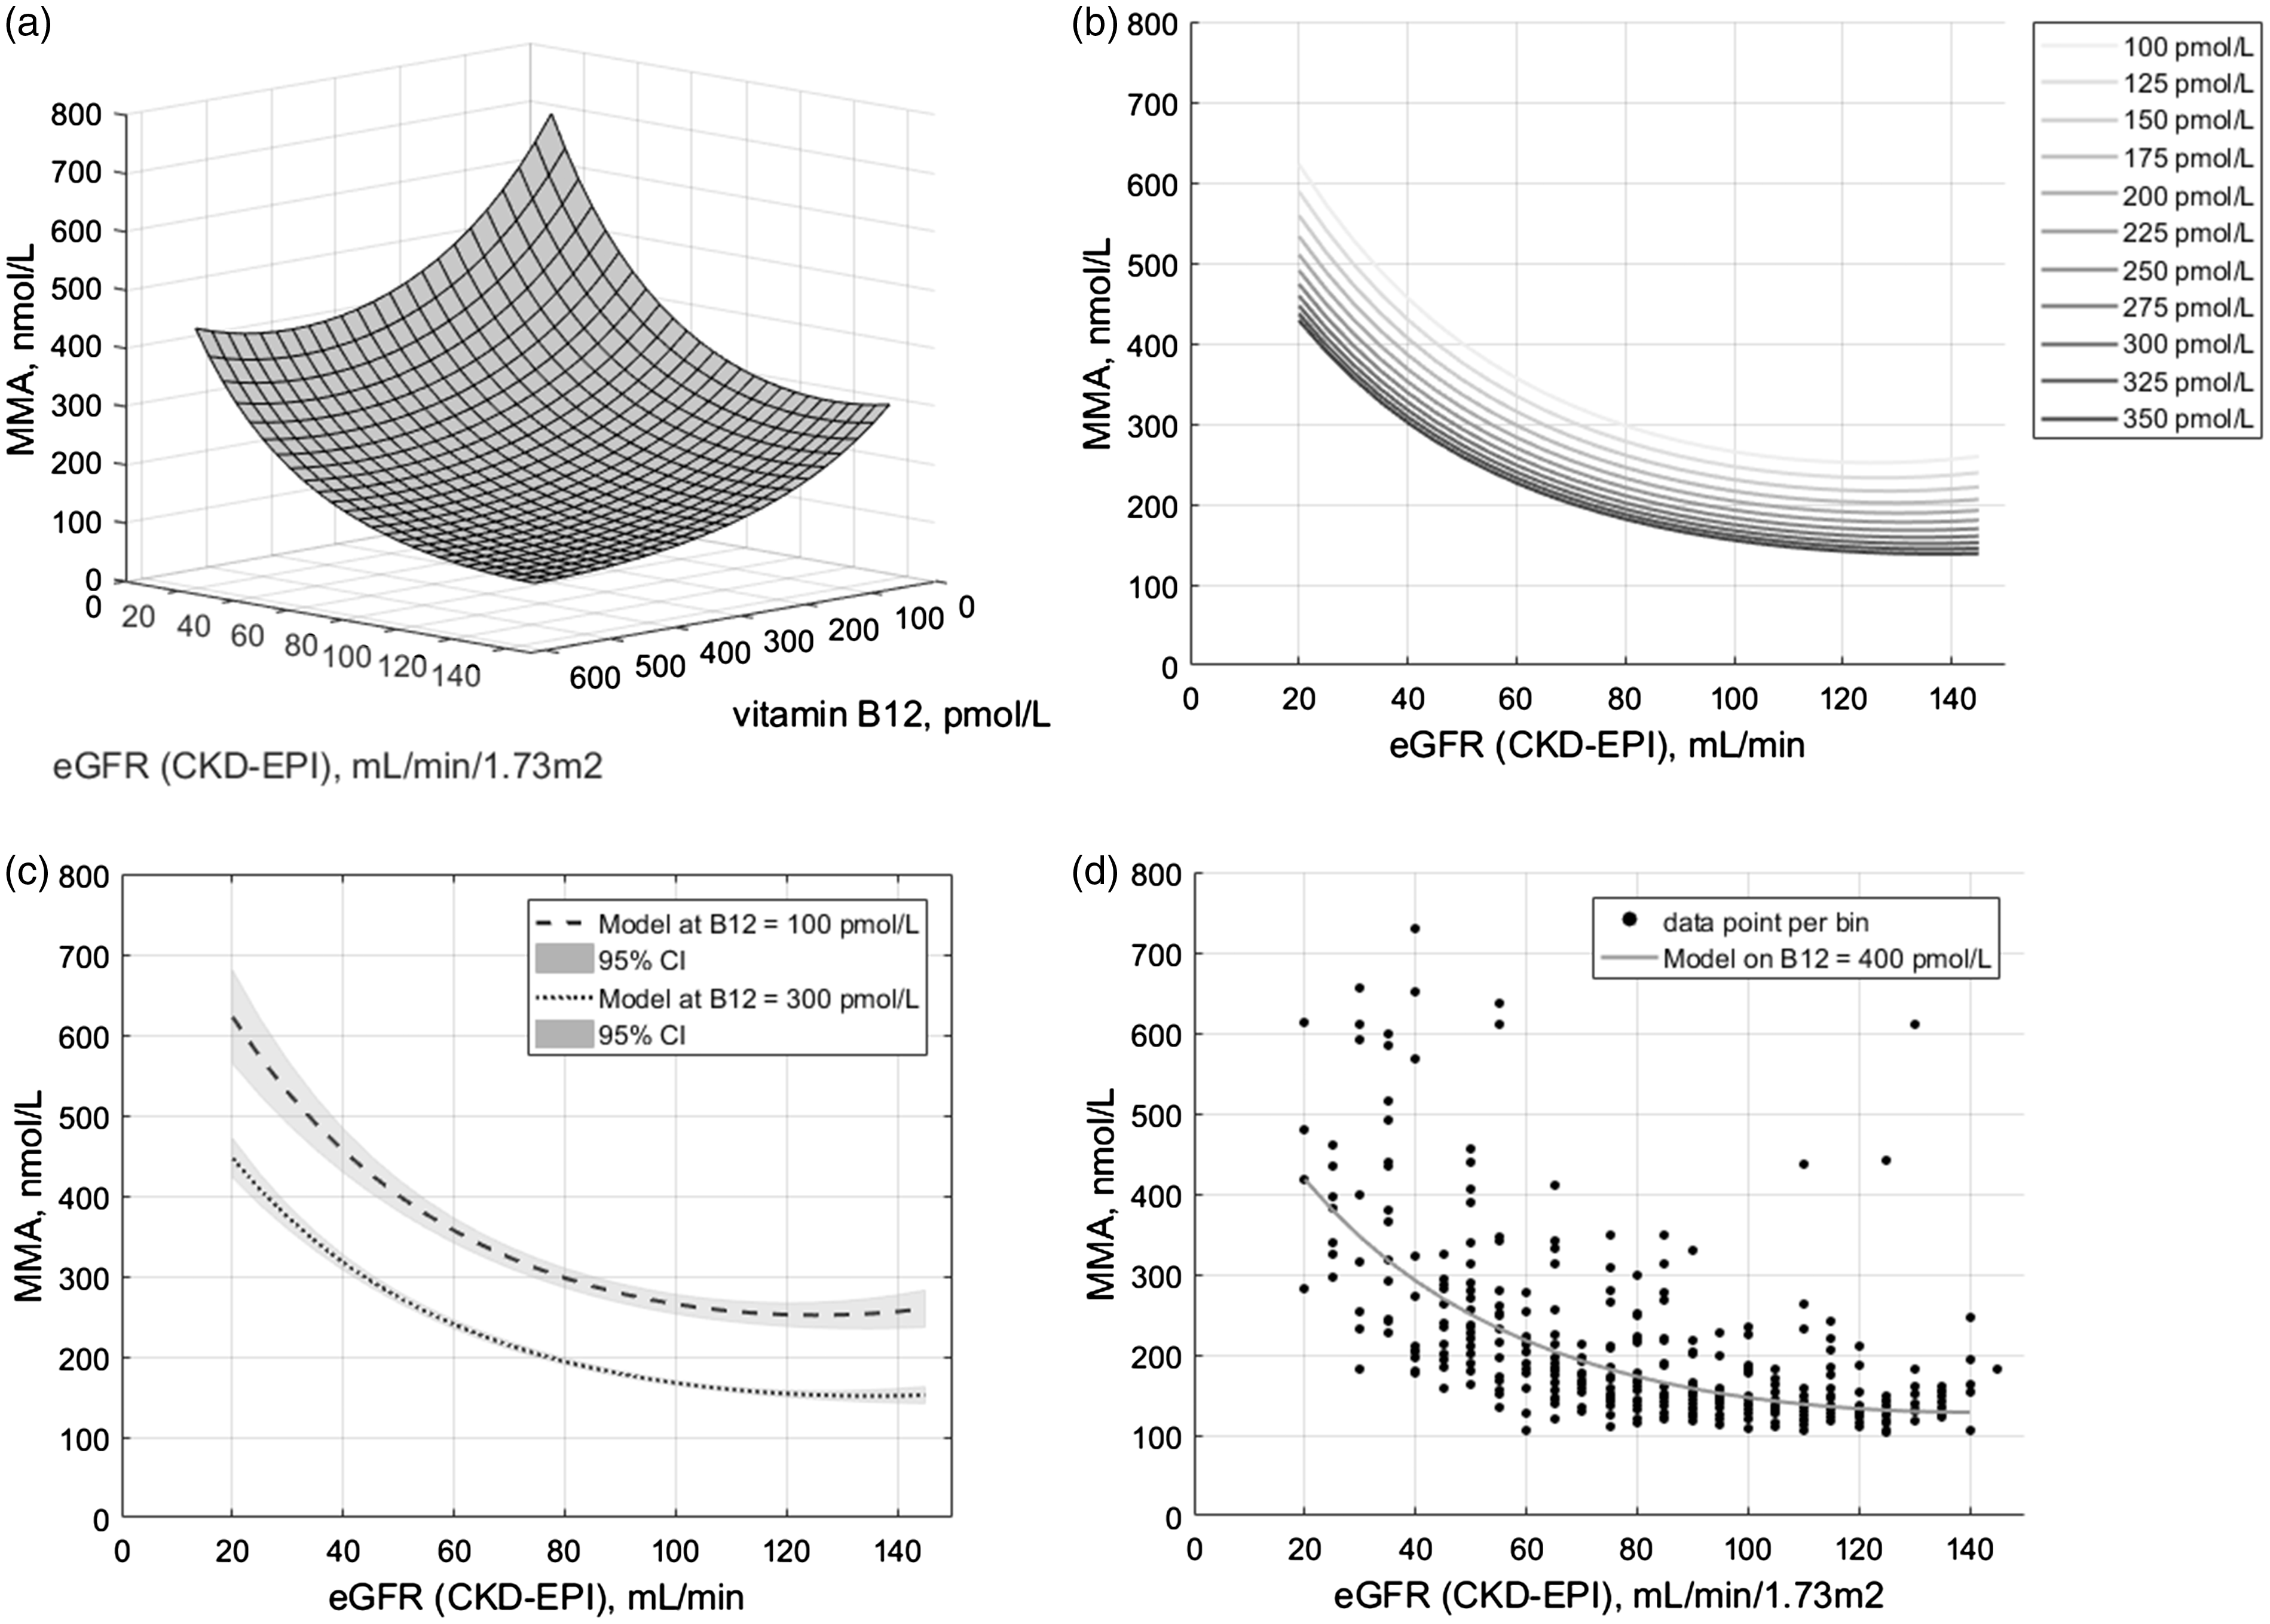
Model. (a) 3D representation of the model plotted against vitamin B12 and eGFR, showing a curved plane (mean adjusted R2 0.46 ± 0.024 (2SD)). (b) 2D representation of the model, plotted against eGFR at different concentrations of vitamin B12. (c) 95% confidence interval (CI) at different concentrations of vitamin B12 plotted against eGFR. (d) Isolated effect of renal function on MMA plotted together with binned data of only vitamin B12 non-deficient patients, i.e. vitamin B12 >300 pmol/L (n=392). This representation showed the model is in agreement with the data (MAE = 58 nmol/L).
Displaying the model in 3D resulted in a plane curved in two directions (Figure 2(a)). Plotting of the model against eGFR in 2D resulted in parallel lines for different concentrations of vitamin B12 (Figure 2(b)). The uncertainty of the model’s prediction was determined by the variance in predicted MMA values by each of the 10 models. The variance in MMA prediction was dependent on both vitamin B12 and eGFR (Figure 2(c)). Maximal variance in predicted MMA over the 10 models was 58 nmol/L (2SD) and observed at vitamin B12 concentration of 100 pmol/L and eGFR of 20 mL/min/1.73 m2. Displaying the model in a region where no effect of vitamin B12 deficiency on MMA is expected, e.g. vitamin B12 = 400 pmol/L, showed the isolated effect of renal function on MMA (Figure 2(d)).
Clinical relevance
The eGFR threshold level at which renal function started to affect MMA according to the obtained model was found to be 121 mL/min/1.73 m2. This concentration was used to calculate the adjustment in MMA for decreased eGFR using the model described in Formula (1), which resulted in the following formula
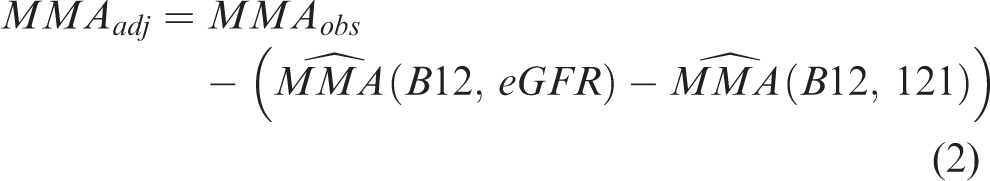
As our model can estimate the effect of eGFR on MMA, we subsequently estimated the clinical impact of our model. In the range of normal renal function, i.e. eGFR >90 mL/min/1.73 m2, the statistical variation (2SD) in the modelled adjustment in MMA appeared larger than the adjustment itself. Therefore, application of our model was restricted to eGFR ⩽90 mL/min/1.73 m2. Formula (2) was applied to the subset of reflex-tested patients, i.e. vitamin B12 concentrations between 90 and 300 pmol/L, with eGFR concentrations within the relevant range between 20 and 90 mL/min/1.73 m2 (n = 989). The number of vitamin B12 deficiencies based on measured MMA values could be reduced by 40% through correcting MMA for renal function (Table 2). This resulted in an altered diagnosis of vitamin B12 deficiency in 5.9% of all the patients within the relevant subset (Table 2). Subanalysis showed that the patients with adjusted diagnosis had significantly lower eGFR compared with the deficient patients according to the RDA (Table 1).
Contingency table vitamin B12 deficiencies.
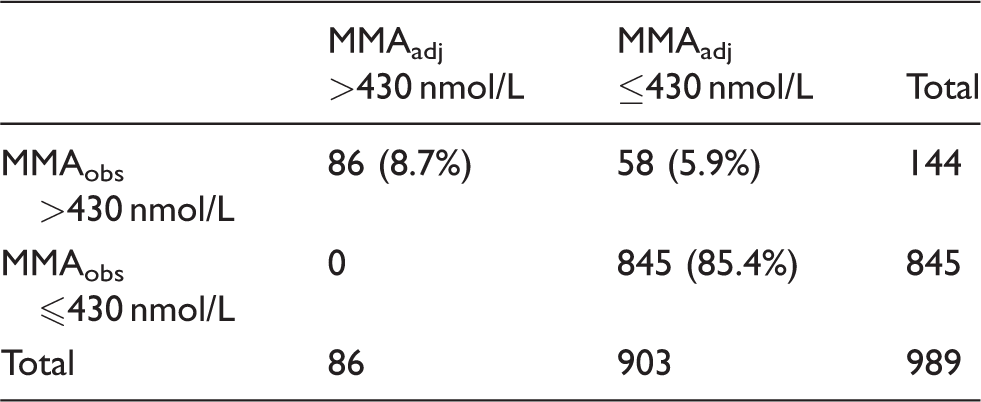
Note: Frequency distribution (and percentage) of vitamin B12 deficiencies based on observed and adjusted MMA values (respectively MMAobs and MMAadj) in the subpopulation with vitamin B12 concentrations in the reflex test range (i.e. 90–300 pmol/L) and with eGFR between 20 and 90 mL/min/1.73 m2.
MMA: methylmalonic acid; eGFR: estimated glomerular filtration rate.
Discussion
Upon use of MMA in the assessment of vitamin B12 status, renal function must be taken into account as vitamin B12-unrelated factor influencing MMA concentrations. In this study, the influence of eGFR on the relation between MMA and vitamin B12 concentrations has been quantified through a data mining approach using a ‘big data’ set of 2906 patients. This model can be used to adjust observed MMA plasma concentrations for eGFR in individual patients when eGFR is between 20 and 90 mL/min/1.73 m2. Application of our model revealed that 40% of the patients previously diagnosed with vitamin B12 deficiency according to the RDA could be revised as non-deficient. In these patients, the increase in MMA was most likely caused by vitamin B12-unrelated factors, so one can assume that treatment with intramuscular vitamin B12 injections might not be necessary. This finding confirms the clinical relevance of taking into account renal function upon evaluation of MMA.
The CKD-EPI formula has a relatively large uncertainty in eGFR, also below 90 mL/min/1.73 m2, but it is widely used in clinical practice, e.g. in calculating dosage for medication or contrast media.23,24 As the variance in eGFR is resulting in both overestimated as well as underestimated renal function, 16 the large number of patients used in our approach will average out this effect. Especially in the elderly, overdiagnosis of vitamin B12 deficiency could be reduced by using the proposed model. Although the CKD-EPI formula has not been validated for subjects >70 years of age and eGFR is likely to be overestimated in this population, the proposed correction of MMA using an overestimated eGFR will even result in an underestimated adjusted MMA. Fulfilling the need for an eGFR validated in the elderly will increase the added value of our model in the elderly.
According to our model, MMA concentrations were already starting to increase at vitamin B12 concentrations of 400 pmol/L. This is in accordance with literature stating MMA as an early detector of vitamin B12 deficiency. 13 A similar pattern was observed with respect to renal function. Where an eGFR of 90 mL/min/1.73 m2 is currently used as the cut-off for normal renal function, 17 our analysis showed increasing MMA concentrations starting at eGFR of 121 mL/min/1.73 m2 (Figure 2). This emphasizes the relevance of taking into account renal function upon assessment of MMA concentrations in diagnosing vitamin B12 deficiency.
Some limitations of this work need to be addressed. Firstly, other factors also influencing MMA concentrations, e.g. dehydration, bacterial overgrowth and antibiotic treatment, were not included.2,9,13 Secondly, a true gold standard for diagnosing functional vitamin B12 deficiency which is really independent of renal function is not easily available. Even the classical Schilling test, which is relying on the urinary excretion of radiolabeled vitamin B12, does not meet this criterion.4,6 Thirdly, the combined order of vitamin B12, creatinine and MMA is not standard, so this may have resulted in a selection bias in creating the data-set. However, by allowing for a certain time window between measurements, assuming the patient’s condition remained constant in this period, this bias is partially being compensated. Nonetheless, correction of MMA for renal function could not be performed for 13% of the patients having a vitamin B12 measurement in combination with MMA due to missing eGFR.
Analysis of baseline characteristics between patients included in our data-set (n = 2906) and all patients having a vitamin B12 measurement (n = 34,702) in the same period showed significant differences in age (mean of, respectively, 49.8 vs. 56.1 years, P < 0.01) and gender (% female of, respectively, 68 vs. 62, P < 0.01). These differences can largely be explained by the relatively high proportion of morbid obese patients in the data-set who were eligible for bariatric surgery and having routine combined measurements of vitamin B12, creatinine and MMA prior to surgery. The Catharina hospital has a high-volume bariatric centre, where patients are monitored with extensive laboratory panels prior and after surgery, including biomarkers vitamin B12, creatinine and MMA. Recipients of bariatric surgery are at risk of developing vitamin B12 deficiency due to reduced food intake and limited absorption potential.1,3,9 Therefore, their nutrient status is monitored closely. This resulted in an overrepresentation of data within the limits of reflex testing, i.e. vitamin B12 concentrations of 90–300 pmol/L, and of data of patients with eGFR >90 mL/min/1.73 m2. Upon fitting the regression model, this has been accounted for by weighing the data points. Although our data-set includes less than 10% of all patients who were measured at the laboratory during that period, the physiology of the effect of renal function on MMA is assumed to be sufficiently represented.
Diagnosing vitamin B12 deficiency is not without difficulty; even a positive response to therapy is no absolute proof. 19 Supplementation itself, regardless of the actual vitamin B12 status, has been shown to improve clinical symptoms related to vitamin B12 deficiency, such as fatigue in extreme or milder form, tingling or prickly fingers and reduced attention span. 9 Given the limitations of current testing for vitamin B12 deficiency and because its administration is inexpensive and fairly innocent, many clinicians have a low threshold for prescribing vitamin B12 supplementation, usually by intramuscular injection to bypass issues with absorption.4,12 However, this approach may give a false sense of effective medical intervention for both the patient and provider. 12 This also makes it difficult to validate diagnosis algorithms, including the model presented in this work. Because no data on intracellular vitamin B12 concentrations indicating true deficiency or not were available, it could not be checked if reclassified patients, i.e. from vitamin B12 deficient to sufficient, indeed were not deficient. In addition, the reported number of potentially saved treatments for vitamin B12 deficiency could be overestimated, as upon interpretation of these laboratory results, our clinical chemists already were advising physicians to be precautious upon diagnosing the patient being truly vitamin B12 deficient.
Future research should focus on implementing and validating our proposed model in a prospective clinical trial using objective outcome measures of vitamin B12 deficiency. In addition, the generalizability of the model should be investigated as it is currently based on the Catharina hospital patient population and laboratory equipment. Our data-driven approach to improve diagnosis of vitamin B12 deficiency by combining multiple biomarkers has already been performed; however, eGFR was not taken into account.25–27 Other attempts used an inductive approach by applying non-statistical data mining techniques, resulting in less intuitive models as obtained by the deductive statistical approach presented here.28,29
In summary, this study emphasizes the necessity of additional measurement and assessment of renal function upon MMA-based diagnosis of vitamin B12 deficiency. The costs of an additional creatinine measurement are negligible compared with the costs and burden of unnecessary vitamin B12 supplementation. Through a data mining approach, we were able to quantify the influence of eGFR on the relation between MMA and vitamin B12 serum concentrations in order to adjust observed MMA serum concentrations. Especially in the elderly, adding eGFR into the assessment may result in a reduction of overdiagnosis of vitamin B12 deficiency and corresponding treatment. In general, this work illustrates the potential of combining pre-existent laboratory data and applying data-driven decision support tools for personalized (laboratory) medicine, improving diagnostic test utilization and supporting clinical decision-making.
Supplemental Material
Supplemental material for Improved testing for vitamin B12 deficiency: correcting MMA for eGFR reduces the number of patients classified as vitamin B12 deficient
Supplemental material for Improved testing for vitamin B12 deficiency: correcting MMA for eGFR reduces the number of patients classified as vitamin B12 deficient by Saskia LM van Loon, Anna M Wilbik, Uzay Kaymak, Edwin R van den Heuvel, Volkher Scharnhorst and Arjen-Kars Boer in Annals of Clinical Biochemistry
Footnotes
Declaration of conflicting interests
The author(s) declared no potential conflicts of interest with respect to the research, authorship, and/or publication of this article.
Funding
The author(s) received no financial support for the research, authorship, and/or publication of this article.
Ethical approval
Not applicable.
Guarantor
AB.
Contributorship
SL and AB initialized the study. SL researched literature, collected and analysed the data, and wrote the first draft of the manuscript. AB, AW, UK and EH were involved in data analysis and model development. All authors reviewed and edited the manuscript and approved the final version of the manuscript.
References
Supplementary Material
Please find the following supplemental material available below.
For Open Access articles published under a Creative Commons License, all supplemental material carries the same license as the article it is associated with.
For non-Open Access articles published, all supplemental material carries a non-exclusive license, and permission requests for re-use of supplemental material or any part of supplemental material shall be sent directly to the copyright owner as specified in the copyright notice associated with the article.