
Abstract
Background
Proglucagon-derived hormones represent a family of peptides mainly produced in the pancreas and the intestine. While several proglucagon-derived peptides play key roles in metabolic diseases, little is known about glicentin. The aim of the present study was to investigate serum glicentin concentrations in individuals with adult obesity and to study its potential link with various metabolic parameters.
Methods
Fifty-two individuals with normal body mass index (BMI < 25 kg/m2) and 39 patients with severe or morbid obesity (BMI > 35 kg/m2) were prospectively included at the University Hospital of Nice between January 2014 and April 2016. Clinical data were recorded, and a fasting blood sample was collected to measure glicentin, glucose, insulin, C-peptide, total cholesterol, triglyceride, LDL and HDL-cholesterol. In addition, a homeostasis model assessment for insulin resistance (HOMA2-IR) was also calculated.
Results
Patients with severe and morbid obesity had significantly higher plasma glucose, together with higher serum concentrations of insulin, C-peptide, HOMA2-IR, triglyceride, LDL-cholesterol and lower serum concentrations of HDL-cholesterol compared with individuals with a normal body mass index. The obese patients displayed significantly lower fasting serum concentrations of glicentin compared with subjects with a normal body mass index (12 pmol/L vs. 24 pmol/L, P < 0.0001). In the total population, fasting glicentin concentrations did not correlate with BMI, glycaemic parameters (glucose, insulin, C-peptide, HOMA-IR) or lipid parameters (total cholesterol, triglyceride, LDL and HDL-cholesterol).
Conclusion
To the best of our knowledge, this is the first study reporting serum glicentin concentrations in healthy lean and obese adult subjects. We found that fasting serum glicentin concentrations are decreased in patients with severe or morbid obesity suggesting the potential interest of this peptide in obesity and metabolic-related disorders.
Introduction
Obesity represents a leading cause of morbidity and mortality and has become a worldwide public health concern. 1 The disease is often associated with metabolic disorders which contribute to the development of severe complications such as cardiovascular diseases. 2
The metabolic alterations observed during obesity are thought to be, at least partly, due to dysfunction of hormones involved in metabolism, appetite regulation or energy expenditure. Among them, proglucagon-derived hormones have been identified to play major roles in glucose homeostasis, food intake and intestinal physiology.3,4 The proglucagon is produced by the alpha pancreatic cells as well as by the L intestinal cells and its maturation differs between the two organs. In the pancreas, proglucagon cleavage leads to the synthesis of glucagon. In the intestine, the main proglucagon-derived peptides include glucagon like peptide 1 (GLP-1), GLP-2, oxyntomodulin and glicentin.3,4
While the physiological role and implication of GLP-1, GLP-2 or oxyntomodulin in metabolic diseases have been well characterized,3,4 little is known about the role of glicentin in humans. Indeed, although several experimental studies have revealed its potential role in intestinal physiology and glucose homeostasis,3,5,6 few such studies have been published in human subjects. This could be partly attributed to the unavailability of commercialized detection methods until recently. The aim of our study was to investigate serum glicentin concentrations in the context of obesity and to explore whether there was any potential link with various metabolic parameters.
Methods
Population
The population was recruited at the University Hospital of Nice between January 2014 and April 2016 and included patients with severe or morbid obesity. Inclusion criteria were: (1) a body mass index (BMI) > 35 kg/m2; (2) being aged between 18 and 65 years old; (3) a stable weight (±5 kg over a three-month period). Exclusion criteria were defined as the presence of weight fluctuation, type 1 diabetes, or insulin treatment. In parallel, healthy lean subjects with a BMI<25 kg/m2 were recruited, and the same exclusion criteria were applied. The study was approved by the local Ethic Committee of the University Hospital of Nice (reference number DC 2015-2539). Medical history and clinical data were recorded at the day of inclusion.
Biochemical analysis
Blood samples were collected, after an 8 to 12 h fast, in Vacutainer® tubes with serum separator gel and clot activator for all analytes except glucose, in which case, the samples were collected into tubes containing sodium fluoride preservative and anticoagulant. All the analyses were performed in the Clinical Chemistry Laboratory at the University Hospital of Nice, which is certified by the National French Committee of Accreditation. Within 2 h of collection, the samples were centrifuged at room temperature for 15 min at 3000 r/min, and serum samples and plasma were immediately stored at −80℃. Glucose, total cholesterol, HDL-cholesterol, triglyceride, urea and creatinine concentrations were determined by spectrophotometry (Cobas 8000, module 700, Roche Diagnostics, 38240 Meylan, France). Insulin and C-peptide were measured with a sandwich immunoassay using direct chemiluminescent technology (Centaur XP, Siemens Healthineers GmbH, 91052 Erlangen, Germany). For all assays, the results of quality control analyses fell within predefined limits. The homeostasis model assessment 2 (HOMA2) calculator was used to estimate steady state beta cell function (HOMA 2 %B) on the one hand and insulin sensitivity (HOMA2 %S) on the other, using fasting glucose and insulin concentrations. 7 This model takes into account variations in hepatic and peripheral glucose resistance and indirectly estimates insulin resistance (HOMA2-IR). Estimated glomerular filtration rate (eGFR) was estimated, using the formulae of both the Modification of Diet in Renal Disease study group and the Chronic Kidney Disease Epidemiology collaboration. 8
Serum glicentin concentrations were measured using an Elisa-based method (Mercodia France, FR-75001 Paris, France) according to the manufacturer’s protocol. This test is a solid phase two-site enzyme immunoassay (Supplemental Figure S1). During the incubation period, glicentin present in the sample reacts with antihuman glicentin antibody recognizing the glicentin-related polypeptide sequence (clone C7H9G) bound to microtitre wells. After washing, a peroxidase-conjugated antibody, directed against the glucagon sequence (clone RG-OC5), recognizes the glicentin bound to the solid phase. Following the reaction sequence, absorbances were read spectrophotometrically at 450 nm (Tecan Group Ltd, 8708 Männedorf, Switzerland). All samples were analysed in duplicate, and all of the results obtained were both within the analytical range of the calibration curve (0 to 304 pmol/L) and above the detection limit of the assay (3 pmol/L). Precision parameters (within-assay and inter-assay) were evaluated and were consistent with the values described by the manufacturer (Supplemental Tables S1, S2).
Statistical analysis
Categorical data were expressed as the number of patients and percentage, whereas continuous variables were expressed as the median values with interquartile ranges. Group differences were compared by the non-parametric Mann-Whitney test. Correlation studies were performed using non-parametric univariate linear regression (Spearman’s rank test). A P value < 0.05 was considered as significant. Statistical analyses were performed using GraphPad Prism® software (version 7.00, La Jolla, California, USA).
Results
Clinical and biochemical characteristics of the populations.
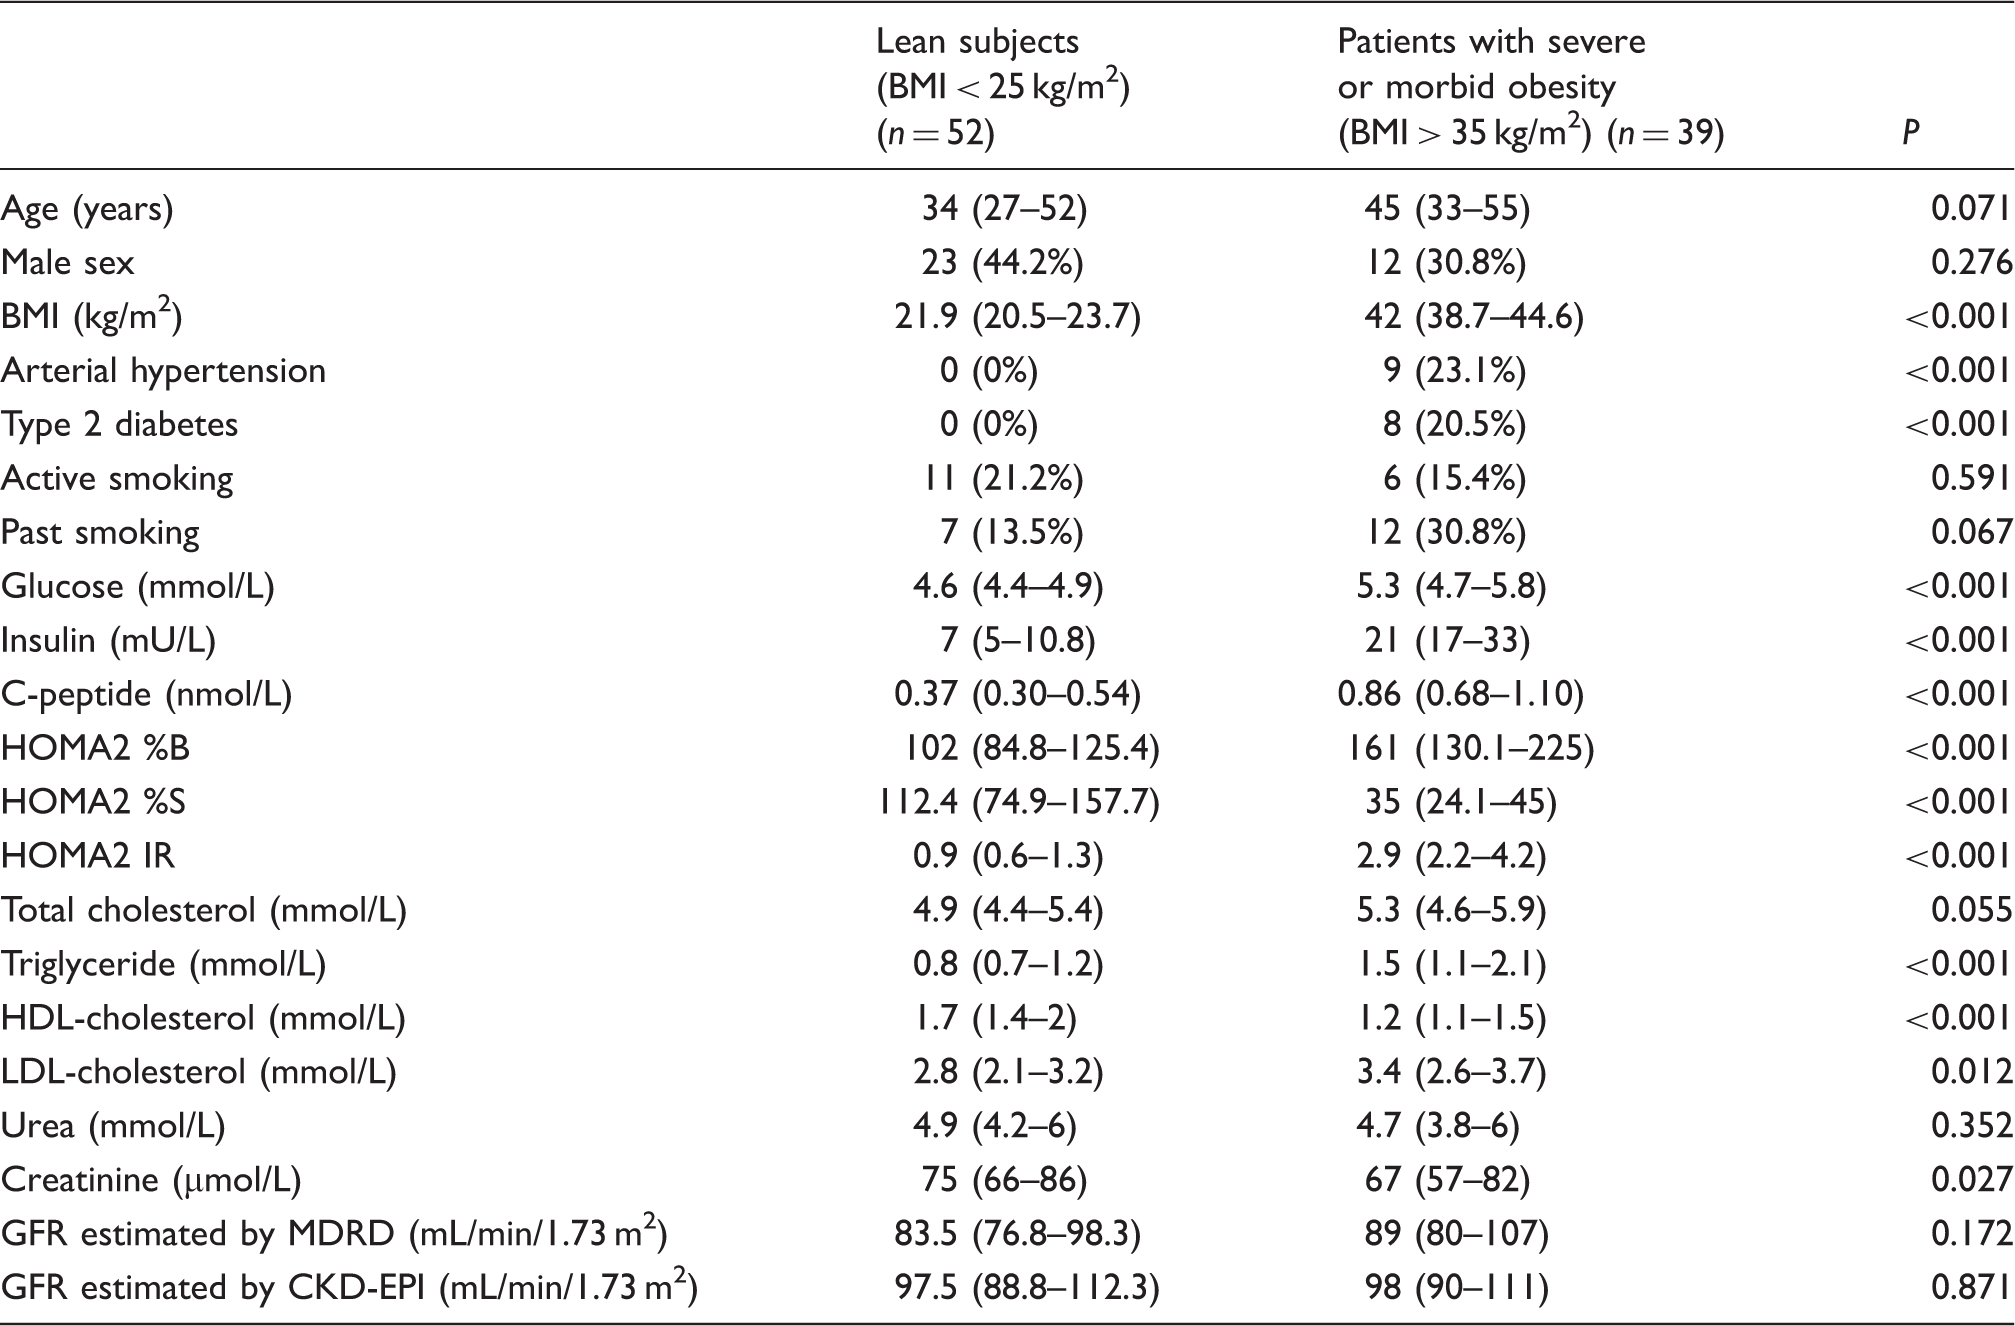
Note: Data are expressed as median values (interquartile ranges) or number (%). % are calculated within the group.
GFR estimated by CKD-EPI: glomerular filtration rate estimated using Chronic Kidney Disease Epidemiology collaboration formula; GFR estimated by MDRD: glomerular filtration rate estimated using Modification of Diet in Renal Disease study group formula; HOMA2 %B: steady state beta cell function estimated according to HOMA2 calculator; HOMA2 %S: insulin sensitivity estimated according to HOMA2 calculator; HOMA2 IR: insulin resistance estimated according to HOMA2 calculator; HOMA2 IR: homeostasis model assessment for insulin resistance; BMI: body mass index.
Statistically significant differences among the two groups were observed concerning metabolic parameters (expressed as median values), with higher fasting glucose (5.3 mmol/L vs. 4.6 mmol/L, P < 0.001), insulin (21 mU/L vs. 7 mU/L, P < 0.001), C-peptide (855 pmol/L vs. 370 pmol/L, P < 0.001) and HOMA2-IR index (2.9 vs. 0.9, P < 0.001) in the group with severe or morbid obesity compared with the individuals with a normal BMI. Patients with a BMI > 35 kg/m2 tended to have higher total cholesterol concentrations compared with lean subjects, although this was not significant (5.2 mmol/L vs. 4.9 mmol/L, P = 0.056). They had a significantly higher concentrations of triglyceride (1.5 mmol/L vs. 0.8 mmol/L, P < 0.001) and LDL-cholesterol (3.4 mmol/L vs. 2.8 mmol/L, P = 0.012), together with decreased concentrations of HDL-cholesterol (1.2 mmol/L vs. 1.7 mmol/L, P < 0.001). Renal function, as assessed by eGFR, did not differ significantly between the two groups.
Severe and morbidly obese individuals had significantly lower median fasting glicentin concentrations compared with lean subjects (12 pmol/L vs. 24 pmol/L, P < 0.0001) (Figure 1).
Box and whisker plots of serum glicentin concentrations in lean (BMI < 25 kg/m2) and sever and morbidly obese (BMI > 35 kg/m2) subjects.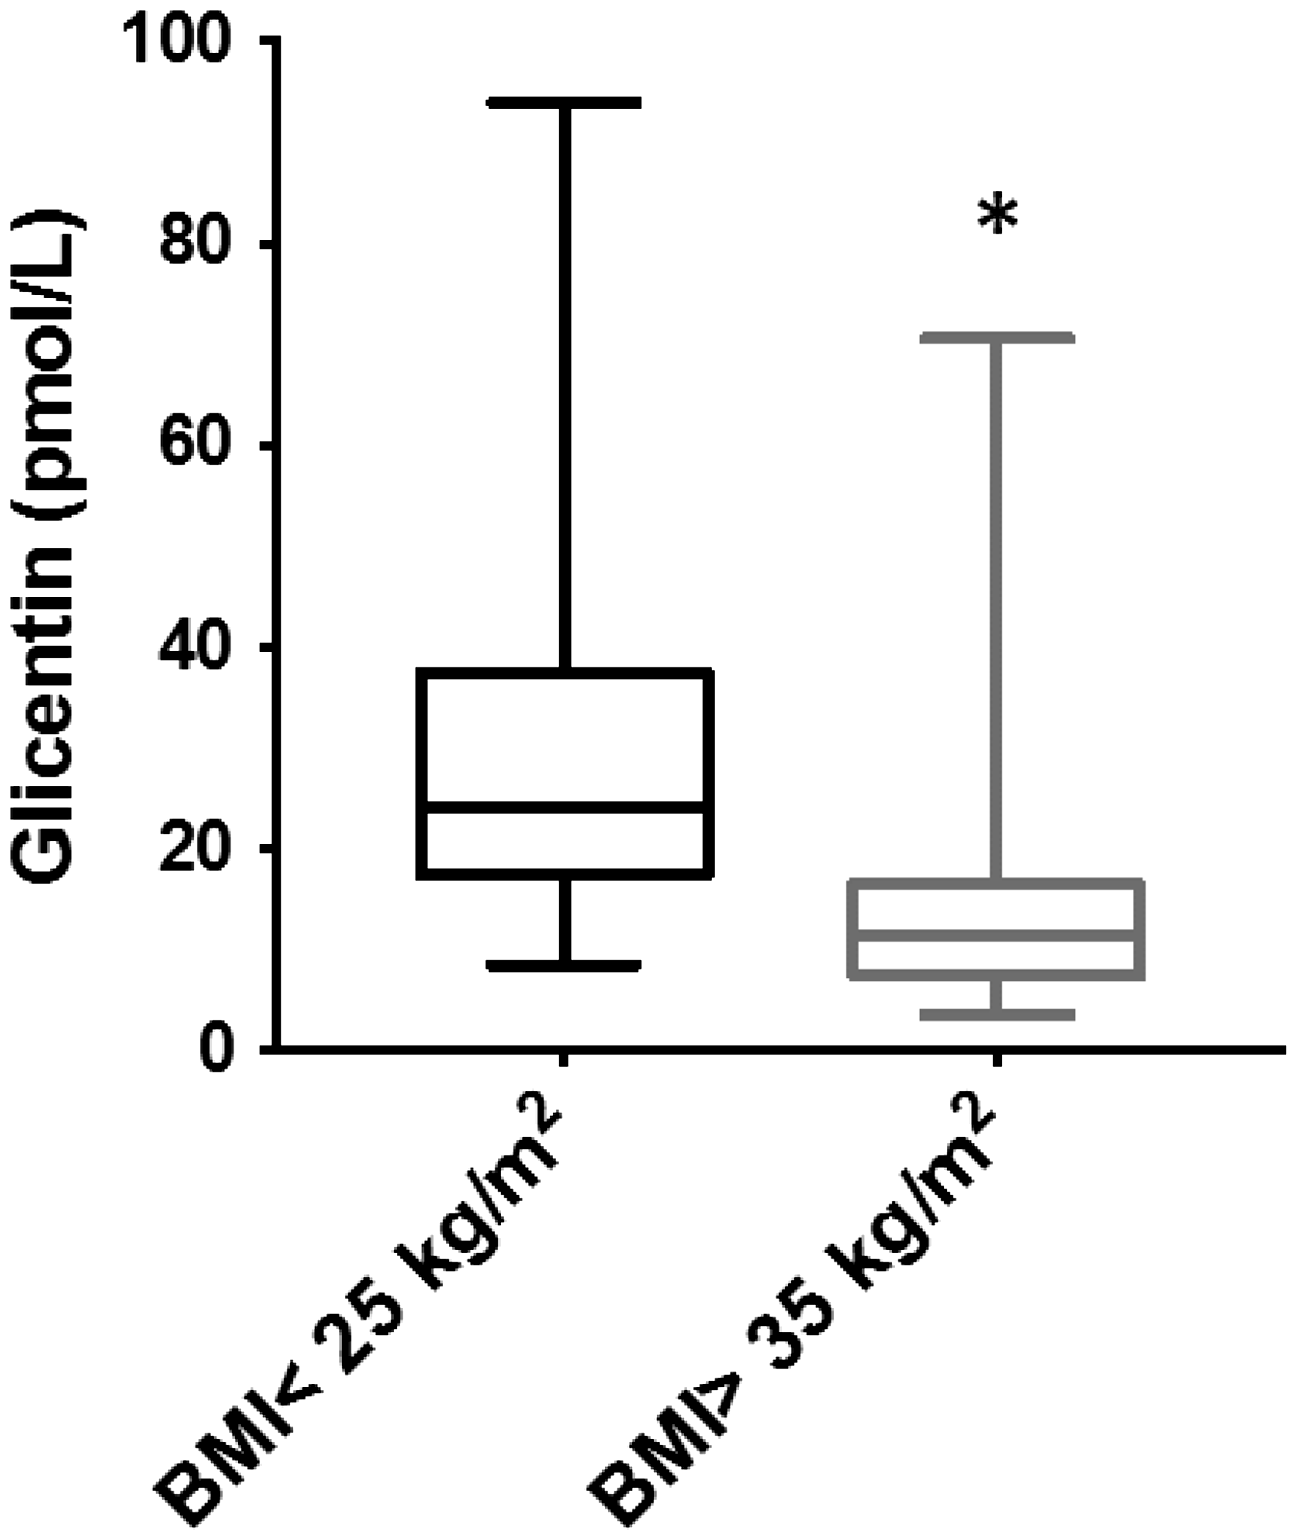
In addition, as some patients with severe and morbid obesity had associated metabolic disorders including arterial hypertension or type 2 diabetes, the potential impact of these comorbidities on glicentin concentrations was also investigated. Glicentin concentration tended to be higher but was not significantly different when compared with type 2 diabetic obese patients with combined lean and obese non-diabetic subjects (18.4 pmol/L vs. 17.7 pmol/L, P = 0.96). However, when the obese population was analysed separately, diabetic obese patients had a significantly higher glicentin concentration than non-diabetic obese subjects (18.4 pmol/L vs. 11.2 pmol/L, P = 0.04). Moreover, exclusion of obese diabetic patients enhanced the difference in glicentin concentration observed between obese and lean subjects (10.9 pmol/L vs. 24.3 pmol/L, P < 0.0001). No significant difference was observed between patients with arterial hypertension and subjects without arterial hypertension (9.3 pmol/L vs. 18.2 pmol/L, P = 0.13).
To investigate the potential clinical significance of finding a decreased glicentin concentration in patients with severe and morbid obesity, we sought to determine if there was any correlation between glicentin concentrations and the various metabolic parameters (Figure 2). No such correlation was found between fasting glicentin concentrations and BMI and glycaemic parameters on the one hand (glucose, C-peptide, insulin, HOMA2-IR) and lipid parameters on the other (total cholesterol, triglyceride, LDL and HDL-cholesterol) as revealed by heterogeneous repartition on a scatter plot and a Spearman rank correlation coefficient close to zero.
Correlation between glicentin concentration and metabolic parameters. (a) BMI, (b) glucose, (c) C-peptide, (d) insulin, (e) HOMA2-IR, (f) total cholesterol, (g) triglyceride, (h) LDL-cholesterol, (i) HDL-cholesterol. Each dot represents one individual (n = 91), the straight-line represents the best fit-line obtained by linear regression analysis.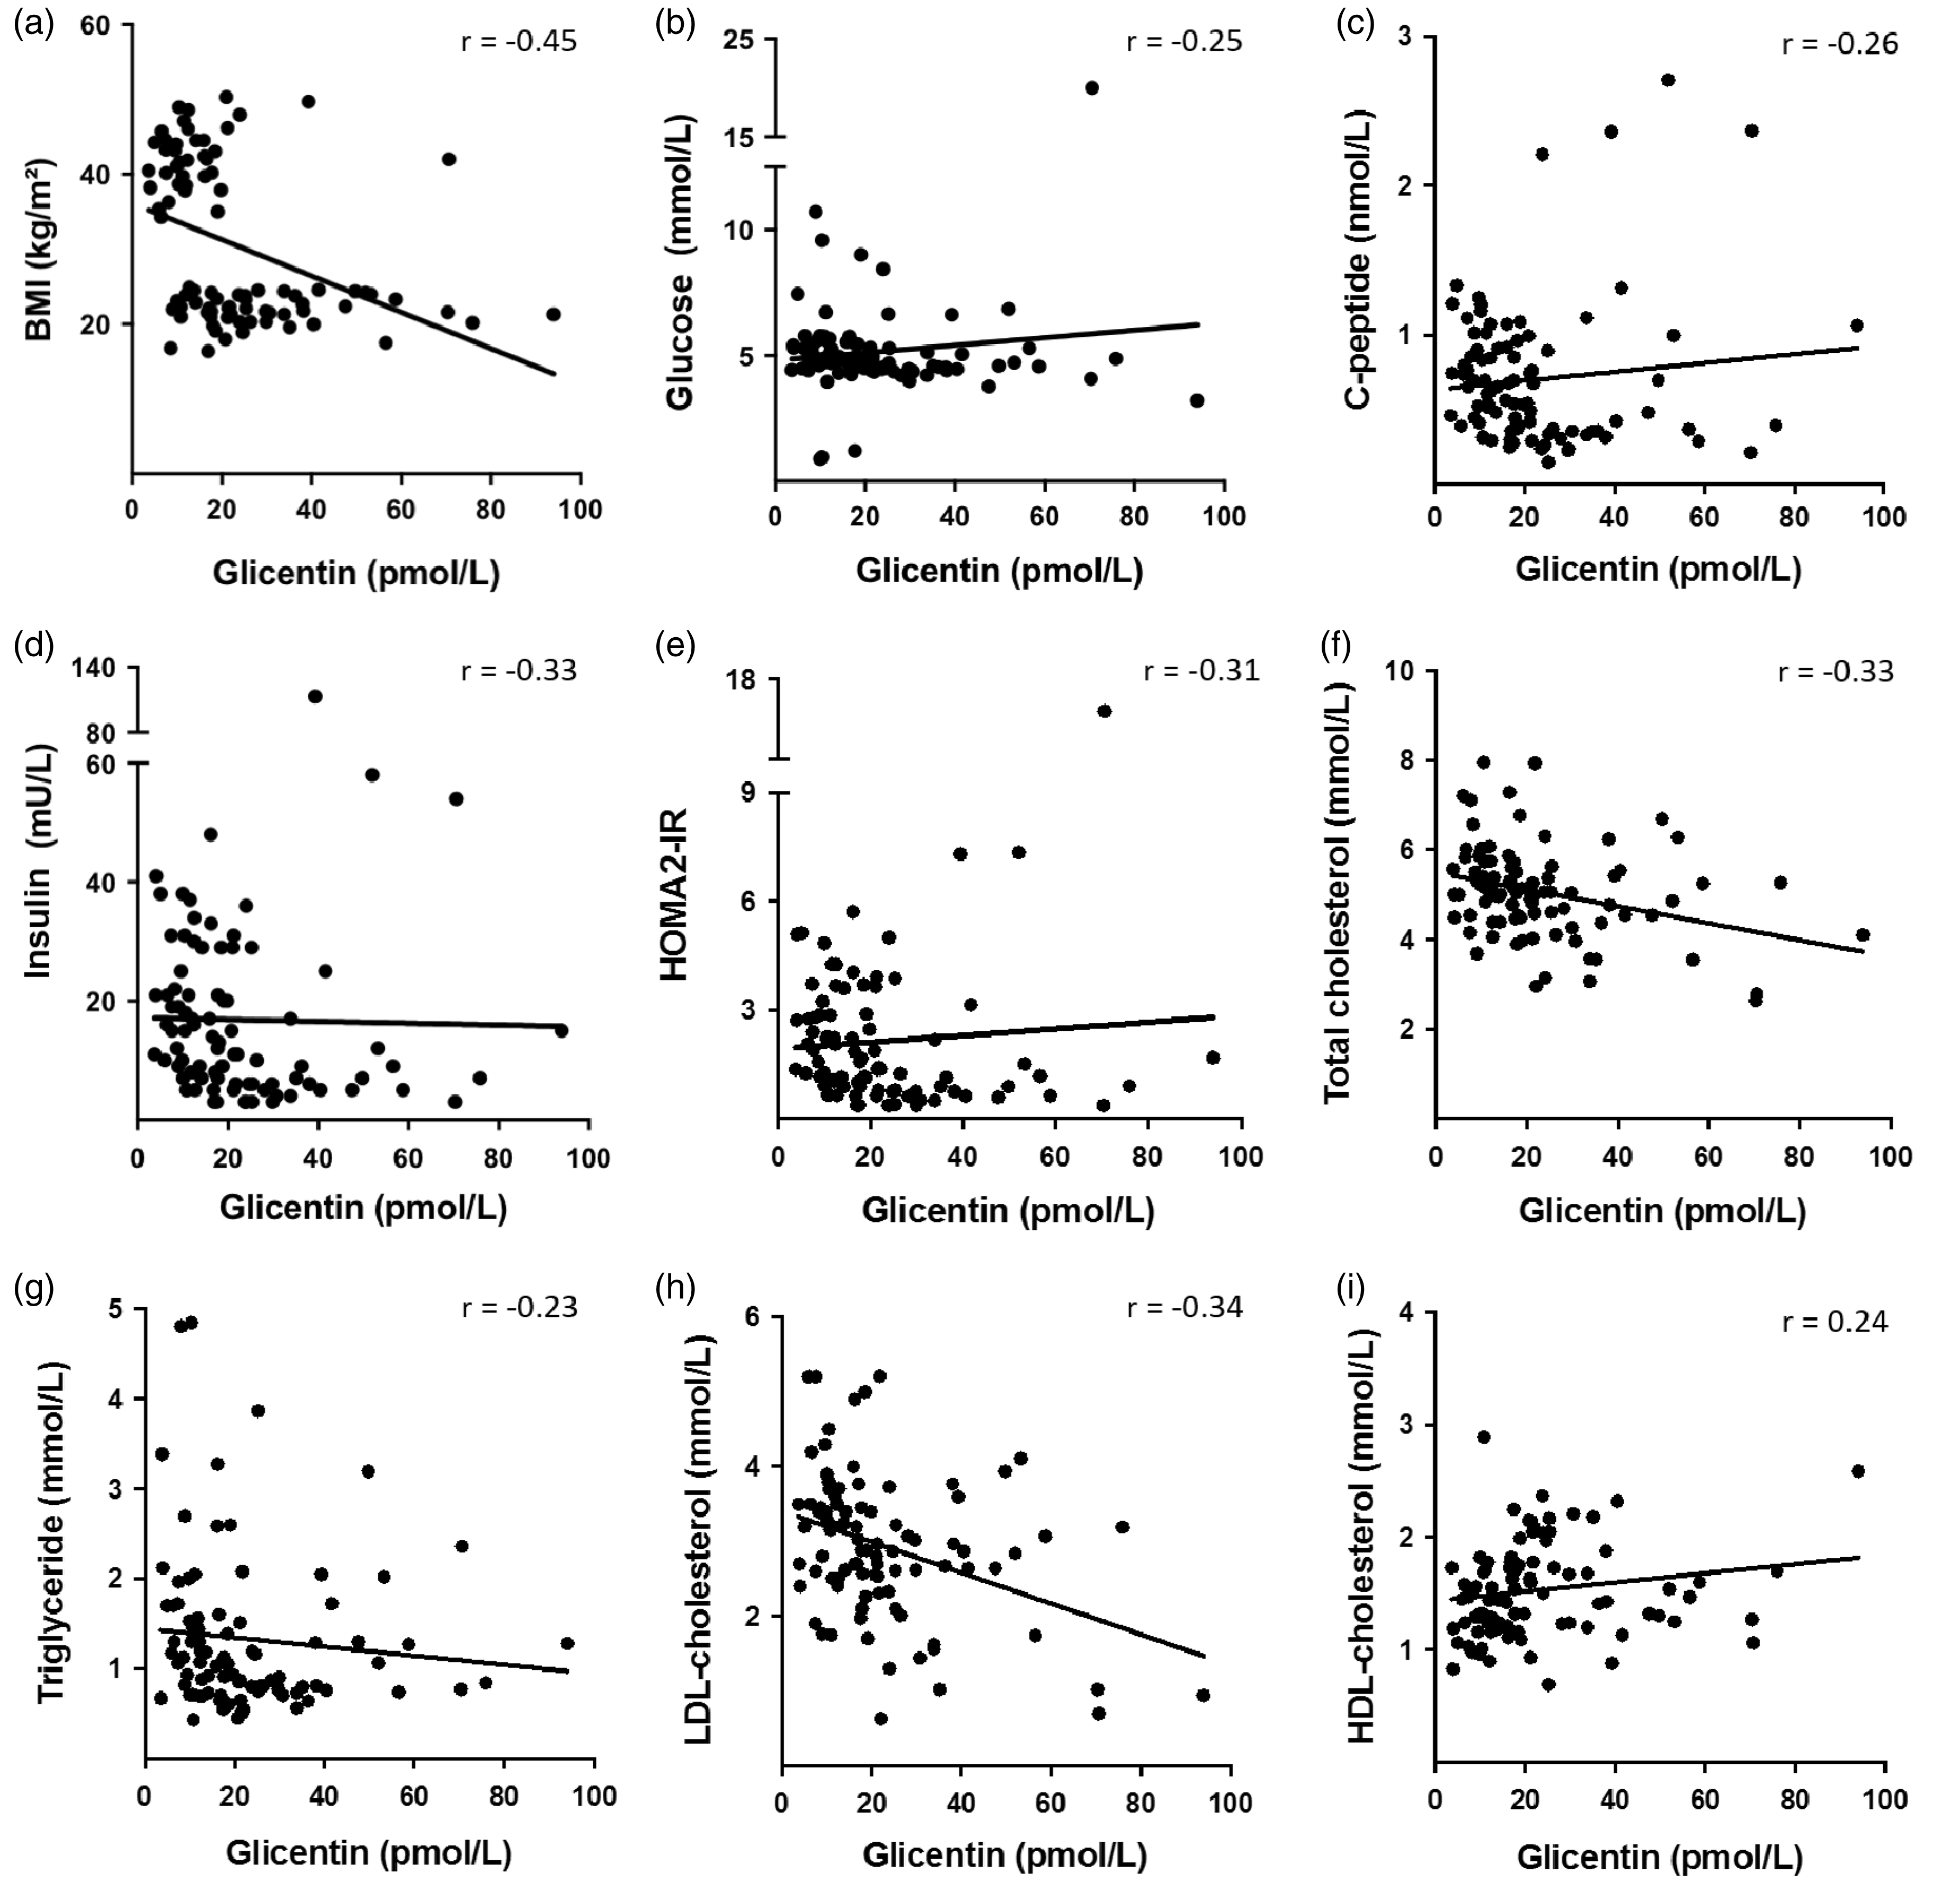
Discussion
In the present study, we investigated the circulating concentrations of glicentin in patients with adult obesity and found a significant decrease in those with severe and morbid obesity (BMI > 35 kg/m2) compared with adults with normal BMI (BMI < 25 kg/m2).
So far, there have been few reports concerning serum glicentin in humans and we believe that only one study in obese adolescents has been published previously. In that study, the authors did not identify any significant difference in concentrations of glicentin between lean adolescents and adolescents with obesity and normal glucose tolerance. 9 However, it is important to note that their study cohort included adolescents with obesity with a BMI-SDS higher than 2, which is equivalent to an adult BMI of 30. Hence, our results are not strictly comparable and may be explained by the fact that our population included adults with a higher BMI, which may have accentuated the difference in glicentin concentration compared with the population with a normal BMI. Interestingly, the authors reported lower glicentin concentrations in adolescents with obesity and impaired glucose tolerance compared with those with obesity and normal glucose tolerance. Furthermore, these results suggested that fasting glicentin concentrations could be a predictor of impaired glucose tolerance. Hence, the difference of glicentin concentrations observed in our cohort between adult lean subjects and adults with severe or morbid obesity may be attributed to associated metabolic disorders rather than to the BMI or to the weight itself.
Several studies suggest the implication of glicentin in glucose homeostasis. Studies in animal models revealed that glicentin secretion is stimulated by intraluminal administration of glucose, amino acids or fat ingestion.10–12 These observations were confirmed in humans, where higher postprandial glicentin values were observed compared with the fasting situation in neonates13,14 and increased values were found following glucose ingestion in adults.15,16 In addition, it is possible that glicentin could play an indirect role in glycaemic regulation as suggested by reports of an increased insulin secretion5,6 and decreased glucagon secretion6,17 after glicentin administration in several animal models.
The understanding of glicentin variation in humans and its link with glycaemic parameters is still in its infancy. In our study, we did not identify any correlation between glicentin concentrations and fasting glycaemic parameters including glucose, insulin and C-peptide. No significant difference in fasting glicentin concentration was found between diabetic and non-diabetic individuals in the whole population, which is consistent with a previous report. 16 Nevertheless, when the obese population was analysed separately, we found that diabetic patients had a higher glicentin concentration compared with non-diabetics. These results should be interpreted with caution given the small number of diabetic patients in our cohort (n = 8) and the fact that our study was not initially designed to investigate this. Based on our results and the current literature, we can develop various hypotheses, which would require further studies to be undertaken. As experimental studies have revealed the stimulating effect of glicentin on insulin secretion,5,6 we propose that in return, insulin could exert a negative feedback on glicentin production. Impaired glucose tolerance defines prediabetic patients 18 and is associated with insulin resistance, leading to high insulin concentrations which could contribute to a decrease in circulating concentrations of glicentin. In our cohort, obese patients had a significantly higher insulin resistance index and higher insulin concentrations compared with lean subjects and this could explain why we found lower serum glicentin concentrations. Type 2 diabetes is characterized by insulin resistance, and the disease appears when insulin secretion is altered and is insufficient to counterbalance this insulin resistance. 19 We can speculate that when type 2 diabetes appears, patients have altered insulin secretion in addition to insulin resistance and this could potentially explain why we found higher serum glicentin concentrations in obese diabetics compared with obese non-diabetics.
The role of glicentin in glucose metabolism therefore appears to be complex and requires further experimental and clinical investigations to better understand its role and regulation. It would be of interest to extend this work to larger cohorts and to explore the glicentin response, for example, after stimulation by glucose ingestion or after a mixed meal in adults with obesity.
Glicentin belongs to the family of proglucagon-derived hormones, which includes GLP-1, GLP-2 and oxyntomodulin, and its production results from the cleavage of the proglucagon by proconvertases 1 and 3 in the intestinal L cells.3,20,21 Although the maturation of proglucagon-derived peptides is generally believed to occur through two different processes in the pancreas and the intestine, recent studies have revealed a previously unsuspected pathway. As an example, some authors have recently demonstrated the existence of intrapancreatic GLP-1 production and extra-islet glucagon production.22,23 Hence, it would worth investigate if mature glicentin could also be produced by the pancreas.
We believe this to be the first study to explore glicentin concentration during adult obesity. However, the role of other L-cell proglucagon-derived peptides including GLP-1, GLP-2 or oxyntomodulin is much more documented.4,24–29 Even though various studies have described inconsistent findings, some have revealed lower concentrations of GLP-1 in obese patients compared with normal weight subjects.24,25 Further experimental and clinical studies would be of interest to better understand the link between each member of the L-cell-derived peptides and to determine if these molecules are co-secreted and vary similarly during adult obesity.
In conclusion, in the present study, we have investigated fasting circulating glicentin in adults and found that those patients with severe or morbid obesity had significantly lower circulating concentrations of glicentin than those with a BMI < 25 kg/m2. Although further studies are required in order to determine whether lowered glicentin concentration is a cause or a consequence of metabolic disorders, our results nevertheless suggest its potential relationship with adult obesity.
Footnotes
Acknowledgements
The members of the Department of Endocrinology and Bariatric Surgery and of the Clinical Chemistry Laboratory are kindly acknowledged for their help in collecting samples and data. M. Kacimi (Mercodia®) is acknowledged for providing glicentin Elisa kits.
Declaration of conflicting interests
The author(s) declared no potential conflicts of interest with respect to the research, authorship, and/or publication of this article.
Funding
This study was supported by the Université Côte d’Azur and the University Hospital of Nice.
Ethical approval
The study was approved by the local Ethic Committee of the University Hospital of Nice (reference number DC 2015-2539). All participants were informed and gave a written consent.
Guarantor
GC.
Contributorship
All authors contributed to design, conduct, collect, analyse and interpret the data. J. Raffort wrote the manuscript. All authors contributed to the intellectual content of this article, revised it critically and approved the final version.
References
Supplementary Material
Please find the following supplemental material available below.
For Open Access articles published under a Creative Commons License, all supplemental material carries the same license as the article it is associated with.
For non-Open Access articles published, all supplemental material carries a non-exclusive license, and permission requests for re-use of supplemental material or any part of supplemental material shall be sent directly to the copyright owner as specified in the copyright notice associated with the article.