
Abstract

We read with interest the article by Lund et al. on the calculation of limits for reference change values (RCV) in serial results. 1 They describe that as the number of results increases there is an increase in the RCV. This is due to the increased chance of false positives that may be encountered when using multiple results and is a consequence of the underlying concept which compares each individual successive result with the initial result.
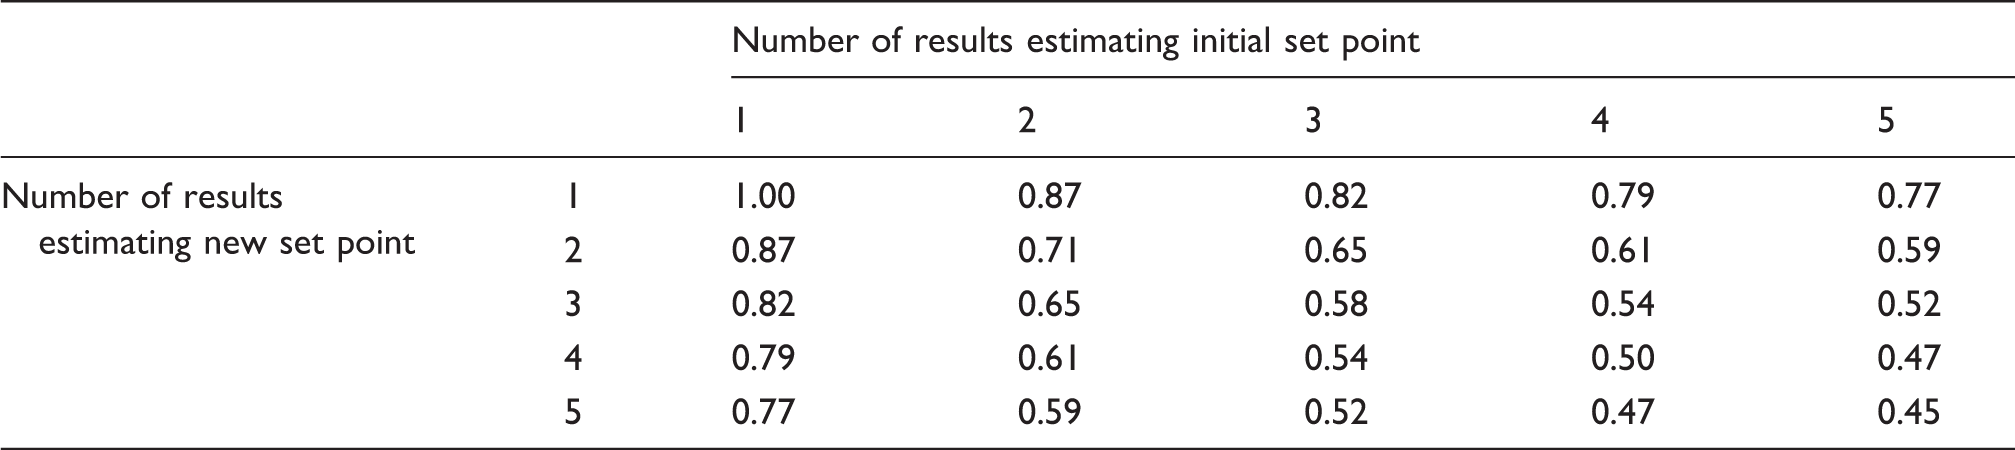
An alternate concept may be to consider subsequent results as repeat testing which collectively provide an estimate of the new homeostatic set point. In contrast to Lund et al., as the number of results increases, with this view, the RCV decreases. The RCV also decreases if multiple results are available to estimate the initial set point.
RCV using multiple estimates of the initial and new set points, expressed as a fraction of traditional RCV from two singleton measurements.
Assumptions included in this model include that the measurements follow a Gaussian distribution around respective homeostatic set points before and after a possible clinical event and that that any change in set point has completely occurred between measurements, such that results included in the calculation reflect steady state before and after the change. In practice, careful selection of which results to include will be required.
The use of multiple data points is a development of RCV theory over the use of single data points, and should be combined with a correction for the direction and magnitude of change for the best estimate 3 and consideration given to the effect of reporting interval size. 4
This concept can be further extended to calculate the probability that an observed change based on multiple samples is significant (i.e. not due to random variation). Suppose n1 results with mean x1 are available to estimate the initial set point, and n2 results with mean x2 are available to estimate the new set point. If there has not been a true change, then (x2−x1) follows a Gaussian distribution centred around zero with standard deviation ([x1 × CVA+I/n10.5]2 + [x2 × CVA+I/n20.5]2)0.5 = CVA+I (x12/n1 + x22/n2)0.5. The corresponding Z-score is (x2−x1)/(CVA+I [x12/n1 + x22/n2]0.5) enabling the probability of a true change to be determined. Note that the change associated with a probability using this formula is different to the RCV calculated in the usual manner as values of all results are known and variations in CVA+I with concentration are taken into account. 3 A calculator has been developed applying these concepts and is freely available online. 5
In conclusion, using all the data available from repeat testing before or after a clinical event allows for a more precise estimate of the true patient homeostatic set point, enabling smaller changes to be detected with greater certainty.
Note: this concept has been previously presented as a poster at the Australasian Association of Clinical Biochemists’ 47th Annual Scientific Conference. 6
Footnotes
Declaration of conflicting interests
The author(s) declared no potential conflicts of interest with respect to the research, authorship, and/or publication of this article.
Funding
The author(s) received no financial support for the research, authorship, and/or publication of this article.
Ethical approval
Not applicable.
Guarantor
GJ.
Contributorship
GJ conceived the concept and developed the model. JC assisted with refinement of the model. GJ and JC co-wrote the paper.