
Abstract
Objectives
Three multicentre studies of reference intervals were conducted recently in Japan. The Committee on Common Reference Intervals of the Japan Society of Clinical Chemistry sought to establish common reference intervals for 40 laboratory tests which were measured in common in the three studies and regarded as well harmonized in Japan.
Methods
The study protocols were comparable with recruitment mostly from hospital workers with body mass index ≤28 and no medications. Age and sex distributions were made equal to obtain a final data size of 6345 individuals. Between-subgroup differences were expressed as the SD ratio (between-subgroup SD divided by SD representing the reference interval). Between-study differences were all within acceptable levels, and thus the three datasets were merged.
Results
By adopting SD ratio ≥0.50 as a guide, sex-specific reference intervals were necessary for 12 assays. Age-specific reference intervals for females partitioned at age 45 were required for five analytes. The reference intervals derived by the parametric method resulted in appreciable narrowing of the ranges by applying the latent abnormal values exclusion method in 10 items which were closely associated with prevalent disorders among healthy individuals. Sex- and age-related profiles of reference values, derived from individuals with no abnormal results in major tests, showed peculiar patterns specific to each analyte.
Conclusion
Common reference intervals for nationwide use were developed for 40 major tests, based on three multicentre studies by advanced statistical methods. Sex- and age-related profiles of reference values are of great relevance not only for interpreting test results, but for applying clinical decision limits specified in various clinical guidelines.
Keywords
Introduction
In recent years, measurements of major laboratory analytes have been well standardized on a global scale through the concerted efforts of academic societies for laboratory medicine and clinical chemistry. However, reference intervals (RIs) remain discordant among the clinical laboratories. This is due to (1) lack of definitive criteria for healthiness, (2) unsophisticated statistical methods for derivation, (3) use of insufficient number of samples and (4) lack of standardization.
With the global standardization of major laboratory test, it is essential to conduct a multicentre study for establishing reliable and reproducible RIs to be used in common. With this as background, in 2005 the International Federation of Clinical Chemistry and Laboratory Medicine (IFCC) established the Committee on Reference Intervals and Decision Limits (C-RIDL) for promoting the derivation of RIs properly and reliably and for considering the distinction between RIs and clinical decision limits (CDLs). As one of its projects, an Asian multicentre study was conducted in 2009 aiming at derivation of common RIs in collaboration with the Asia-Pacific Federation for Clinical Biochemistry (APFCB),1,2 in which approximately 2000 healthy volunteers from Japan were recruited nationwide, and their sera were assayed for 72 commonly tested analytes after transportation of all the specimens to a central laboratory. In the meanwhile, two other multicentre studies were conducted in Japan, one by a group of hospitals associated with Kyushu University (KU) 3 and the other by the Japanese Association of Medical Technologists (JAMT). 4 In the KU and JAMT studies, the specimens collected at each participating laboratory were measured locally, and the test results were combined following coordination of results using cross-check testing among the collaborating laboratories. Since the protocols used for recruitment of healthy individuals for the studies were found to be well harmonized, the Committee of Common Reference Intervals (C-CRI) of the Japan Society of Clinical Chemistry (JSCC) launched this project of merging the three datasets for establishment of reliable and reproducible nationwide RIs for 40 frequently tested analytes, most of which had been well standardized in Japan.
In this article, procedures used for merging and deriving the common RIs for the Japanese population are described. The validity of the statistical methods was evaluated and compared to those recommended in the published guideline for derivation of RIs (C28-A3, issued by the Clinical Laboratory Standardization Institute [CLSI]). 5 Special discussion is included regarding the distinction between RIs and CDLs specified in various clinical guidelines.
Methods
Source data
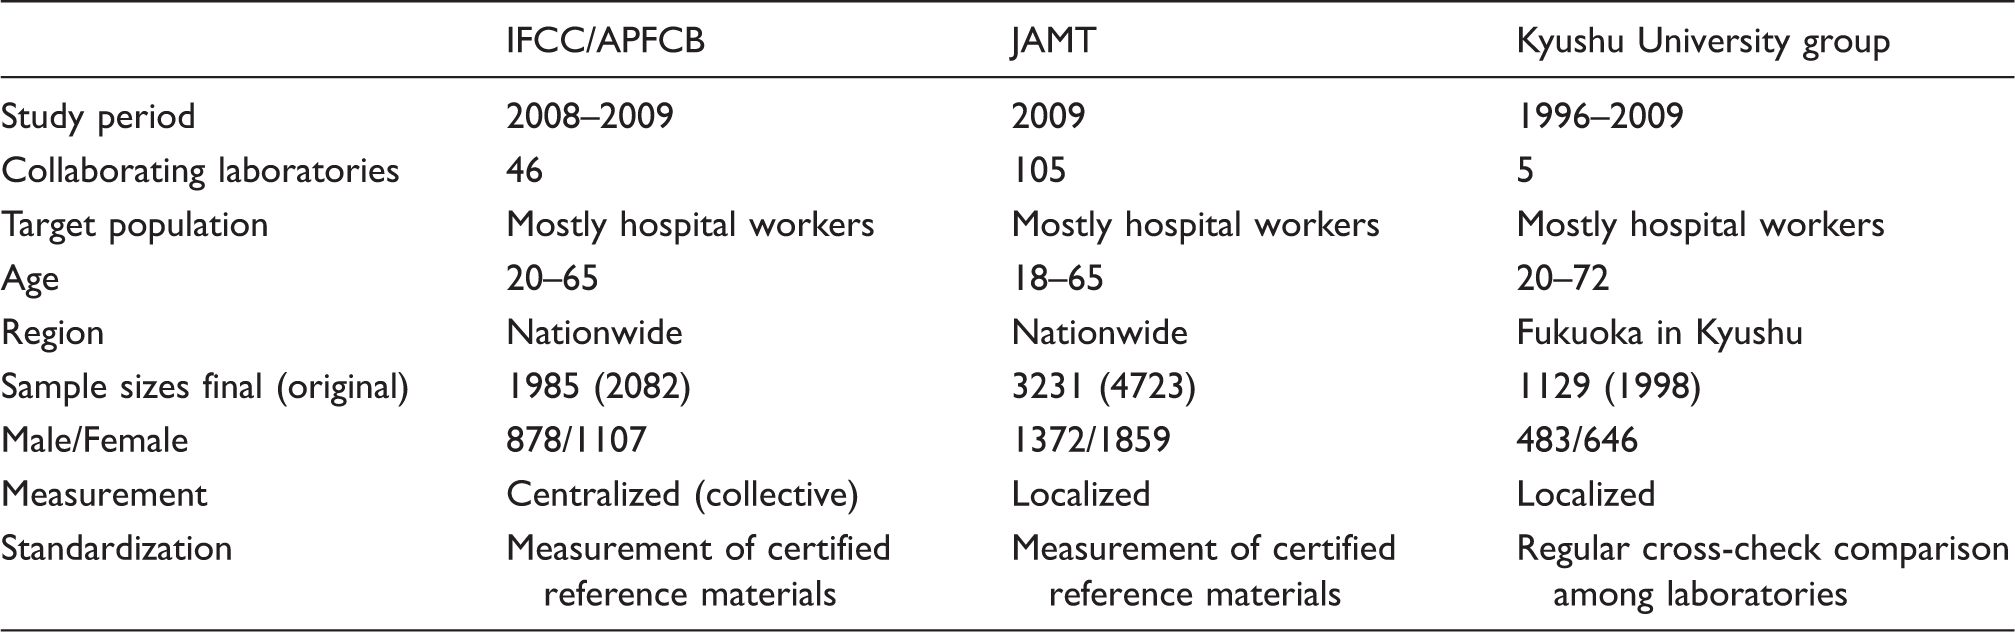
The three RI studies adopted a similar strategy for recruiting reference individuals mostly from hospital workers. The target age range was between 18 and 65 years. Exclusion criteria adopted in the IFCC/APFCB study 1 were (1) body mass index (BMI)>28 kg/m2, (2) average daily consumption of ethanol >75 g (this amount of alcohol intake was regarded as rather high, but it was allowed to evaluate the effect of alcohol assumption; however, in derivation of RIs for those analytes known to be influenced by alcohol intake, the maximum level of intake was lowered to 25 g/day), (3) cigarette smoking >20/day, (4) regular medication for chronic diseases, (5) recent (≤2 weeks) recovery from acute illness or surgery requiring hospitalization, (6) known hepatitis B or C virus carrier and (7) pregnancy or within one year after childbirth. KU group and the JAMT studies3,4 used essentially the same strategy, including non-allowance of those who took drugs on a regular basis for chronic diseases.
The characteristics of three reference interval studies.
The analytes included in this joint project were as follows: total protein (TP); albumin (Alb); globulin (Glb, computed as TP−Alb); total bilirubin (TB); urea; uric acid (UA); creatinine (Cre); sodium (Na); potassium (K); chloride (Cl); calcium (Ca); inorganic phosphate (IP); iron (Fe); glucose (Glu); triglyceride (TG); total cholesterol (TC); high-density lipoprotein cholesterol (HDL-C); low-density lipoprotein cholesterol (LDL-C); aspartate transaminase (AST); alanine aminotransferase (ALT); alkaline phosphatase (ALP); lactate dehydrogenase (LDH); γ-glutamyl-transferase (GGT); creatine kinase (CK); cholinesterase (ChE); amylase (AMY); immunoglobulin G, A and M (IgG, IgA, IgM); complement components (C3, C4); and C-reactive protein (CRP); haemoglobin A1c (HbA1c); complete blood counts (CBC) composed of red blood cell count (RBC); haemoglobin (Hb); haematocrit (Ht); mean corpuscular volume (MCV); mean corpuscular haemoglobin (MCH); mean corpuscular haemoglobin concentration (MCHC); platelet count (Plt); white blood cell count (WBC). All test items were measured with the following exception: HbA1c was measured only in the JAMT study; C3 and C4 were not measured in the JAMT study; Glu was measured in serum in the IFCC/APFCB study, and thus the results were not included in the combined analysis; in the IFCC/APFCB study, TB and ChE were not measured, and CBC was tested locally in 60.0% of the reference individuals, employing Beckman–Coulter’s (BC) haematology analysers all under the web-based QC system (IQAP).
Standardization among the laboratories was achieved by common measurement of certified reference materials in the JAMT study 4 and by frequent cross-check testing of pooled sera among the laboratories in the KU project. Through this process of long-term monitoring of the harmonized status across the laboratories, those laboratories which employed assay principles or reagents known to give biased results were eliminated from enrolment to the JAMT study.
For combining the datasets from the three studies, adjustment of imbalances in age and sex distributions was made by random deletion from subgroups with excessive numbers of samples. This procedure led to the final data size of 6345 (1985, 3231 and 1129, respectively).
Statistical procedures
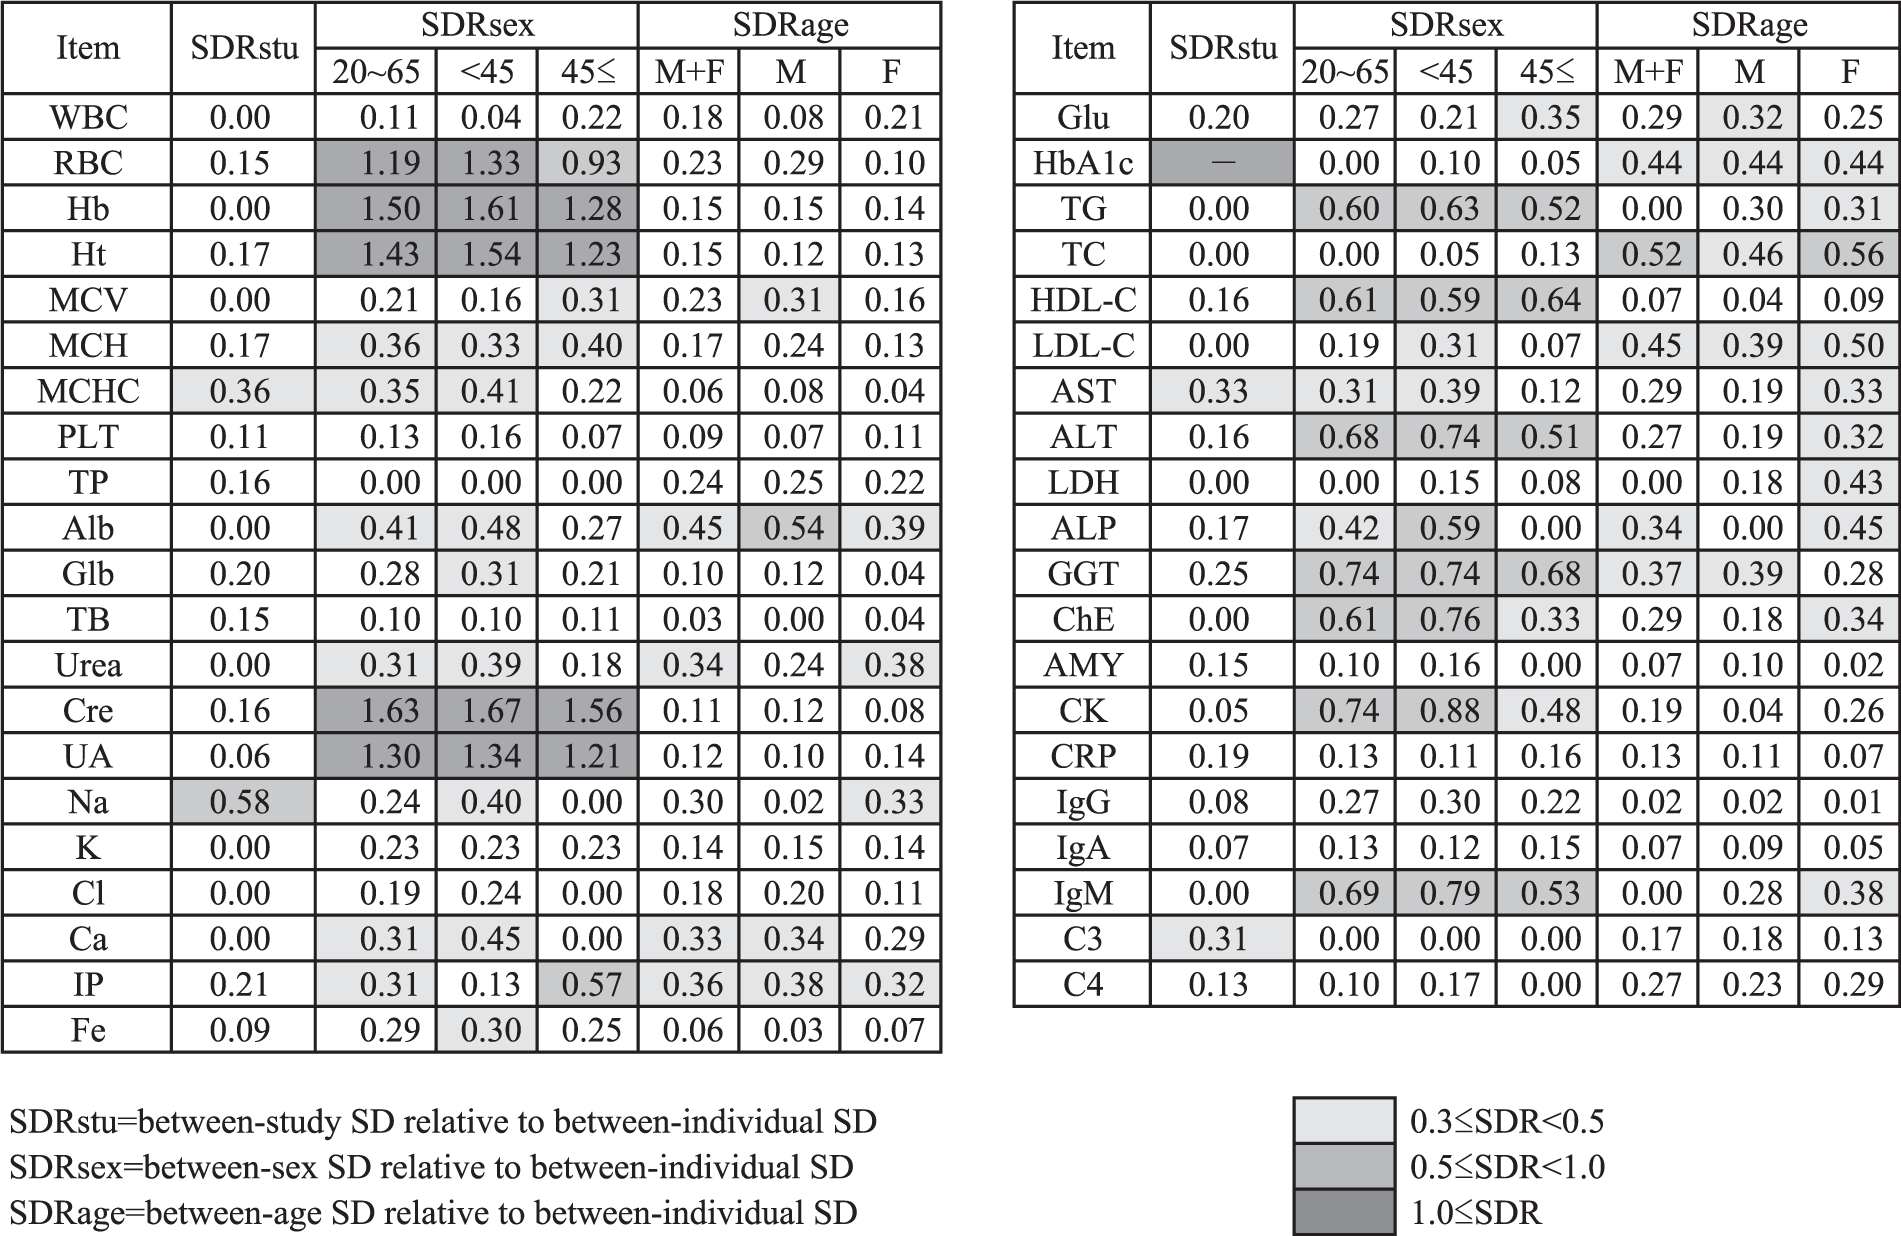
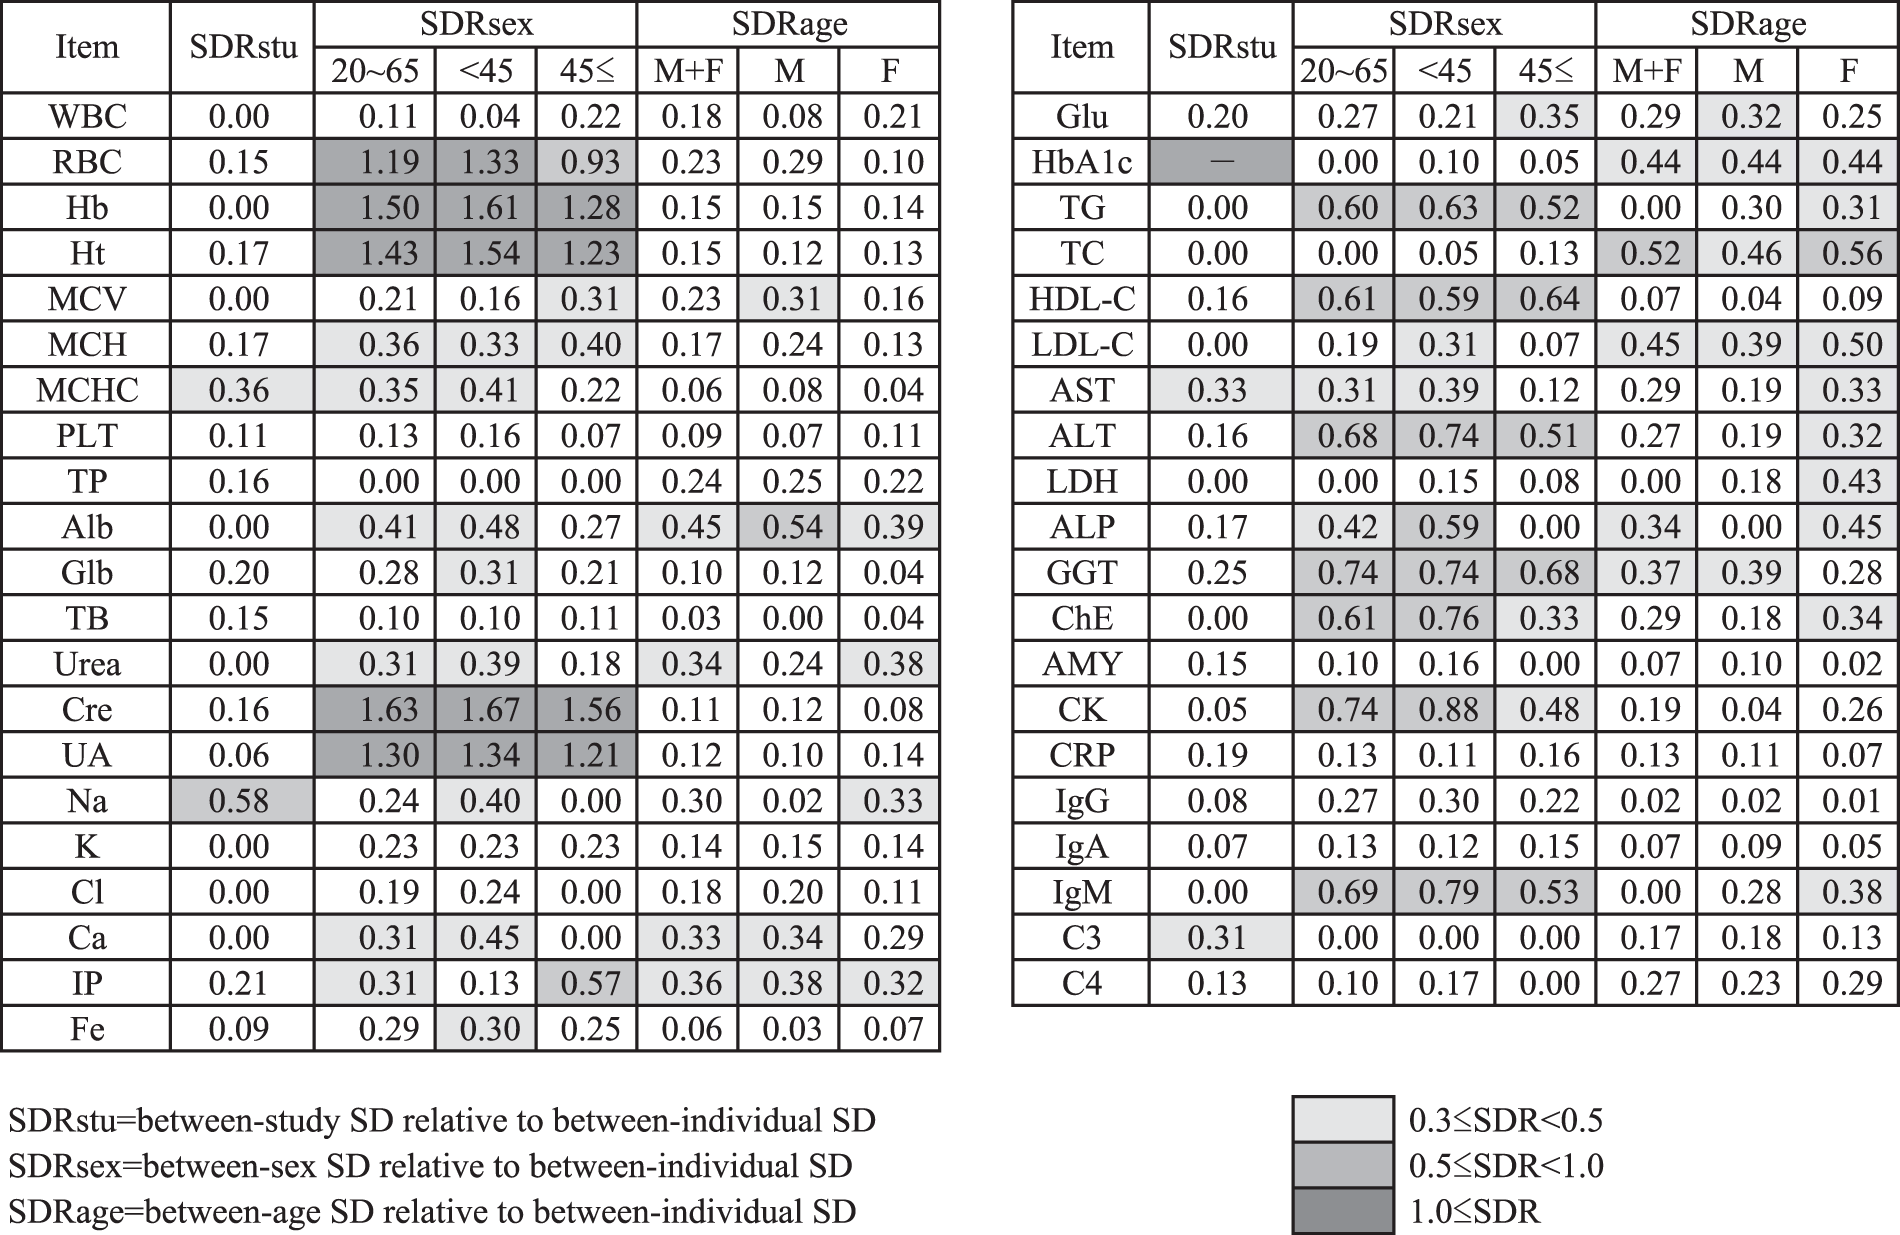
By use of three- or two-level nested analysis-of-variance (3N- or 2N-ANOVA), the magnitude of between-subgroup differences (partitioned by the factors of study unit, sex and age) was computed as the standard deviation (SD) ratio (SDR), which corresponds to the SD due to between-subgroup variation divided by SD representing the RI (corresponding to the between-individual SD).6,7 Initially 3N-ANOVA was performed by setting sex, age and project (study) to derive SDRsex, SDRage and SDRstu. Then 2N-ANOVA was applied to analyse age-specific SDRsex in two ways after partition by age at 45 years and sex-specific SDRage after partition by sex. An SDR ≥0.3 was regarded as indicating apparent between-subgroup differences. 7 However, as a consensus in the C-CRI, SDR ≥0.5 was used at the time of making a simplified list of the RIs.
The RIs were derived by the methods described in the 2009 Asian RI study and elsewhere.1,3,6,8 In short, RIs were computed by a parametric (P) method based on Gaussian transformation of reference values (RVs) using a modified Box–Cox power transformation formula. 6 As an iterative procedure for optimizing reference individuals before computing the final RIs, the latent abnormal values exclusion (LAVE) method was applied.6,7 We chose the following reference test items for judging appropriateness of individuals in the LAVE method: Alb, Glb, UA, TG, TC, HDL-C, LDL-C, AST, ALT, LDH, GGT, CK and CRP, which reflect over-nutrition, muscular exertion or non-fasting status. Those individuals possessing two or more abnormal results outside the respective RIs were excluded. In deriving the RIs for TG, TC, LDL-C, ALT, GGT and CRP, which are known to be affected by highly prevalent metabolic syndrome, we excluded those individuals with BMI ≥26 and ethanol consumption >25 g/day prior to applying the LAVE method. For Fe, we added MCV <85 to the exclusion criteria. In deriving RIs for haematology test items using the LAVE method, WBC, Hb, Ht and Plt were added to the above list of reference test items.
Sex and age profiles of RVs for all test items were drawn as two-dimensional scattergram by plotting age on the X-axis and test values on the Y-axis. The central curve was derived by regressing the medians of values at consecutive vertical segments of 10-year spans, which shifts year by year from left to right. Similarly, the outer curves (blue and red) representing the central 90% range were drawn by taking the average of consecutive points of the fifth and 95th centiles for the moving vertical 10-year segment.
Authorization of the newly derived RIs
The RIs derived by this project are to be used nationwide in Japanese clinical laboratories which implement the standardized assay protocol. Therefore, we requested an objective review by the Japan Committee on Clinical Laboratory Standardization (JCCLS) regarding the procedures employed for derivation of the RIs, including the appropriateness of statistical methods and procedures for standardization.
In this article, we call the statistical procedures employed ‘JCCLS method’, which is essentially identical to those described in the C-RIDL/IFCC protocol for the global study on RVs. 8
Results
List of SDRs for between-study, between-sex and between-age differences (SDRstu, SDRsex, SDRage). SDRsex was also computed by partition at age 45. SDRage was also computed for each sex.
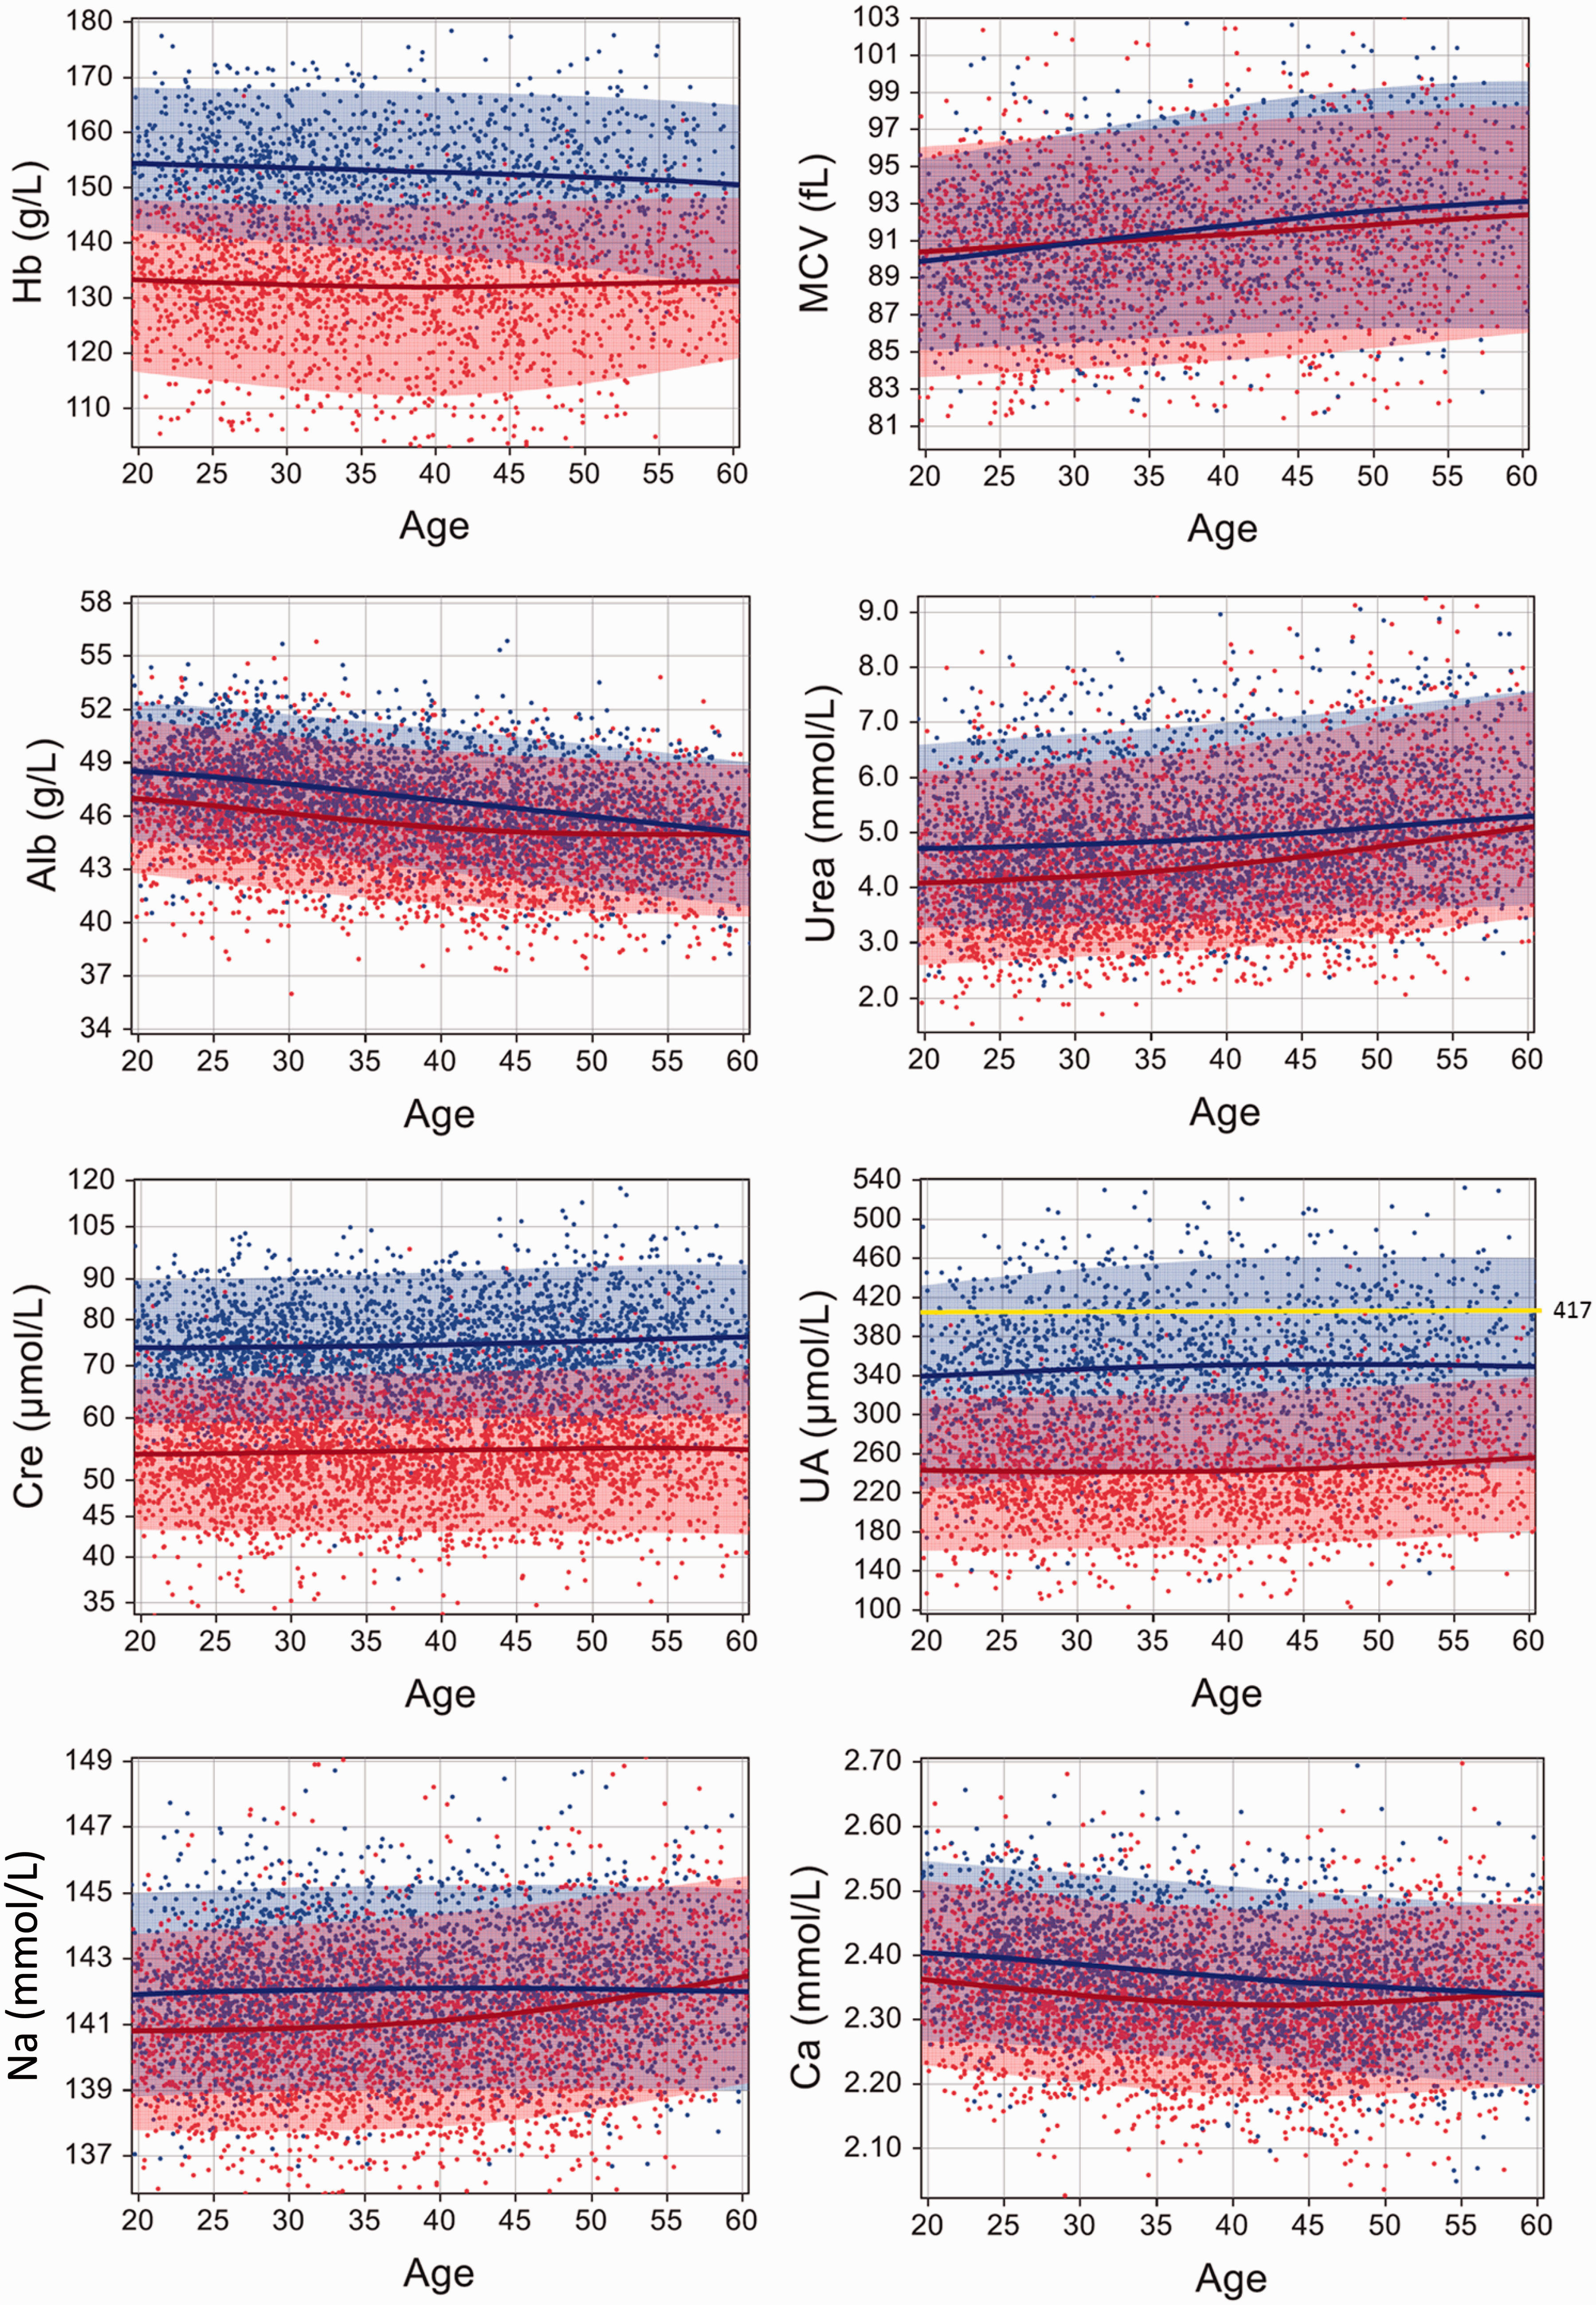
Sex- and age-related profiles of reference values. Two-dimensional scattergrams are shown for 16 typical test items with high SDRsex and/or SDRage. All (approximately 6300) points were plotted for Alb, Urea, Cre, Na, Ca, IP. While, for UA, TG, HDL-C, LDL-C, ALP, ALT and GGT, approximately 4100 points (2840 points for Glu) were plotted by use of the principle of LAVE, ensuring absence of any abnormal result in the 13 reference test items other than the one being plotted. Similarly, for Hb and MCV, 3200 points were plotted based on the LAVE principle in reference to the results of CBC items. Blue and red colours for dots, curves and shades designate results for males and females, respectively. The central lines and the outer margins of the colour shades represent the median and the fifth and 95th centiles for the year-by-year moving vertical 10-year segment. Horizontal yellow lines shown in the graphs for UA, Glu, TG and LDL-C represent clinical decision limits (CDLs) specified in clinical guidelines.
As judged from the SDRstu and the graphs, no prominent between-project differences were observed in any test items except for Na, MCHC and AST (SDRstu = 0.59, 0.36 and 0.33, respectively, in that order of magnitude). Possible causes of the differences are explained in the ‘Discussion’ section. However, preliminary comparisons of RIs with or without partition by study did not show appreciable differences in the RIs, and thus, as a consensus among the C-CRI, results for all test items from the three projects were combined.
As judged by SDRsex, we noted apparent sex-related differences in 21 analytes (51%) having SDRsex > 0.3. This figure declines to 17 items (41%) when volunteers are limited to those with age ≥ 45. In fact, for the majority of test items, SDRsex decreases appreciably after 45 years of age. For the age-related changes, we observed SDRage > 0.3 in 12 items (29%). This figure decreases to nine items when volunteers are limited to males. It is notable that SDRage is generally higher in females especially those for urea, Na, LDL-C, AST, LDH, ALP, ChE and IgM.
The simplified list of RIs.
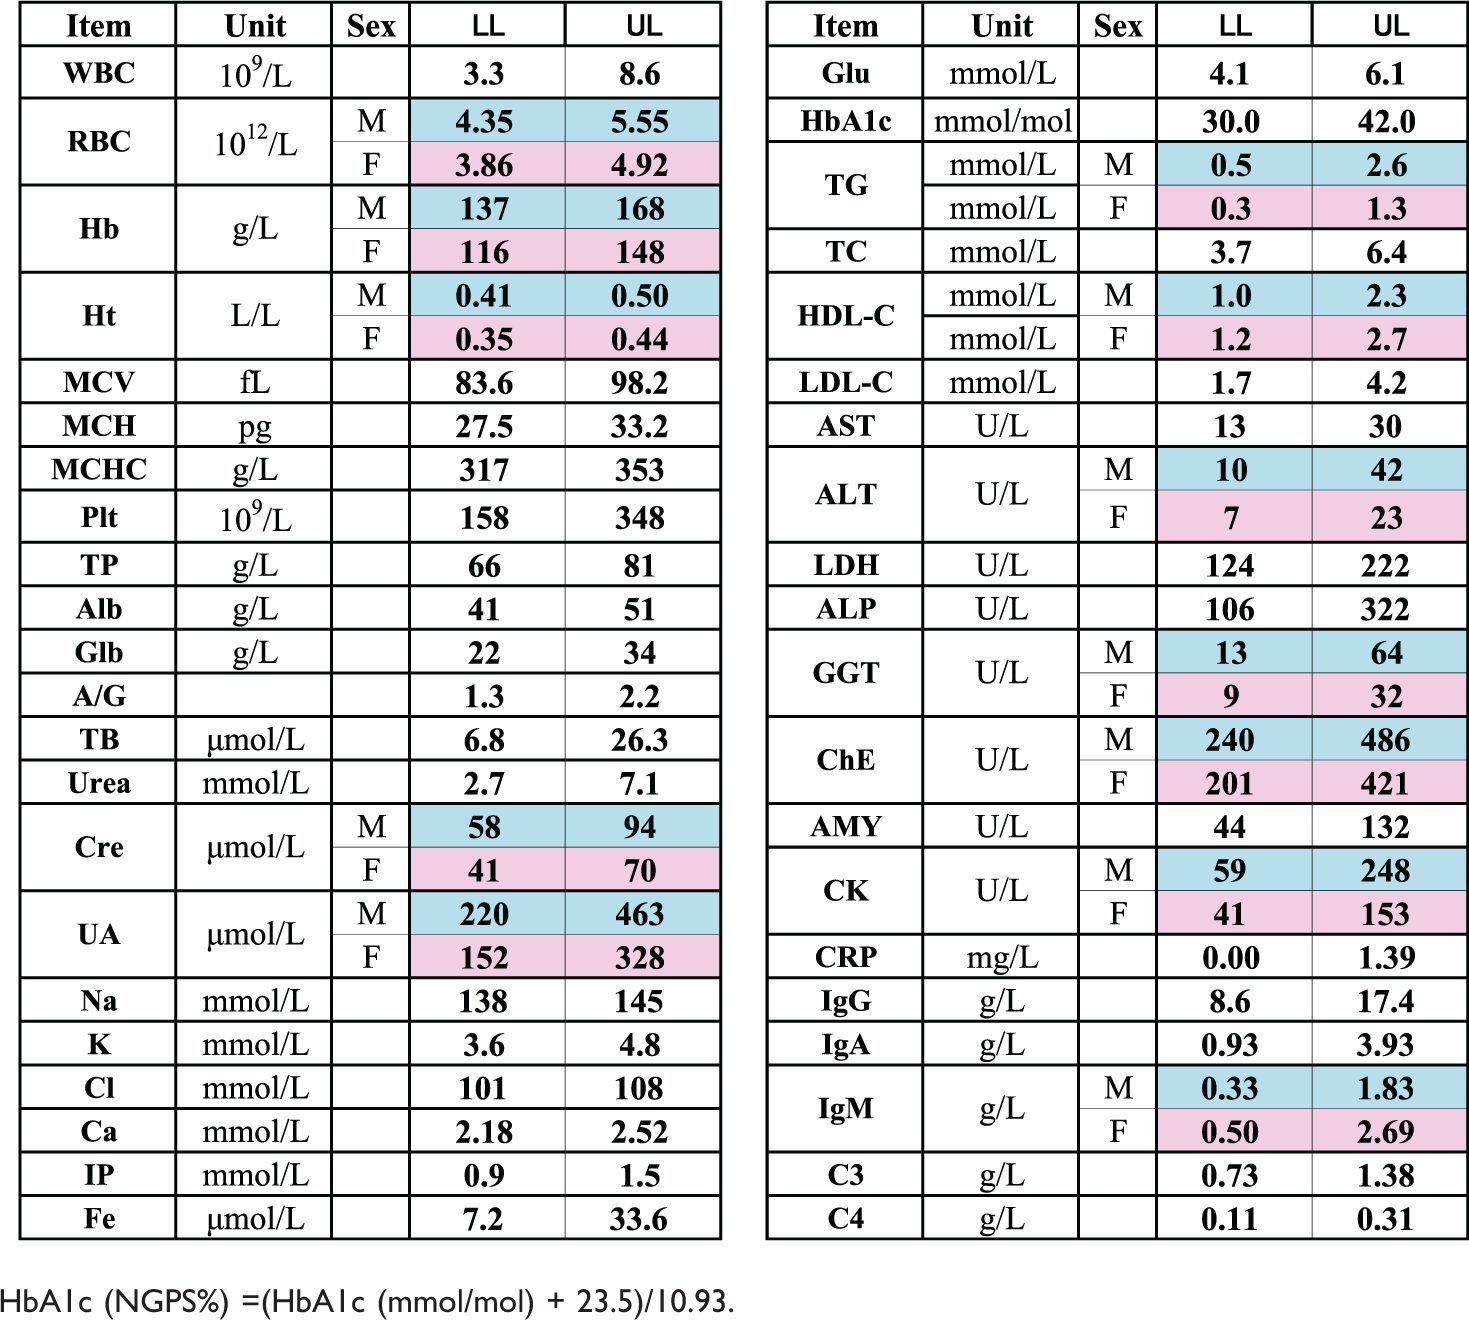
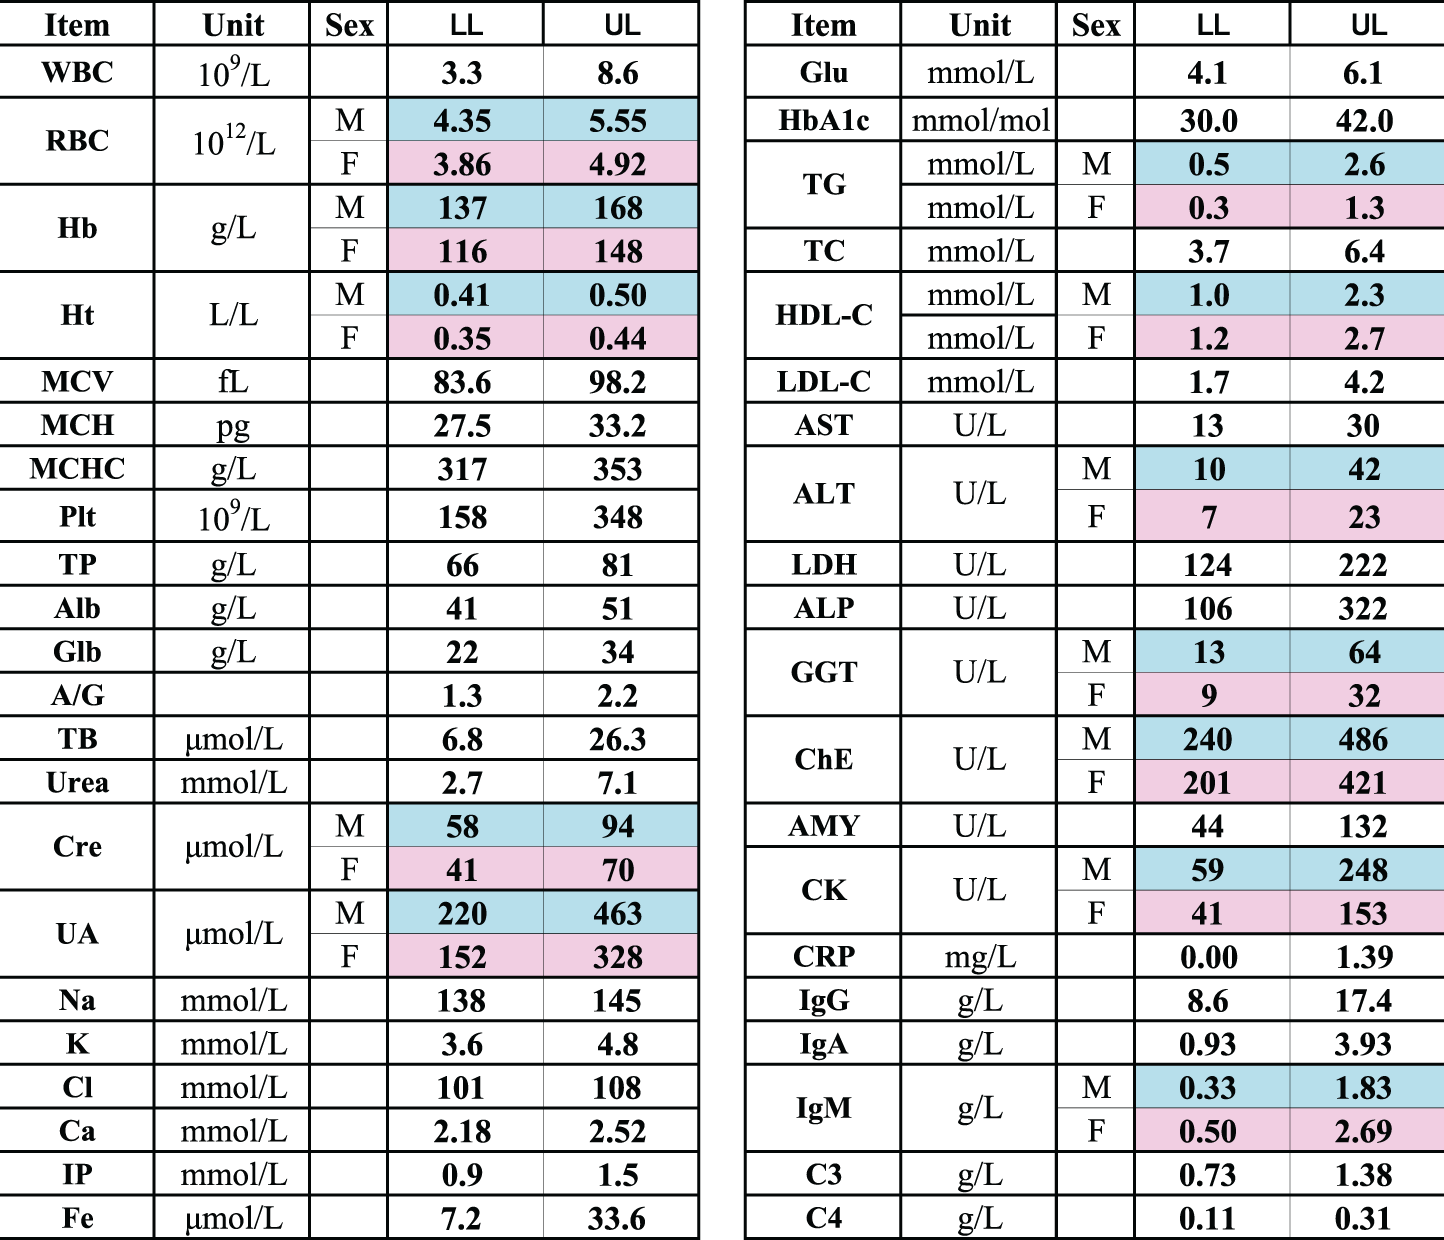
HbA1c (NGPS%) =(HbA1c (mmol/mol) + 23.5)/10.93.
Sex- and age-related profiles of RVs are shown as two-dimensional scattergrams in Figure 1 for 16 typical test items with high SDRsex and/or SDRage. All (approximately 6300) points were plotted for Alb, Urea, Cre, Na, Ca, IP. While, for UA, TG, HDL-C, LDL-C, ALP, ALT and GGT, approximately 4100 points (2840 points for Glu) were plotted by use of the principle of LAVE, ensuring absence of any abnormal result in the 13 reference test items other than the one being plotted. Similarly, for Hb and MCV, 3200 points were plotted using the LAVE principle to ensure absence in abnormal values for RBC, Hb, Ht and MCV. Horizontal yellow lines shown in the graphs for UA, Glu, TG and LDL-C represent CDLs specified in clinical guidelines9−11 to be described in the ‘Discussion’ section. The same graphs for all the test items are shown in Supplemental Figure 3 (in both SI and conventional units). These graphs clearly show the presence of sex- and age-related change patterns specific to each laboratory test.
Discussion
The results from clinical laboratory tests in Japan have been well standardized due to the continued efforts of the JSCC, JAMT and the Japan Society of Laboratory Medicine over the past 25 years under the leadership of IFCC. The gradual expansion of nationwide standardization has been well documented by convergence of among-laboratory results in the large-scale external quality-control surveys conducted by the Japan Medical Association, 12 JAMT and other organizations related to the IVD industry. As a result, there has been increased demand for establishment of common RIs. In 2009, JAMT conducted a study for derivation of common RIs with recognition of the achieved status of nationwide standardization through distribution of certified reference materials to the core clinical laboratories. 4 Test item by item evaluation of RVs gathered from the 105 core clinical laboratories also confirmed standardization of measurements after excluding a small percentage of laboratories showing biased results. The criterion for search and exclusion of laboratories was SDR for between-laboratory differences of >0.3. Test items found by these criteria were Na, Cl, Ca and MCHC, and laboratories which showed obviously biased results for those tests were not included to this joint study. In the meantime, the KU hospital group has been making concerted efforts over the past 10 years for harmonization of test results through regular cross-checking of samples, and it conducted an independent RI study in the region. 3 The RIs from the Asian IFCC/APFCB/JSCC study, targeting 72 major test items, included 2015 Japanese volunteers from 46 laboratories nationwide. Using a central laboratory for the assays, the study revealed regional differences among the East and Southeast Asian countries in a variety of test items.1,2 However, it firmly confirmed the absence of regional differences within Japan for any of the 72 items. This evidence supports the nationwide JAMT study with regard to the validity of merging RVs from 105 laboratories.
With this background, C-CRI of JSCC launched the current project in 2011 to establish highly reliable, common RIs using the merged data from the three studies. Regarding the harmonized status of the test results across the studies, as shown in Supplemental Figure 1, RVs of all standardized test items were confirmed to be well harmonized (SDR < 0.30) except for MCHC, Na and AST (with SDRstu = 0.36, 0.58 and 0.33, respectively). For Na, the width (UL−LL) of the RI is very narrow; therefore, the SDR tends to be inflated because of the smaller denominator: SDRI (1/4th of the width of the RI). For MCHC, the discrepancy was clearly attributable to between-manufacturer differences in analytical principle (see below); the vast majority of laboratories in Japan use Sysmex haematology analysers, while BC analysers were used exclusively in the IFCC/APFCB study. For AST, a difference in reference materials employed for recalibration of the assay may have caused the differences seen. The IFCC/APFCB study used sera with enzyme values assigned by laboratories belonging to Joint Committee for Traceability in Laboratory Medicine. 1 In any case, no noticeable differences in the RIs were observed before and after partitioning the RIs by the survey groups. Therefore, we decided to merge the dataset from the three studies.
With the haematological tests, we noted apparent between-sex differences in MCHC (SDRsex = 0.35) even after adjusting for between-study differences (SDRstu = 0.36). As shown in Supplemental Figure 1, there is no gender difference in the IFCC/APFCB study but differences are clearly seen in the other two studies. This appears to be the result of differences in the measurement method for Ht between the Sysmex and other manufacturers' analysers; after excluding results from the Sysmex analysers in the JAMT dataset, no between-sex differences were observed for MCHC using only BC and Abbott analysers.
In merging the results from the three studies, we had been concerned about possible reagent/method-dependent differences in RVs in other test items as well, such as Alb, HDL-C and LDL-C, for which reagent/method-dependent differences were well known. However, we found between-method differences expressed in SDR were 0.08, 0.15 and 0.04, respectively, calculated from the dataset of this project.
There has been controversy regarding the statistical procedures for derivation of RIs. The CLSI guideline recommends the use of a non-parametric (NP) method for determining the central 95% range as the RI. 5 In this collaborative study, we primarily adopted the P method by use of the modified Box–Cox formula. 6 Successful Gaussian transformation was confirmed in distributions for all test items. In Supplemental Table 3, we compared the RIs derived by [1]-P method with secondary exclusion by LAVE (called ‘JCCLS’) with those by use of the [2]-NP method without secondary exclusion (named ‘CLSI Excl(−)’) or the [3]-NP method with strict exclusion of individuals with BMI ≥25, ethanol ≥20 g/day or smoker (named ‘CLSI Excl(+)’).
ULs of the RIs by the [3]-NP method were appreciably higher than by the P method, especially for analytes like TC, LDL-C, GGT, CRP and CK. Conversely, LLs by the [3]-NP method are lower than with the P method for Hb, MCV, MCH and Fe. These phenomena are apparently attributable to remaining abnormal values after the exclusion procedures. The NP method cannot recognize those values as such, but the P method can because it preferentially fits to the central region of the distribution; thus abnormal values can be easily identified in the statistical process of regression. 7
The CLSI guideline emphasizes the importance of a priori selection of reference individuals (i.e. exclusion is done before sampling) and recommends only the Dixon 13 and Tukey 14 method for statistical exclusion of outliers. Therefore, rigorous secondary exclusion employing the LAVE method remains controversial. In Supplemental Table 3, it is apparent that the P method (with LAVE) gave much narrower RIs than the [2]-NP method (CLSI method without any exclusion) for the test items described above. This tendency is also true for TG, ALT, ALP and LDH. For the last two, we recently found that ALP-2, LDH-2 and LDH-3 had an apparent positive correlation with BMI. 15 Therefore, changes in RI limits caused by LAVE in those analytes clearly indicate the presence of a sizable number of individuals with latent metabolic abnormalities. It is not possible to exclude many ‘outliers’ sequentially by the univariate statistical procedures of Dixon or Tukey. The LAVE method can be a solution to cope with a high prevalence of latent disorders affecting test results. It corresponds to a ‘multivariate’ approach allowing iterative optimization of the RIs without truncating the distribution of the test values for which the RI is being determined.
On the other hand, neither LAVE nor the strict exclusion ([3]-NP method) had any effect on RIs for TP, Alb, TB, urea, Cre, Na, K, Cl, Ca or IP. It is rare for healthy individuals to have abnormal values for those analytes, and thus the LAVE method is of no use for them.
Another appropriate property of the LAVE method is that it does not require strict a priori exclusion criteria in the recruitment of healthy subjects. In fact, when we presumptively applied very strict criteria with the [3]-NP method (CLSI Excl(+)), the number of subjects was reduced to 55% of the original data size, yet the RIs remained biased to the lower or higher side. In any case, if we adopt such strict criteria in recruitment, it would have been very difficult to conduct a primary study of RIs.
Regarding the issue of strict secondary exclusion, it is noteworthy to mention the RIs just released by the Japan Society of Ningen Dock (an academic society for comprehensive health screening). It conducted a large-scale study to derive RIs for 25 commonly measured screening tests, including blood pressure and BMI, by use of an a posteriori data-mining approach. 16 Well-standardized records of 1,500,000 health screening attendees gathered from all over Japan were used for source data. Records of apparently healthy individuals were retrieved by the criteria of BMI <25, ethanol <20 g/day, no smoking, normotensive and no regular medication, which constitute a set of ideal attributes of health in Japan. Only 16.4% of male and 31.8% of female attendees’ records remained after the selection. However, the RIs of some nutritional markers were regarded as inappropriate in comparison to the CDL for the respective test item. Therefore, as an additional measure of exclusion to obtain ideal reference individuals, the LAVE method was applied in the strictest way with no abnormal value allowed [Please check the following sentence for clarity (only seven are given instead of nine reference test items): among nine reference test items: Alb, UA, Glu, HDL-C, LDL-C, TG, AST, ALT, and GGT. The LAVE method further reduced the record size by 40%. Interestingly, the RIs thus determined by the study matched extremely well. This evidence implies that, in the a priori type of study, rather loose criteria can be used in the recruitment as long as LAVE method is applied secondarily, although some reduction in data size takes place by applying the method. The reduction was approximately 20% in this a priori study. This reduction is much smaller compared to the 40% described above for the a posteriori study.
The RIs thus determined are to be used nationwide for common use, and they have been already certified by C-CRI of the JCCLS. Public comments on the new RIs have been sent to the C-CRI. Among queries or comments from a variety of sources, the most frequent query is how to avoid confusion among clinicians regarding the distinction between RIs and CDLs.
RIs are always confused with CDLs, which are specified by consensus among clinical experts for the early detection and management of various diseases, such as TG of 1.70 mmol/L (150 mg/dL), 11 LDL-C 3.62 mmol/L (140 mg/dL) 11 and HDL-C 1.03 mmol/L (40 mg/dL) 11 for atherosclerosis; Glu 5.56 mmol/L (100 mg/dL) 10 for diabetes mellitus, and UA 417 μmol/L (7.0 mg/dL) 9 for hyperuricaemia. In contrast to these CDLs, the RI serves as a yardstick for interpreting test results in reference to the range of values typically seen in healthy individuals. In fact, the RI is not for distinguishing disease from non-disease because we cannot completely exclude latent diseases in the selection of reference individuals.
There are often large differences between CDLs and the ULs (or LLs) of the RIs. However, we have demonstrated that the gap could be reduced appreciably by applying appropriate exclusion procedures.7,16,17 In fact, RIs derived in this study represent well-defined individuals with lack of abnormal results in major test results. Therefore, the interpretation of a value in that zone depends on the status of other health attributes. In the presence of other risk factors, the value may point to the need for closer attention. Otherwise, the value is regarded as ‘non-illness’ to be followed up.
On the other hand, in applying CDL for therapeutic intervention, it is important to note that CDL was determined without consideration of gender- and age-related changes in test results – or indeed of the RIs themselves. As shown in Figure 1, the clinical implication of CDL may change according to the contexts of gender and age. The precise gender- and age-related profiles, which are peculiar to each analyte, should be of relevance for judicious consideration of CDLs.
There is an assumption that, when a CDL is specified for a laboratory test, it represents the ‘healthy’ value limit, and thus there is no need for determining the RI. On the contrary, the RI is essential because utility of the RI is not just for the diseases targeted by the CDL but for other disorders which may affect the test value. For example, LDL-C is not just for prediction of atherosclerosis, but important for diagnosing biliary obstruction, nephrotic syndrome or hypothyroidism, in which an increased LDL-C level indicates abnormal cholesterol metabolism. In fact, in diagnosing those conditions, the UL of the RI is more relevant than the CDL set as a critical limit for prevention.
Conclusion
In consideration of the nationwide standardization of laboratory tests in Japan, common RIs for nationwide use were developed for 40 major assays after merging datasets from three recently conducted national multicentre studies using of up-to-date statistical methods. Sex- and age-dependent profiles of RVs are of relevance not only in interpreting test results based on the newly developed RIs but also in applying CDLs specified in various clinical guidelines.
Derivation of RIs by the P method after secondary exclusion by the LAVE method was essential for test items which serve as markers of prevalent conditions, such as metabolic syndrome, muscular damage or anaemia.
Footnotes
Acknowledgement
We are very grateful to Mr Reo Kawano and Mr Shogo Kimura of Yamaguchi University Graduate School of Medicine for their invaluable help in analysing the data and producing graphs used in this article. We appreciate the secretariat of JCCLS for its support in holding C-CRI meetings for discussion. We are indebted to Prof. Myron Johnson of University of North Carolina for his generous support for scientific editing of this manuscript.
Declaration of conflicting interests
The author(s) declared no potential conflicts of interest with respect to the research, authorship, and/or publication of this article.
Funding
The author(s) received no financial support for the research, authorship, and/or publication of this article.
Ethical approval
The ethical approval obtained at the time of conducting each of the three multicentre studies.
Guarantor
KI.
Contributorship
All co-authors are members of Committee on Common Reference Interval (C-CRI) of JSCC.
KI coordinated the IFCC/APFCB Asian Study for derivation of common RIs in 2009, and YI, YY, SH collaborated in the study. YY and SH organized the JAMT nationwide RI study in 2009, and MI, TH and DK collaborated in the study. TH and DK coordinated the Kyushu University group’s RI study. The three studies were put together by the leadership of DK as a chair of C-CRI. Data processing and statistical evaluations towards establishment of common RIs for nationwide use were performed by KI and YY. C-CRI meetings were held 10 times over the past three years, and all members took part in discussions on methodological issues, critical evaluation of analytical results and propagation of the established RIs for nationwide use. KI wrote this manuscript.
References
Supplementary Material
Please find the following supplemental material available below.
For Open Access articles published under a Creative Commons License, all supplemental material carries the same license as the article it is associated with.
For non-Open Access articles published, all supplemental material carries a non-exclusive license, and permission requests for re-use of supplemental material or any part of supplemental material shall be sent directly to the copyright owner as specified in the copyright notice associated with the article.