
Abstract
Background
The bromocresol green (BCG) assay is commonly used for measuring albumin (ALB), but is affected by α1- and α2-globulins, which are elevated in systemic inflammation. The modified bromocresol purple (mBCP) assay is another dye-binding method developed to overcome non-specific reactions. Concentrations of α2-macroglobulin, a major α2-globulin component, are increased in nephrotic syndrome (NS), but not in inflammation. There is little direct evidence that α2-macroglobulin affects BCG or mBCP assays.
Methods
We measured serum albumin concentrations in 33 patients with NS and 13 reference healthy controls using BCG (ALBBCG) and mBCP (ALBmBCP) assays, and nephelometry (nALB) as a reference method. We also determined five specific proteins belonging to the α1- and α2-globulins by nephelometry. After adding purified α2-macroglobulin to albumin solutions, protein reactivity in these three assays was compared.
Results
Nephrotic syndrome patients were categorized to tertiles according to nALB concentration. In all tertiles, ALBBCG was significantly higher than nALB, especially in the severe hypoalbuminemia group, in which α2-macroglobulin was 43–49% higher. By contrast, ALBmBCP and nALB were almost identical in all three groups. The difference between ALBBCG and nALB was positively correlated with the α2-macroglobulin concentration. In vitro, when α2-macroglobulin was added to solutions containing identical albumin concentrations, α2-macroglobulin dose-dependently increased ALBBCG, but not ALBmBCP.
Conclusions
In NS, α2-macroglobulin is a major factor for positive bias of ALBBCG, especially in patients with severe hypoalbuminemia. The mBCP assay is useful for measuring albumin concentrations in NS.
Introduction
Human serum albumin is a major soluble globular protein consisting of 585 amino acids with a molecular weight of 66.5 kDa. 1 The albumin exists in human serum in either reduced or oxidized forms. 2 It plays a crucial role in the maintenance of colloid osmotic pressure, antioxidant action and delivery of various important substances, including fatty acids, hormones, trace metals and certain drugs3–5 In healthy human adults, albumin is synthesized in the liver at a rate of 12 g per day and remains in the blood vessels with a biological half-life of approximately three weeks. 6 Under physiological conditions, most serum albumin does not leak into the urine through glomerular basement membranes due to its size and negative charge (i.e. size and charge barriers). 7 These barriers can be severely damaged by primary kidney diseases or systemic diseases, resulting in massive proteinuria as well as heavy hypoalbuminemia, peripheral edema and dyslipidemia. Such clinical features constitute nephrotic syndrome. 8 The measurement of the serum albumin concentration is of great importance in the diagnosis and management of patients with nephrotic syndrome. 9
In clinical practice, the serum albumin concentration is usually measured by dye-binding methods, such as the bromocresol green (BCG) assay or bromocresol purple (BCP) assay. 10 The BCG assay reacts non-specifically with α-globulins (especially α2-globulin), concentrations of which are increased in inflammation.11,12 Although the BCP assay is more specific for albumin than is the BCG assay, the reactivity to albumin is different between the oxidized and reduced forms. 2 However, the modified BCP (mBCP, an improved formula of the original BCP) assay reacts with reduced and oxidized albumin equally. 2 Although earlier studies indicated that the BCG assay has the greatest reactivity with α2-globulin,13,14 α2-globulin is a collective term for various proteins with α2-mobility on electrophoresis, and it is likely that the composition of α2-globulin changes depending on clinical conditions. Serum α2-macroglobulin, which has the highest serum concentration among the α2-globulins, is elevated in nephrotic syndrome but not in inflammation.15,16
To examine whether α2-macroglobulin causes discrepancy between BCG and mBCP assays, we comparatively measured serum albumin concentrations using the two dye-binding assays, and nephelometry as a reference method in patients with nephrotic syndrome. We also carried out in vitro experiments using albumin solutions supplemented with purified α2-macroglobulin. Here, we warn that the BCG assay should never be used in nephrotic syndrome because it shows high reactivity with α2-macroglobulin, which is increased in these patients.
Materials and methods
Blood samples
Thirty-three serum samples of the patients with nephrotic syndrome were collected at Juntendo University Hospital, Tokyo. The criteria for the syndrome are as follows: (1) severe proteinuria (urine protein excretion ≥ 3.5 g/day), (2) hypoproteinemia (serum total protein ≤ 60 g/L) and/or hypoalbuminemia (serum albumin concentration ≤ 30 g/L), (3) edema, and (4) hypercholesterolemia (serum total cholesterol ≥ 6.465 mmol/L). Both (1) and (2) must be fulfilled as a prerequisite for a definitive diagnosis. We also collected fresh serum samples from 13 healthy volunteers. All of the subjects agreed to participate in this study and provided written informed consent after being made fully aware of the study protocol. The study protocol was reviewed and approved by ethics committee of Juntendo University Hospital, and the study was conducted in full accordance with the Declaration of Helsinki.
Assays for measuring protein subfractions
Albumin concentrations were measured using three assays based on different principles. We used two dye-binding assays, and an immunoassay for albumin, and five proteins classified as α-globulins: the BCG assay (Kainos Auto-series ALB Test Kit; Kainos Laboratories, Tokyo, Japan), the modified BCP assay (Aqua-auto Kainos ALB Test Kit; Kainos Laboratories) on a Hitachi Automatic Analyzer LABOSPECT008 (Hitachi High-Technologies Corporation, Tokyo) and nephelometry on a BN-II (N Antiserum to Human Albumin; Siemens Healthcare Diagnostics K.K., Tokyo). 2,17–19
Five specified proteins in α1- and α2-globulin fractions were quantified by nephelometry: α1-acid glycoprotein and α1-microglobulin categorized as α1-globulins, α2-macroglobulin, ceruloplasmin, and haptoglobin as α2-globulins. In some patients, albumin and globulin fractions were separated on a cellulose acetate membrane by electrophoresis. Each fraction was quantified by densitometry.
Other laboratory tests
All of the following assays are routine laboratory tests used to evaluate the clinical condition of patients with nephrotic syndrome: total protein (TP); total cholesterol (TC); triglyceride (TG) (Aqua-auto Kainos TP-II, T-CHO, TG-II Test Kit; Kainos Laboratories); low-density lipoprotein-cholesterol (LDL-C) (Cholestest LDL; Sekisui Medical, Tokyo) and high-density lipoprotein-cholesterol (HDL-C) (MetaboLead HDL-C; Kyowa Medex, Tokyo). Previously, we confirmed the precision of these assays.20,21 High-sensitivity C-reactive protein (hs-CRP) was measured using latex-enhanced immunonephelometry (CardioPhase hsCRP; Siemens Healthcare Diagnostics, NY, USA). Instead of measuring 24-h urine protein excretion, spot urine protein concentration and its protein/creatinine (P/C) ratio were used to estimate the severity of proteinuria.
In vitro tests of the reactivity of the BCG and mBCP assays with α2-macroglobulin
We prepared a series of albumin solutions supplemented with different α2-macroglobulin concentrations. The final albumin concentration was set at 40 g/L in all solutions. Purified α2-macroglobulin was purchased from Sigma-Aldrich, with 98% (SDS-PAGE) purity (St. Louis, MO, USA). Human serum albumin (HSA) was from the same company with 97% purity. They were supplemented with phosphate-buffered saline (PBS). Purified α2-macroglobulin was reconstituted with HSA solution. The final concentration of α2-macroglobulin was adjusted to 0 to 10.0 g/L. In these solutions, the albumin concentrations were determined in quintuplicate using the three methods: nephelometry, BCG and mBCP assays. These albumin values are designated as nALB, ALBBCG and ALBmBCP, respectively. The means and standard deviations were calculated for further analysis.
Statistical analysis
Data are presented as the means±SD unless otherwise stated. According to the data distribution, we used parametric or nonparametric statistical analysis for the comparisons. Differences between nephrotic syndrome and control groups were determined using Fisher's exact test for ratio variables and continuous variables using the Student's t-test and Mann–Whitney U-test according to the presence or absence of Gaussian distribution. Differences among the subgroups of nephrotic syndrome were analysed using ANOVA and Kruskal-Wallis test according to the presence or absence of Gaussian distribution. Associations between two variables were evaluated using Pearson's correlation analysis. All analyses were performed using the statistical software SPSS version 12.0J (SPSS, Chicago, IL, USA). In all analyses, P < 0.05 was taken to indicate statistical significance.
Results
Clinical characteristics of the study participants
Anthropometric and laboratory measurements of the study participants.
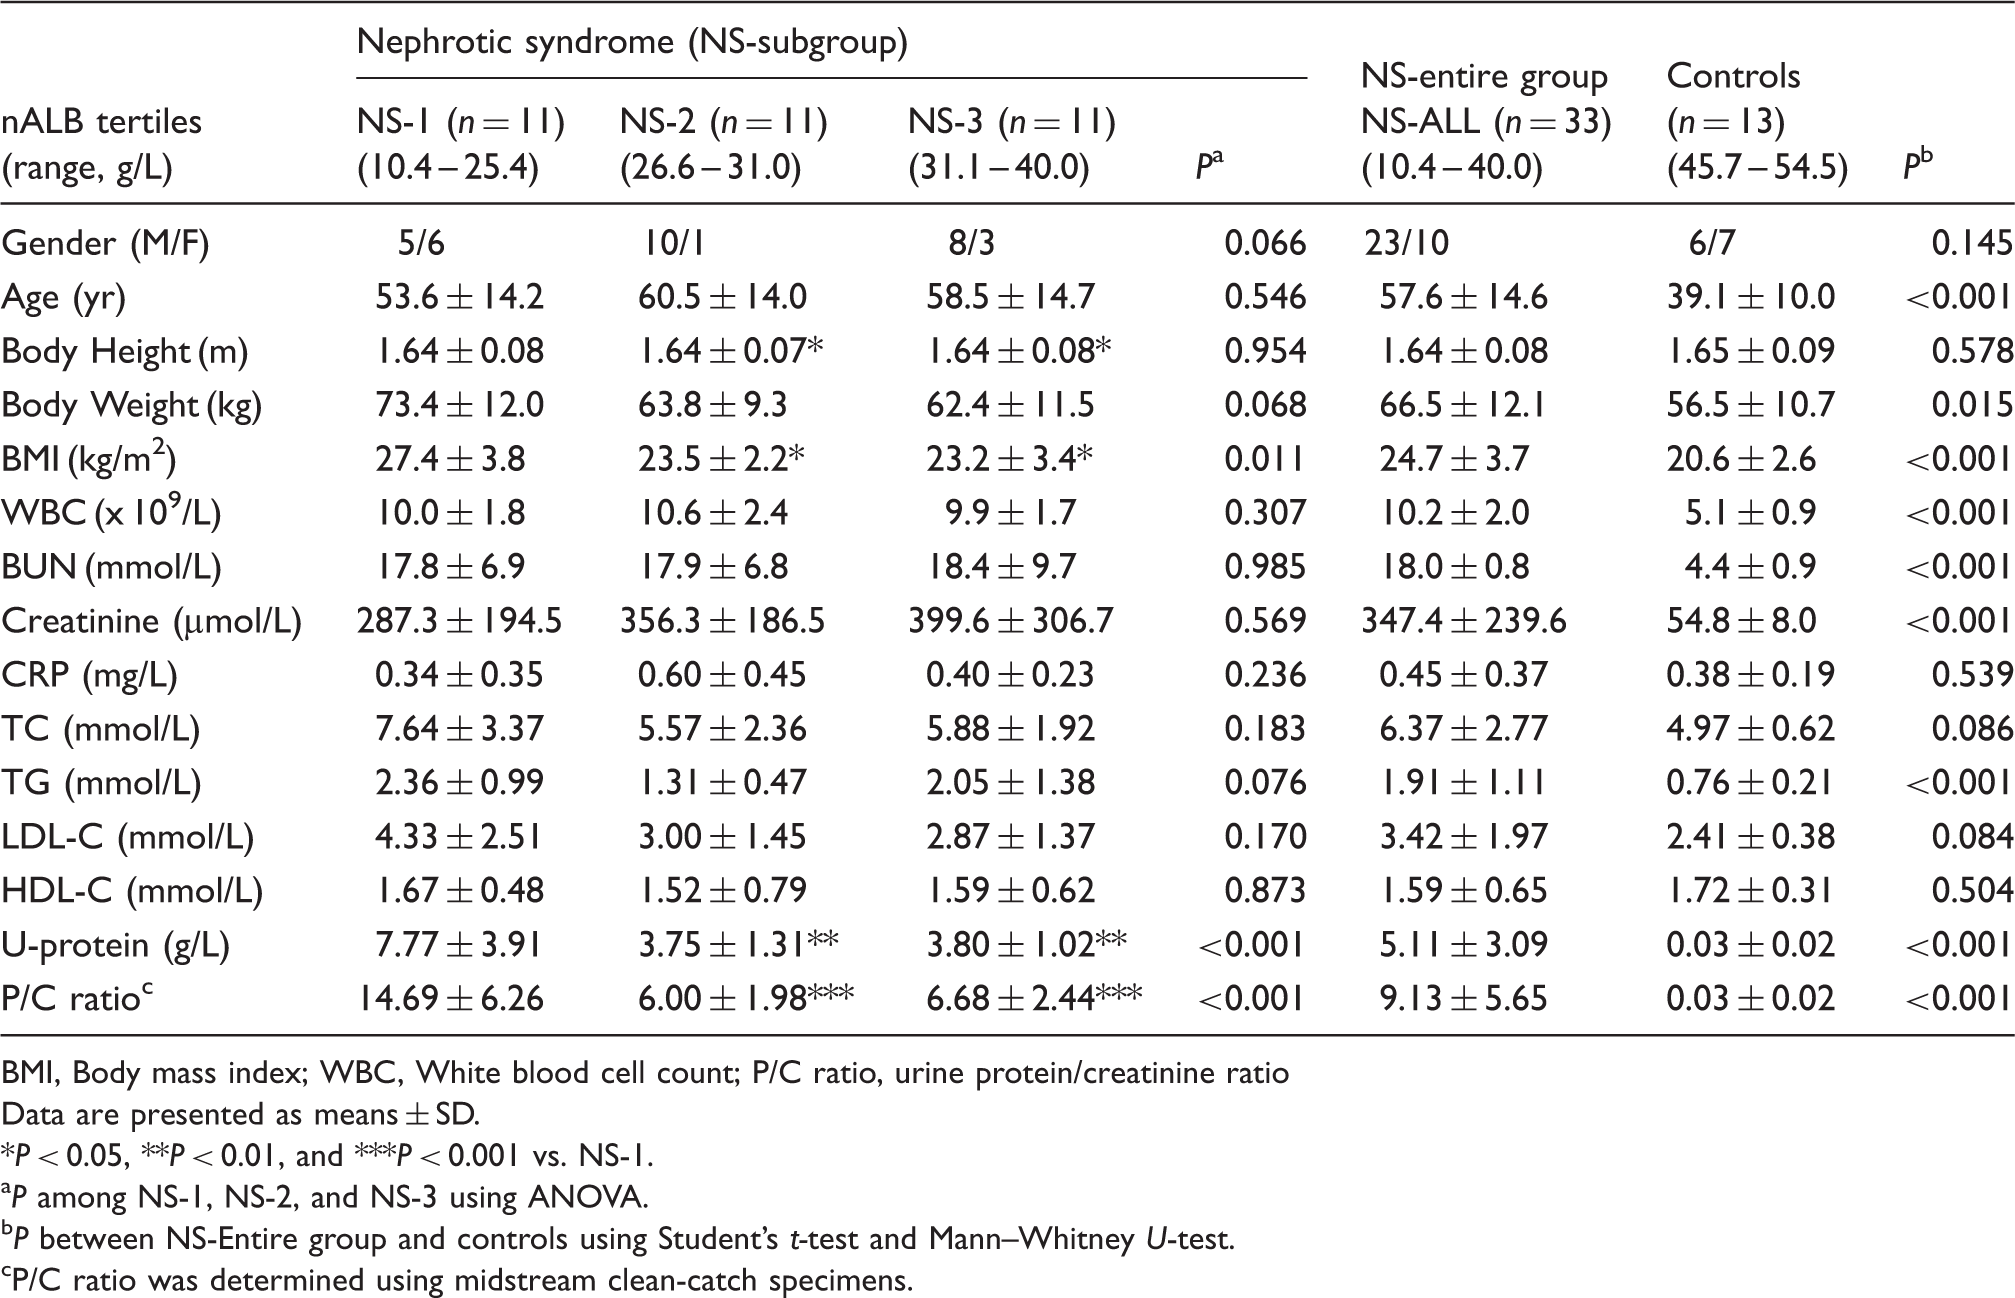
BMI, Body mass index; WBC, White blood cell count; P/C ratio, urine protein/creatinine ratio
Data are presented as means ± SD.
*P < 0.05, **P < 0.01, and ***P < 0.001 vs. NS-1.
P among NS-1, NS-2, and NS-3 using ANOVA.
P between NS-Entire group and controls using Student's t-test and Mann–Whitney U-test.
P/C ratio was determined using midstream clean-catch specimens.
Comparisons of ALBBCG, ALBmBCP and nALB
In all categories, ALBBCG was higher than nALB. Even in the control group, ALBBCG was 2.3% higher than nALB (50.0 ± 2.4 vs. 48.9 ± 2.7 g/L, respectively, P = 0.038). In all subgroups of nephrotic syndrome, ALBBCG was higher than nALB. This difference rose to nearly 30% in the NS-1 group (Table 2). On the other hand, ALBmBCP showed good agreement with nALB in not only the control group but also in the NS-1 group. These observations indicated that the discrepancy between ALBBCG and ALBmBCP increased with a decrease in serum albumin concentration (Figure 1).
Scatter plots of ALBBCG and ALBmBCP against nALB in patients with nephrotic syndrome. Serum samples were collected from 33 patients with nephrotic syndrome. The albumin concentrations measured using the bromocresol green (ALBBCG, closed circles) and modified bromocresol purple (ALBmBCP, open circles) assays were plotted against those measured using nephelometry (nALB). Protein fraction profiles of the study participants. P < 0.05, and ***P < 0.001 vs. NS-1. P < 0.01, and ###P < 0.001 vs. NS-2. P < 0.05, †††P < 0.001 vs. nALB in the same NS-subgroup. P < 0.05, ‡‡‡P < 0.001 vs. ALBBCG in the same NS-subgroup. P values among NS-1, NS-2, and NS-3 by ANOVA. P values between NS-Entire group and controls using Student's t-test and Mann–Whitney U-test. P values for albumin concentrations in each NS-subgroup, NS-ALL and controls using ANOVA.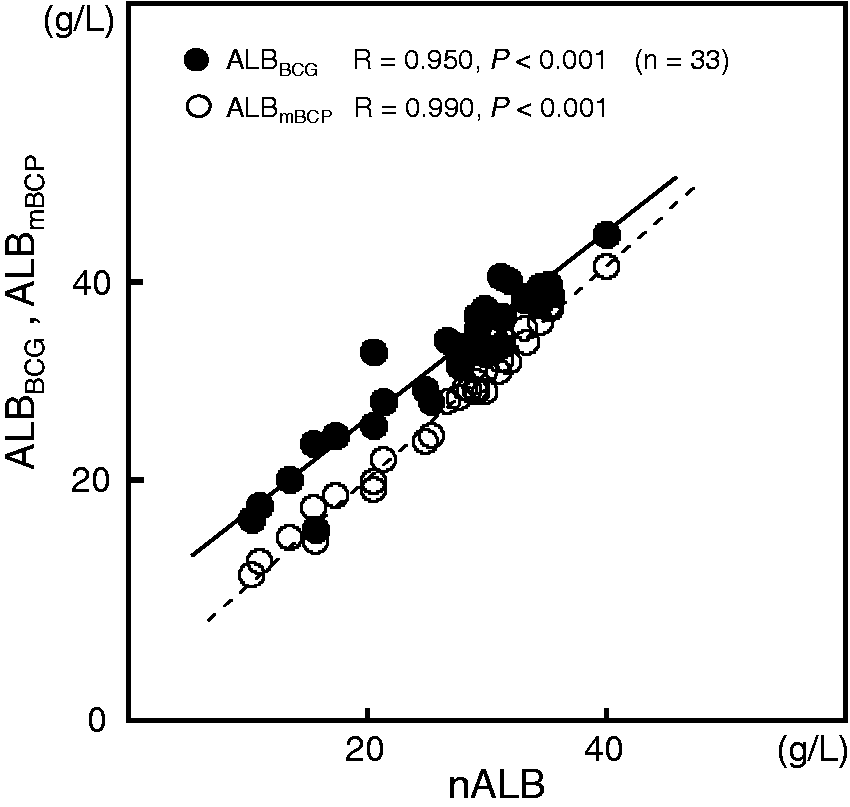
Profiles of α1- and α2-globulins and immunoglobulins
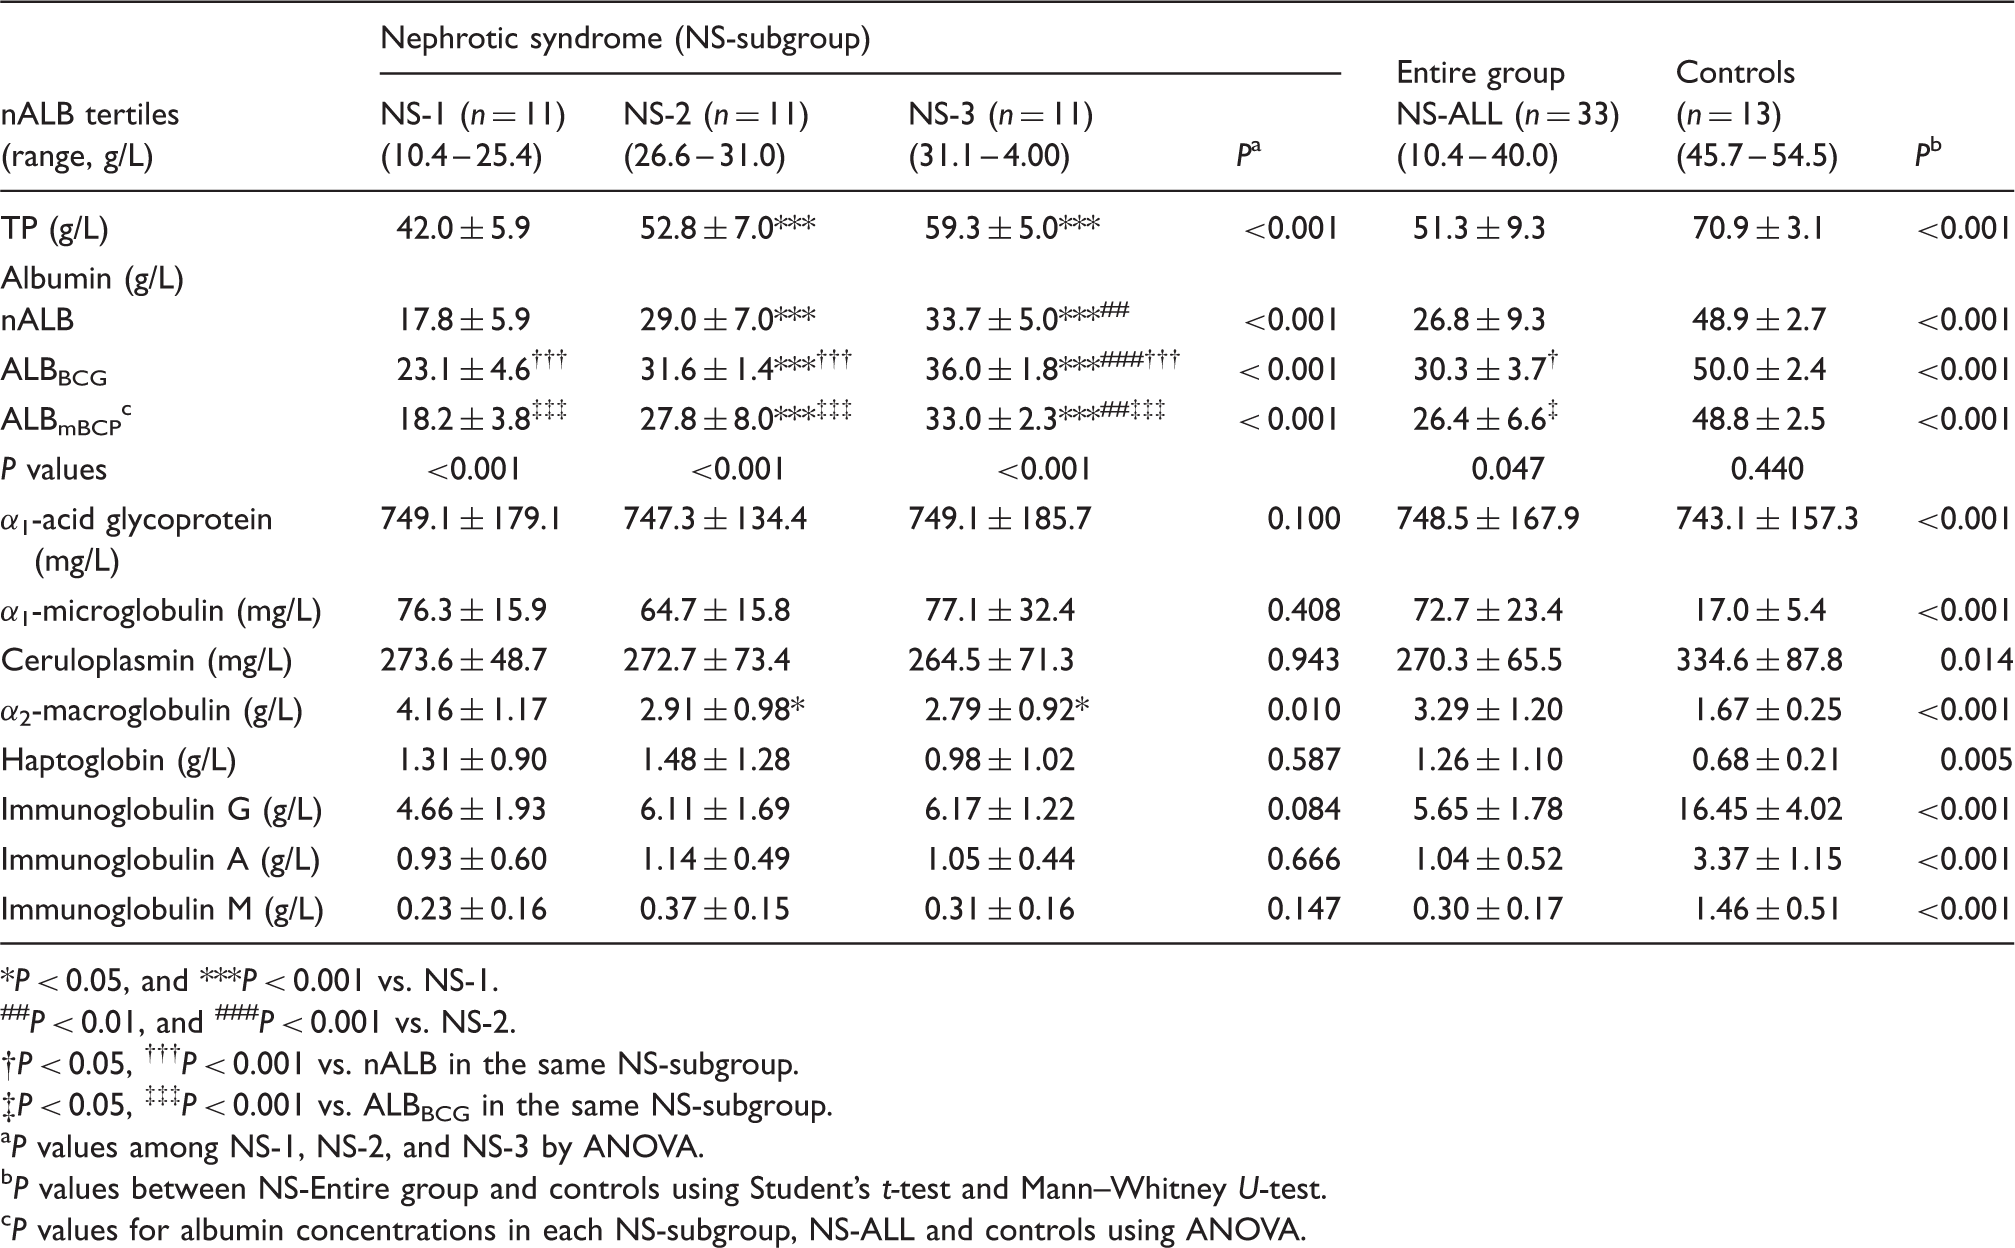
Cellulose acetate electrophoresis indicated that the α2-globulin peak was the largest among the globulin fractions in the patient with nephrotic syndrome (Figure 2(a)). Although the TP concentration was lower in nephrotic syndrome patients than in controls, the estimated absolute concentration of α2-globulin was still higher in the former than the latter.
Representative electrophoretic patterns of serum protein fractions separated on cellulose acetate membrane. Fresh serum samples were separated on a cellulose acetate membrane. After staining of the proteins, each fraction was quantified densitometrically. Representative cases of nephrotic syndrome (a) and control groups (b) are presented.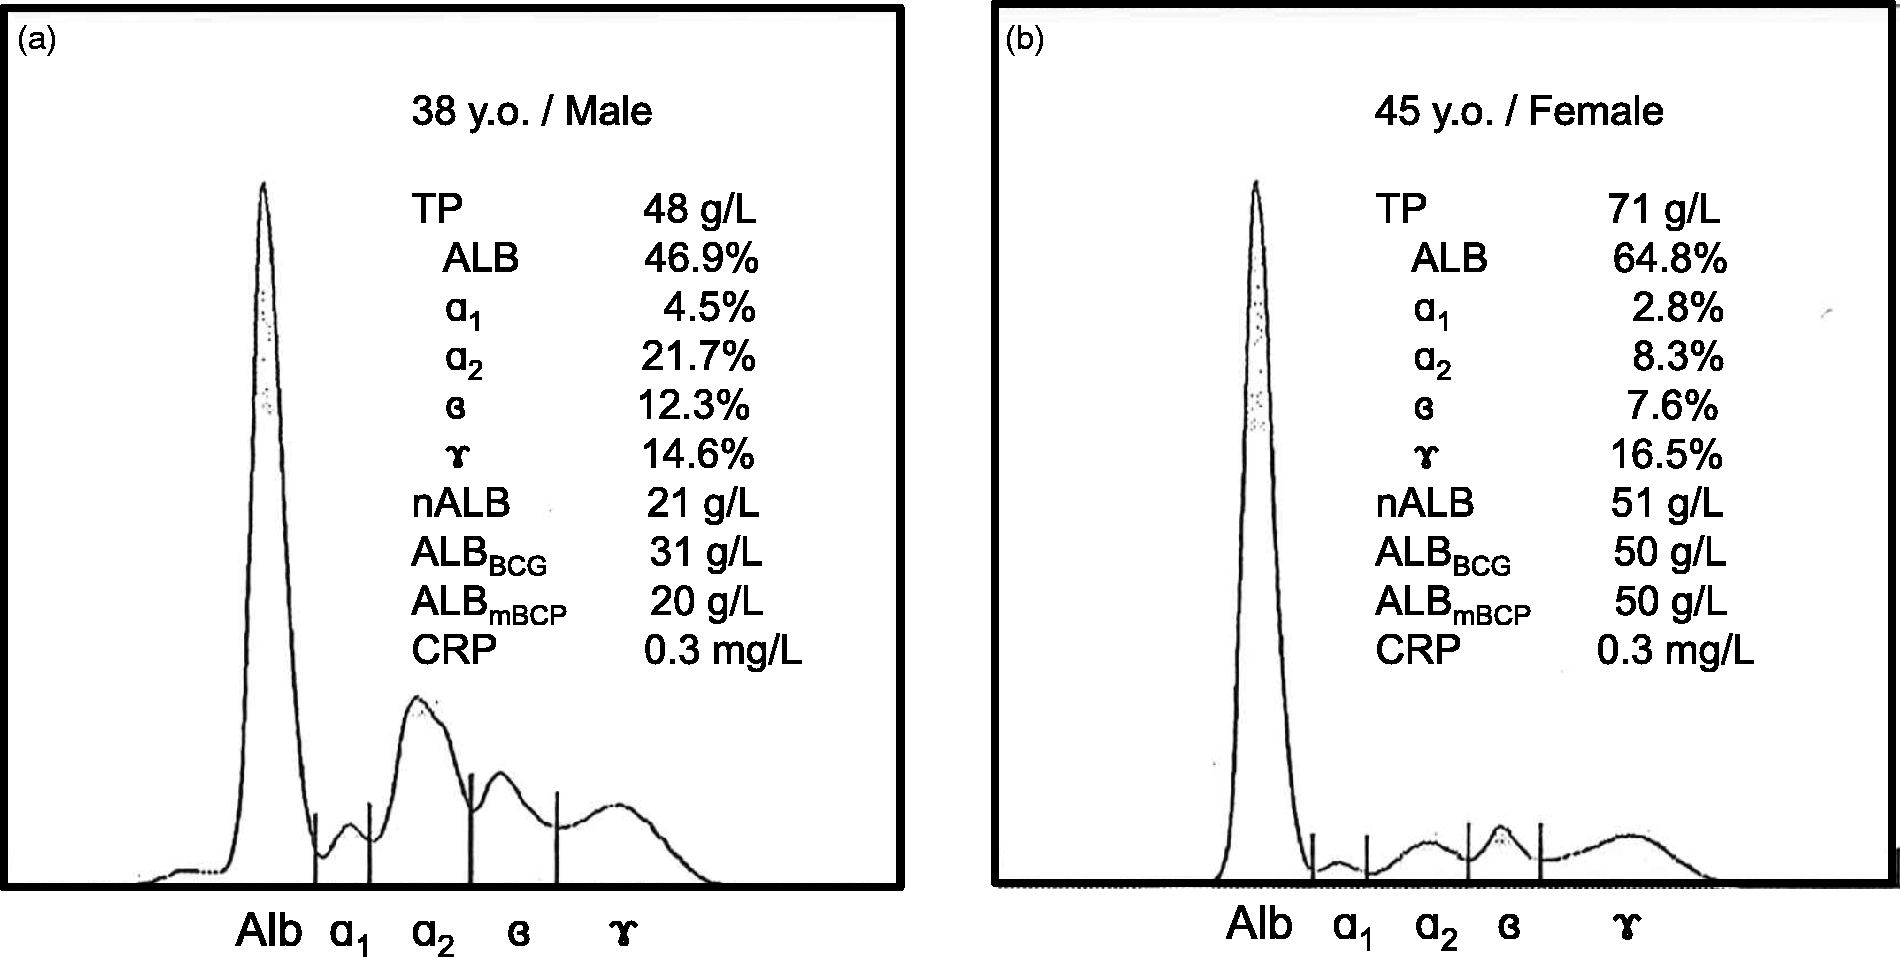
Among the five proteins classified into α1- and α2-globulins, the mean values of α1-microglobulin, α2-macroglobulin and haptoglobin were markedly increased in nephrotic syndrome (Table 2). The increase was greatest for α2-macroglobulin in the NS-1 group and for haptoglobin in the NS-2 group, while α1-acid glycoprotein, α1-microglobulin and ceruloplasmin concentrations were not markedly different among subgroups. All of the immunoglobulins were decreased markedly in nephrotic syndrome. There was no significant trend in the immunoglobulin concentrations among the three subgroups.
The in vivo reaction of α2-macroglobulin with albumin assays
In nephrotic syndrome, ΔALB, calculated by subtracting nALB from ALBBCG, was significantly correlated with the concentration of α2-macroglobulin, but not with that of haptoglobin (Figures 3(a) and (b)). In the samples with low haptoglobin concentrations, but high ΔALB, the α2-macroglobulin concentrations were considerably higher than those in the samples with similar haptoglobin concentrations and low ΔALB.
Scatter plots of α2-macroglobulin and haptoglobin concentrations against ΔALB. ΔALB was calculated by subtracting nALB from ALBBCG. The correlations of ΔALB with α2-macroglobulin (a) and haptoglobin (b) were examined.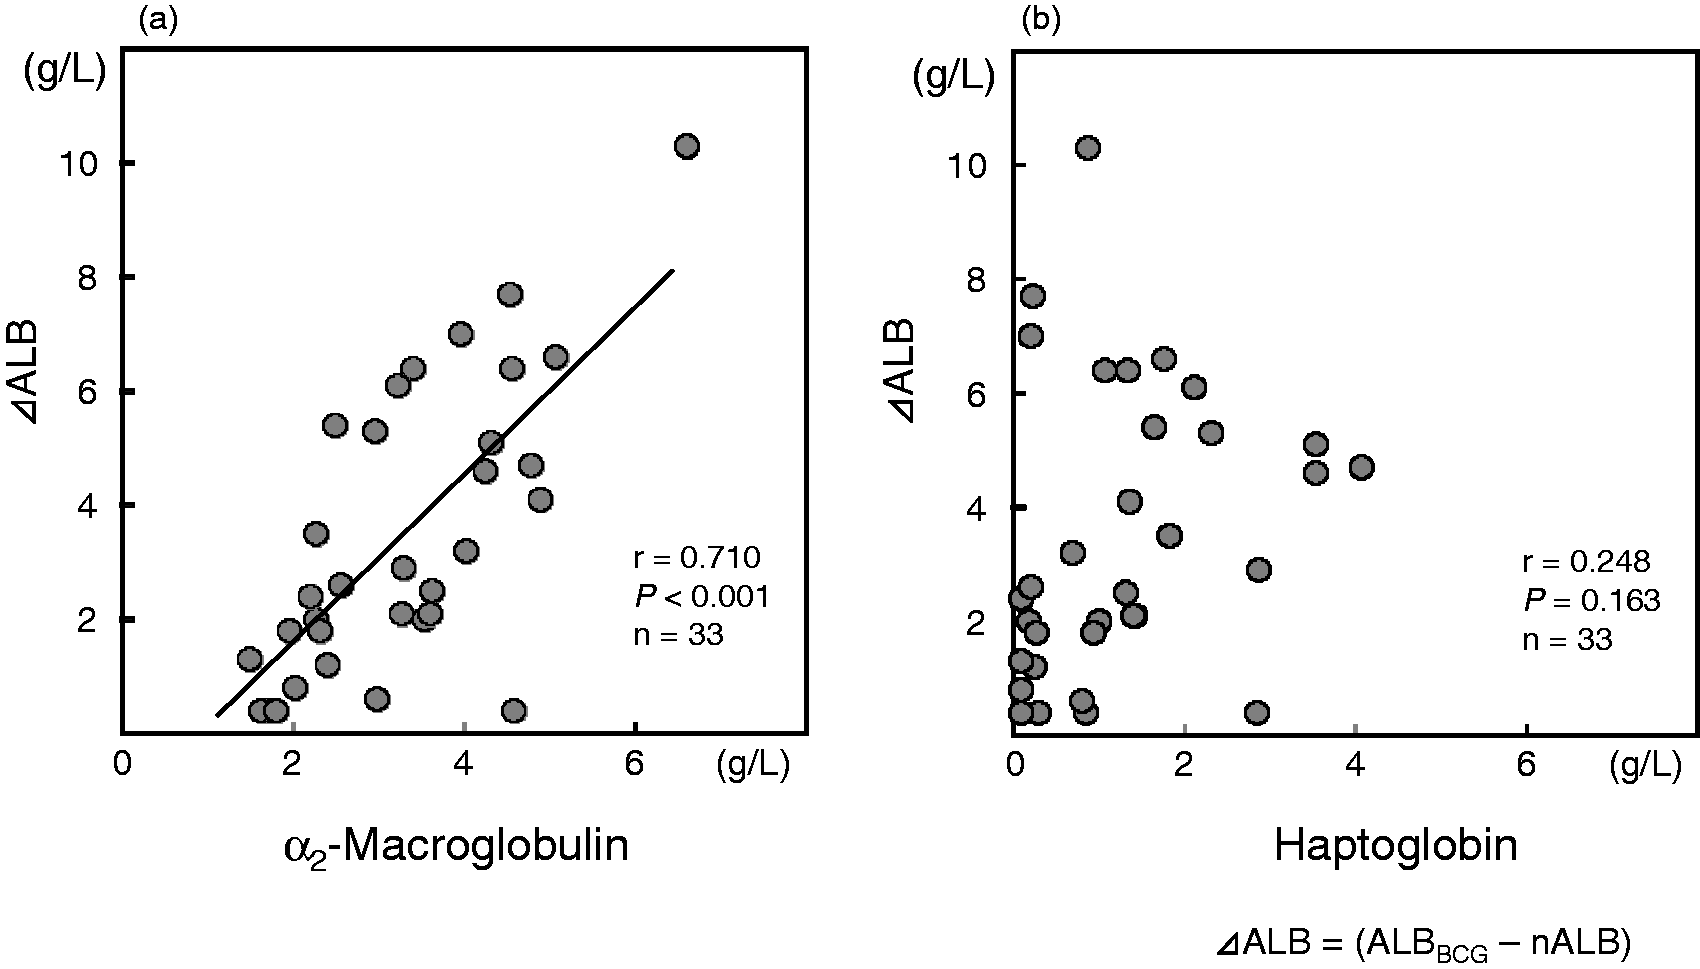
The in vitro reaction of α2-macroglobulin with albumin assays
To explore the reactivity of α2-macroglobulin with the BCG assay, different concentrations of purified α2-macroglobulin were added to fixed-concentration HSA solutions. In solutions containing the same amount of human serum albumin, α2-macroglobulin significantly increased ALBBCG values in a dose-dependent manner. α2-Macroglobulin contributed a 58 – 92% increase in ALBBCG values. By contrast, it did not increase ALBmBCP values (Figure 4).
The effects of exogenous α2-macroglobulin on ALBBCG and ALBmBCP concentrations. A set of purified α2-macroglobulin solutions was added to the albumin solutions (final albumin concentration: 40 g/L). Measurements of nALB, ALBBCG, and ALBmBCP were repeated five times.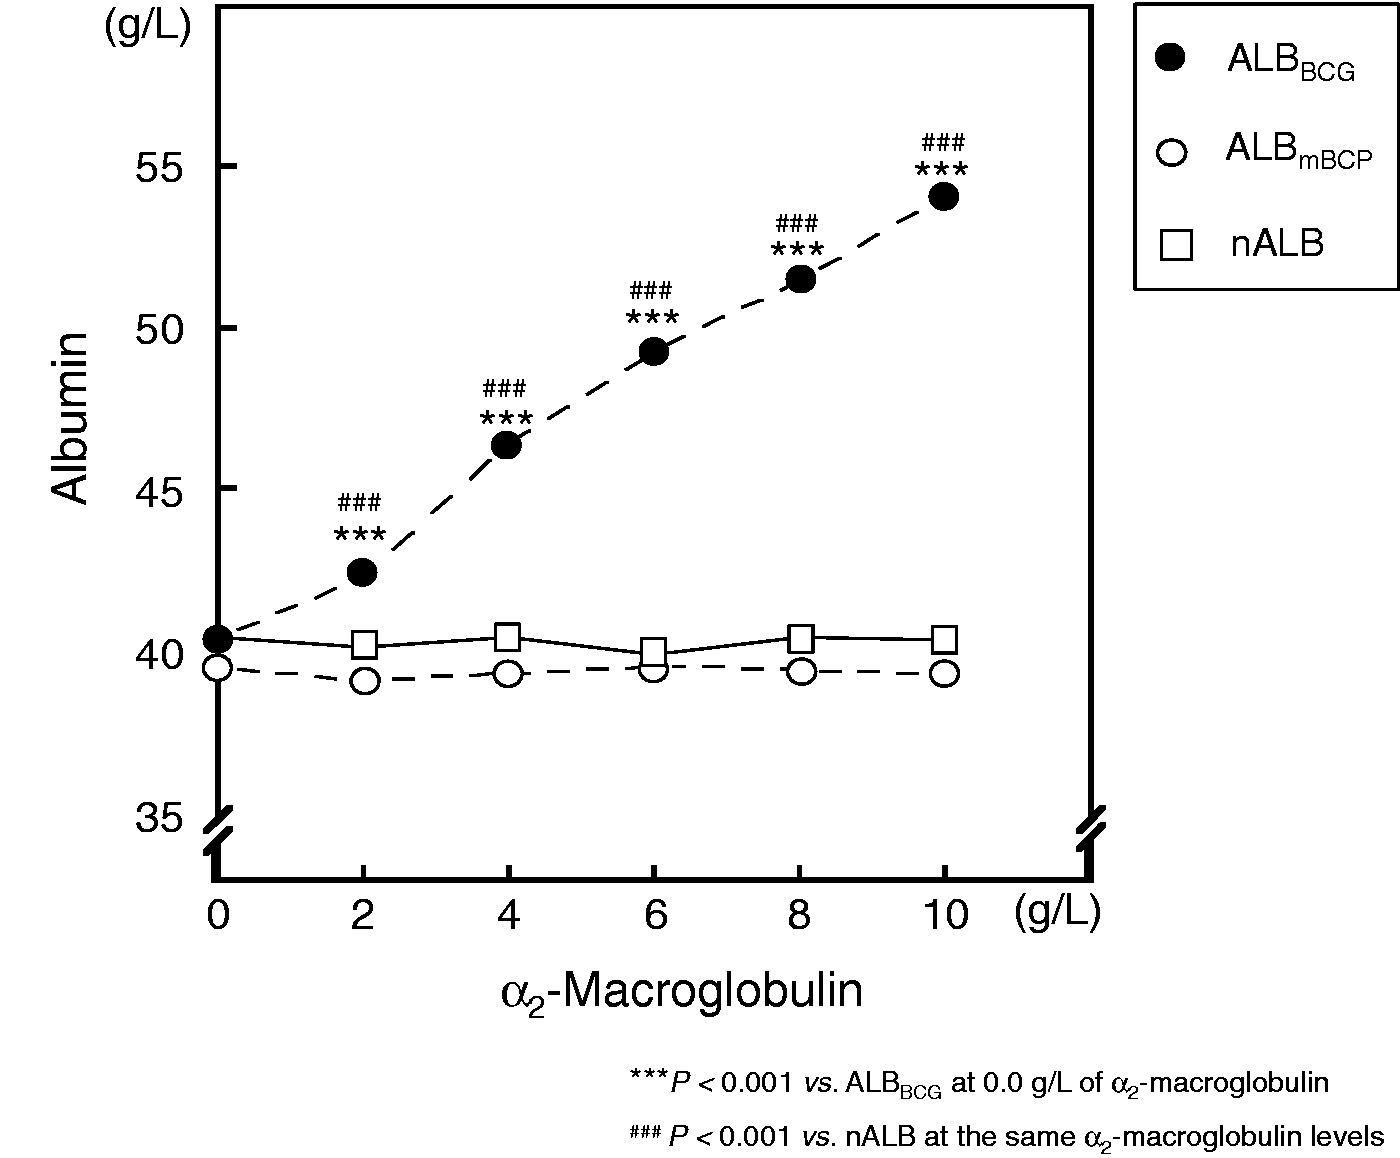
Discussion
This study clearly indicates that α2-macroglobulin causes a positive bias for ALBBCG in nephrotic syndrome, especially in patients with severe hypoalbuminemia. By contrast, there was no significant bias for ALBmBCP. We found that ALBBCG was significantly higher than nALB, while ALBmBCP agreed well with nALB in subjects with and without nephrotic syndrome (Table 2). ΔALB (the difference between ALBBCG and nALB) was positively correlated with the serum α2-macroglobulin concentration (Figure 3(a)). The reactivity of α2-macroglobulin with BCG assay could be reproduced in the in vitro experiments (Figure 4).
In nephrotic syndrome, the positive bias of ALBBCG against nALB was greatest in the NS-1 group (the subgroup with the severest hypoalbuminemia), because α2-macroglobulin, the largest component of α2-globulin, is least likely to pass through the glomeruli due to its high molecular weight. Human α2-macroglobulin is a multifunctional glycoprotein that forms a homotetramer of ∼725 kDa. 22 α2-Macroglobulin binds non-specifically to various proteinases, which cleave the susceptible site (thioester) of α2-macroglobulin. These cleavage products induce conformational changes in α2-macroglobulin, and the enzymatic active site of the proteinases is physically trapped and thus inhibited. 22 Among the five α1- and α2-globulins measured in this study, only α2-macroglobulin increased in parallel with the severity of hypoalbuminemia and proteinuria (Table 2).
Haptoglobin, another representative component of α2-globulin, is also known to interfere with the BCG assay. In our previous experiments, we added purified haptoglobin to albumin solutions and measured ALBBCG and ALBmBCP. 23 Although albumin concentrations were exactly the same in all solutions, ALBBCG, but not ALBmBCP, was increased in a dose-dependent manner. 23 In inflammation, hepatic synthesis of haptoglobin is induced by inflammatory cytokines. 24 By contrast, the serum α2-macroglobulin concentration does not increase in inflammation in humans.25,26 In nephrotic syndrome, the haptoglobin concentration reached a plateau in the NS-2 group, and NS-1 and NS-2 groups showed similar haptoglobin concentrations (Table 2). Haptoglobin shows a wide range in molecular weight. There are two alleles for the human haptoglobin gene, resulting in three phenotypes designated as Hp1-1, Hp2-1 and Hp2-2. 27 Haptoglobin molecules are composed of α- and β-subunits. The molecular weight of the smallest phenotype (Hp1-1) is 90 kDa, which is greater than that of human serum albumin. The molecular weight of the largest phenotype (Hp2-2) exceeds 400 kDa, which is more than half that of α2-macroglobulin. In some patients with nephrotic syndrome, the monomeric haptoglobin was detected in the urine, and urine/serum haptoglobin ratio was high. 28 Proteomic analysis using two-dimensional gel electrophoresis also indicated that haptoglobin is one of the urinary proteins characteristic of massive proteinuria in patients. 29 These findings suggest that a significant amount of haptoglobin leaks into the urine in such patients. This might explain why the serum haptoglobin concentration was not higher in the NS-1 group compared with the NS-2 group in this study (Table 2). It remains to be determined in a future study.
Although the mBCP assay is superior to BCG and the original BCP assays in both specificity and reactivity to oxidized and reduced albumin, 2 the reagents required for the mBCP assay are available only in Japan. Some researchers proposed to set different reference intervals for serum albumin concentration in the BCG and BCP assays. 30 In fact, ALBBCG was highly correlated with nALB in the present study (Figure 1). However, this strong correlation was probably because our study subjects did not have overt inflammation. In clinical samples with different backgrounds, protein concentrations exhibiting non-specific reactivity with BCG must vary among individual cases. That is, ALBBCG may not only be higher but also lower than the actual values. Some patients with advanced prostatic cancers were reported to have extremely low concentrations of α2-macroglobulin (< 0.2 g/L).31,32 In these cases, ALBBCG is likely to exhibit a negative bias against nALB. Although the original BCP assay underestimates the albumin concentration in uremic patients due to increased carbamylated albumin, 33 ALBmBCP agreed well with nALB, suggesting that the mBCP assay converted the reduced form of albumin into the oxidized form successfully. With a few exceptions, such as multiple myeloma 34 or penicillin G-treated patients, 35 mBCP assay can be used to measure the serum albumin concentration precisely with sufficient accuracy.
We concluded that α2-macroglobulin is a major factor involved in the positive bias towards ALBBCG in nephrotic syndrome, especially in patients with severe hypoalbuminemia. An assay for albumin measurement more specific than the BCG assay should be used, because the individual α2-globulin components differ depending on underlying disorders. The mBCP assay is a reliable, simple, and cost-effective method for use in clinical laboratories.
Footnotes
Acknowledgments
We would like to thank Kainos Laboratories for providing the albumin assay kits and Shiro Kamiji, Shigekazu Yamamoto and Kei Syukuya for their technical support.
Conflict of interest
None.
Funding
This research was partially supported by Grants-in-Aid for Scientific Research (C) from Japan Society for the Promotion of Science (JSPS) (No. 23590689, 2011–2013; No. 26461644, 2014–2016).
Ethical approval
The study protocol was reviewed and approved by ethics committee of Juntendo University Hospital (No. 22-138).
Guarantor
SH.
Contributorship
TU, SH, and TM designed the study, and collected samples. TU and MS carried the in vitro experiments. All authors analysed the data and prepared the manuscript.