
Abstract
Background
The size of lipoprotein particles is relevant to the risk of coronary artery disease (CAD).
Methods
We investigated the feasibility of atomic force microscopy (AFM) for evaluating the size of large low-density lipoprotein (LDL) and small dense LDL (sd-LDL) separated by ultracentrifugation. The measurements by AFM in tapping mode were compared to those by electron microscopy (EM).
Results
There was a significant difference in particle sizes determined by AFM between large LDL (20.6 ± 1.9 nm, mean ± SD) and sd-LDL (16.2 ± 1.4 nm) obtained from six healthy volunteers (P < 0.05). The particle sizes determined by EM for the same samples were 23.2 ± 1.4 nm for large LDL and 20.4 ± 1.4 nm for sd-LDL. The difference between large LDL and sd-LDL detected by EM was also statistically significant (P < 0.05). In addition, the particle sizes of each lipoprotein fraction were significantly different between AFM and EM: P < 0.05 for large LDL and P < 0.05 for sd-LDL.
Conclusions
AFM can differentiate between sd-LDL and large LDL particles by their size, and might be useful for evaluating risk for CAD.
Introduction
Numerous studies have shown that elevated plasma low-density lipoprotein (LDL) cholesterol is the crucial risk factor for coronary artery disease (CAD). LDL comprises distinct subspecies of varying size and density. 1 Small dense LDL (sd-LDL, d = 1.044–1.063 kg/L) is known to have a stronger association with CAD than large LDL (d = 1.019–1.044 kg/L).2–5 People with a predominance of sd-LDL are reported to have a three-fold increased risk for myocardial infarction. 2
Several analytical methods have been used to evaluate lipoprotein sizes, such as high-performance liquid chromatography (HPLC) with a gel filtration column, 6 gradient gel electrophoresis (GGE), 7 electron microscopy (EM), 8 nuclear magnetic resonance (NMR)9,10 and dynamic light scattering (DLS). 11 Atomic force microscopy (AFM) has been used to obtain topographical images of sample surfaces, such as single-stranded DNA, 12 liposomes,13,14 and living cells. 15 Using AFM, the surfaces of nanosized materials in fluids or air can be scanned by cantilever. Previous studies have reported AFM-based evaluations of the shapes and sizes of lipoprotein classes such as very low-density lipoproteins (VLDL), 16 LDL,16–19 and high-density lipoproteins (HDL). 16 Additionally, AFM may have the potential to study characteristic properties, such as the rigidity, 20 hydrophilicity, 21 and number of lipoprotein particles, 14 which cannot be evaluated in previously mentioned methods. Though EM can be used to measure the size of lipoprotein, it may not reflect the original size as in vivo, as EM requires lipoprotein in dry state. Therefore, we designed this study to evaluate feasibility of AFM for measuring the size of LDL subclasses.
Materials and methods
Serum samples
Six healthy Japanese students were studied: five males and one female; mean age ± SD, 24.2 ± 3.9 years, range, 22–32 years; height 1.68 ± 0.05 m; weight, 60.0 ± 4.9 kg; body mass index 21.3 ± 2.0 kg/m2; total cholesterol (TC), 4.52 ± 0.5 mmol/L; triglyceride (TG), 1.05 ± 0.4 mmol/L; HDL-cholesterol, 1.40 ± 0.2 mmol/L; LDL-cholesterol, 2.69 ± 0.5 mmol/L. Blood was drawn after an overnight fast from each subject. Serum samples were obtained by centrifugation at 2000 g for 10 min at 4℃ and were stored at 4℃ until use.
Sequential ultracentrifugation
Lipoprotein fractions were isolated from serum by sequential ultracentrifugation.
11
Briefly, ultracentrifugation was performed using a near-vertical tube rotor (MLN-80; Beckman Coulter, Fullerton, CA) on a model Optima MAX (Beckman Coulter). Serum (2.0 mL) was adjusted with KBr solution to d = 1.019 kg/L and then centrifuged at 40,000 rpm for 20 h at 4℃. The top fraction (2.5 mL) containing d < 1.019 lipoproteins, that is, chylomicrons, VLDL, and intermediate-density lipoprotein (IDL), was isolated by aspiration. Then the bottom fraction was adjusted with KBr solution to d = 1.044 kg/L and centrifuged again at 50,000 rpm for 18 h at 4℃. After isolating the top fraction (2.5 mL) containing large LDL, the bottom fraction was adjusted to d = 1.063 kg/L and centrifuged further at 50,000 rpm for 18 h at 4℃. After the centrifugation, the top fraction (2.5 mL) containing sd-LDL was recovered. Good separation was confirmed by polyacrylamide gel electrophoresis (LipoPhor Jokoh Co. Ltd., Tokyo, Japan) (Figure 1). The protein concentration in each lipoprotein fraction was determined using a modified procedure of the Lowry method.
22
Typical electrophoretic patterns on polyacrylamide gel electrophoresis of lipoproteins isolated by sequential ultracentrifugation. a, Serum; b, chylomicrons, VLDL, and IDL fraction; c, large LDL fraction; d, sd-LDL fraction; e, HDL and serum protein fraction (d > 1.063).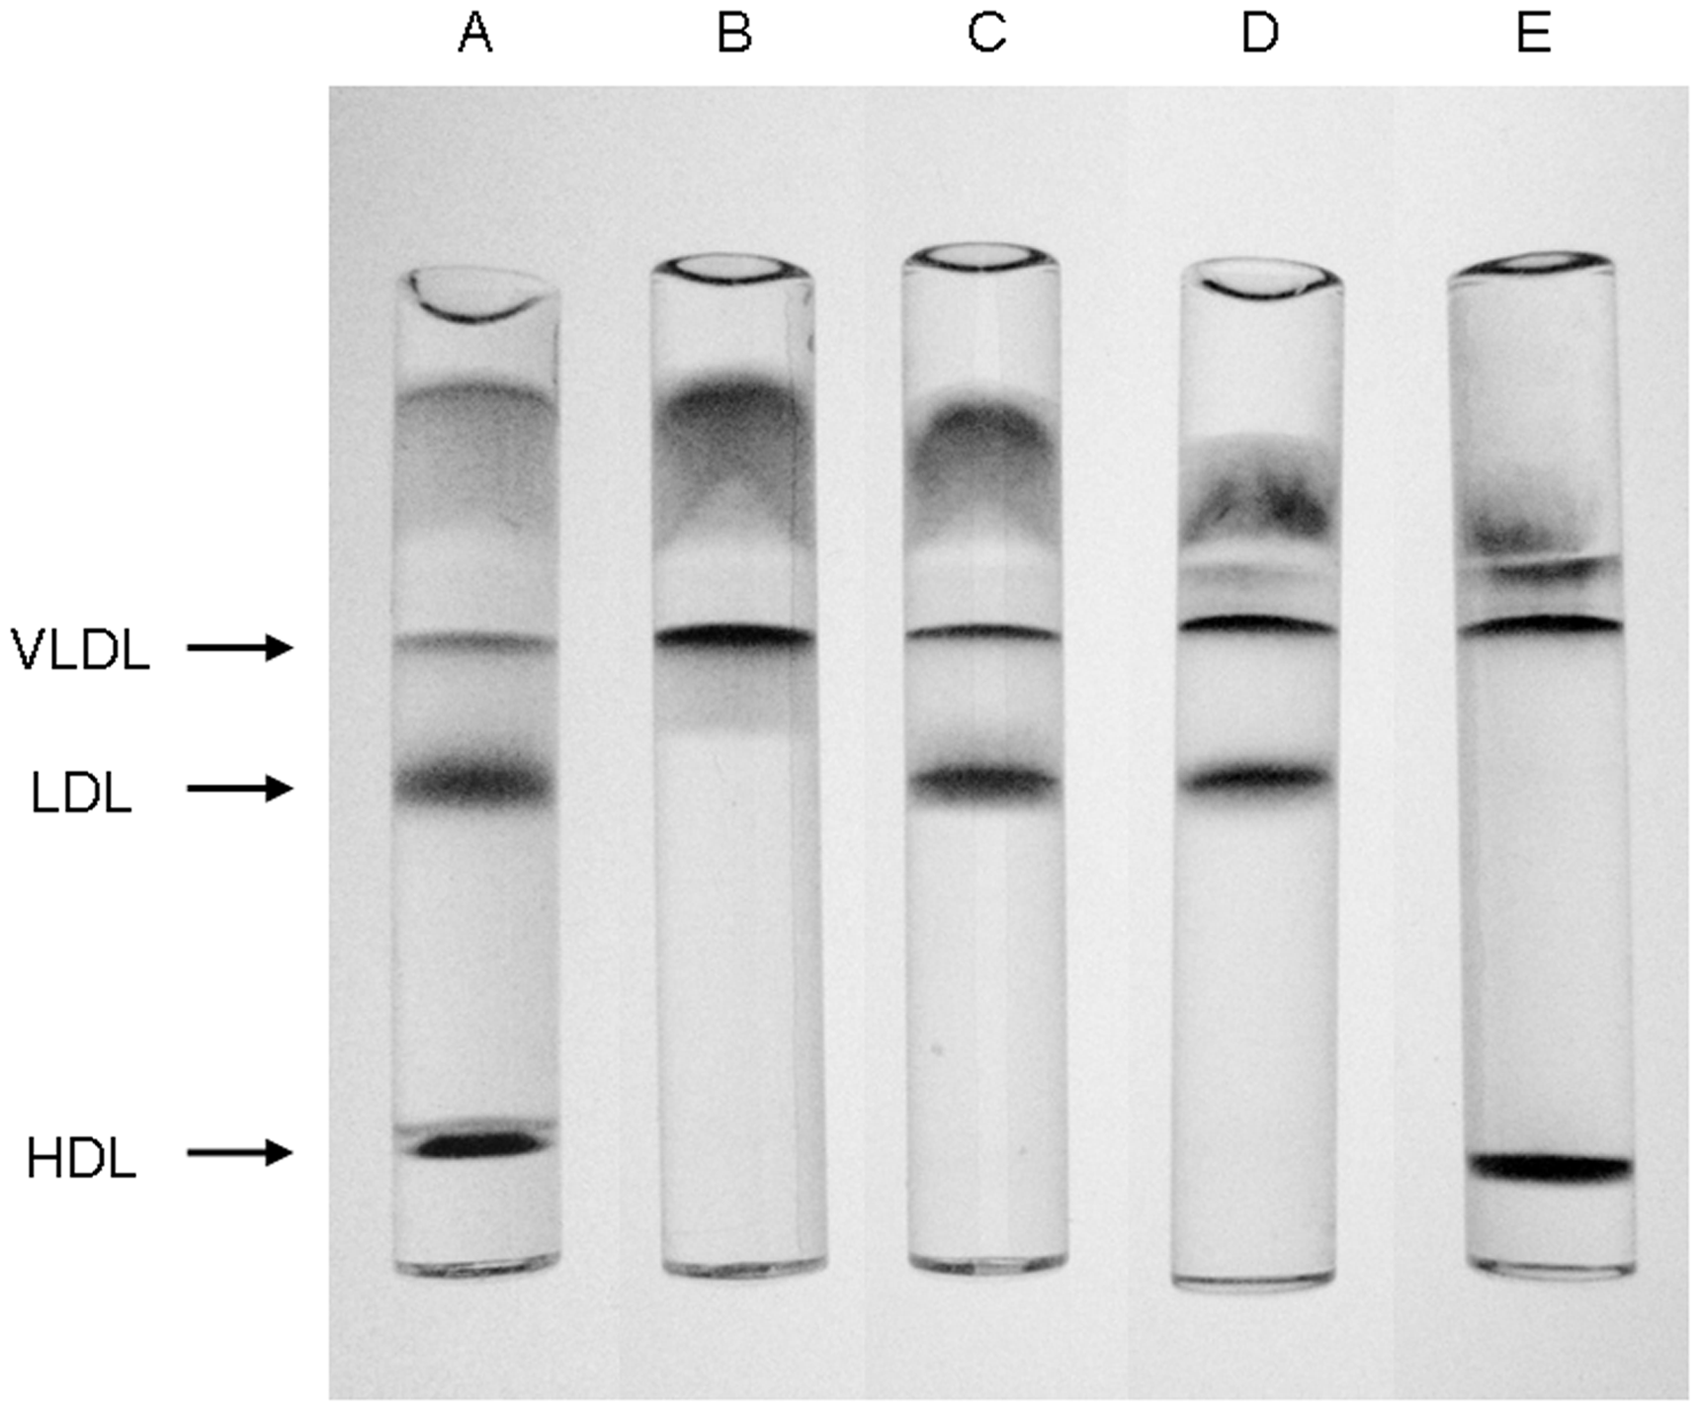
AFM
AFM imaging was performed using an MFP-3D-BIO (Asylum Research, Santa Barbara, CA). Large LDL and sd-LDL fractions were diluted by phosphate-buffered saline (PBS, pH 7.4) to reach a final protein concentration of 500 µg/L. Then, 10 µL sample solution was incubated for 10 min on surface-modified mica, which was prepared using 3-aminopropyltriethoxysilane23,24 under wet conditions. The 3-aminopropyltriethoxysilane, which has a positive charge, was coated on the mica surface to fix the lipoproteins with a negative charge. After the mica surface was rinsed three times by PBS, 100 µL of the solution was mounted on the mica surface.
All imaging was observed under wet conditions and was carried out in tapping mode at room temperature. Tapping-mode AFM is a high-amplitude dynamic mode in which amplitude modulation feedback is used to image the sample topography. The cantilever tip is oscillated by a piezoelectric scanner at a frequency close to the resonance frequency. The sample surface is imaged while the feedback keeps the tip-sample separation by adjusting the oscillation amplitude at a fixed value. Cantilevers (AC40TS; Olympus) have a spring constant of 0.1 N/m. Scan speed was 0.5 Hz and scan size was 2 × 2 µm.
The samples were visualized as topographic images and 3D images at a resolution of 256 × 256 pixels. The diameters of lipoprotein particles were calculated using particle analysis software (Asylum Research). The shapes of the lipoprotein particles observed by AFM were compressed in a vertical direction; therefore, the volume of the compressed lipoproteins was translated into that of a sphere. For this, it was hypothesized that lipoproteins are spherical. The diameters of spheres were obtained from their calculated volumes. Therefore, we evaluated the lipoprotein particle sizes by the parameter D = 2(3V/4π)1/3, which is equal to the diameter (D) of the sphere with an equivalent volume (V). 19 The size distribution of lipoproteins was obtained from their diameters.
To evaluate reproducibility, the sd-LDL fraction obtained from a normal man (TC 4.83 mmol/L, TG 1.01 mmol/L, HDL-cholesterol 1.32 mmol/L, and LDL-cholesterol 3.11 mmol/L) was measured four times to determine within-run variation and three times on three consecutive days for between-run variation.
EM
The isolated large LDL and sd-LDL fractions were observed by EM according to the method of Ito et al.
25
with modifications. Briefly, the samples were diluted to reach a cholesterol concentration of 0.13 mmol/L. The grids coated with collodion and carbon were made hydrophilic by 0.1% (w/v) poly
Statistical analysis
The particle sizes of lipoprotein fractions were compared by Wilcoxon signed-rank test. The sizes of large LDL or sd-LDL measured by AFM were compared to those measured by EM using the Mann-Whitney U test. P < 0.05 was considered to be statistically significant.
Ethics
All individuals gave written informed consent to participate in this study. The study was approved by the Ethics Review Board at the Faculty of Health Sciences, Hokkaido University (approval number 09-38).
Results
Reproducibility
The mean particle size and coefficient of within-run variation were 17.1 ± 0.7 nm (mean ± SD, n = 4) and 3.8%, respectively. Similarly, the mean particle size and coefficient of between-run variation were 16.1 ± 1.0 nm, n = 3, and 6.2%, respectively.
AFM imaging
Typical topographical AFM images for the large LDL and sd-LDL fractions from a normal female (TC 4.65 mmol/L, TG 0.45 mmol/L, HDL-cholesterol 1.50 mmol/L, and LDL-cholesterol 2.83 mmol/L) are shown in Figure 2(a, b). All AFM images were pseudocoloured, where grey represents the mica surface and white is the top of the lipoprotein particles. In the images, the lipoprotein particles were compressed in the vertical direction. The mean size distributions of both large LDL and sd-LDL measured by AFM are shown as the percentage of particle number in Figure 3(a, b). The mean sizes of large LDL were always larger than those of sd-LDL within the same individuals. There was a significant difference in size between large LDL (20.6 ± 1.9 nm, mean ± SD) and sd-LDL (16.2 ± 1.4 nm) (P < 0.05, Figure 4(a)). When lipoprotein-free PBS was used as a negative control, no lipoprotein-like particles were observed on the mica surface (data not shown).
Topographical images by AFM in large LDL (a) and sd-LDL (b) fractions. Size distribution of lipoprotein particles in large LDL and sd-LDL fractions by AFM (a, b) and EM (c, d). The size distributions for large LDL (a, c) and sd-LDL (b, d) are shown as the percentage of particle number in every 2 nm and are averaged from the data of six subjects. The column of 5–7 nm means 5.0 nm < particle size ≤ 7.0 nm. Particle sizes of LDL subclasses determined by AFM (a) and EM (b).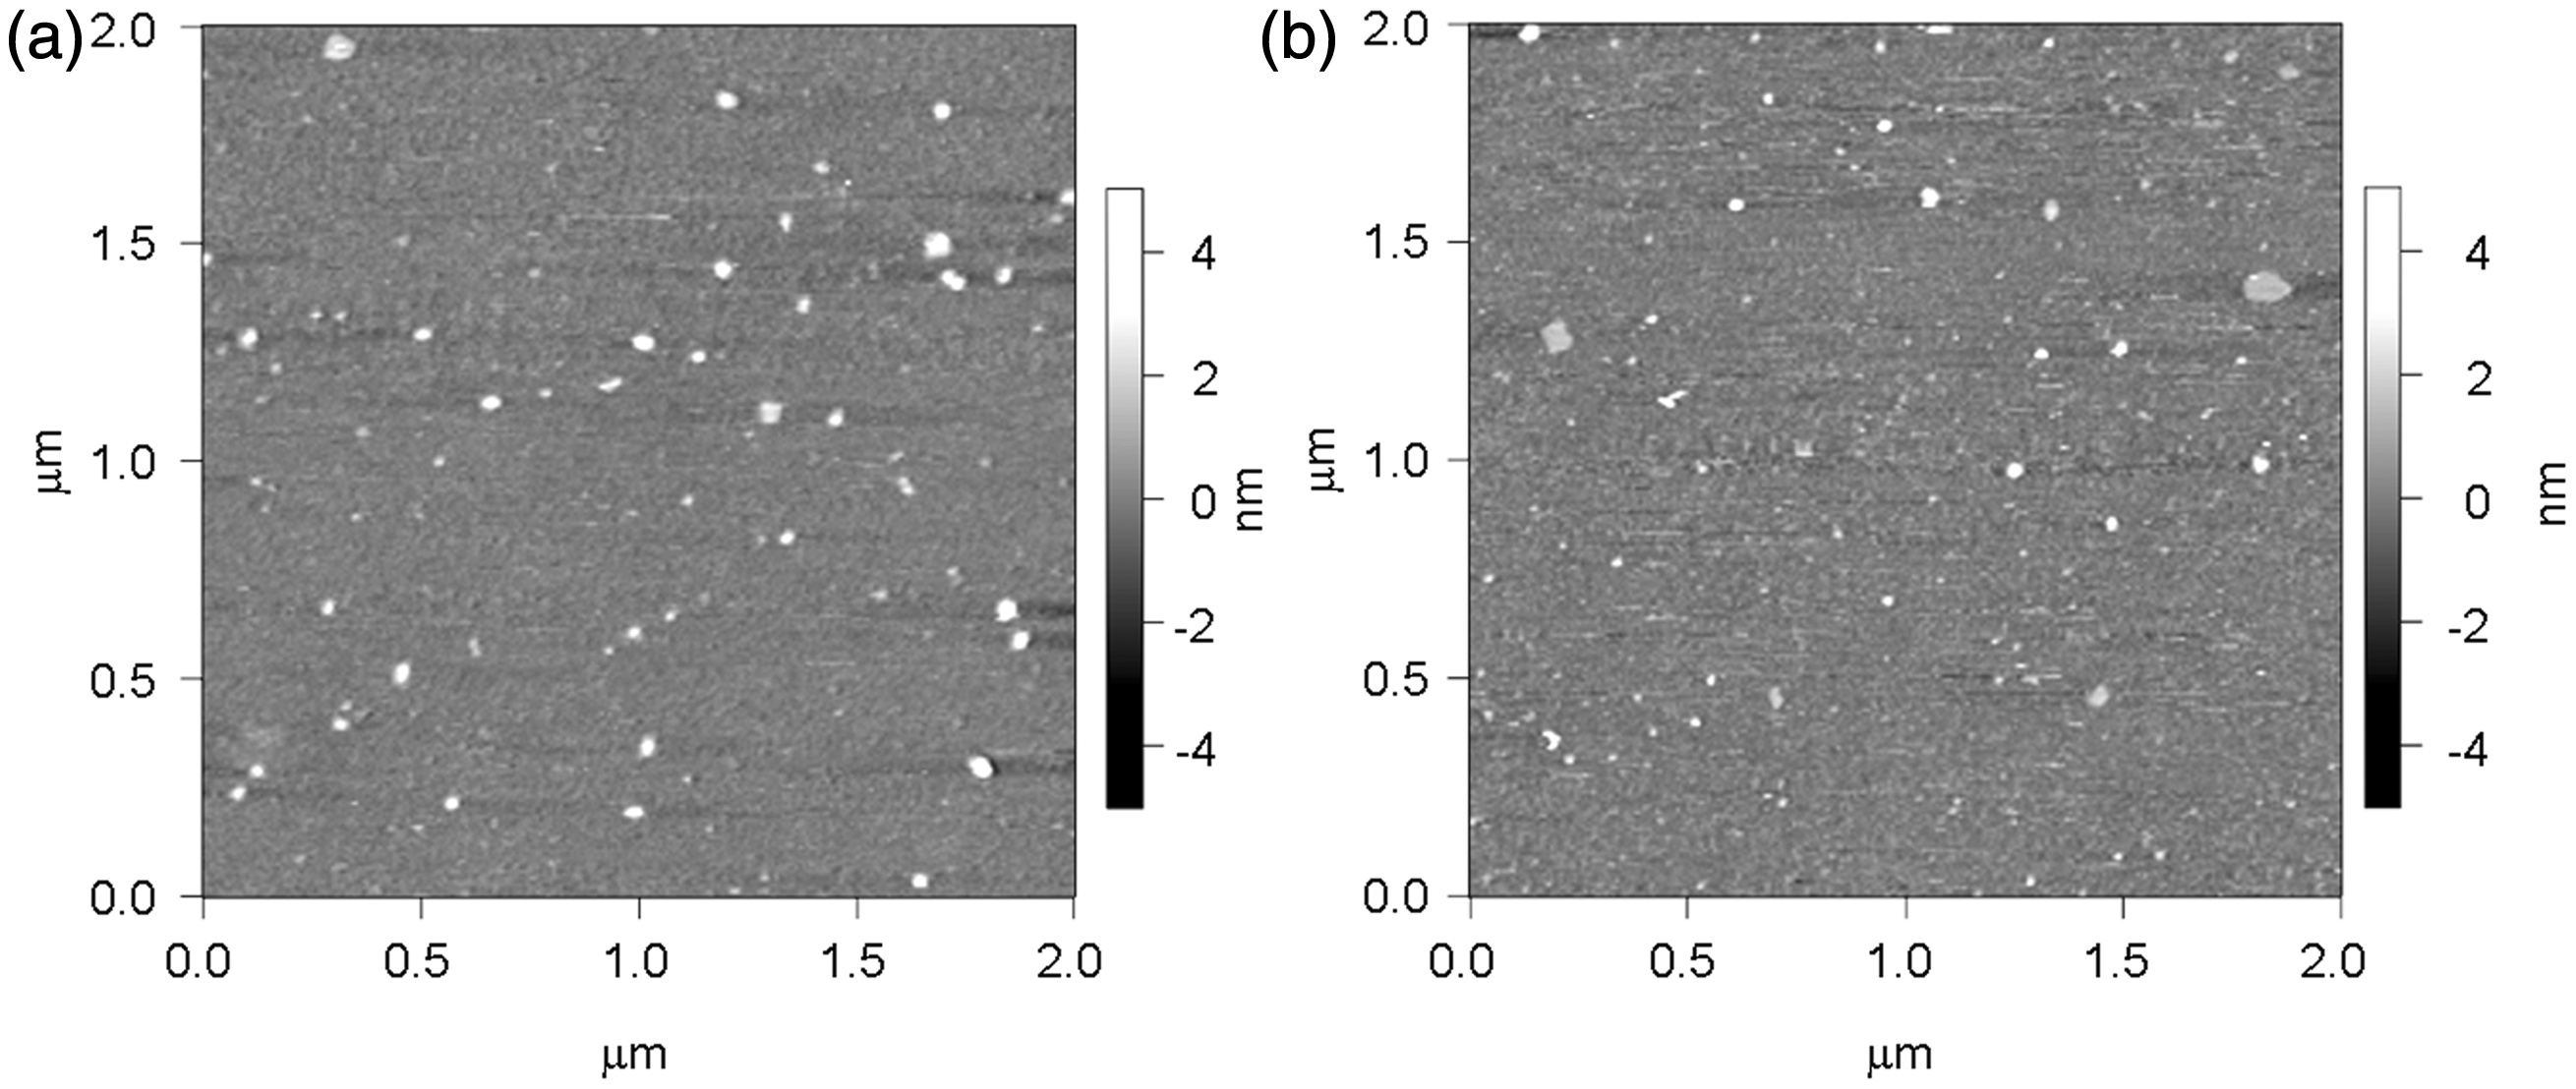
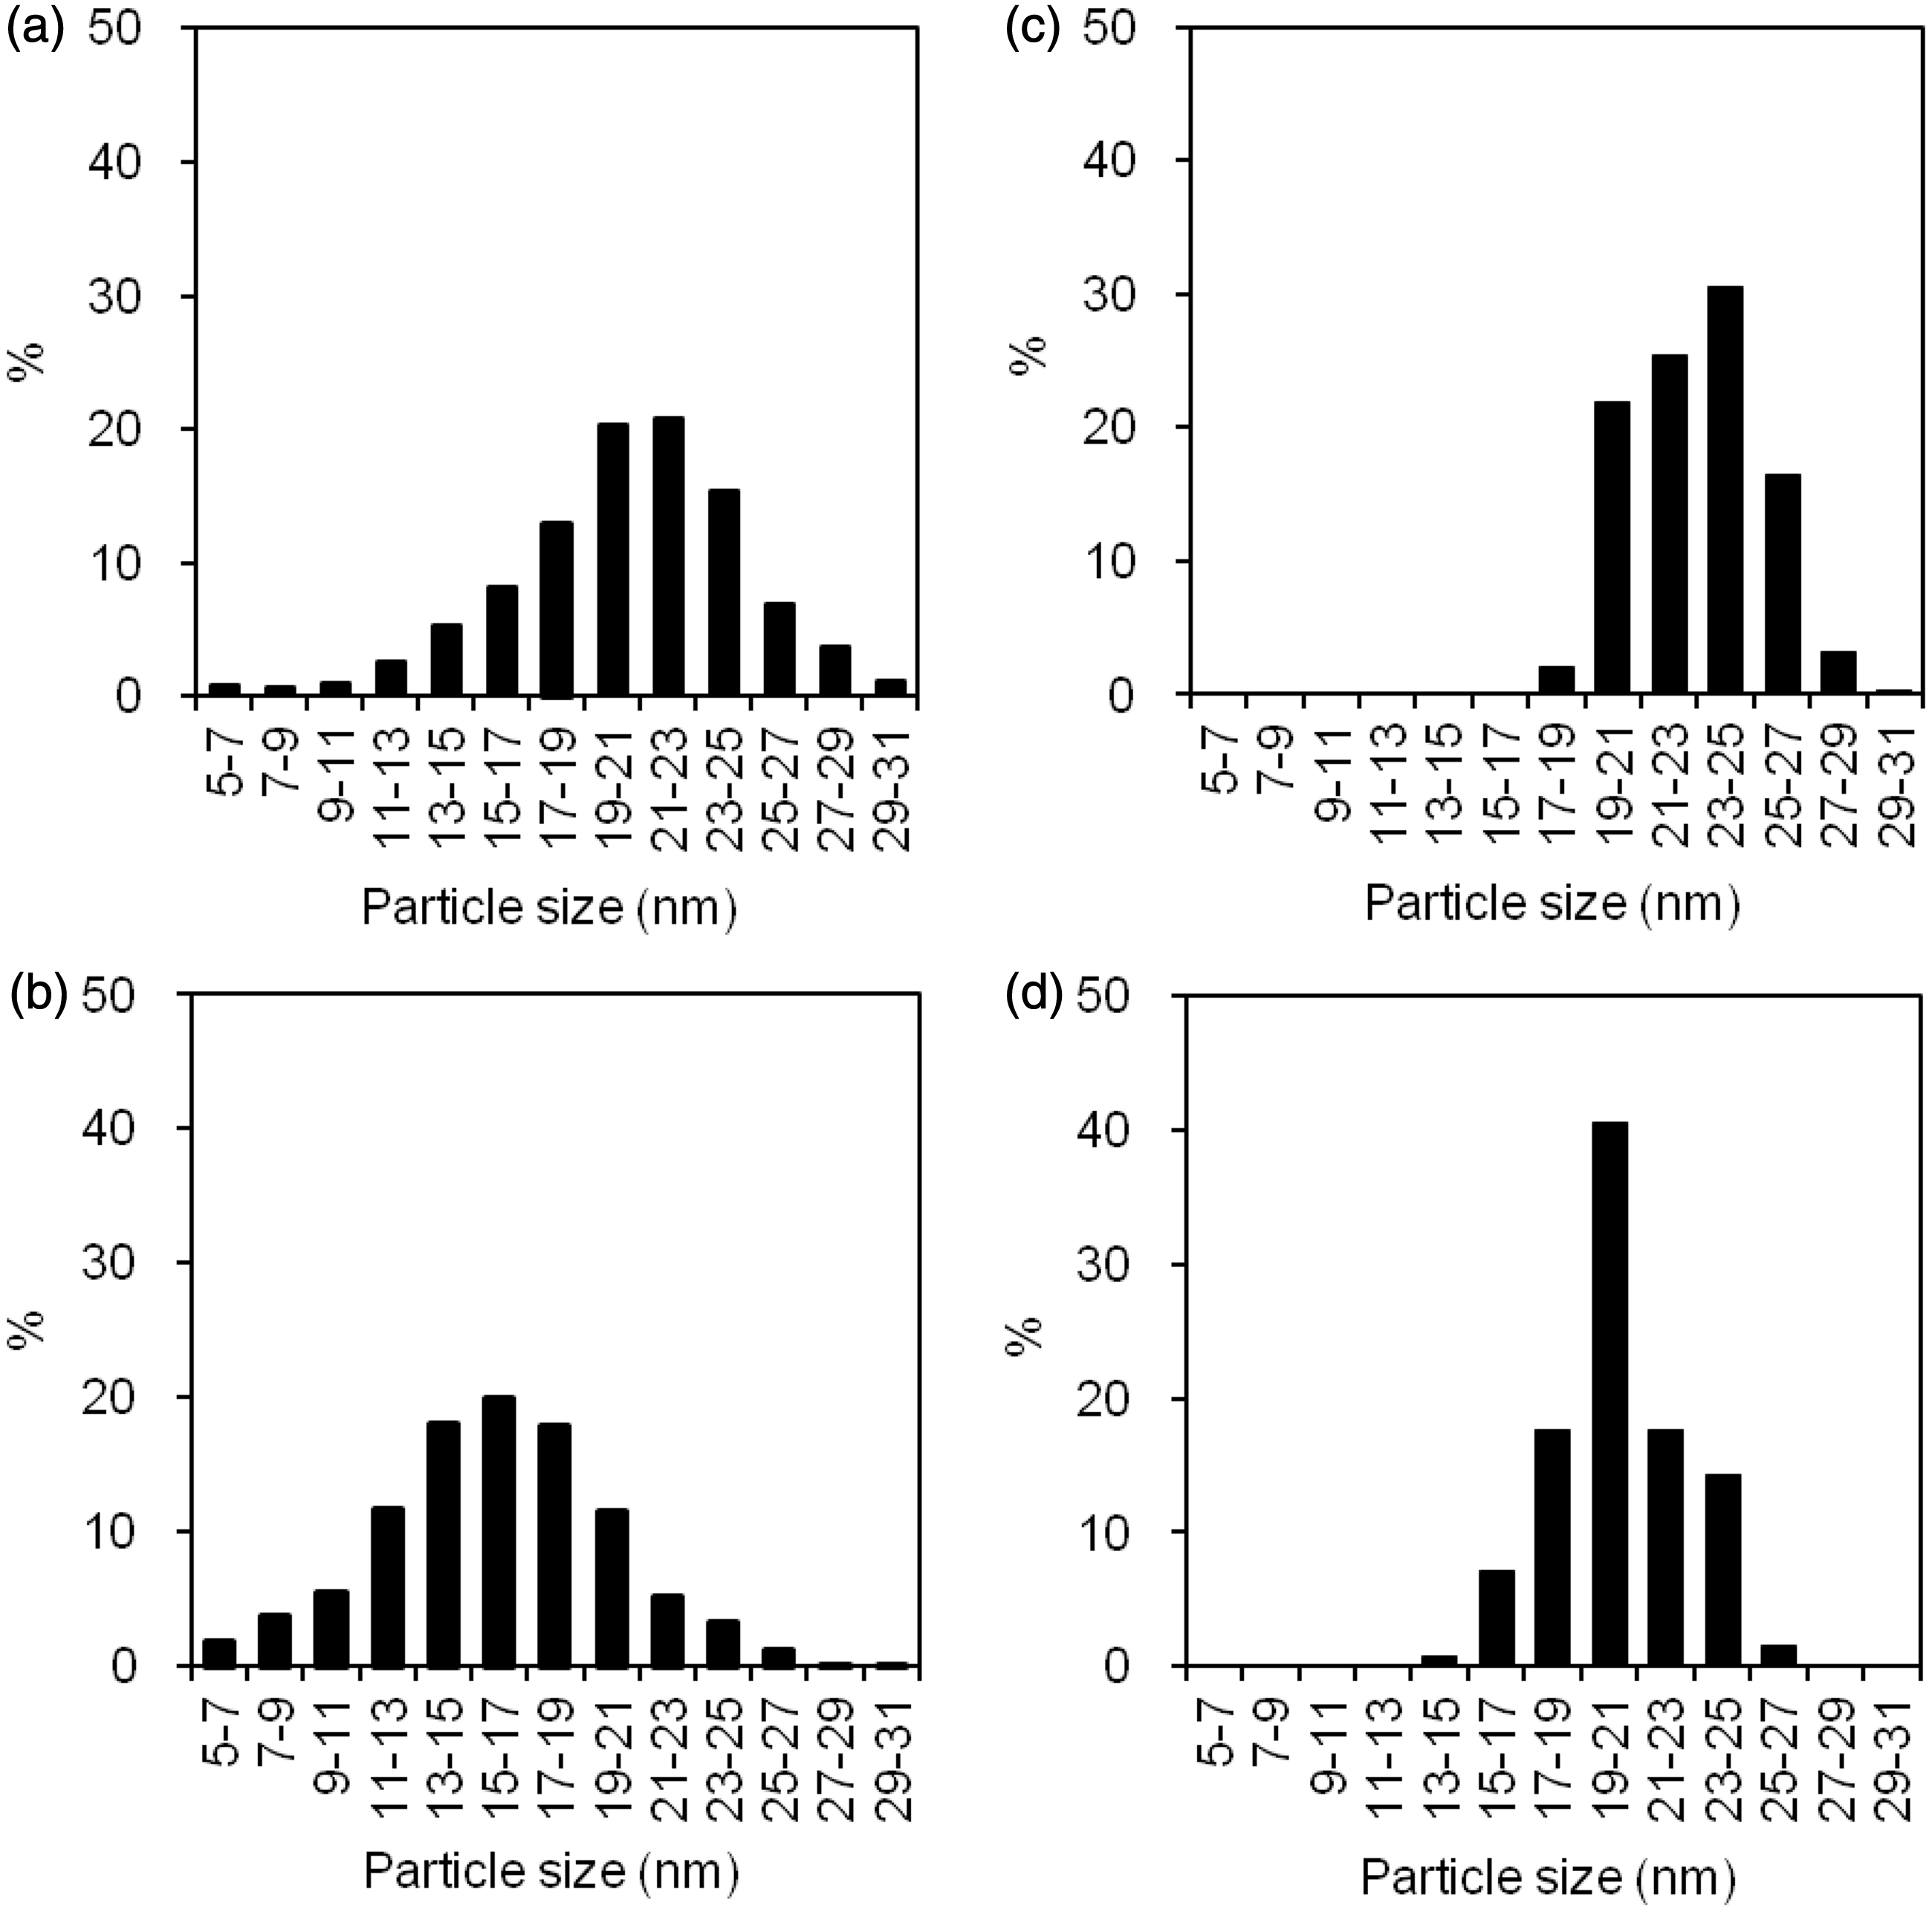
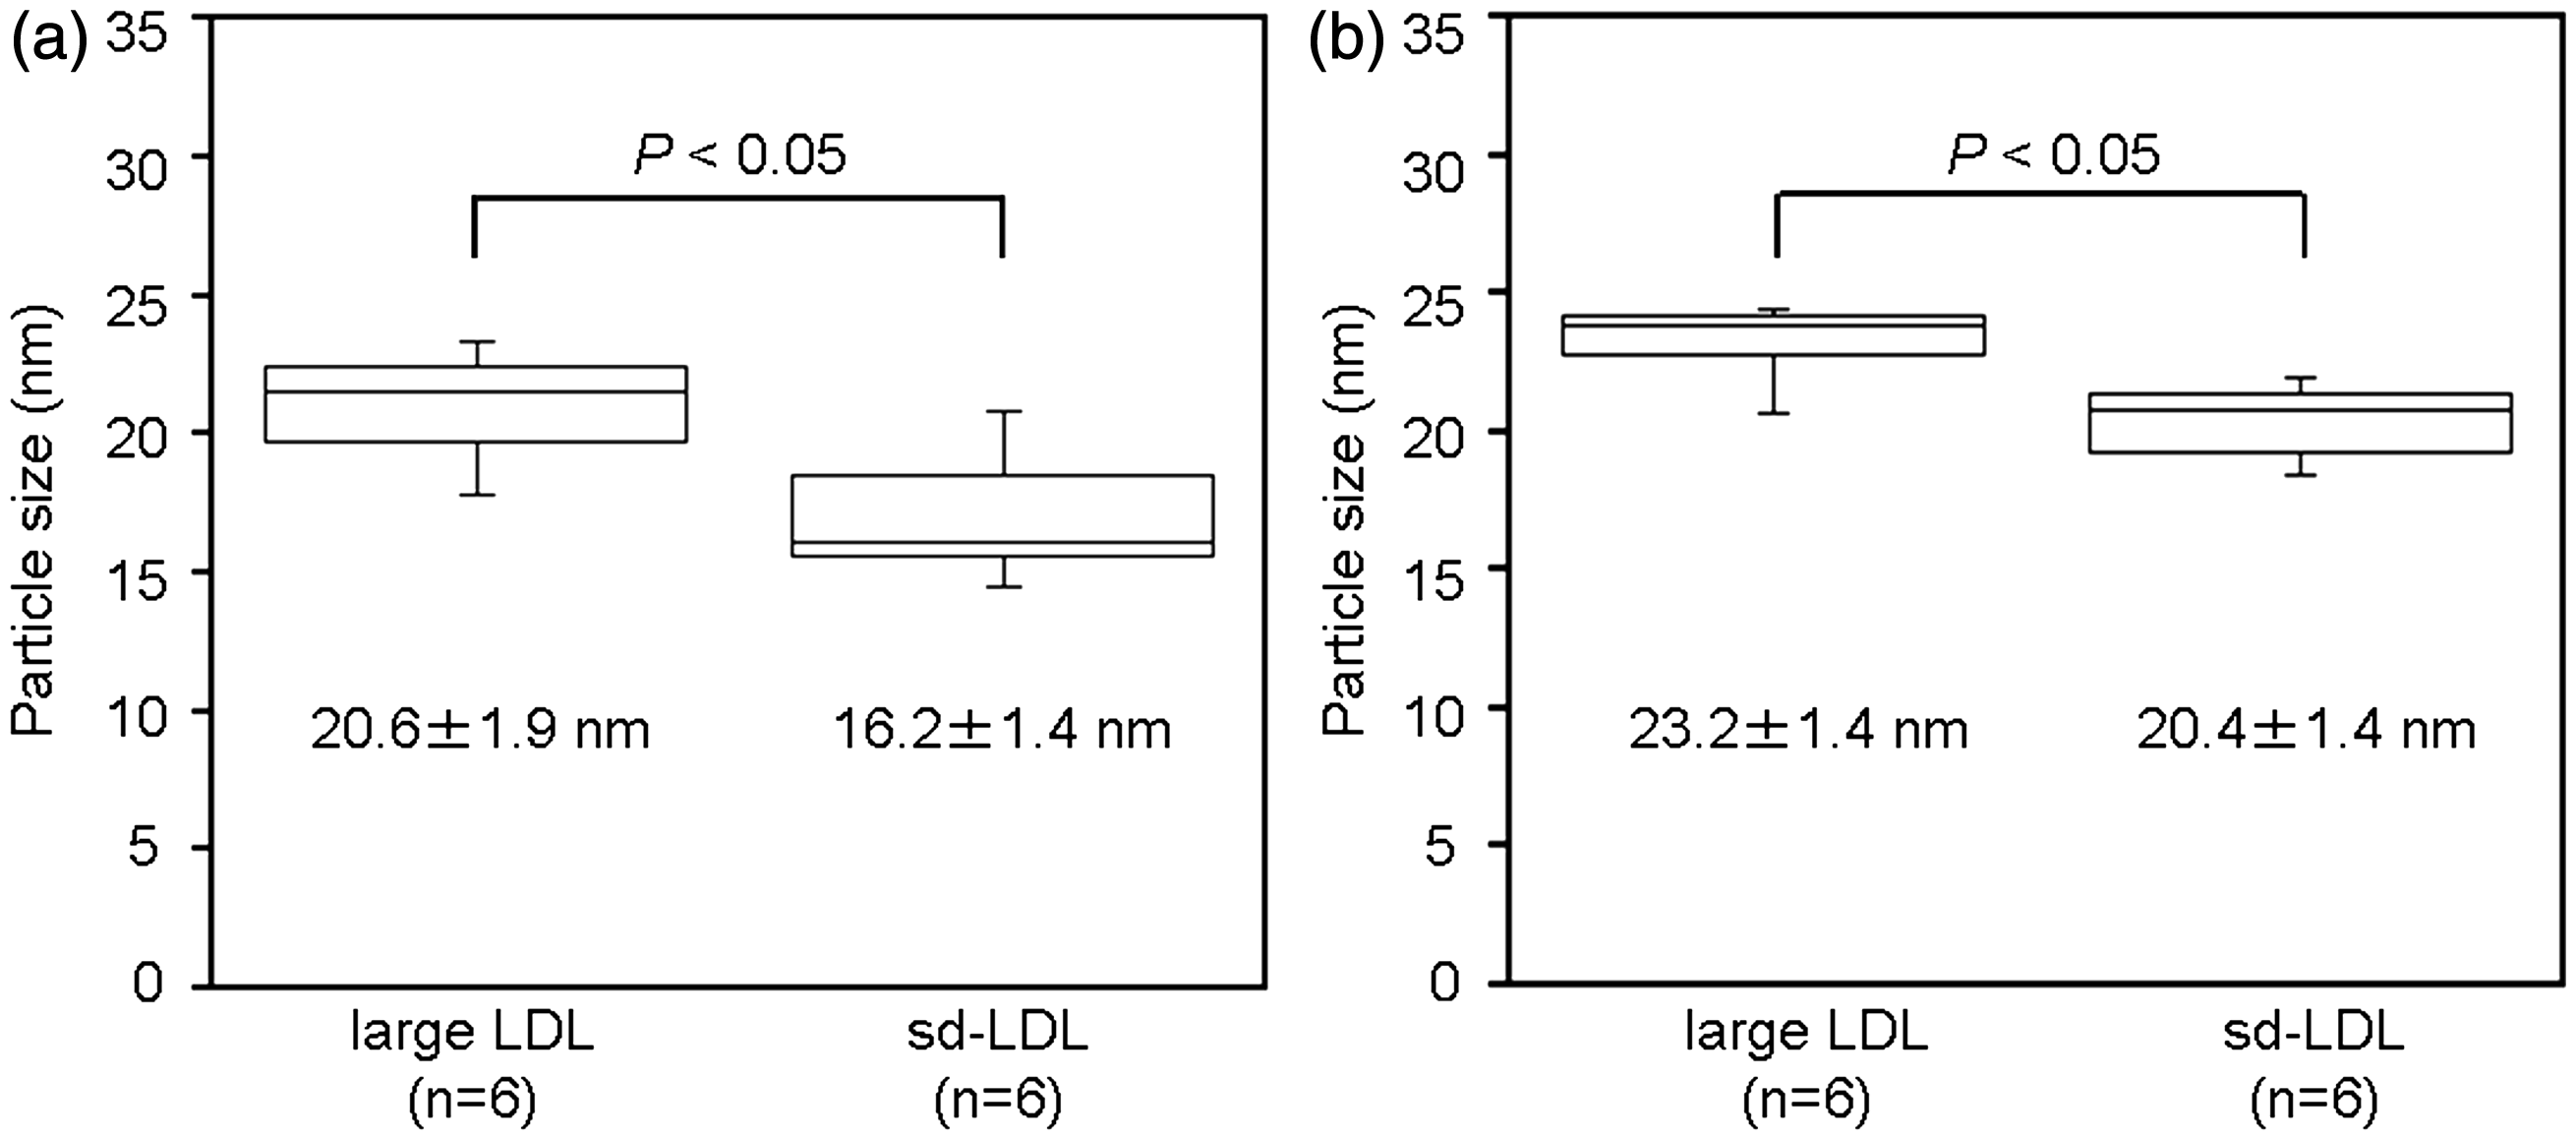
Similarly, the mean particle sizes determined by EM in the same six subjects were 23.2 ± 1.4 nm for large LDL and 20.4 ± 1.4 nm for sd-LDL (Figure 3(c, d)). The mean sizes of large LDL were always larger than those of sd-LDL within the same individuals. The difference in size between large LDL and sd-LDL was statistically significant for AFM and EM (P < 0.05, Figure 4). In addition, the sizes of each lipoprotein fraction were significantly different between AFM and EM: P < 0.05 for large LDL and P < 0.05 for sd-LDL.
Discussion
AFM can provide 3D topographic images of lipoprotein particles with nanometer-scale resolution, 26 whereas EM provides only 2D images. Furthermore, AFM can measure samples in a liquid state, which is convenient for handling biological samples. In contrast, EM requires lipoprotein samples in a dry state, 27 resulting in structural changes to the lipoprotein and smaller measurements reflecting nonhydrated states. In addition, AFM does not require any chemical stains, whereas EM usually requires internationally controlled uranium salts for negative staining of lipoprotein particles. In addition, AFM systems are less spacious and can be easily set up on the benchtop. AFM has a short turnaround time of approximately 9 min to obtain an image, which is advantageous for clinical use. In terms of reproducibility, AFM has acceptable coefficients of between-run variation (<6.2% in this study), which is comparable with HPLC (<0.2%), 6 GGE (0.8–3.5%),1,28,29 and DLS (<6.2%). 11
Previous AFM studies have reported the sizes of the whole LDL fraction as 17 nm measured by Legleiter et al. 16 and 23 ± 3 nm measured by Chouinard et al. 19 The value reported by Legleiter et al. 16 is within the range of our AFM measurements of LDL: 16.2 ± 1.4 nm for sd-LDL and 20.6 ± 1.9 nm for large LDL. On the other hand, Chouinard et al. 19 just measured the scales of LDL particles without calculations in the topographical images, which would gives larger sizes of LDL particles than those by our analytical procedure. A previous study that used EM reported LDL particle sizes at 20–27 nm, 27 similar to those measured by EM in this study: 20.4 ± 1.4 nm for sd-LDL and 23.2 ± 1.4 nm for large LDL. A study that used NMR reported the size of LDL to be 21.1 ± 0.9 nm, 30 which is similar to our AFM measurement of large LDL. We previously reported the sizes of sd-LDL and large LDL based on DLS as 20.3 ± 1.1 nm and 21.5 ± 0.8 nm, respectively. 11 This discrepancy in size of LDL between DLS and AFM method depends on analytical consideration and principle of measurement. AFM calculates the diameter from the volume of each lipoprotein particle, whereas DLS estimates the mean particle size in fluids by measuring the fluctuation intensity of scattered light. 11
The size distribution by AFM was broader than those by EM (Figure 3). Because lipoprotein particles are soft sphered, the shapes of lipoproteins might change slightly during scanning of samples, 18 which might cause the variability of the sizes of lipoprotein particles.
In studies that have used AFM to measure lipoproteins, two different analytical methods have been used, tapping mode and contact mode. Yang et al. 18 applied the contact mode to observe LDL particles in an aqueous environment, but they were unable to clearly determine the size of LDL particles. In contact mode, a cantilever keeps continuous contact with sample surfaces, whereas in the tapping mode used in the present study, the cantilever made only intermittent contact with sample surfaces. Hence, in this mode, the cantilever tip is less likely to change the shapes and sizes of lipoprotein particles.31,32 Furthermore, the tip of the cantilever is less likely to be polluted by the sample when tapping mode is used, which should decrease analytical errors due to pollution-mediated modification of the cantilever.
In conclusion, AFM is feasible for measuring the size of LDL subclasses. Further study on the clinical applications of AFM is ongoing in our laboratory.
Footnotes
Acknowledgements
We are grateful to the Central Research Laboratory, Faculty of Health Sciences, Hokkaido University that kindly provided the work space and equipments. We thank Yasuki Ito, Yusaku Ueki and Satoko Suzuki (Denka Seiken, Niigata, Japan) for help and advice of EM and Hiroaki Sugasawa (Asylum Technology, Tokyo, Japan) for his technical advices of AFM. Toshihiro Sakurai is a Research Fellow of the Japan Society for the Promotion of Science. A part of AFM analysis was carried out with MFP-3D-BIO at the OPEN FACILITY, Hokkaido University Sousei Hall. We also thank Rojeet Shrestha for English language corrections in this manuscript.
Declaration of conflicting interests
None.
Funding
This research was supported by a Grant-in-Aid for Scientific Research from the Japan Society for the Promotion of Science and also by the Regional Innovation Strategy Support Program of the Ministry of Education, Culture, Sports, Science and Technology, Japan.
Ethical approval
The study was approved by the ethics review board at the Faculty of Health Sciences, Hokkaido University (approval number 09-38).
Guarantor
HC.
Contributorship
TS and HC researched literature and conceived the study. TS is a Research Fellow of the Japan Society for the Promotion of Science. TS, J-y T, AI, HF, S-P H, and HF were involved in lipoprotein separations, lipid measurements and data analysis. YT, NW and MF were involved in providing the samples and patient recruitment. TS and J-ya T were involved in the measurement of lipoprotein particles using atomic force microscope. ST, SuchinTrirongjitmoah, TN, SJ and KS were involved in the advices and discussion of AFM. TS wrote the first draft of the manuscript. All authors reviewed and edited the manuscript and approved the final version of the manuscript.