
Abstract
Background
Serum free light chain analysis is now well established in the investigation of monoclonal gammopathies. In the UK there has, until recently, been a single supplier of kits for such analysis. Recently, a second method using monoclonal antisera was introduced. We have compared the performance of these two kits in four routine laboratories.
Method
Samples submitted for routine analysis (327 samples, 258 [79%] from patients with B-cell lymphoproliferative disease) for serum free light chains were tested by both technologies (Freelite, Binding Site and N Latex FLC, Siemens), according to the manufacturers’ instructions.
Results
Qualitative data were available by both methods on 313 samples for serum free kappa chains and 324 samples for lambda free light chains. We found poor correspondence of 81% for kappa and 74% for lambda. Five percent of samples were significantly discordant in these assays.
Conclusions
These assays perform very differently in clinical practice. They cannot be used interchangeably, especially if monitoring patient responses to therapy.
Introduction
The use of serum free light chain assays in the investigation of patients suspected of monoclonal gammopathy is now well established and use of the assay is advocated in international guidelines. 1 Until recently only one assay was commercially available in the UK (Freelite™, Binding Site, Birmingham, UK), adapted for use on a variety of nephelometric and turbidimetric platforms. A second commercial assay has now come to market (N Latex FLC, Siemens, Camberley, Surrey, UK). Limited data are available regarding the performance of this assay.2,3 In view of the described problems with the inter-laboratory reproducibility of the Freelite™ assay, 4 it is important to establish whether the new assay offers any advantages.
It was also important to establish whether there were significant differences between the two assays in terms of their ability to identify and quantify monoclonal immunoglobulin light chains. Crucially, there is a fundamental difference in the formulation of the two assays. The Binding Site assay is based on the use of polyclonal antisera whereas the Siemens assay uses monoclonal antisera. We considered it unlikely that all monoclonal proteins would behave identically in the two assays.
We present here evaluation data from four laboratories; two using the Siemens BN II nephelometer platform and two using the Siemens ProSpec nephelometer.
Methods
Unselected routine samples submitted for serum light chain analysis were analysed in parallel for both the Binding Site (Freelite™ Human Kappa and Lambda Free Kits, The Binding Site) and Siemens (N latex FLC Kappa and Lambda, Siemens Healthcare Diagnostics Ltd) assays, according to the manufacturers’ instructions (hereafter referred to as Freelite and N latex FLC). Serum dilutions, both initial and subsequent (where results were outside of the reportable range) were as recommended by the manufacturers.
Samples available for analysis by site
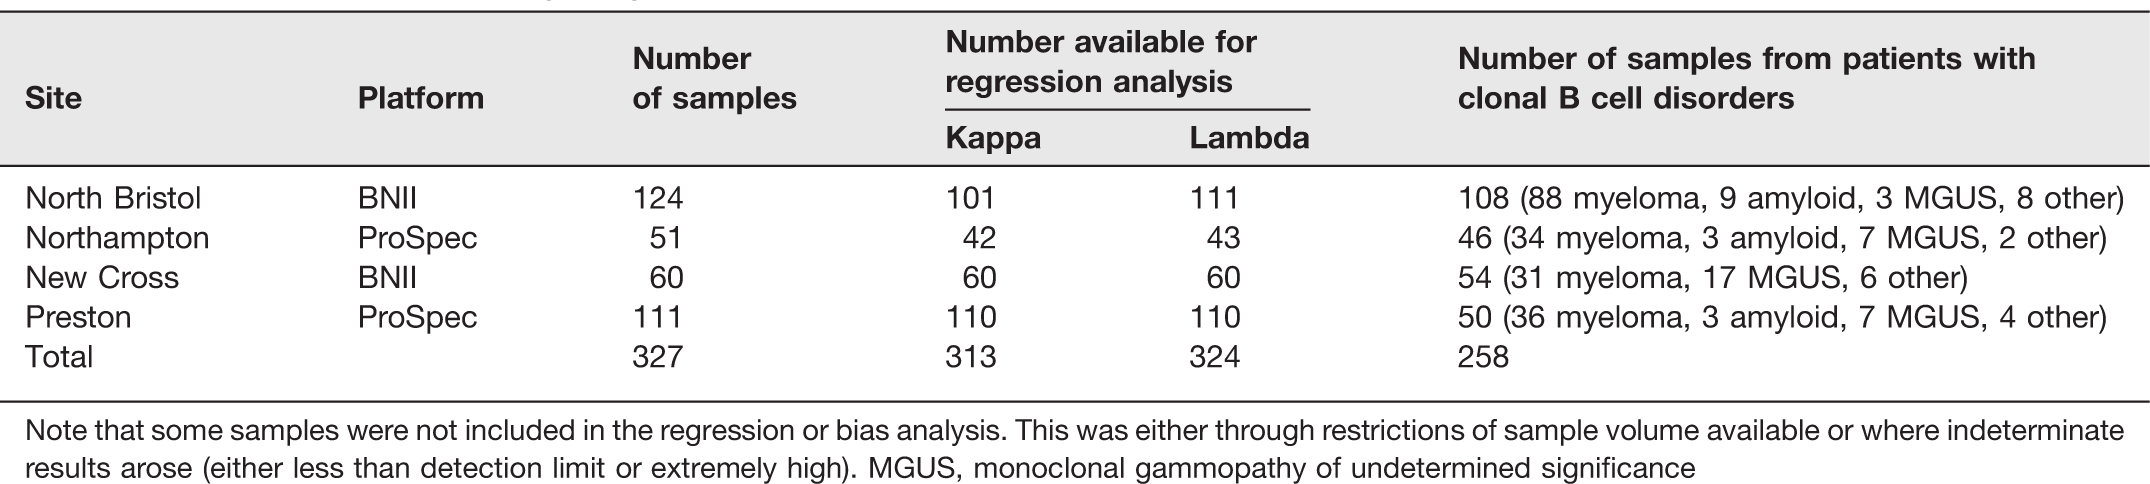
Note that some samples were not included in the regression or bias analysis. This was either through restrictions of sample volume available or where indeterminate results arose (either less than detection limit or extremely high). MGUS, monoclonal gammopathy of undetermined significance
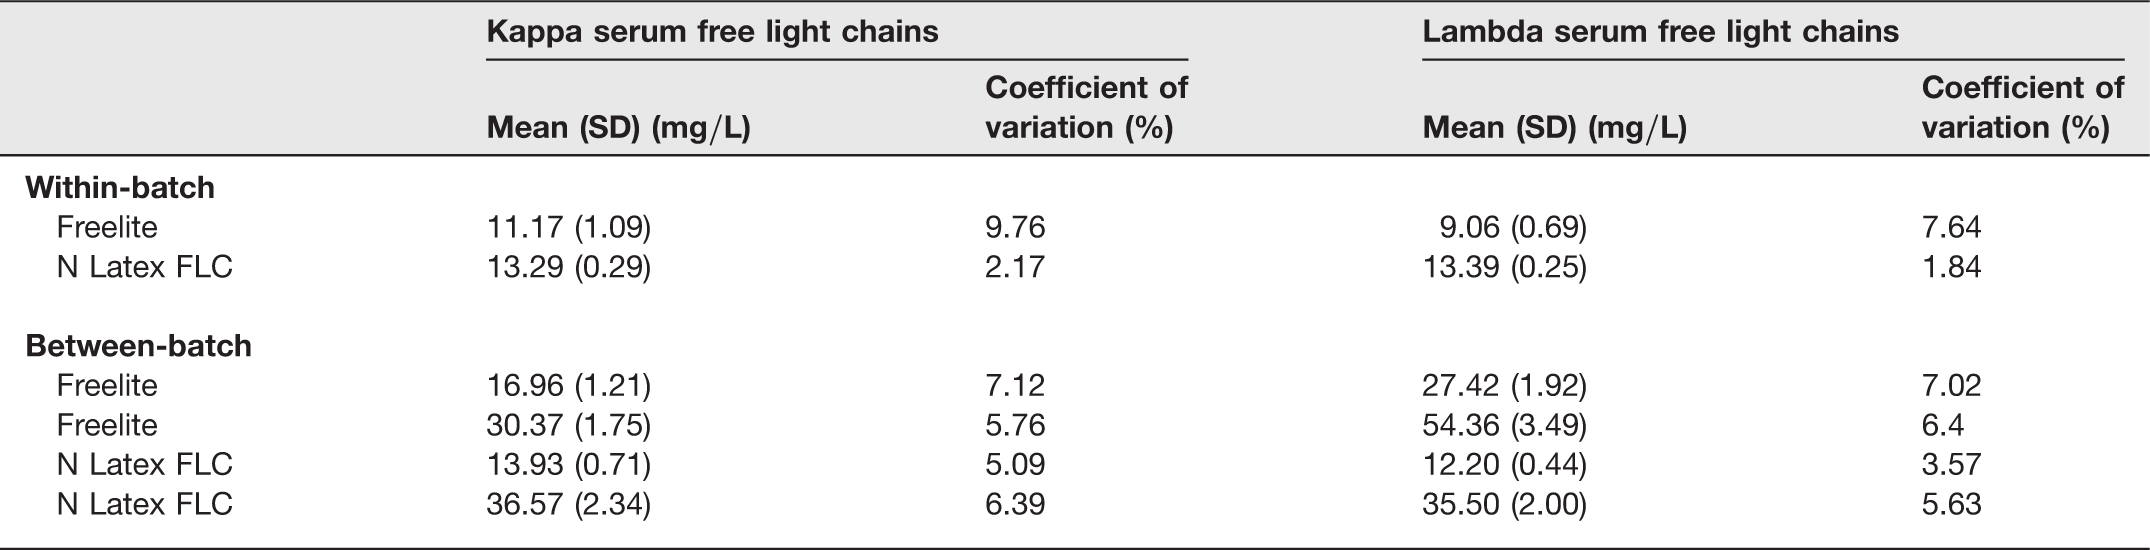
Reproducibility assessment (within-batch and between-batch coefficients of variation) was based on 10 replicates, except for the N latex FLC between-batch where only three replicates were possible. Serum samples were selected to fall either in the reference range or to be moderately elevated. This ensured both assays were assessed similarly and not at the extremes of the analytical sensitivity for either.
Correlation was by Deming's regression analysis. The Clinical and Laboratory Standards Institute (CLSI) (EP09-A2-IR) guidelines suggest that a correlation coefficient r2 > 0.95 indicates good correlation between two assays; 5 therefore, we also performed standard linear regression to determine this parameter. Only definitive data were included in this part of the analysis (e.g. data recorded as less than the detection limit were excluded). Bias was determined by the Altman–Bland method. Owing to the large dynamic range of the data, log transformed data were used for correlation and bias calculations. Qualitative results (less than reference range, within reference range, greater than reference range) were assessed for correspondence. The kappa statistic was calculated to quantify correspondence. The Analyse-IT for Excel statistics package was used (version 2.21, Analyse-It Software Ltd, Leeds, UK).
Results
Table 1 indicates the number of samples entered into the study by each site. Note that the majority (79%) are from patients with B-cell clonal disorders. This reflects the requesting patterns as seen in each centre, e.g. in North Bristol the majority are either new diagnoses or are monitoring samples for myeloma trial patients.
Reproducibility data based on 10 replicates except N latex FLC between-batch where only three replicates were possible
Samples with high serum free light chains identified as outliers by Altman–Bland plots
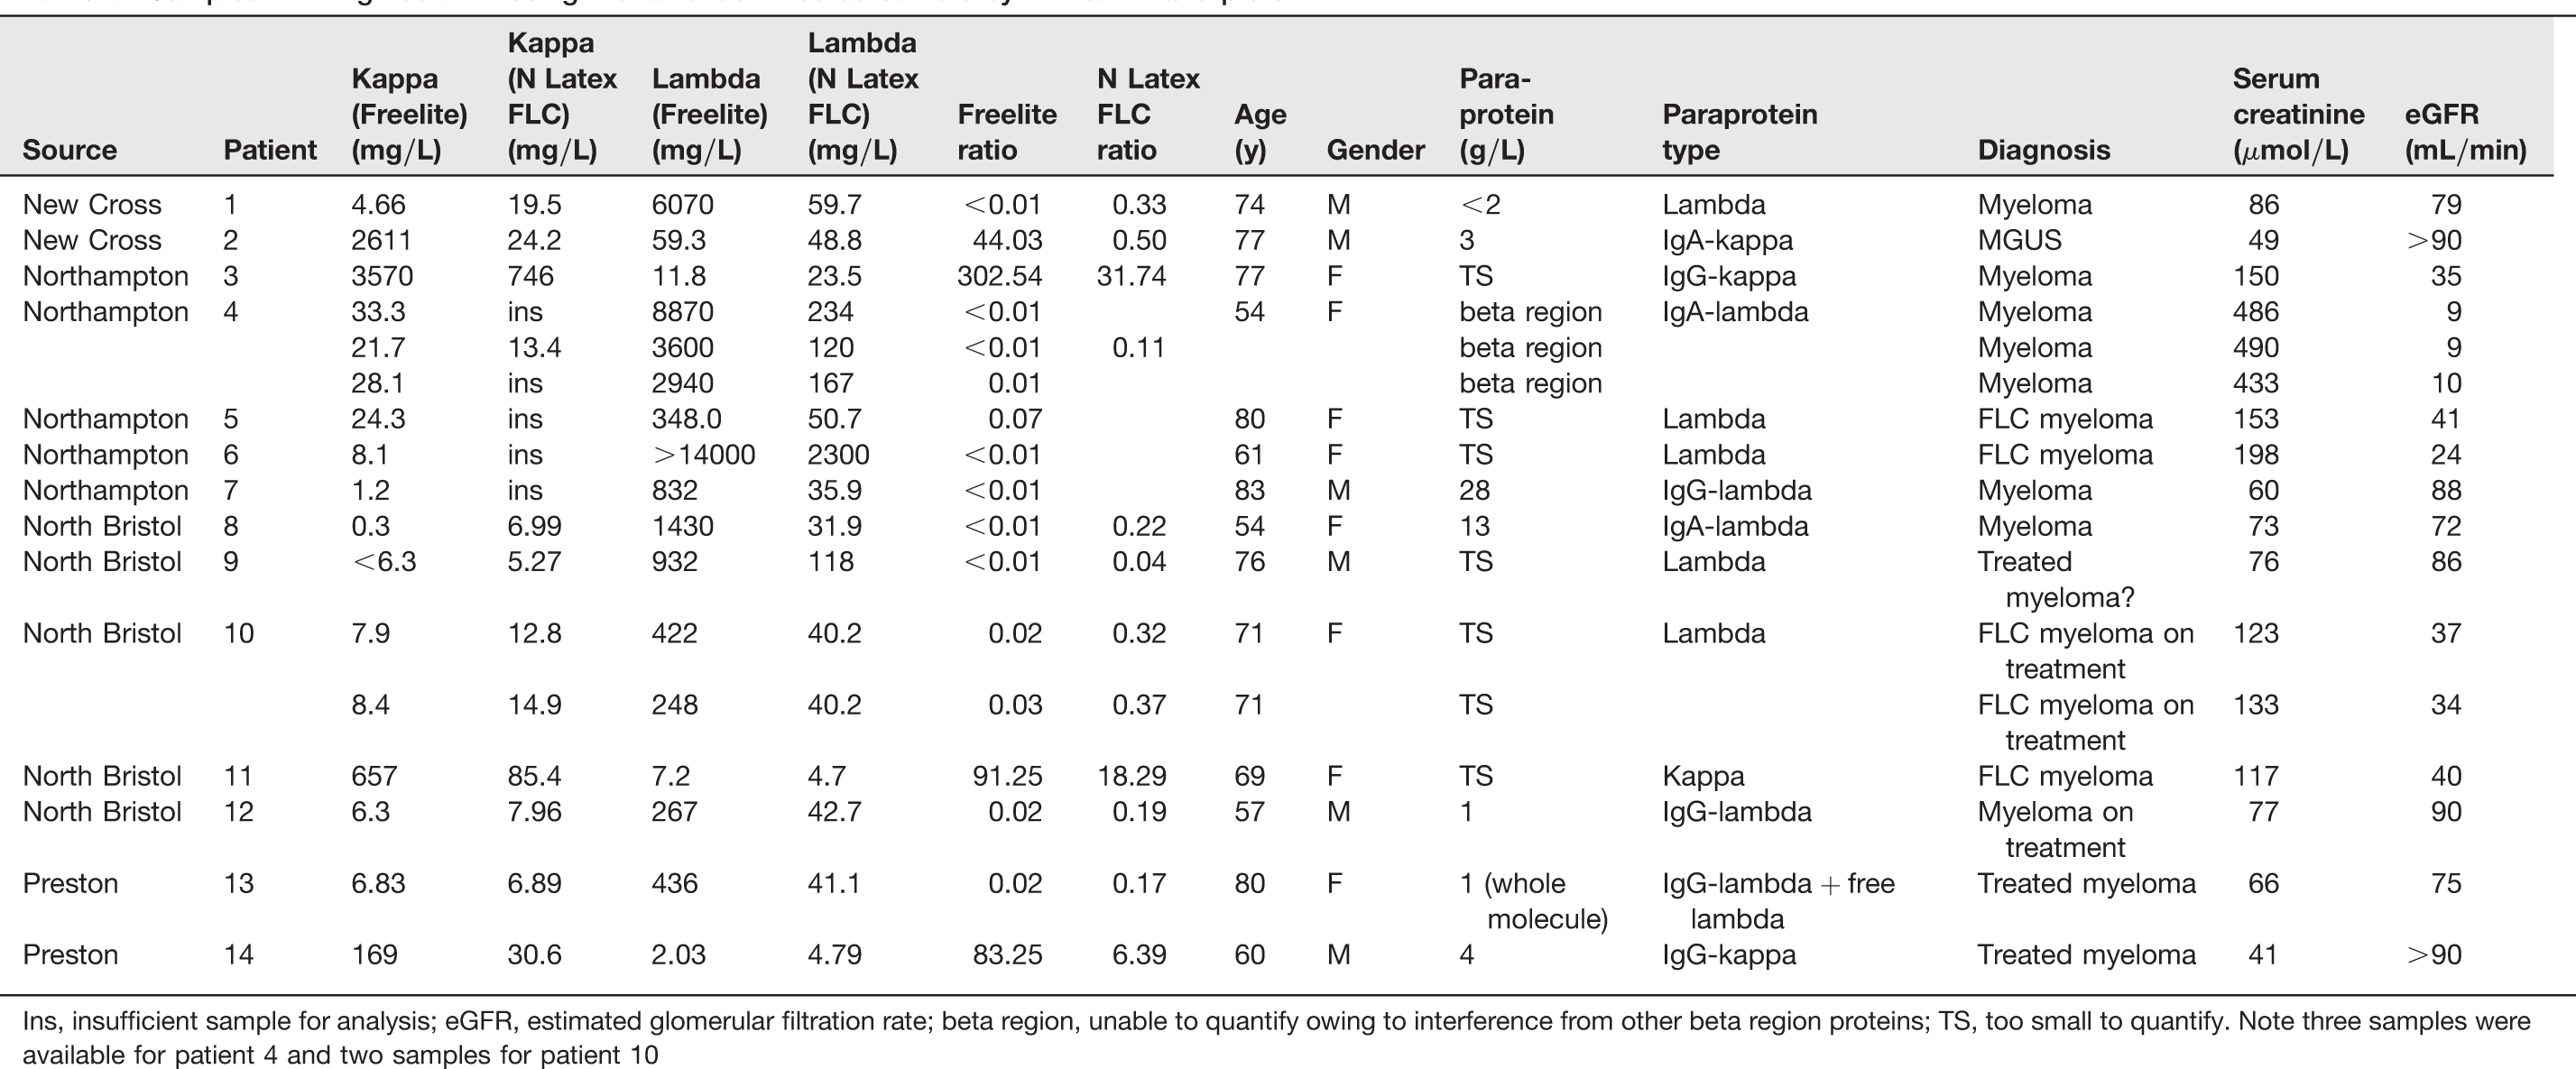
Ins, insufficient sample for analysis; eGFR, estimated glomerular filtration rate; beta region, unable to quantify owing to interference from other beta region proteins; TS, too small to quantify. Note three samples were available for patient 4 and two samples for patient 10
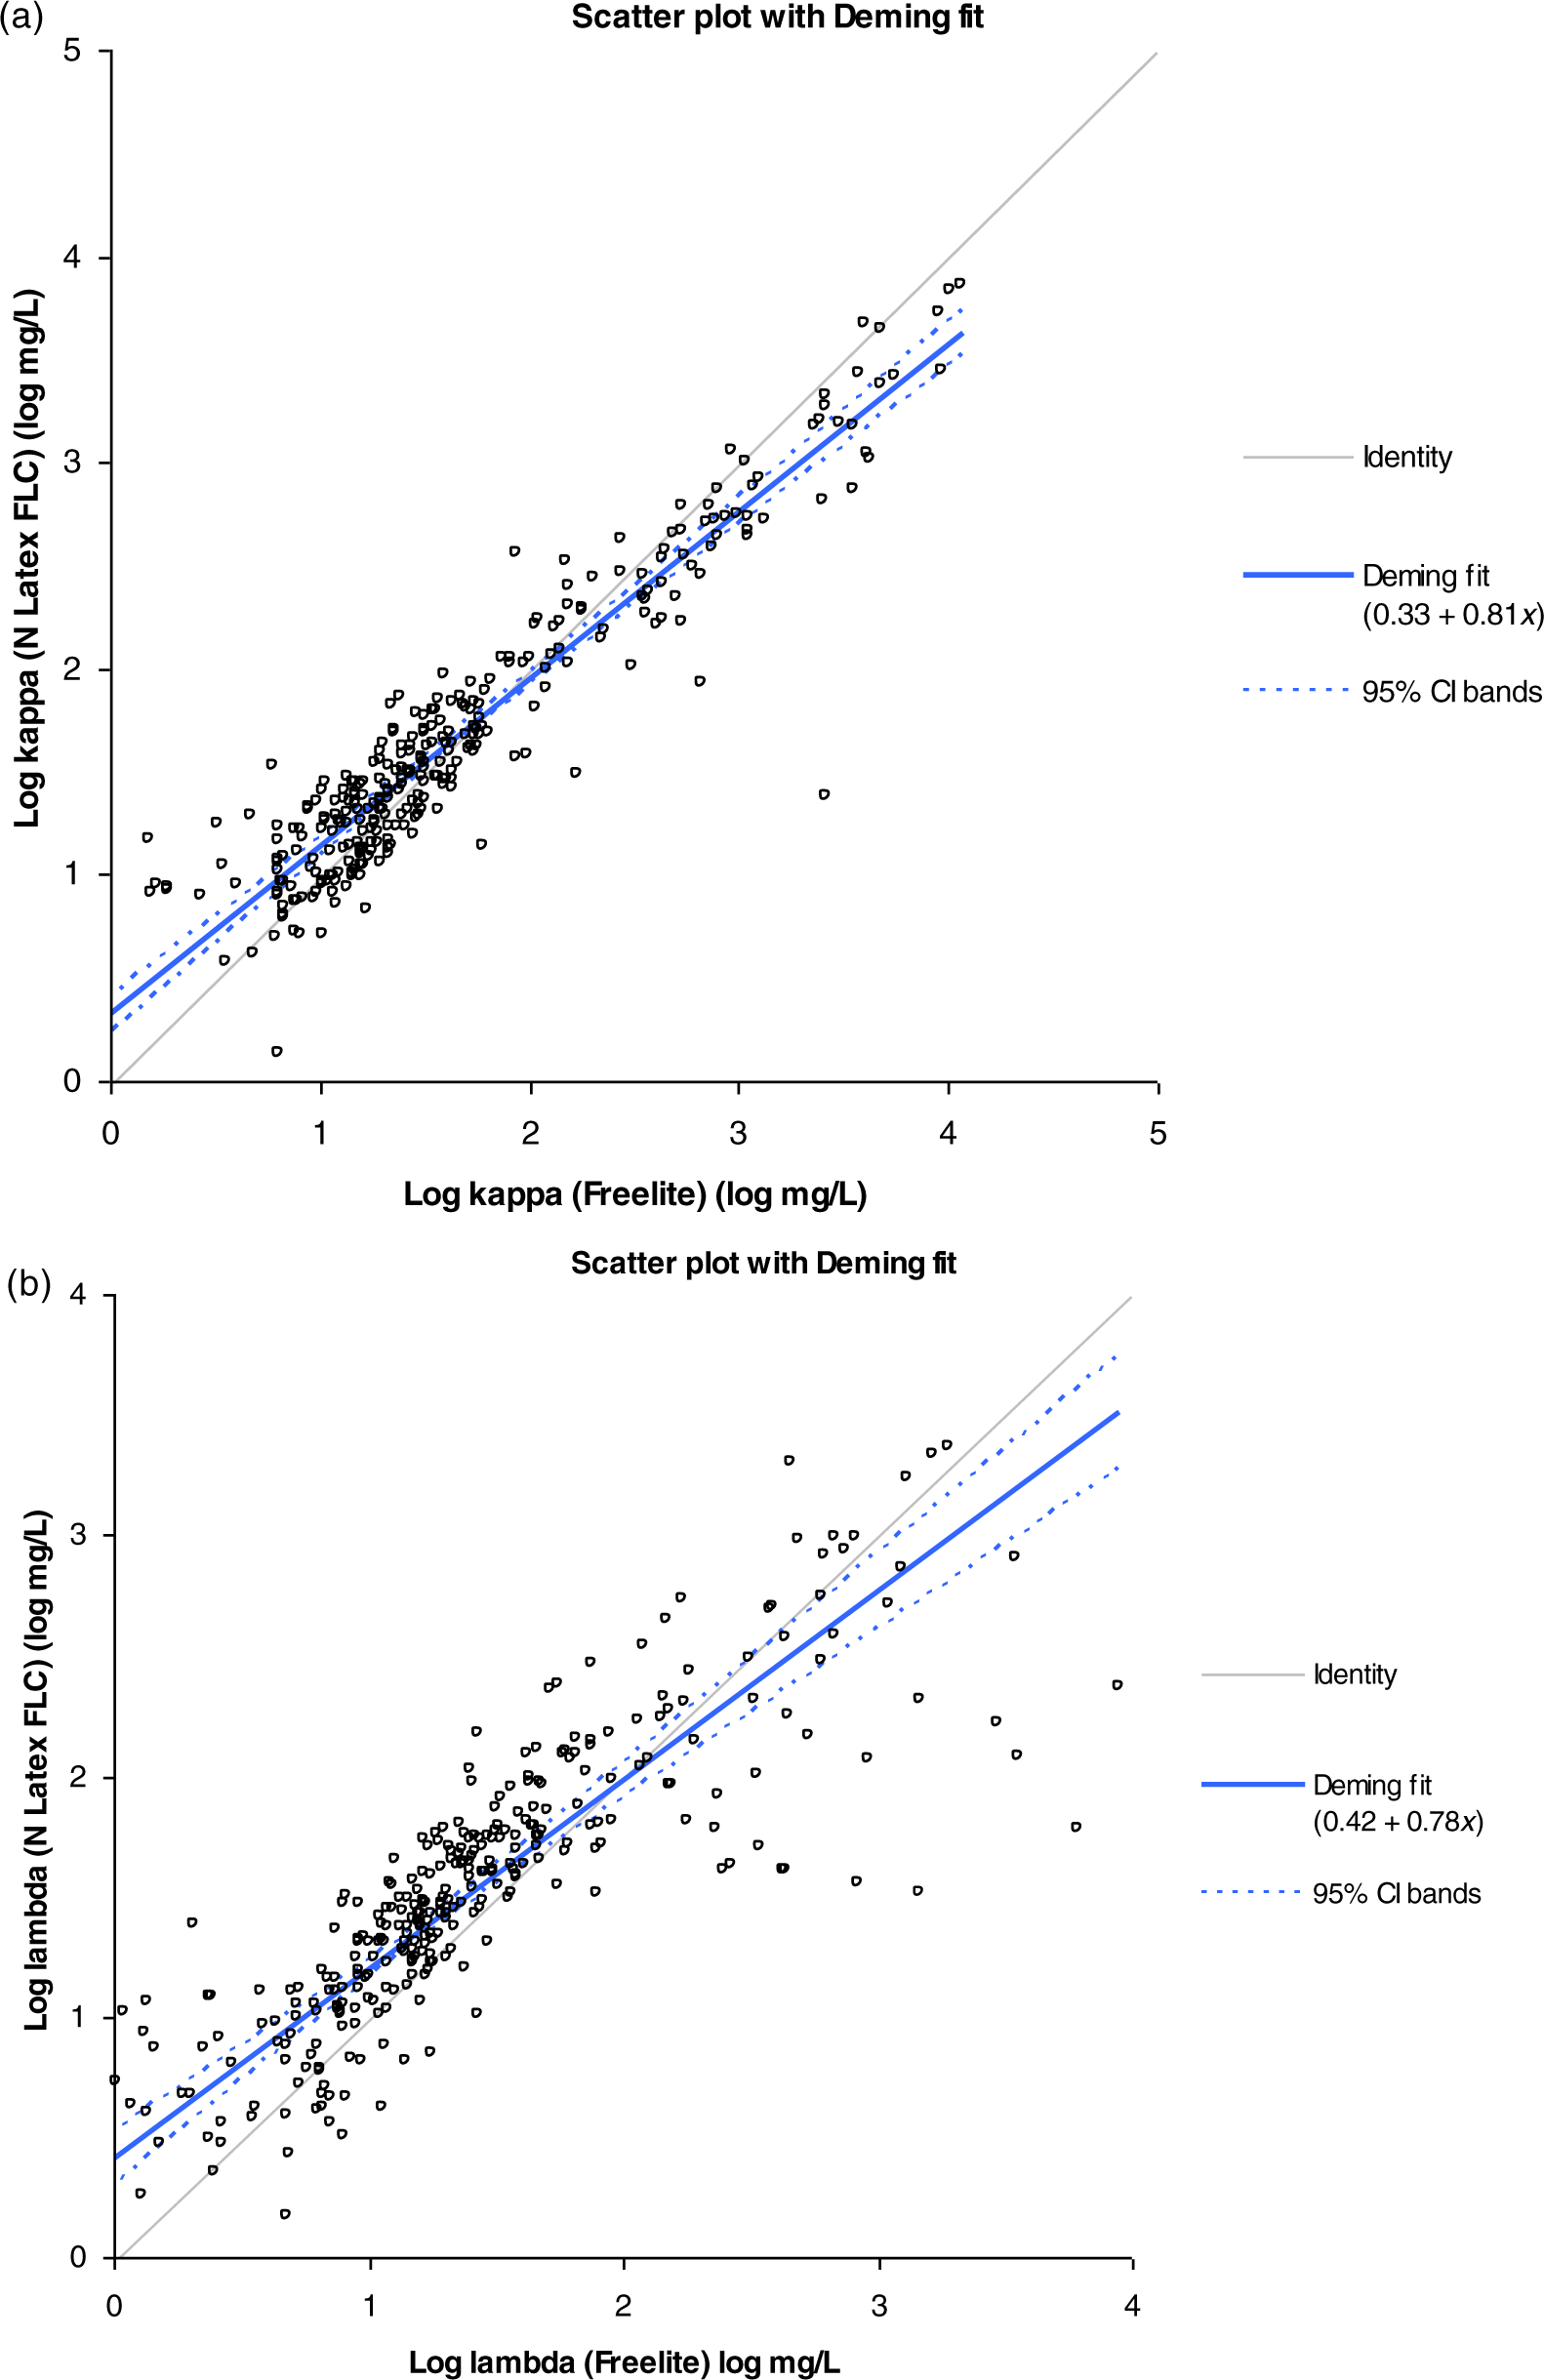
Panels a and b show the Deming regression curves for kappa and lambda serum free light chains respectively. For kappa y = 0.33 + 0.81x and for lambda y = 0.42 + 0.78x
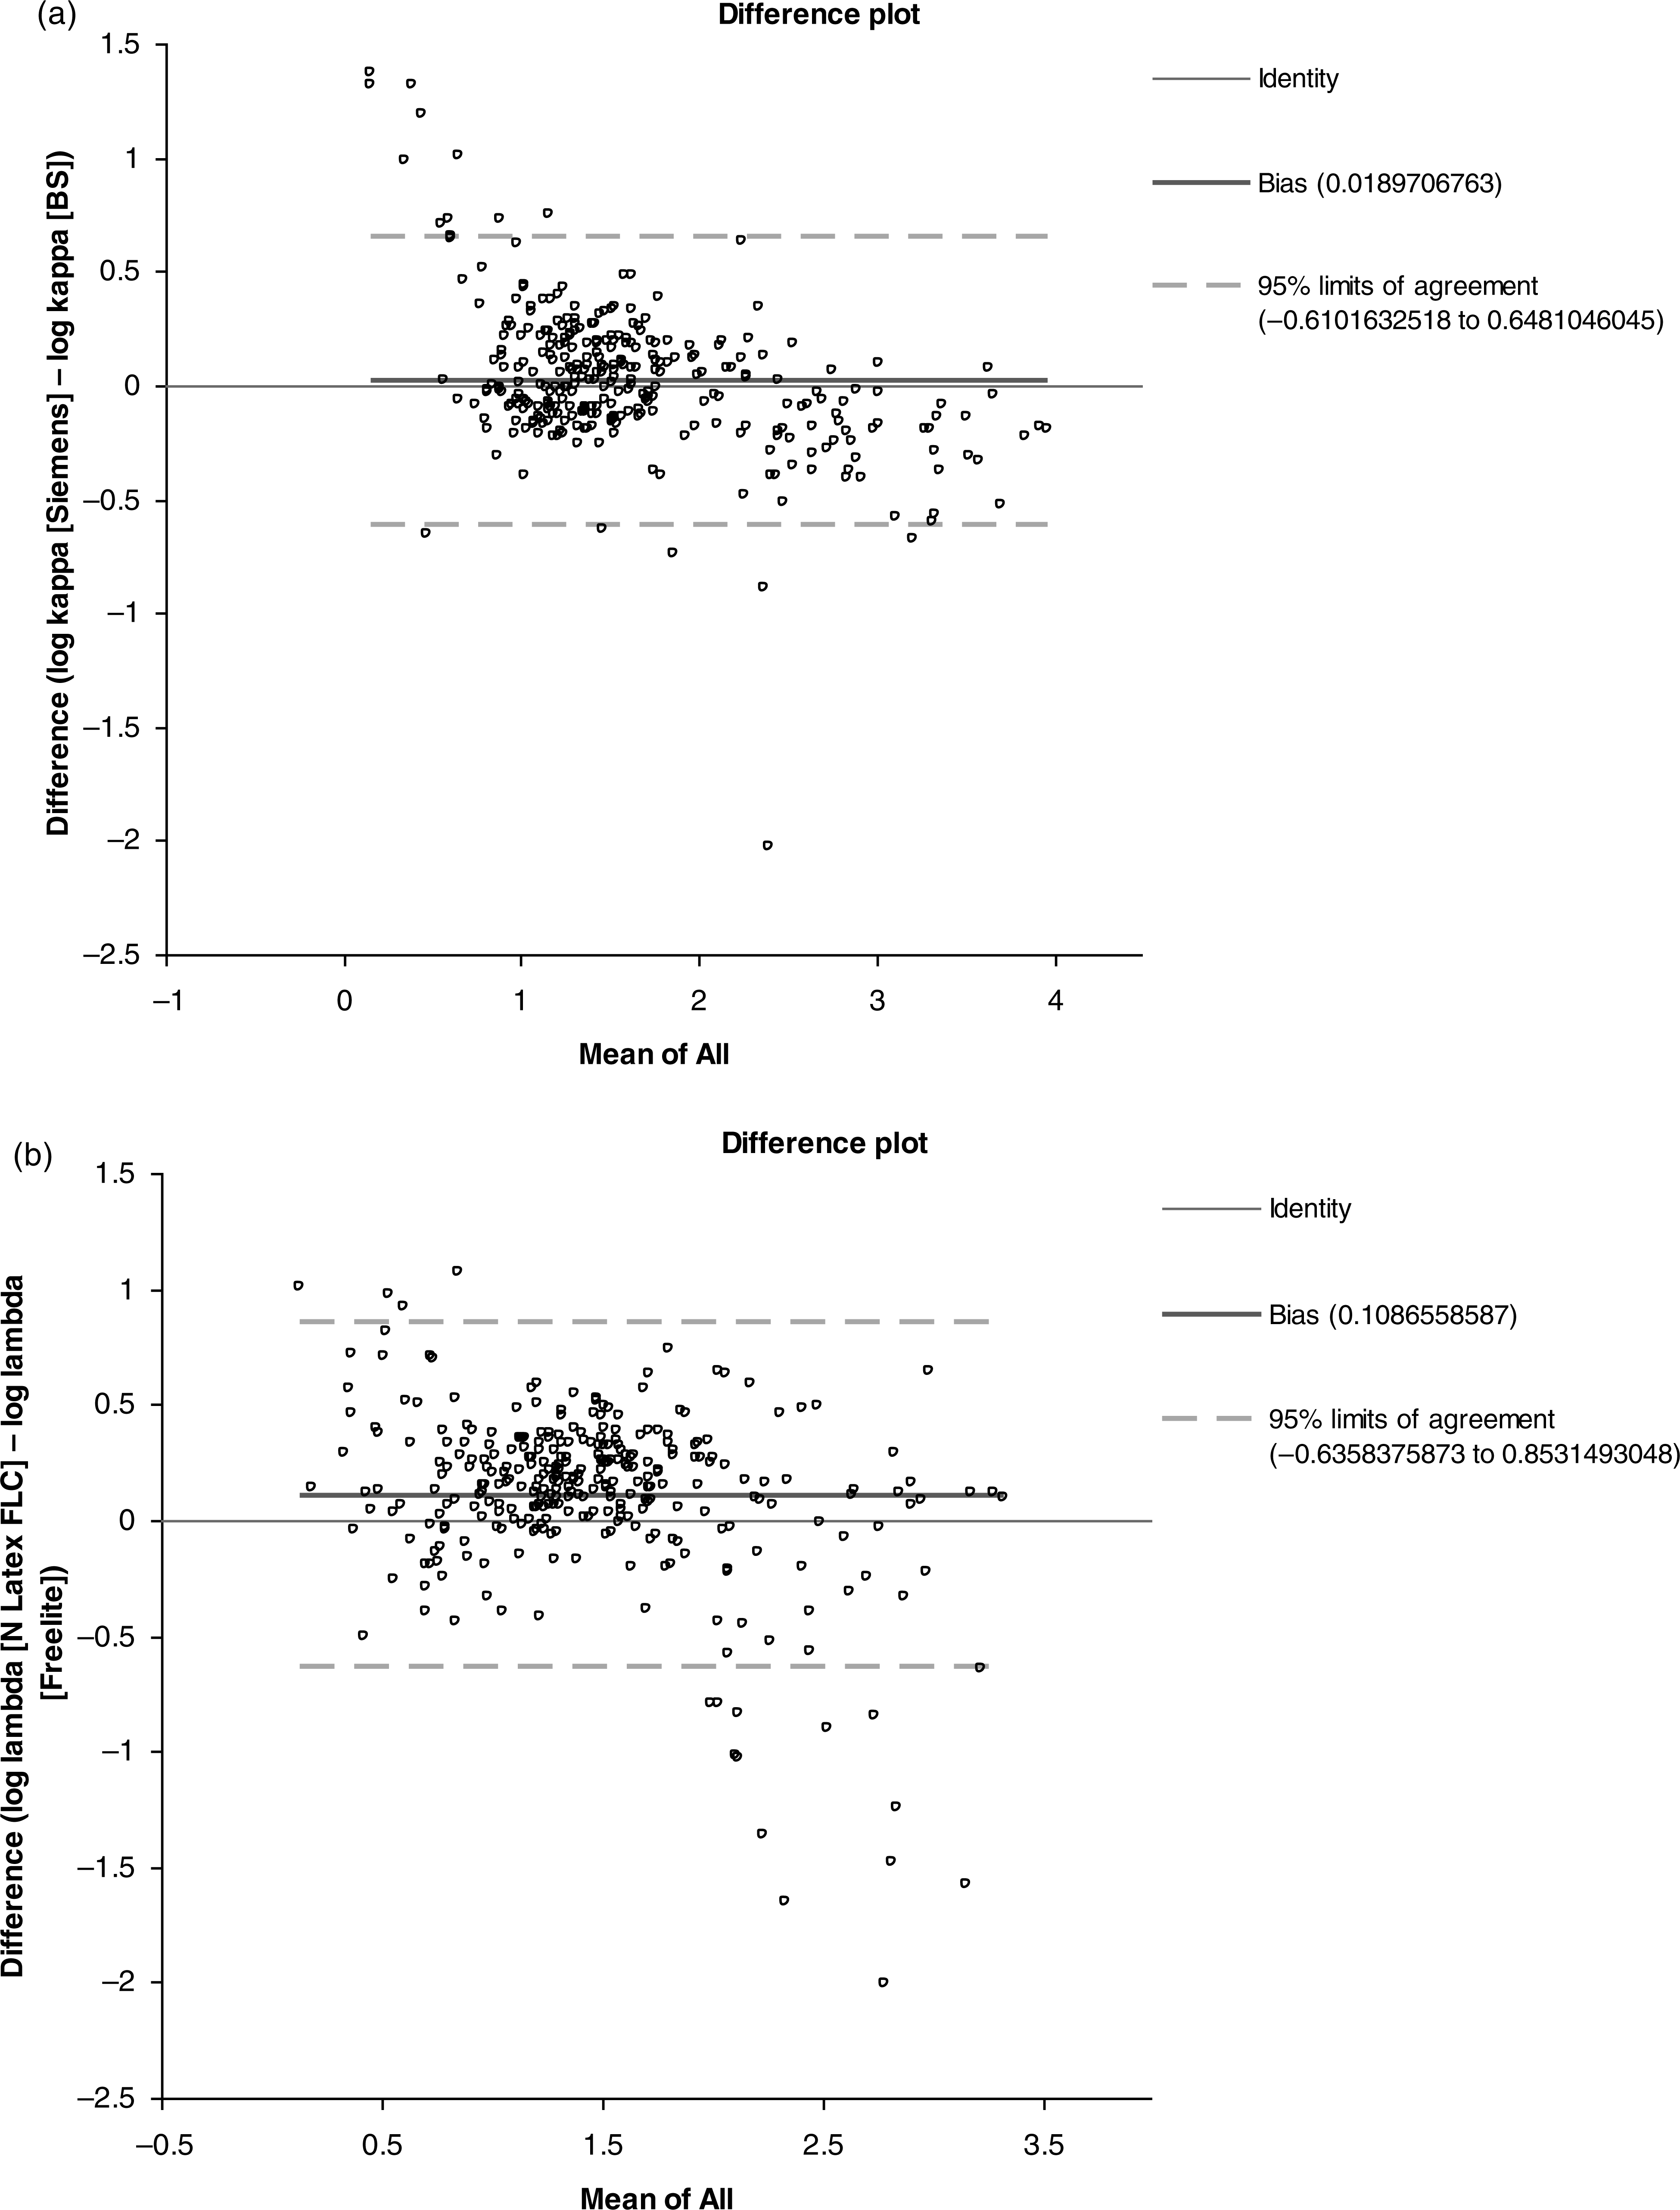
Panels a and b show the Altman–Bland plots for kappa and lambda serum free light chains, respectively. Those samples which were most discrepant (samples with high mean [>log 1.5; >31.6 mg/L] and outside of the 95% limits of agreement) are detailed in Table 3
Correspondence data for kappa and lambda free light chain analysis
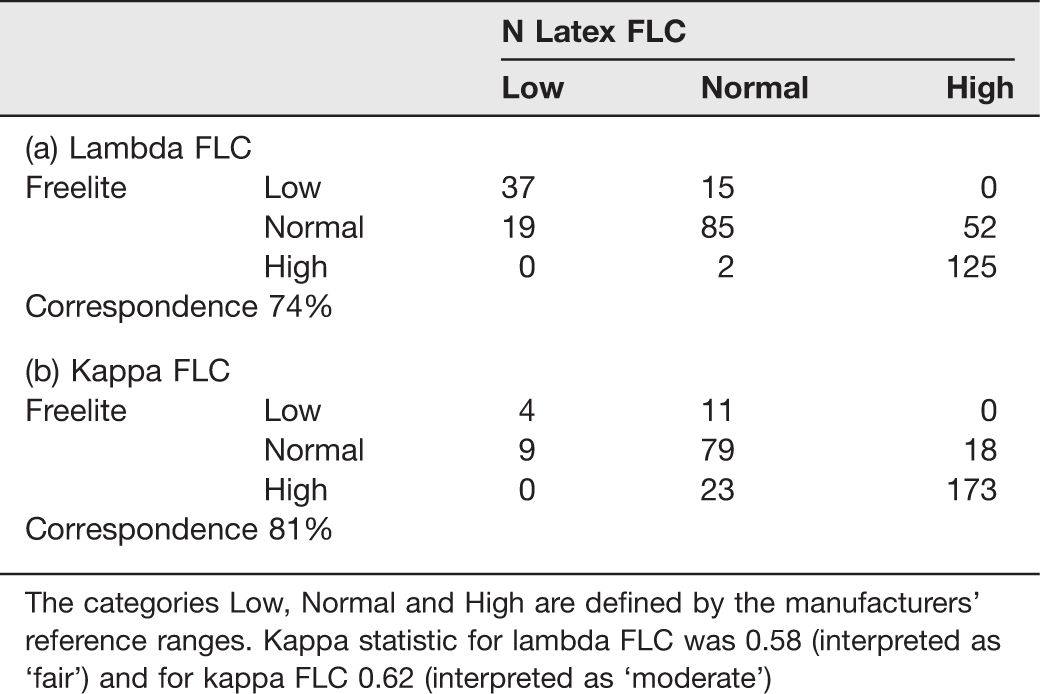
The categories Low, Normal and High are defined by the manufacturers’ reference ranges. Kappa statistic for lambda FLC was 0.58 (interpreted as ‘fair’) and for kappa FLC 0.62 (interpreted as ‘moderate’)
Within-batch and between-batch variations are given in Table 2 (North Bristol data).
Discussion
There are several studies published showing the usefulness of the analysis of serum free light chains in lymphoproliferative disease (e.g. refs.8,9). The analysis is now incorporated into the International Working Group for Multiple Myeloma guidance. 1 All these studies are based on the use of a single analysis system (Freelite). With the introduction of a second system to the market (N Latex FLC), it is essential to determine whether this system, based on the use of monoclonal, rather than polyclonal, antisera is equally able to detect and quantify monoclonal free light chains in serum. Thus far, we know of only two papers comparing the use of these two assays on routine clinical samples.2,3
Our major concern was that there was a theoretical possibility that, with some monoclonal free light chains, the use of monoclonal antisera with restricted epitope specificity might not produce sufficiently large immune complexes to allow detection by light scattering in the nephelometric systems used for analysis. In contrast to Hoedemakers et al., 2 our study included a large percentage of samples from patients with monoclonal gammopathies. The percentage of samples from monoclonal patients is unclear in the study of Pretorius et al., 3 but we note that many potential cases may have been excluded by their selection criteria (samples <50 mg/L on Freelite were excluded). The three studies are thus not directly comparable. Nevertheless, some themes emerge.
Correspondence between the two assays was quite low (kappa 81%, lambda 74%), certainly lower than in the selected data of Pretorius et al. 3 as indicated by the lower kappa statistic, but in many samples this might be expected to have little clinical impact (e.g. normal by one assay and low by the other). Note however that this only applies if the sensitivities of the assays for detecting disease state serum samples are the same, for which there are as yet no conclusive data. There were, however, some worrying results, as shown in Table 3. In some the major concern is that patients transferring between centres could not be monitored effectively if different methods were used in the different centres.
It should be noted that it is unclear as to which result is the more accurate in many of these patients. There are no international standards for the assays. There are well documented problems of non-linearity and antigen excess detection. Providing that the assay used is consistent and able to detect all clonal free light chains then the numeric differences are academic. However, many of the recommendations in the literature are based on experience with the Freelite assay and in the light of our data may not be directly transferable to the Siemens assay (for example, the absolute values for FLC that are recommended as risk stratification markers in all B-cell malignancies). This would include the value of >500 mg/L used to identify patients who potentially have acute renal failure secondary to multiple myeloma. 10 In addition, international guidelines recommend a concentration of >100 mg/L to accurately monitor patients, this is particularly useful for AL amyloid and oligosecretory/non-secretory multiple myeloma patients. This could have considerable impact on the clinical interpretation of results found to be disparate between the two assays.
We found 17 samples (5.2% of all samples) from 14 patients where the clonal light chains were poorly detected by the monoclonal antisera (Table 3), in one case with a highly misleading normal ratio (Table 3, patient 10) or, more worryingly, not detected at all (Table 3, patient 2). More significant outliers were found for lambda than kappa. It is interesting to note that Pretorius et al. 3 described three patients with lymphoproliferative disease in whom normal FLC ratios were seen in the N Latex FLC assay (1 AL amyloid patient, 1 lambda light chain myeloma patient and 1 chronic myelomoncytic leukaemia patient with a positive kappa Bence Jones protein). All three were detected as having an abnormal FLC ratio by Freelite. Similarly, Hoedemakers et al. 2 noted one patient with lambda light chain myeloma with a normal ratio by N Latex FLC that was abnormal by Freelite. 2 So, although the numbers are small, and therefore not conclusive, both these and our own study support our contention that some clones might be missed by the more limited epitope specificity expected of monoclonal antisera.
While in general terms the two assays perform similarly in the detection of serum free light chains, we believe that there are sufficient data here to suggest the assays are not equivalent. We would stress that this last point is very important. As there is poor correlation, the current international guidelines cannot be cross applied to the Siemens assay. More data are required to establish equivalent FLC concentrations, as quantified by the N Latex FLC assay, for the stratification and management of patients with B-cell lymphoproliferative disorders.