
Abstract
This study proposes a method to remove background pixels from near-infrared hyperspectral images based on the pixel-wise standard deviation of reflectance method (px-wise SD method). This method calculates the standard deviation (SD) of reflectance in each pixel, namely each spectrum, and determines a threshold to distinguish between background and object pixels from the resulting histogram of the px-wise SD. The method effectiveness is evaluated using hyperspectral images of a leaf-like pastry with a hole placed on either a low-reflectance sheet or white paper. On white paper, the px-wise SD of reflectance exhibits a trimodal histogram with two prominent peaks and one small peak between them. The prominent peak with a lower SD corresponds to the white paper pixels, whereas the other peak with a higher SD is associated with the surface and edge pixels of the pastry. The small peak represents the pixels of the hole. The background and object pixels can be effectively separated by setting a threshold between this small peak and the prominent peak for the pastry pixels. Moreover, the mean spectrum calculated using only object pixels remains consistent, regardless of the type of background material. Conversely, the mean spectrum calculated using all pixels is distorted due to the spectral inclusion of the background material.
This is a visual representation of the abstract.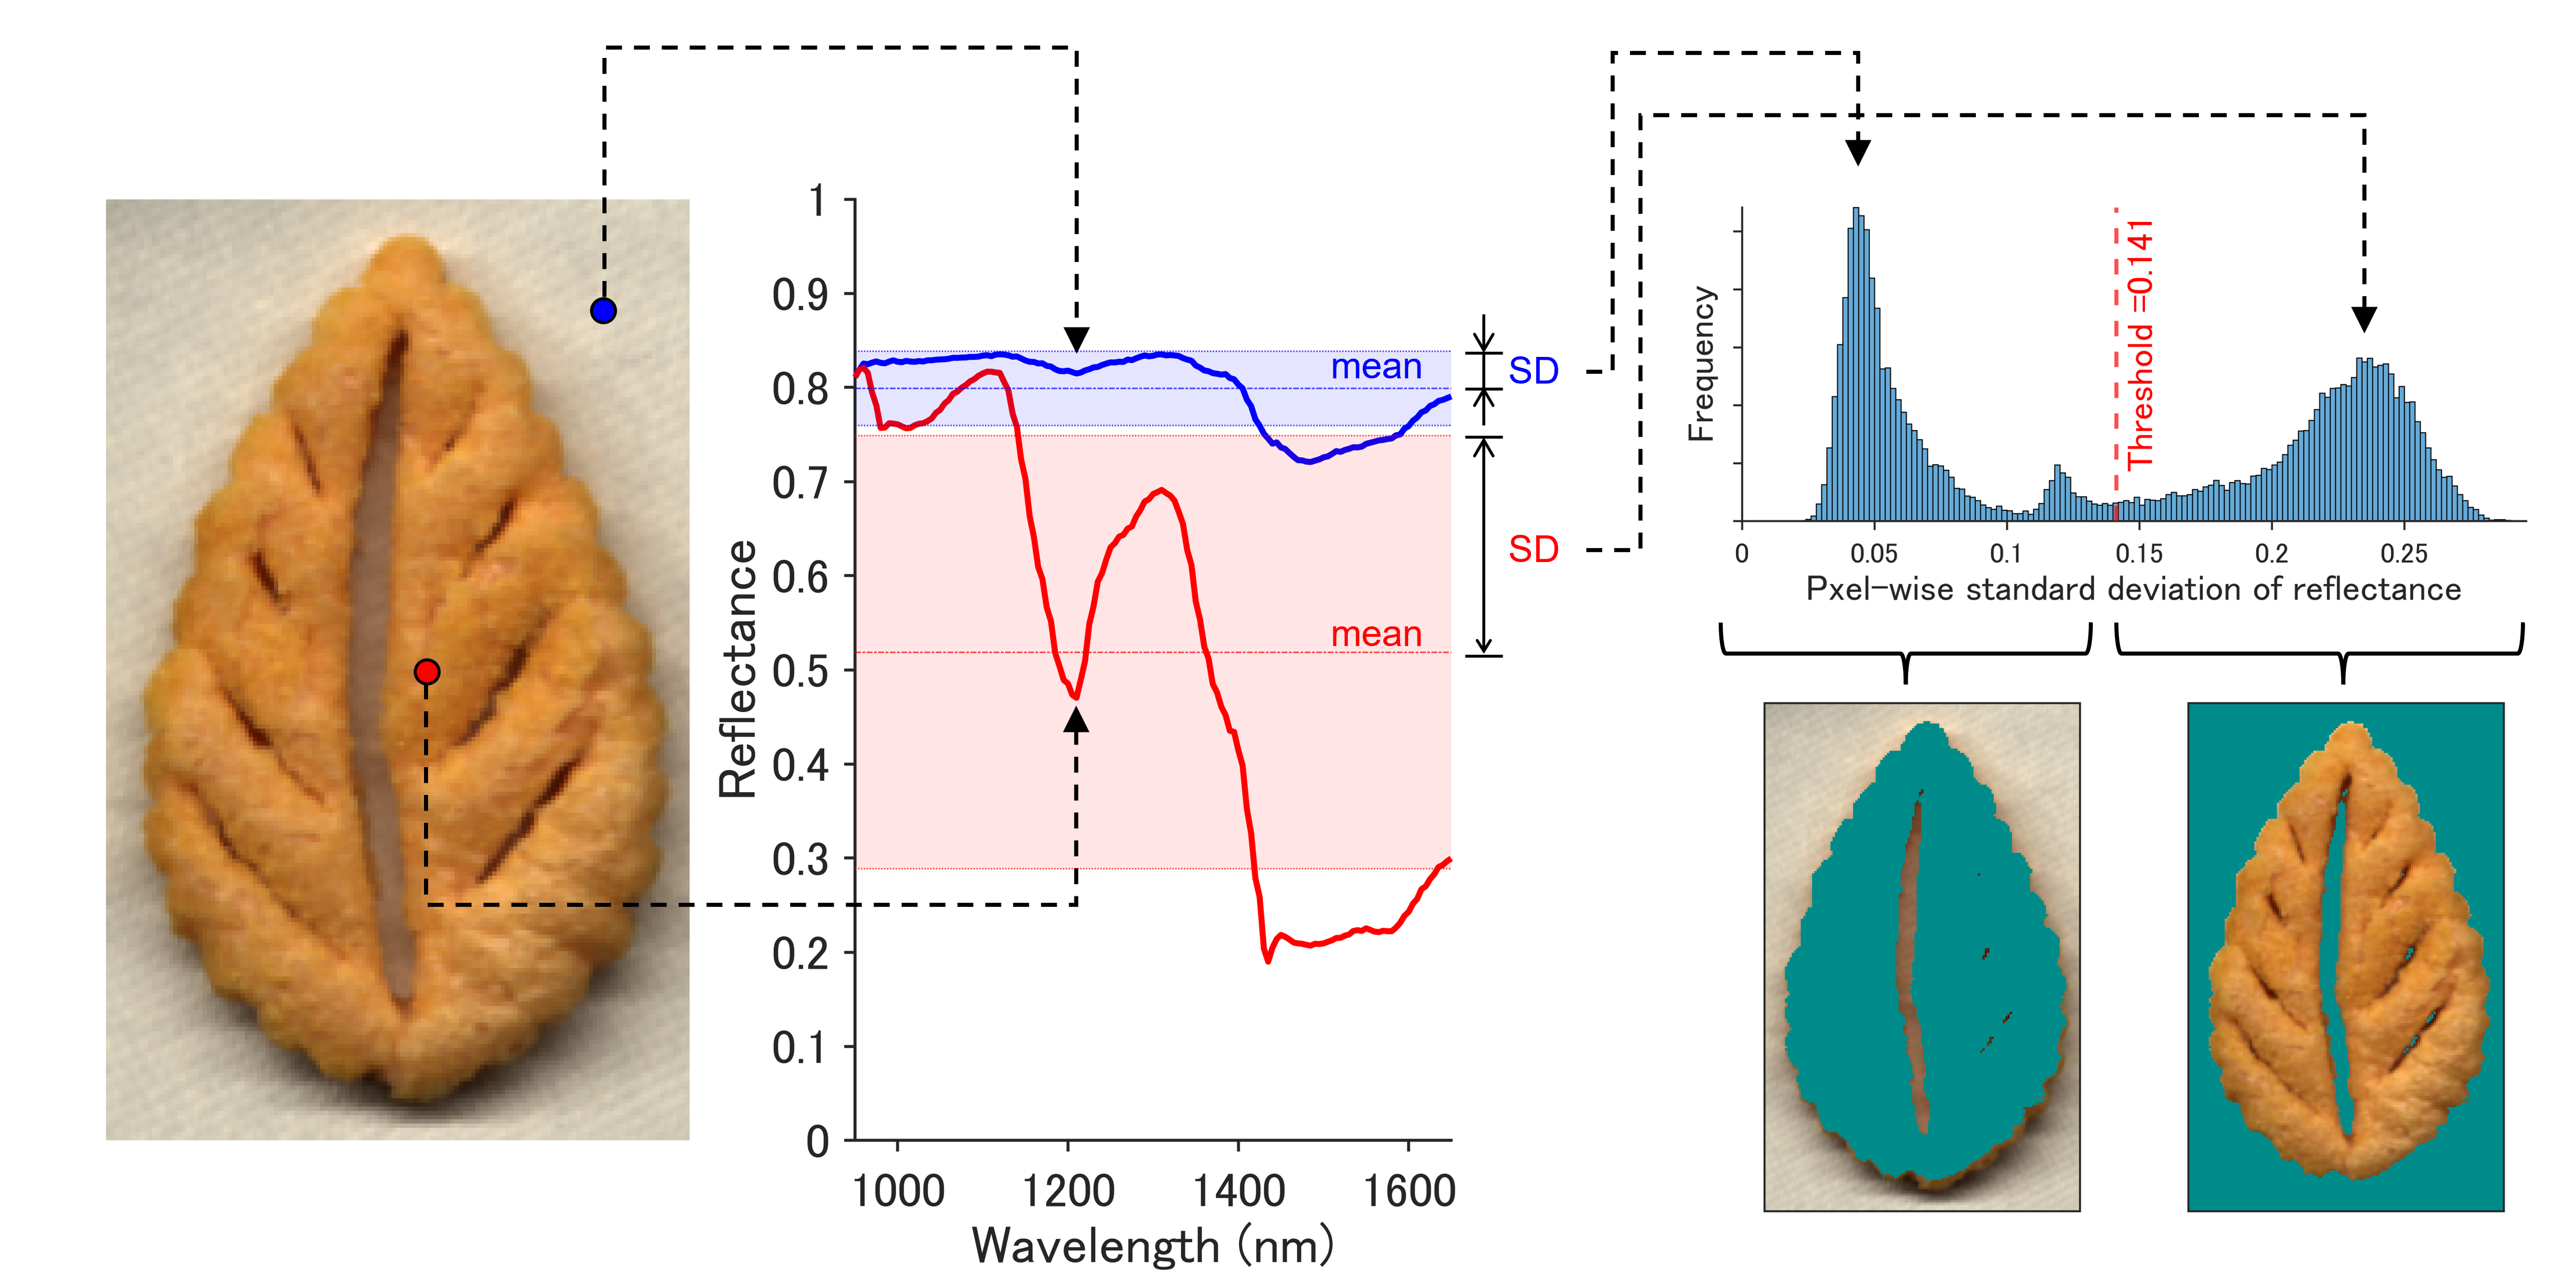
Keywords
Introduction
Near-infrared hyperspectral imaging (NIR-HSI) is a powerful technique used for chemical analysis, wherein the chemical composition of an object can be investigated by examining the shapes and variations in the NIR spectra resulting from molecular vibrations or electronic excitations. 1 An intriguing aspect of NIR-HSI is the fact that it provides both geometric and chemical information for an object. Additionally, when NIR-HSI is combined with multivariate analyses, samples can be effectively classified based on their chemical compositions.2,3 Recently, the availability of benchtop NIR-HSI devices that demonstrate improved performances has increased. 4
Background pixel removal is an essential step in hyperspectral image analysis,2,5 and is often akin to the selection of regions of interest (ROIs) in hyperspectral images, which are also referred to as masking non-interesting areas. 6 Applications using benchtop NIR-HSI devices unavoidably capture background material alongside the object of interest, especially when the sample is smaller than the field of view or contains holes. Since this spectral information relating to the background materials is entirely irrelevant to that of objects, neglecting background pixel removal can cause discrepancies in the precision of classification models.6,7 For example, the centering of spectra using a mean or median spectrum is commonly required for preprocessing during principal component analysis (PCA) and partial least squares discriminant analysis (PLS-DA).2,7,8 Hence, when calculating the mean or median spectrum with background pixels, the outcomes of multivariate analyses can be potentially distorted. Thus, to achieve accurate and reliable PCA and PLS-DA results, background pixels should be removed prior to performing multivariate analyses.
To date, several methods have been proposed for the removal of background pixels from NIR-HSI.5,6,9,10 Common practices include the manual selection of ROIs,5,9–12 use of specific thresholds at specific wavelengths (single or more than two wavelengths),13–27 k-means clustering,6,28,29 and PCA scores.5,7,18,30–37 In addition, the use of an appropriate background material exhibiting a high contrast with the object facilitates easy differentiation from the object.5,22 For this purpose, previous studies have used silicon carbide sandpaper,13,31–33 low-reflectance coarse emery cloths, 14 black NIR-absorbent plastic trays, 17 Teflon holders, 19 and aluminum plates painted dull black. 16
Although the removal of background pixels may seem logical, selecting background pixels from an NIR-HSI spectrum is not always straightforward. For example, distinguishing between the spectra of background materials and object edges is difficult because edges contain strongly mixed information regarding the spectral signatures of the objects and the background materials. 5 Furthermore, the free selection of background materials is not feasible in several situations, necessitating the use of background materials that do not provide a high contrast; for instance, a material with a reflectance similar to that of the considered object.
In this study, a background pixel removal method is proposed based on the pixel-wise standard deviation (px-wise SD) of reflectance in each pixel. Although this method is categorized as a threshold-based method, 38 the technique adopts px-wise SD of reflectance instead of reflectance at specific wavelengths or PCA scores. The px-wise SD of reflectance is a measure of spread from the px-wise mean reflectance and is one of the elements representing a spectral signature. For example, a flat spectrum possesses a low SD, whereas a spectrum with peaks and valleys exhibits an increased SD. When performing chemical analyses using NIR-HSI, the object under examination exhibits a spectrum with peaks and valleys. In contrast, background materials are more likely to be selected due to their flat spectra, which ensure clear differentiation from the object.
To evaluate the effectiveness of the proposed method, NIR-HSI is conducted using a leaf-like pastry with a hole placed on either a low-reflectance sheet or a white paper. The reflectance of the low-reflectance sheet is close to zero, whereas that of the white paper is similar to or higher than that of the pastry. The former is considered ideal for backgrounds, whereas the latter is not recommended as a background material for NIR-HSI. 22 After applying the px-wise SD technique, the accuracy of the geometric information, including pastry contours and a hole, is obtained. The significance of background pixel removal is further examined by comparing the mean spectra derived only from the object pixels with those calculated from all pixels.
The proposed method offers several clear advantages: it effectively removes background pixels not only with ideal low-reflectance materials but also with white paper, which, despite being widely available and cost-effective, is not recommended for NIR-HSI. Since the method does not require any prior manual labeling of background pixels, it significantly reduces the preprocessing workload. Additionally, compared to the PCA-based method, the px-wise SD method requires considerably less computation, resulting in faster processing times. These features are expected to improve the practical applicability and efficiency of NIR-HSI under various conditions.
Background Pixel Removal
The proposed px-wise SD method identifies and excludes background pixels according to the following procedure.
Step 1: Prior to performing the px-wise SD method, several tasks must be completed, including the unfolding of spectral hypercubes, the removal of noisy wavelength regions, and the interpolation of dead pixels.
22
Reflectance is preferred to calculate the px-wise SD, particularly when low-reflectance materials are used as background materials, since the spectral transformation from reflectance to absorbance results in a large SD for the background pixels. Although spectral pre-treatment is not always required for the px-wise SD method, derivative treatments are acceptable. However, the standard normal variate (SNV) method,
39
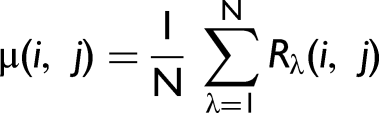
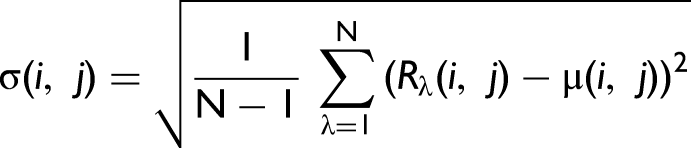
which is one of the most popular spectral pre-treatment approaches, is not used because it produces calculation errors in the method by rendering the px-wise SD equal to 1. Therefore, SNV should only be applied to object pixels after removing the background pixels, similar to the case of the spectral transformation from reflectance to absorbance. Additionally, mean centering should be avoided because the mean spectrum calculated in the presence of background pixels becomes distorted, as discussed later in the Effects of Background Pixel Removal on the Mean Spectrum section. Step 2: The SD of reflectance in each pixel can be calculated as follows: Step 3: To determine the threshold between the background and object pixels, a histogram is constructed using the vector of the SDs. For a hyperspectral image comprising one object with a background, the SD histogram exhibits a bimodal distribution. The peak at a lower SD arises from the background pixels, while the other peak at a higher SD arises from the object pixels. Therefore, a threshold between the two peaks is selected to distinguish the background pixels from the object pixels. In the case of bimodal histograms, the method of Otsu is employed to automatically determine the threshold.
40
Step 4: Pixels with an SD lower than the determined threshold are considered background pixels. In such pixels, the reflectance values are either removed for data volume reduction or replaced with “not a number” (NaN) to calculate the mean spectrum using only the object pixels.
Experimental
Materials and Methods
A store-bought pastry in the shape of a Zelkova leaf was used as the object (Figure 1a), featuring a hole and indentations to represent the midrib and veins. The pastry measured approximately 13, 8, and 1.5 cm in length, width, and thickness, respectively. The ingredients listed in the package included butter, flour, sugar, cinnamon, and salt. Granulated sugar was sprinkled on the pastry surface.
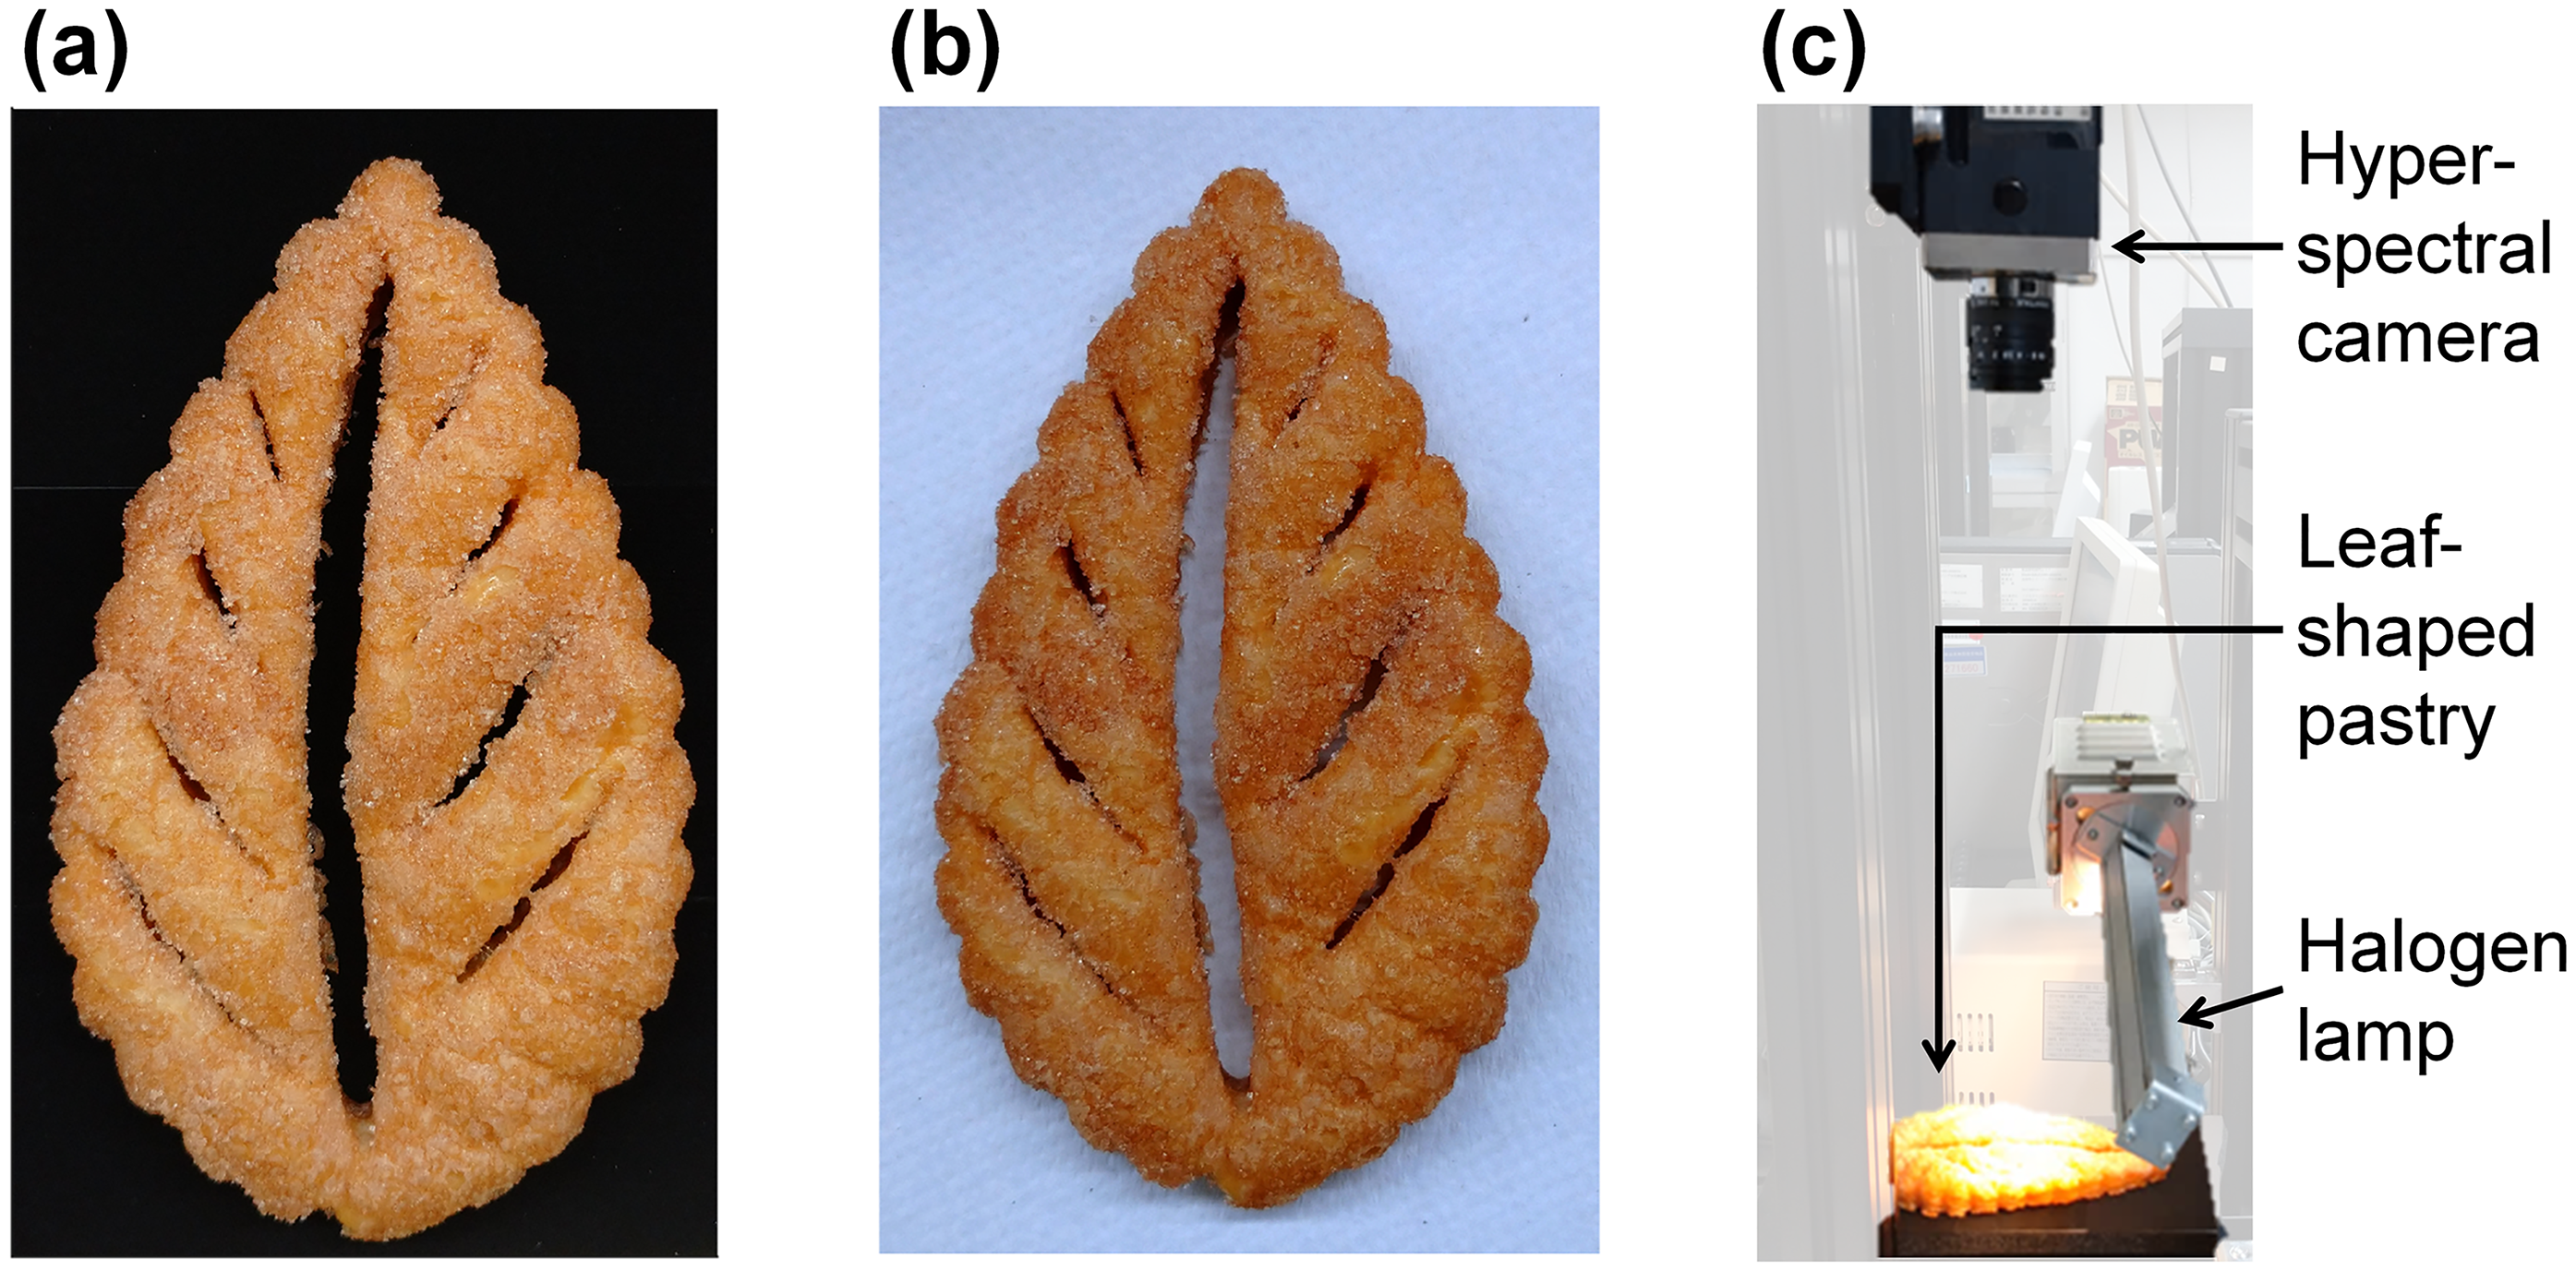
RGB images of the leaf-shaped pastry placed on (a) a low-reflectance sheet and (b) white paper. (c) NIR hyperspectral image acquisition.
For this study, two types of background materials were used. The first material was a low-reflectance sheet of polyurethane foam (Fineshut Kiwami, Koyo Orient Japan Co., Ltd., Japan), which achieved low reflectance in the NIR region. The second material was a piece of white paper (Comfort Service Towel 200 SD, Nippon Paper Crecia Co., Ltd., Japan) obtained from recycled paper. The leaf-shaped pastry was initially placed on the low-reflectance sheet (Figure 1a), and a hypercube was acquired. Subsequently, the pastry was moved onto the white paper (Figure 1b), and another hypercube was acquired on the white paper sheet.
Acquisition of the NIR Hyperspectral Images
Near-infrared hyperspectral images of the pastry were acquired using a push-broom type HSI device (Imspector N17E, Specim, Finland; Figure 1c), covering a region in the range of 900–1700 nm. The spectral image intensity was recorded as the reflectance using a polytetrafluoroethylene reference reflector (Spectralon, Labsphere, Inc., USA). 41 Before reflectance calculation, a dark image captured by covering the lens with an opaque black cap was subtracted from both the sample and reference data to correct for sensor noise. The spectral and spatial dimensions of the hyperspectral images were 5 nm and approximately 40 dots per inch (dpi), respectively. A halogen lamp was positioned diagonally above the pastry (Figure 1c). The acquired hyperspectral images were exported in CSV format to a personal computer to remove the background pixels.
Data Analysis
Data analysis was conducted using Matlab software (version R2024a, MathWorks, USA), employing an image-processing toolbox (version 24.1, MathWorks) for implementing the Otsu method. An example of the Matlab code used for the proposed method is presented in the Supplemental Material.
The acquired NIR images (Figures 2a and 2c) were displayed using false colors with the reflectances at 1300, 1400, and 1500 nm representing the red, green, and blue channels, respectively. The images measured 224, 139, and 141 pixels in terms of the length (longitudinal), width (lateral), and spectral channels, respectively, corresponding to 950–1650 nm in steps of 5 nm. The 900–945 and 1655–1700 nm regions were eliminated owing to their low signal-to-noise ratios.
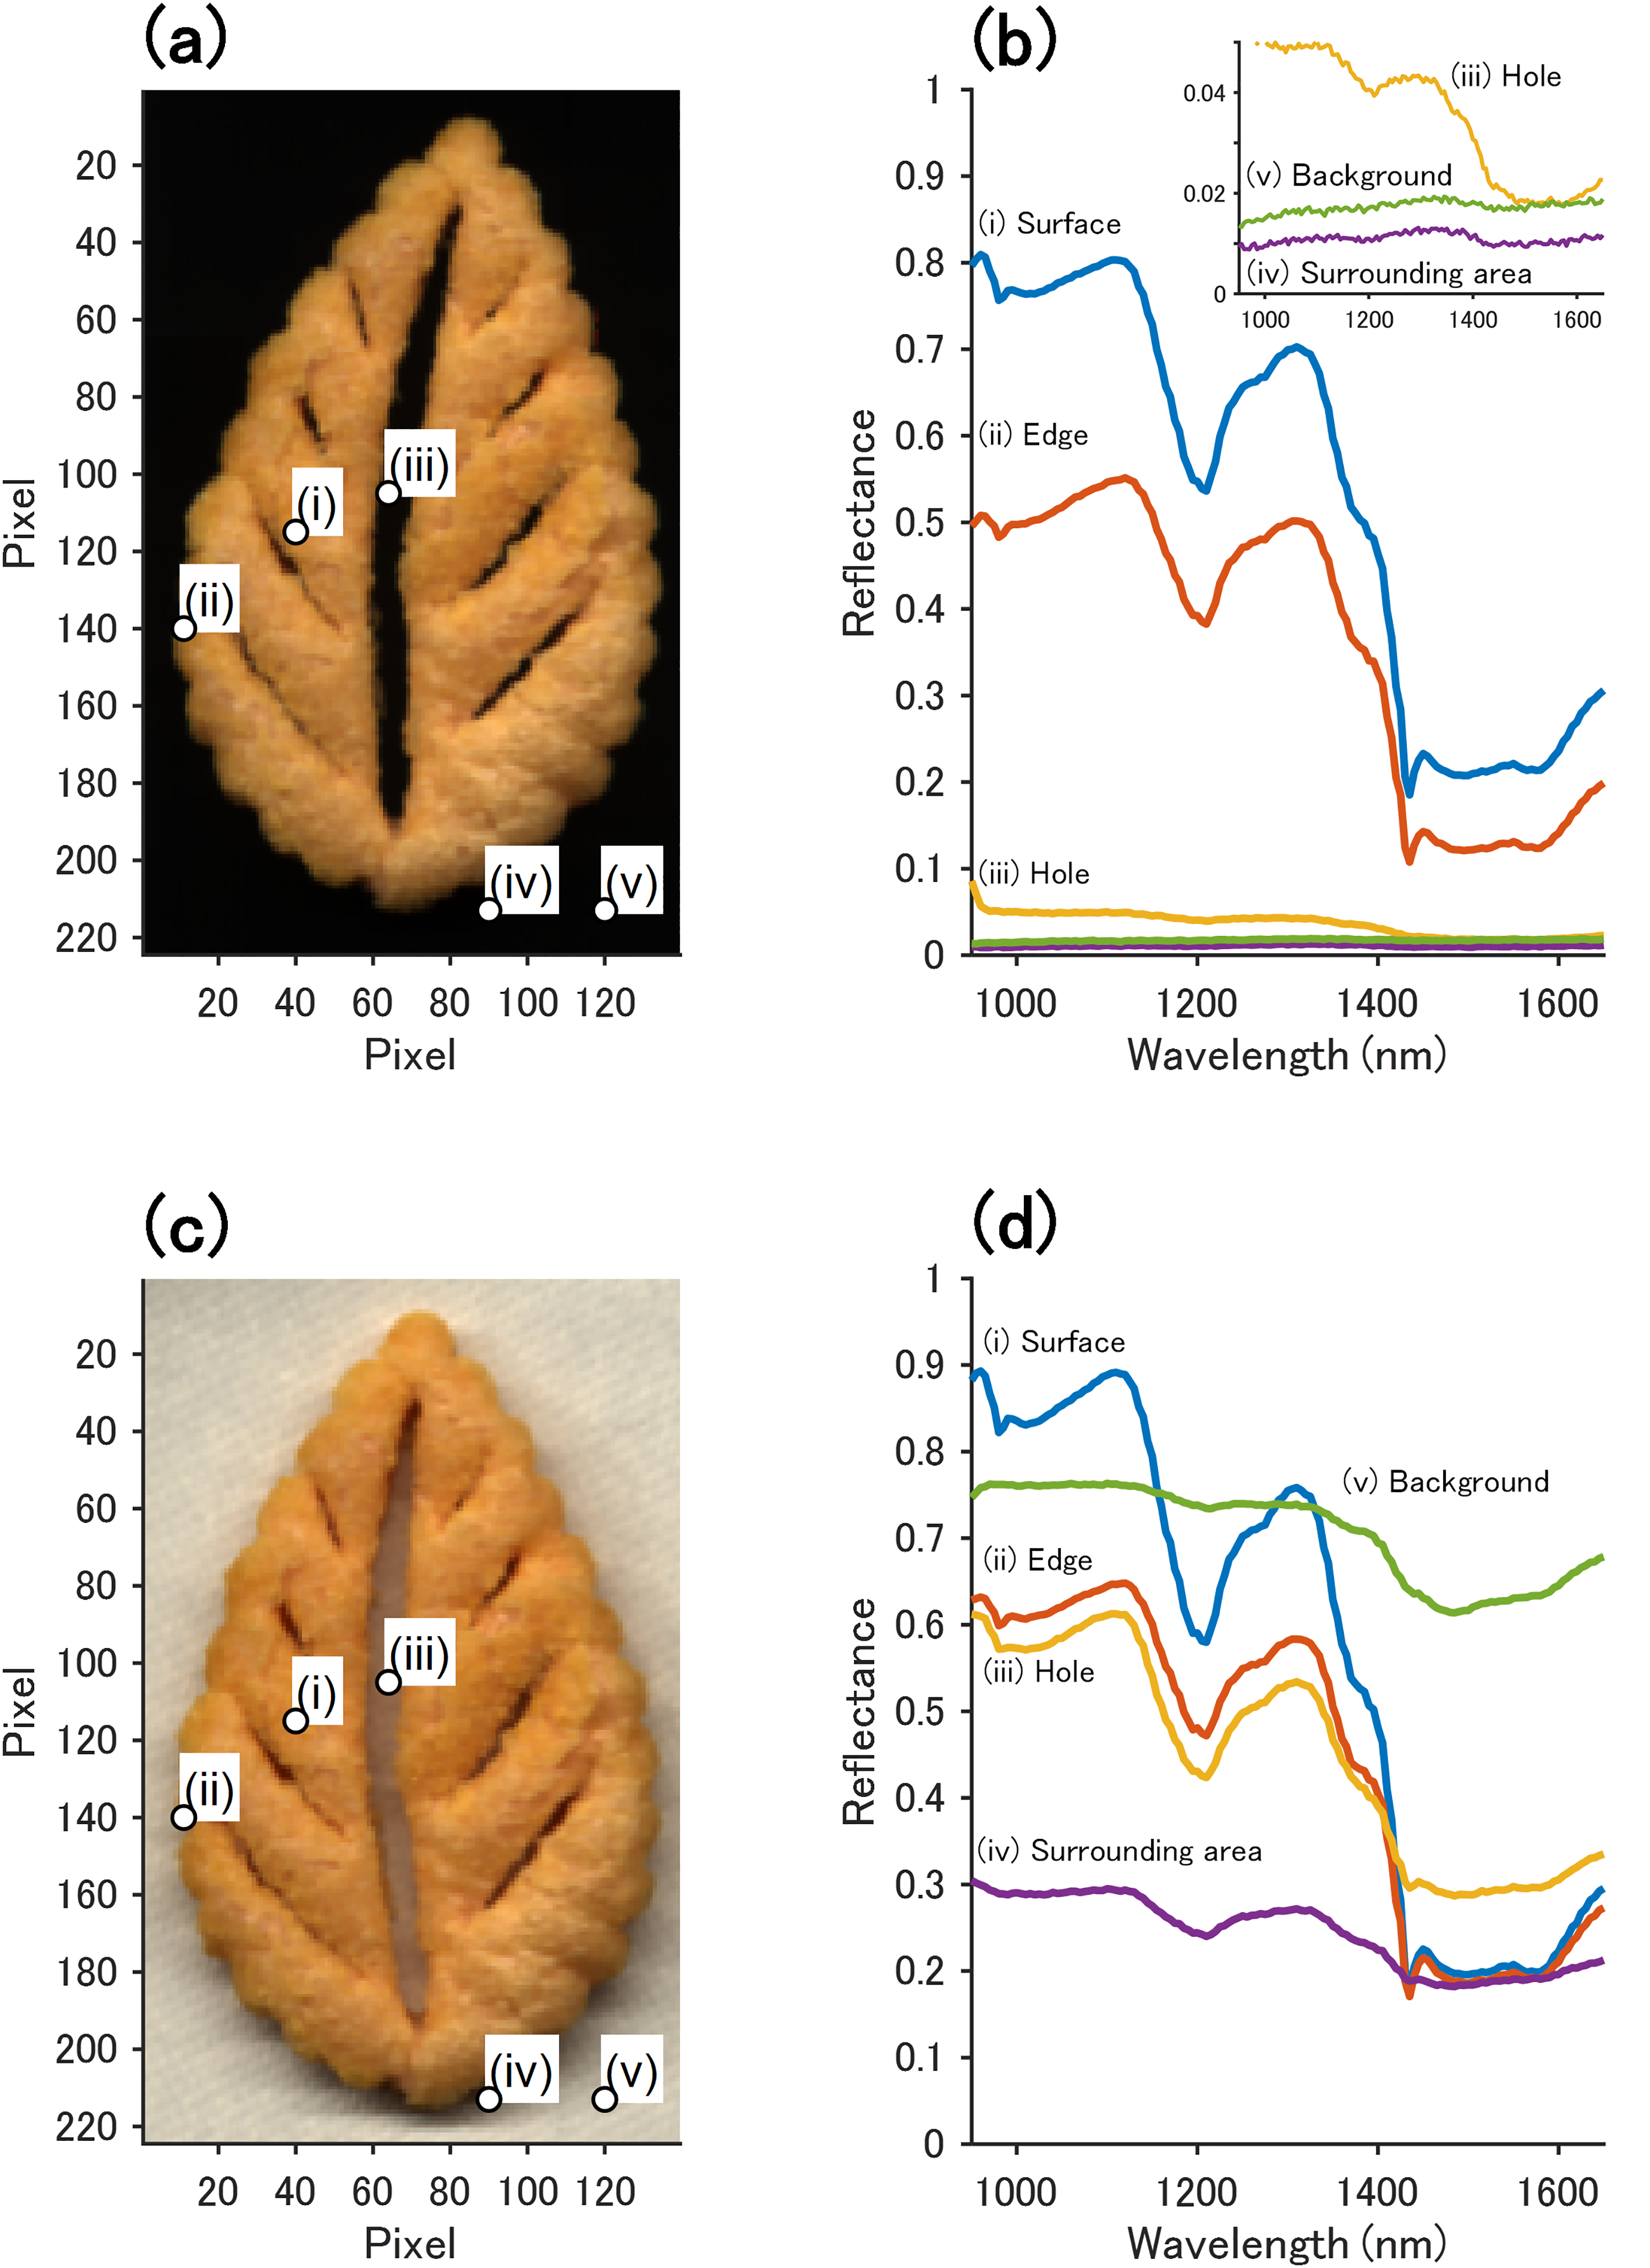
NIR images and spectra of the pastry placed on the (a and b) low-reflectance sheet and (c and d) white paper. Pixels for the spectra are selected from (i) surface, (ii) edge, (iii) hole, (iv) surrounding area of the pastry, and (v) background materials.
Initially, the NIR hyperspectral image (spectral hypercube) was unfolded into 31 136 spectra (224 × 139 pixels), and the SD was calculated from 141 reflectance values for each spectrum without any spectral pre-treatment. Subsequently, a histogram was constructed for the 31 136 px-wise SD values using the square-root method, which is a simple and commonly used rule for determining the number of bins in a histogram. Furthermore, the threshold value was determined using the Otsu method, which minimized or equivalently maximized the within or between-class variances, respectively. 40 Finally, the reflectance values of the pixels were replaced with NaN when the px-wise SD value was lower than the determined threshold. After background pixel removal, the removed pixels in the NIR image of the object pixels were observed in dark cyan (no. 008B8B). Conversely, in the NIR image of the background pixels, the object pixels were removed and colored in dark cyan.
For comparison of the spectral features, NIR spectra were collected from various locations, namely (a) the pastry surface, (b) the pastry edge, (c) the hole in the pastry, (d) the surrounding area of the pastry, and (e) the background materials, as shown in Figures 2a and 2c. The pixel coordinates of the considered locations were (115, 40), (140, 11), (105, 64), (213, 93), and (213, 120) for the above locations, respectively.
Results and Discussion
Near-Infrared Images and Spectra of the Leaf Pastry Placed on Different Materials
The obtained NIR images and spectra were verified prior to background removal. The NIR images and spectra of the pastry placed on the low-reflectance sheet and the white paper are shown in Figures 2a and 2b and Figures 2c and 2d, respectively.
When the low-reflectance sheet was used as the background material, the NIR image (Figure 2a) showed a strong contrast between the brown pastry and the black background. This contrast allowed a clear view of the leaf-like contours and the hole in the middle of the pastry, representing the midrib. In the NIR spectrum of the pastry surface, spectrum (i) in Figure 2b, the reflectance ranged from approximately 0.2 to 0.8, with the valleys close to 1200 and 1400–1600 nm being attributable to the CH and OH groups, respectively. The steep depression at 1435 nm indicated that the granulated sugar sprinkled onto the pastry surface was sucrose. The spectrum of the pastry edge, spectrum (ii) in Figure 2b, was characterized by an overall decrease in reflectance compared to that of the pastry surface, with valleys close to 1200 and 1400–1600 nm.
The spectra recorded for the hole in the pastry, the surrounding area of the pastry, and the low-reflectance sheet exhibited significantly low reflectance values (i.e., < 0.1) across all wavelength regions, as shown in the expanded view in Figure 2b. In the NIR image shown in Figure 2a, the pixels at the aforementioned locations appeared uniformly black, suggesting that the NIR spectra of the hole and the surrounding area were the same as those of the low-reflectance sheet. However, the spectrum of the hole, spectrum (iii) in Figure 2b, exhibited a higher reflectance than that of the low-reflectance sheet in the 950–1400 nm region. Additionally, the spectrum of the surrounding area, spectrum (iv) in Figure 2b, exhibited a slightly lower reflectance than that of the low-reflectance sheet, spectrum (v) in Figure 2b, across all wavelength regions.
When white paper was used as the background material, the NIR image (Figure 2c) showed shadows in the region of the hole and the surrounding area of the pastry, along with the regions corresponding to the brown-colored pastry and the white paper. The spectral features of the surface and the edge, spectra (i) and (ii) in Figure 2d, of the pastry placed on the white paper were similar to those of the pastry placed on the low-reflectance sheet, spectra (i) and (ii) in Figure 2b. In the spectrum of the white paper, spectrum (v) in Figure 2d, the reflectance ranged from ∼0.6 to 0.8, with the valley close to 1400–1600 nm being attributed to the OH groups. Compared to that in the pastry surface spectrum, the range of reflectance of the white paper was narrower, with an overall higher reflectance. Additionally, the dip close to 1200 nm corresponding to the CH groups was subtle. Notably, the spectra of the hole and the surrounding area were more similar to that of the pastry surface than to that of the white paper. The obtained spectra exhibited a valley close to 1200 nm, which represented a characteristic spectral feature of the pastry surface. Furthermore, an overall decrease in reflectance compared to that from the spectrum of the white paper was observed.
Reflectance, Mean, and SD of Reflectance in Each Spectrum
The mean reflectance represents the representative position of a spectrum along the vertical axis, whereas the SD of reflectance indicates the spread of a spectrum along the vertical axis. The mean reflectances of spectra (i–v) shown in Figure 2b are illustrated in Figure 3a. When the low-reflectance sheet was used as the background material, the highest mean reflectance was observed in spectrum (i), followed by spectrum (ii), which represented the overall decrease in reflectance of the pastry-edge spectrum, as shown in Figure 2b. Spectra (iii–v) demonstrated significantly lower mean reflectances than spectra (i) and (ii).
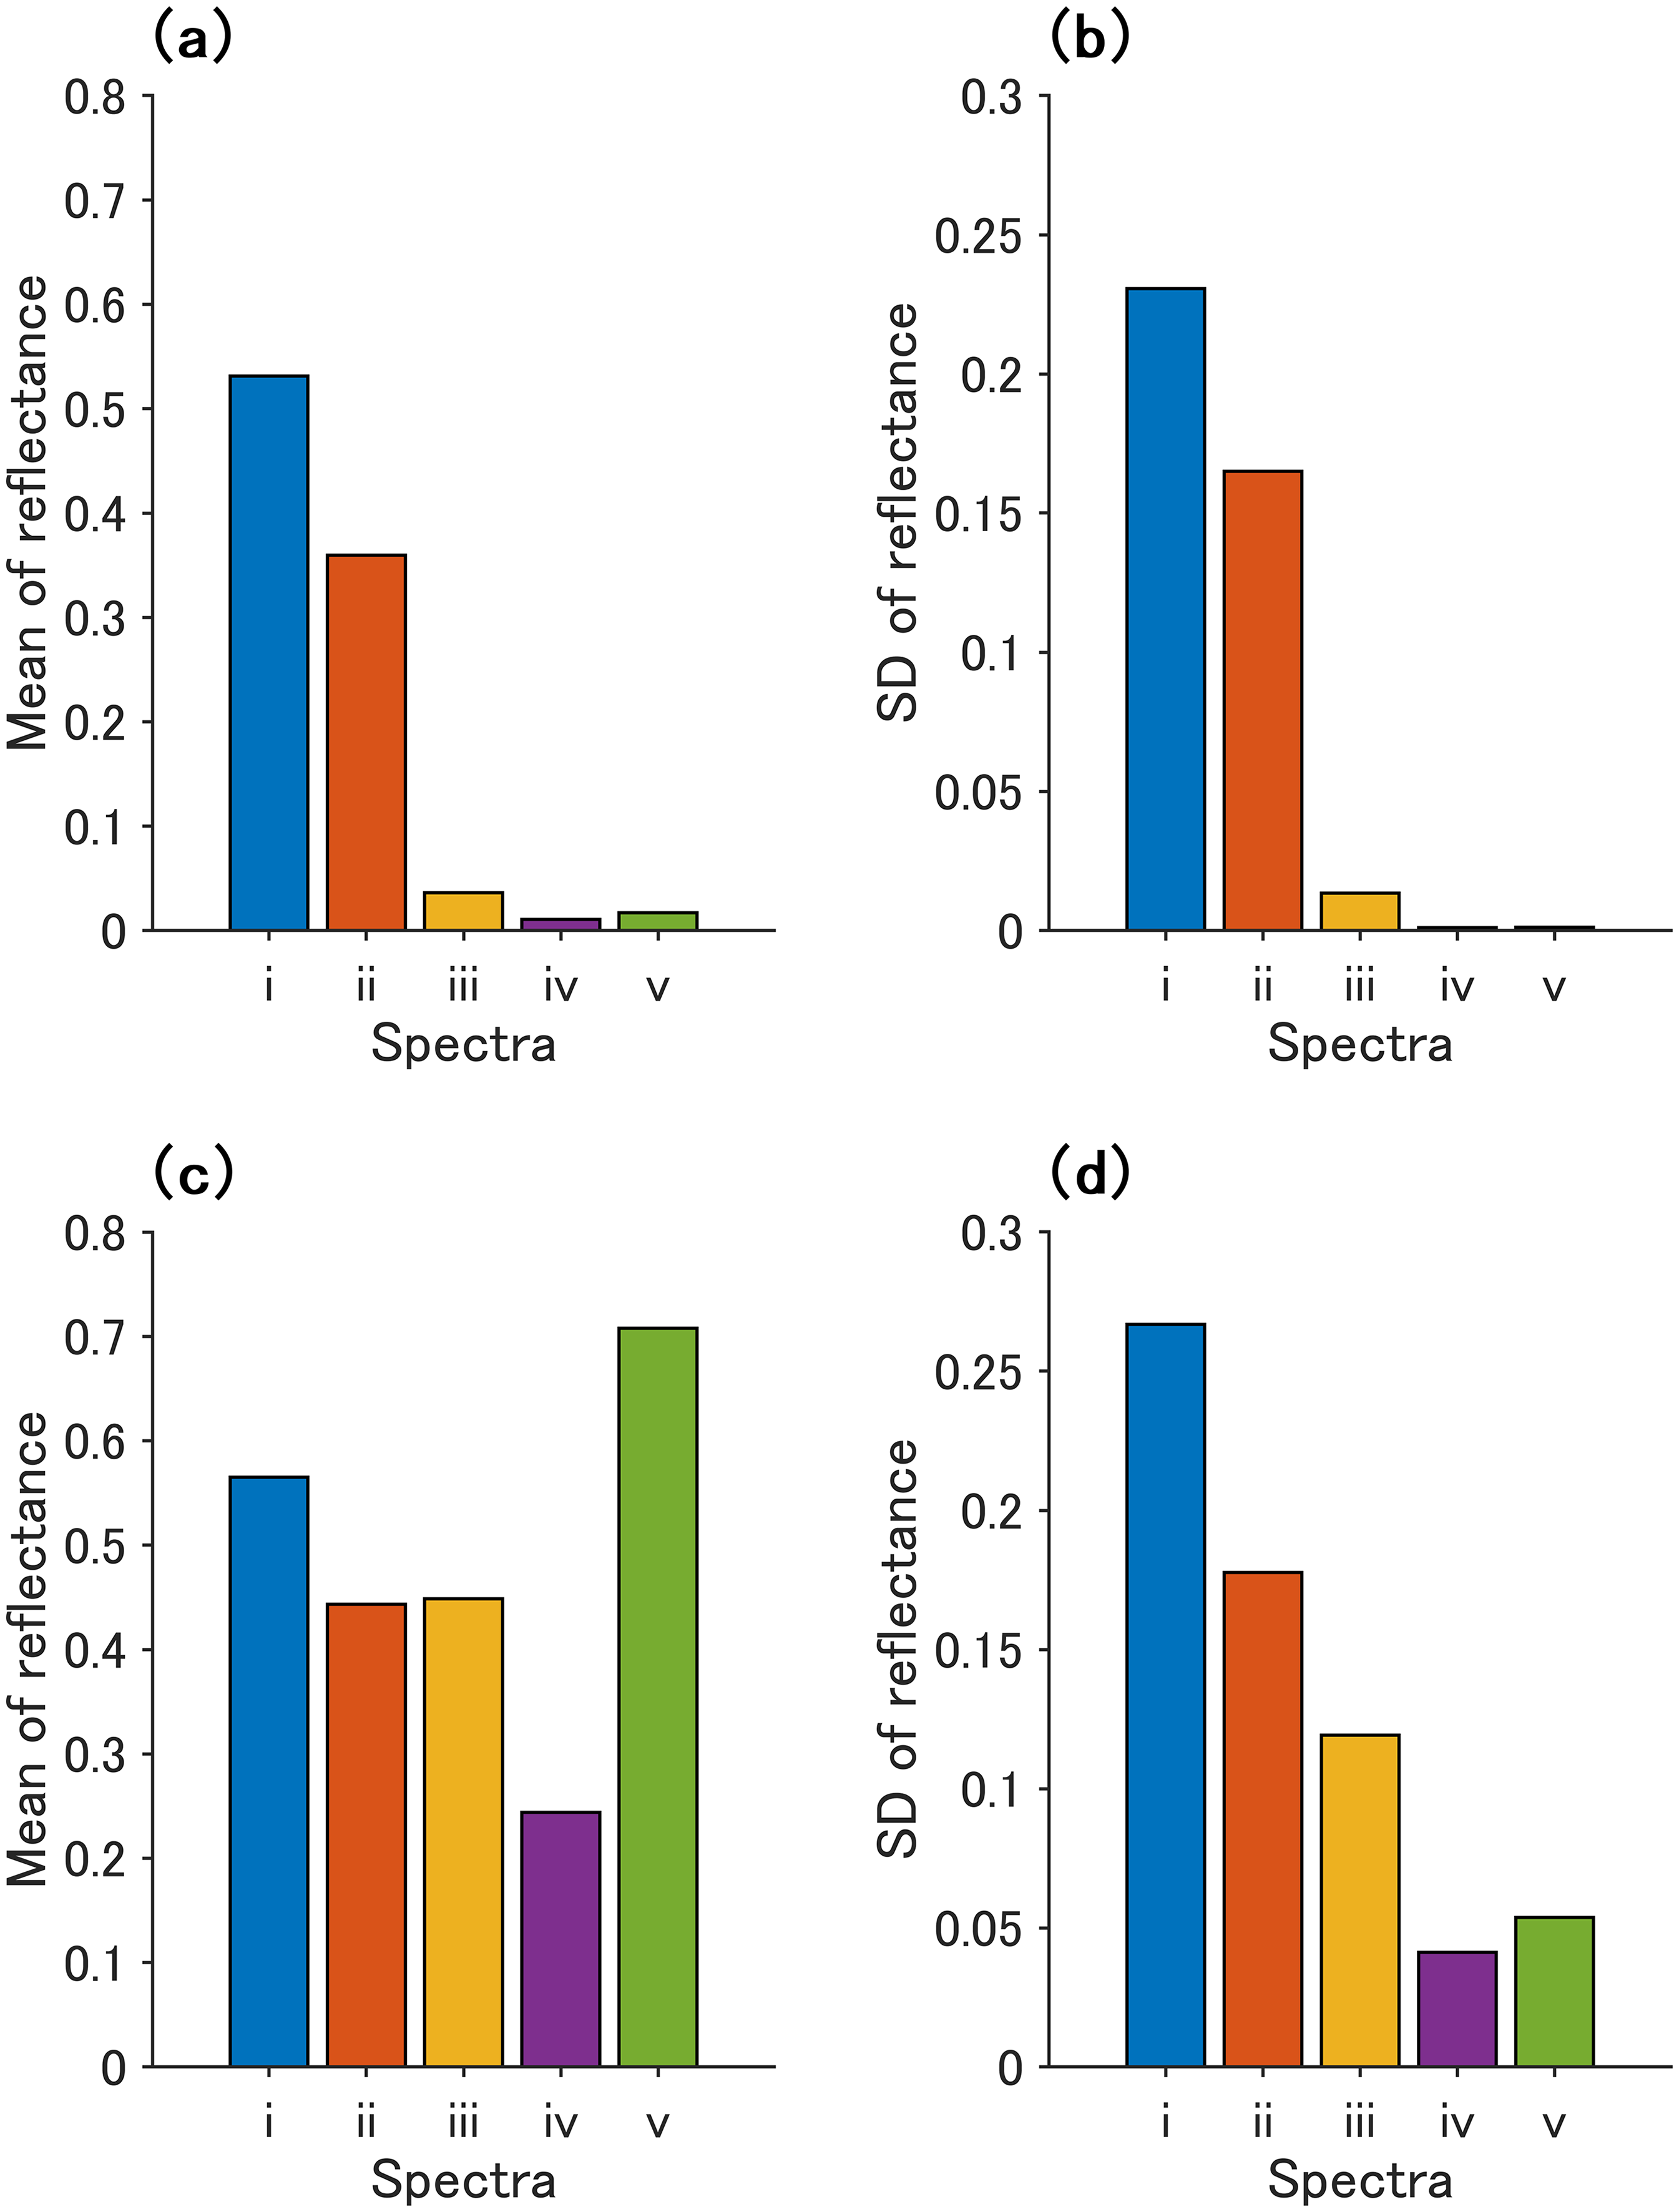
Mean and SD of reflectance of spectrum in each pixel of the pastry placed on the (a–b) low-reflectance sheet and (c–d) white paper. Pixels for the spectra are selected from the (i) pastry surface, (ii) edge, (iii) hole, (iv) surrounding area of the pastry, and (v) background materials (Figures 2a and 2b).
As shown in Figure 3b, the SDs of the spectral reflectances demonstrated a pattern similar to the mean reflectance. More specifically, the highest SD was obtained for spectrum (i), followed by spectrum (ii), and with significant decreases for spectra (iii–v). Therefore, both the mean and SD of reflectance were expected to provide effective thresholds for distinguishing spectral groups (i–ii) from spectral groups (iii–v), corresponding to the object and background pixels, respectively.
When white paper was used as the background material, the highest mean reflectance was observed for spectrum (v), followed by spectrum (i), as shown in Figure 3c. Additionally, the corresponding reflectance values of spectra (ii) and (iii) were comparable, while spectrum (iv) exhibited the lowest value. Based on the mean reflectance, the obtained results suggested that establishing a threshold for distinguishing spectral groups (i–ii) from spectral groups (iii–v) was not possible.
In contrast, the highest SD of reflectance shown in Figure 3d was observed for spectrum (i), followed by spectrum (ii), and then spectrum (iii). Additionally, the SDs of reflectance in spectra (iv) and (v) were almost half of that in spectrum (iii). Although the gap between spectral groups (i–ii) and (iii–v) was narrower, the SDs of reflectance showed a pattern similar to that observed for the pastry placed on the low-reflectance sheet (Figure 3b). Based on this similarity, the px-wise SD method was established.
Histogram of the Mean and SD of Reflectance and Background Pixel Removal
When the low-reflectance sheet was used as the background material, the background and object pixels were accurately identified, as expected. Detailed results are shown in Figures S1 and S2 (Supplemental Material).
A histogram of the px-wise mean reflectance for the pastry on the white paper sheet is shown in Figure 4a. This histogram displays a bimodal distribution, with broad peaks between 0.4 and 0.65, and a sharp peak at ∼0.75. According to Figure 3c, the former corresponds to the pixels of the pastry surface, the pastry edge, the hole, and the surrounding area, whereas the latter corresponds to those of the white paper. The threshold determined using the Otsu method was 0.589; however, this value was lower for the former peak. Therefore, the threshold was set to 0.670, as indicated by the broken line in Figure 4a, which served as the midpoint between the two peaks.
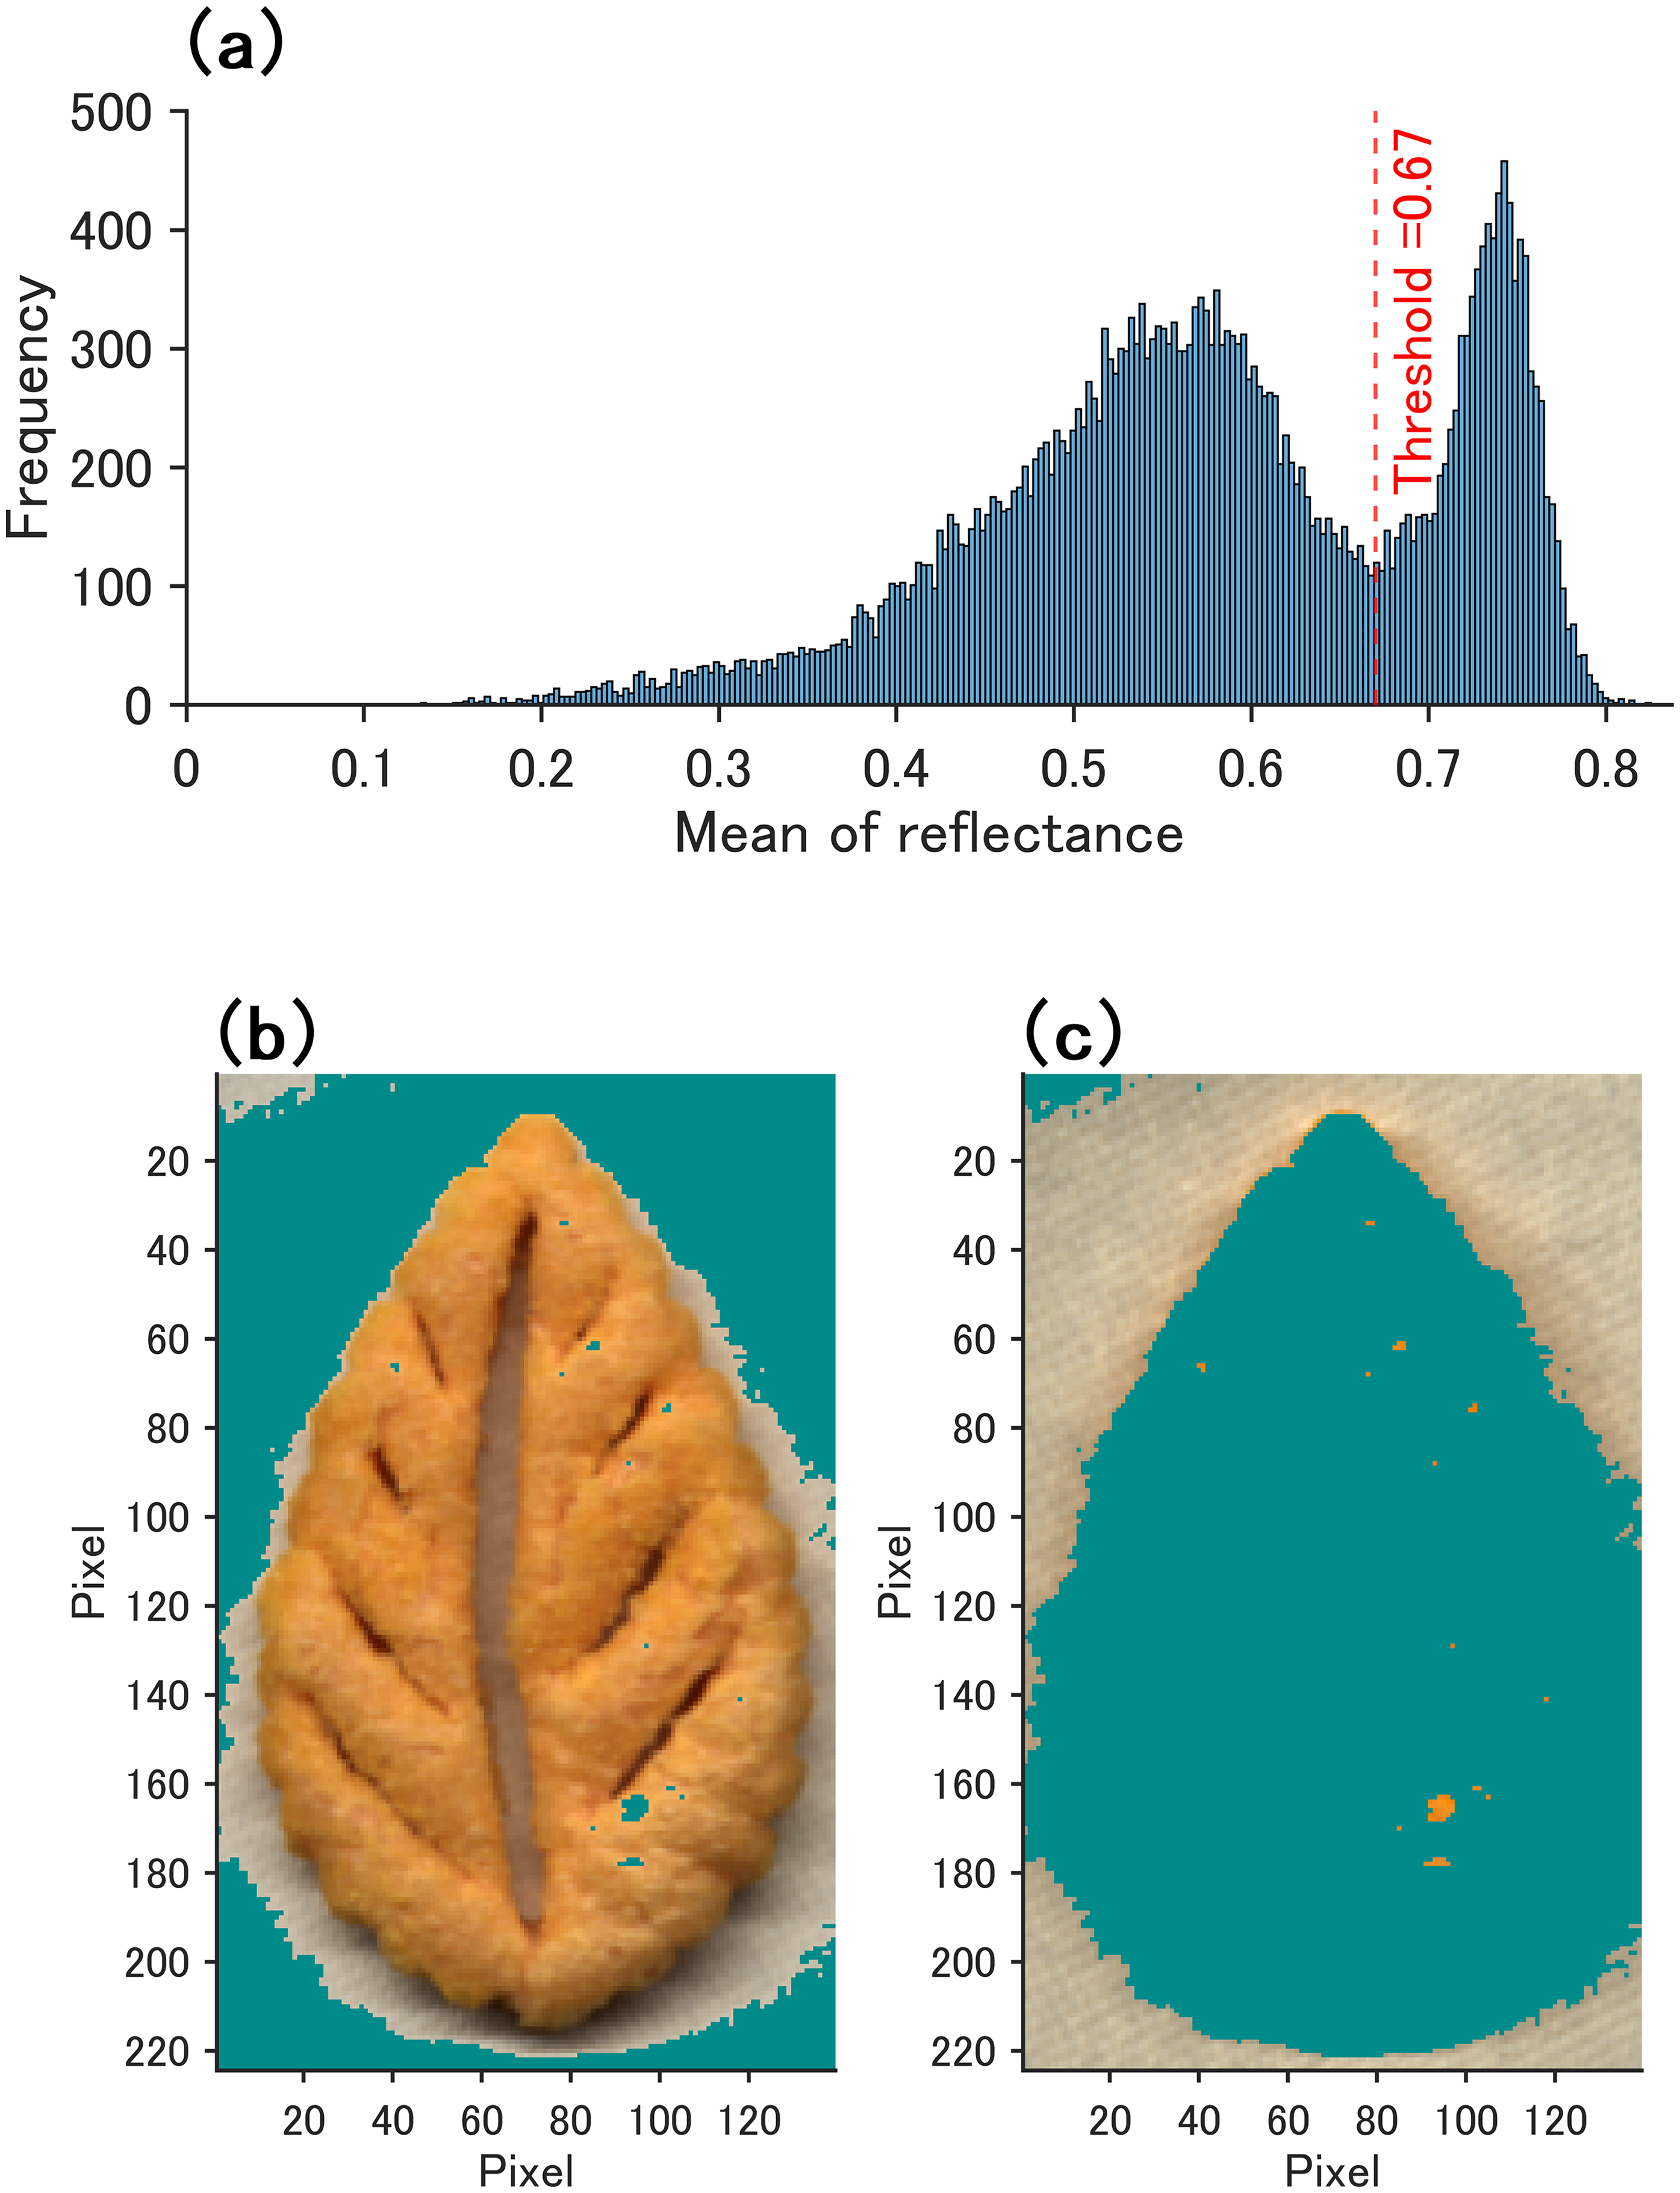
(a) Histogram of the pixel-wise mean reflectance. Discernment of (b) background and (c) object pixels from the NIR image of the pastry placed on white paper. The red dashed line indicates the threshold, while the pixels removed in each image are colored in dark cyan.
Despite this adjustment, background pixel removal was unsuccessful, as shown in Figures 4b and 4c. Apart from the white paper pixels, all other pixels were included in the NIR image of the background pixels (Figure 4b). From the comparison of the mean reflectance shown in Figure 3c, determining a suitable threshold for distinguishing between the background and object pixels based on the px-wise mean reflectance was challenging, as suggested in the Mean and SD of Reflectance in Each Spectrum section. Notably, when the reflectance at a specific wavelength was considered, the threshold determined by the Otsu method could not distinguish between the background and object pixels at any wavelength for the pastry on the white paper sheet.
A histogram of the px-wise SD of reflectance of the pastry on the white paper is shown in Figure 5a. In this case, the histogram of the px-wise SD values showed a trimodal distribution, with sharp peaks close to 0.05 and 0.12, and a broad peak between 0.2 and 0.25. According to Figure 3d, the peak at 0.05 corresponded to the pixels of the white paper and the surrounding area, while that at 0.12 corresponded to the pixels of the hole. The broad peak between 0.2 and 0.25 corresponded to the pixels of the pastry surface and the edge. The threshold determined using the Otsu method was 0.141, which is located between the small peak and the broad peak for the pastry pixels, as indicated by the broken line in Figure 5a.
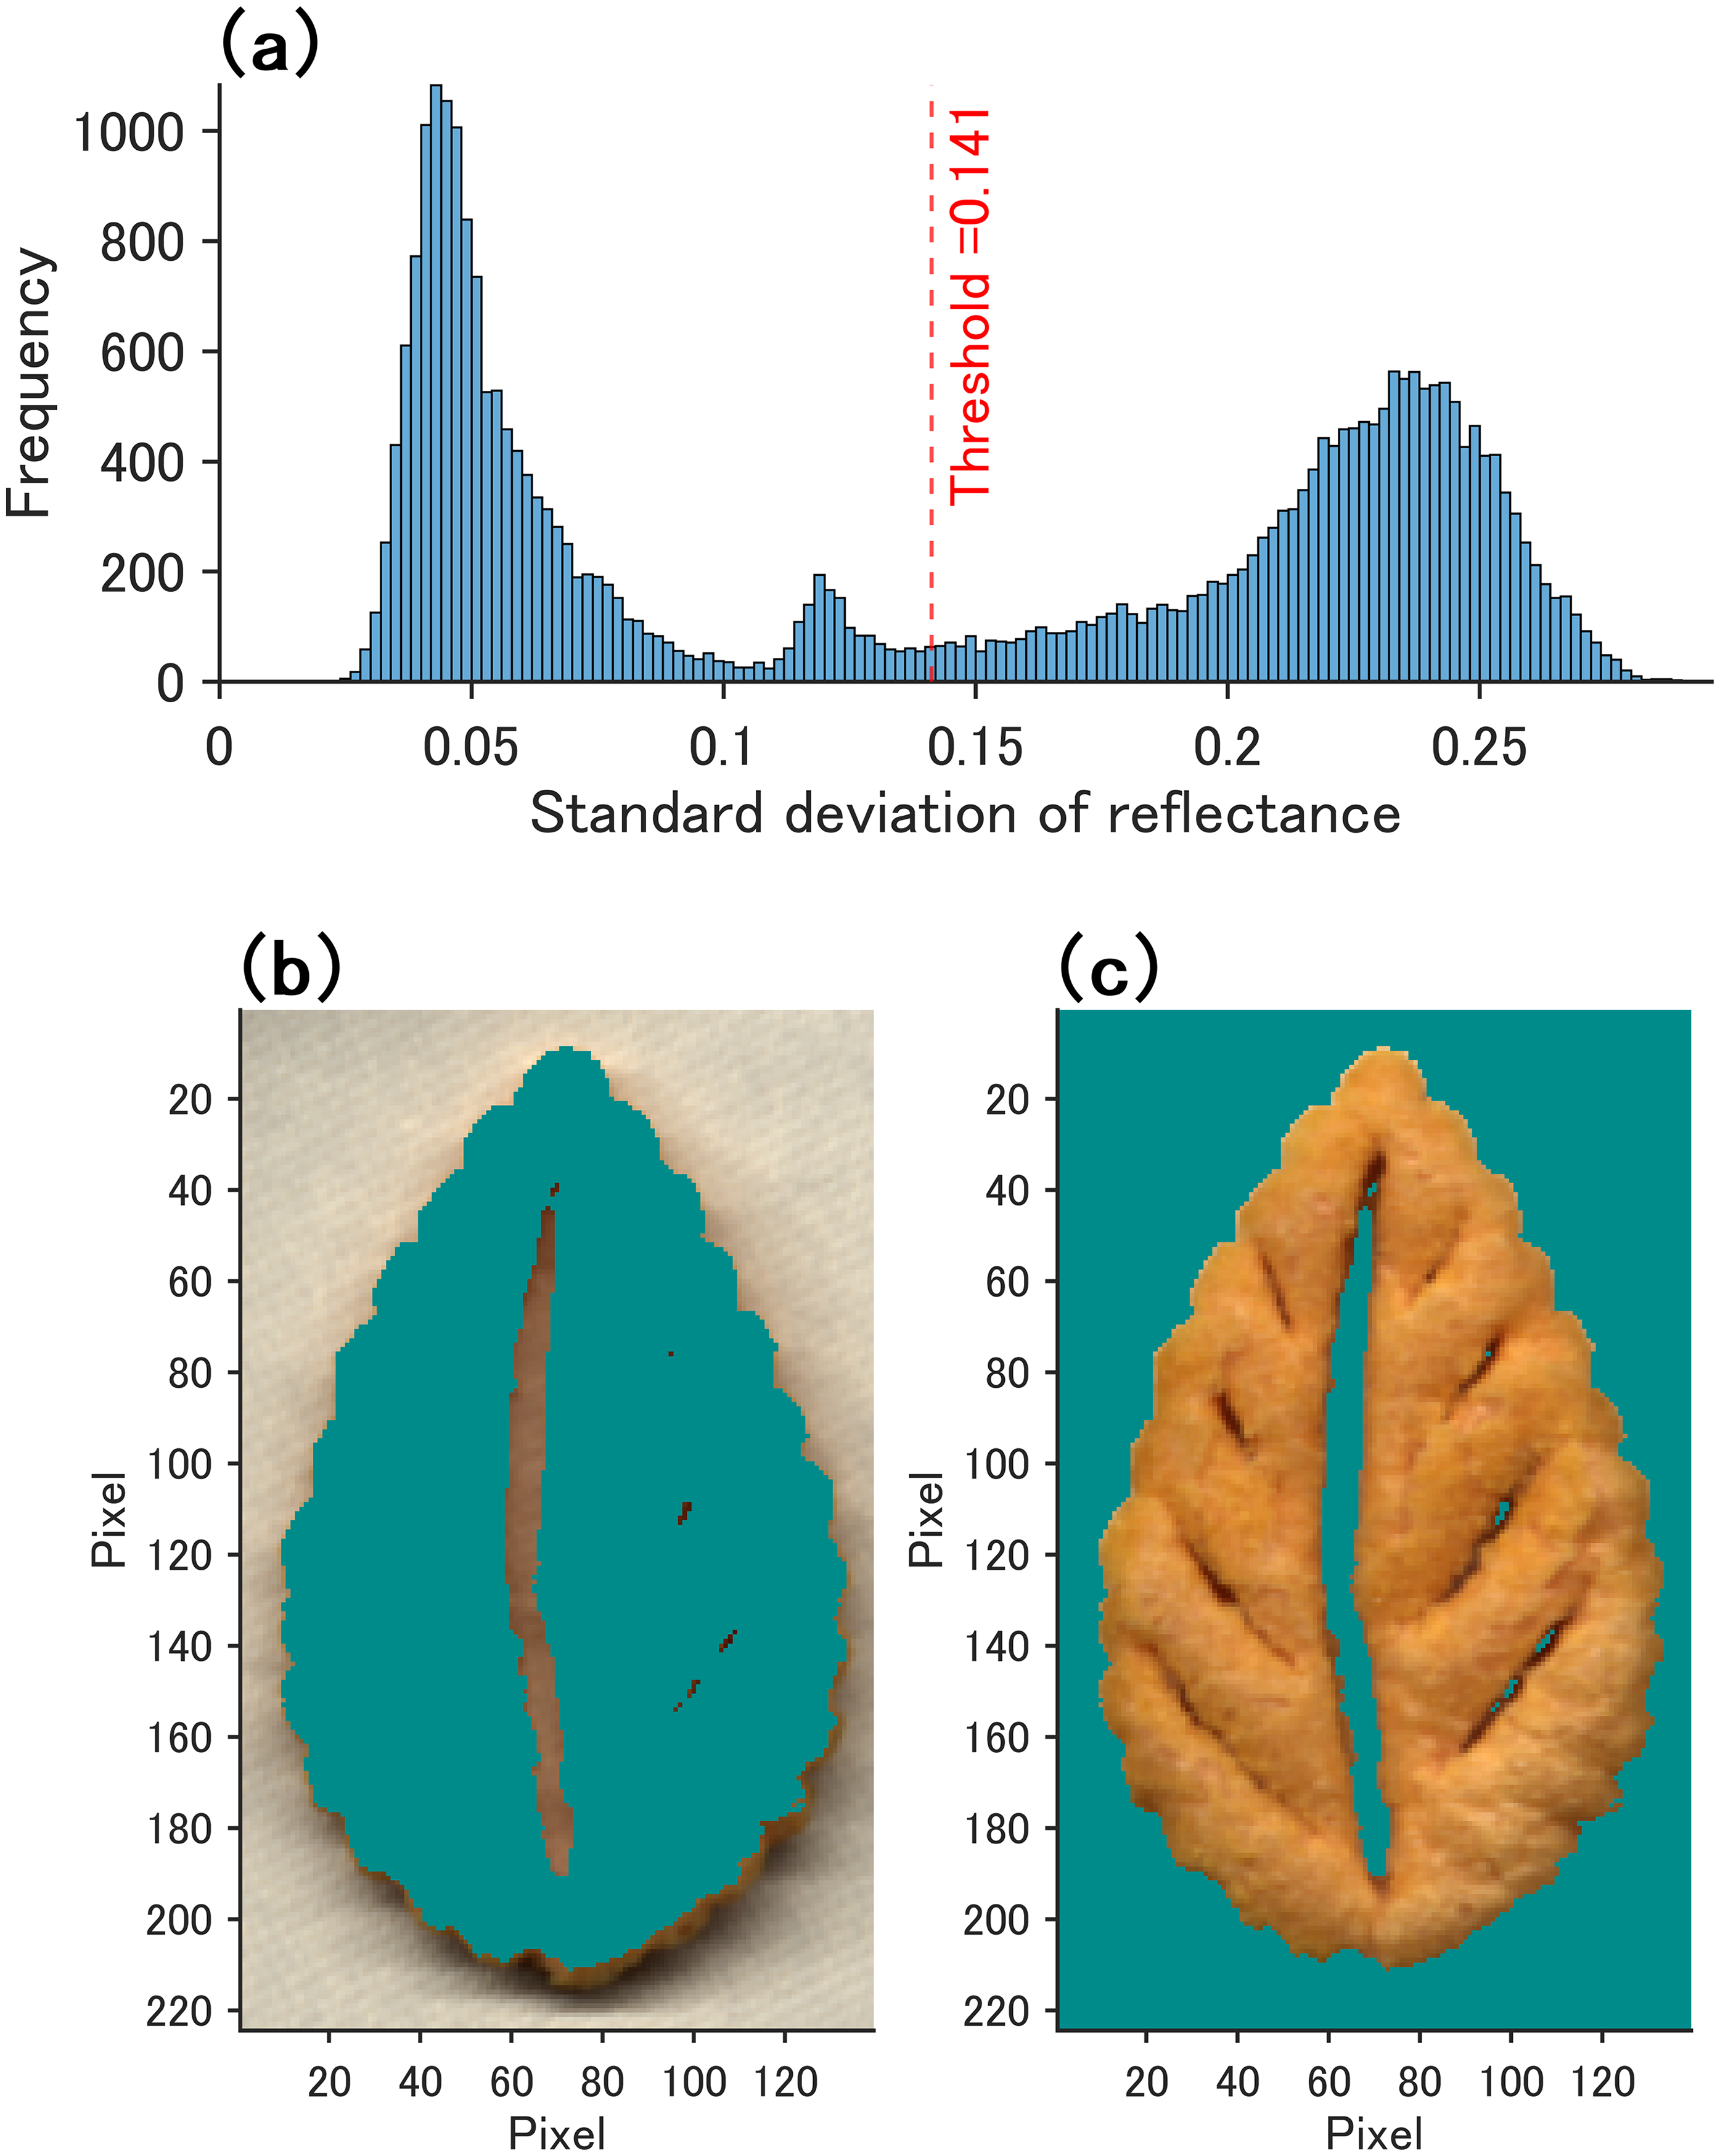
(a) Histogram of the pixel-wise SD of reflectance. Discernment of (b) background and (c) object pixels from the NIR image of the pastry placed on white paper. The red dashed line indicates the threshold, while the pixels removed in each image are colored in dark cyan.
The NIR images of the background and object pixels obtained using the determined threshold are shown in Figures 5b and 5c. Similar to the results obtained for the pastry on the low-reflectance sheet (Figures S1 and S2, Supplemental Material), the background and object pixels were successfully distinguished. Pixels corresponding to the white paper, the hole, and the surrounding area were selected for the NIR image of the background pixels, whereas those of the pastry surface and the edge were identified for the NIR image of the object pixels. The obtained results confirmed that the px-wise SD method accurately extracted specific geometric information, such as the contours and the hole in the pastry placed on the white paper sheet. Therefore, the px-wise SD method was confirmed to be highly effective in removing background pixels from NIR hyperspectral images, even when an unsuitable material was used as the background.
Effects of Background Pixel Removal on the Mean Spectrum
Principal component analysis and PLS-DA commonly use a mean spectrum for centering treatment through a process known as “mean-centering”. Calculation of the mean spectrum involves summing the spectral intensities (including the reflectance or absorbance) for each wavelength and dividing them by the number of spectra (or pixels in the case of hyperspectral data). The sum of the spectral intensity and number of spectra vary depending on whether the background pixels are removed, thereby resulting in different mean spectra.
The mean spectra calculated using all pixels, only background pixels, and only object pixels are shown in Figure 6. The background and object pixels were distinguished using the px-wise SD method, referring to the results shown in Figures 5 and S2 (Supplemental Material). The mean spectrum of the object pixels remained consistent regardless of the type of background material used. However, the mean spectra calculated from all pixels represented intermediate spectra between the mean spectra calculated using only the background and only the object pixels, even when using the low-reflectance sheet. These results indicate that background pixel removal was crucial for accurately calculating the mean spectrum in all cases, including when the low-reflectance sheet was used.
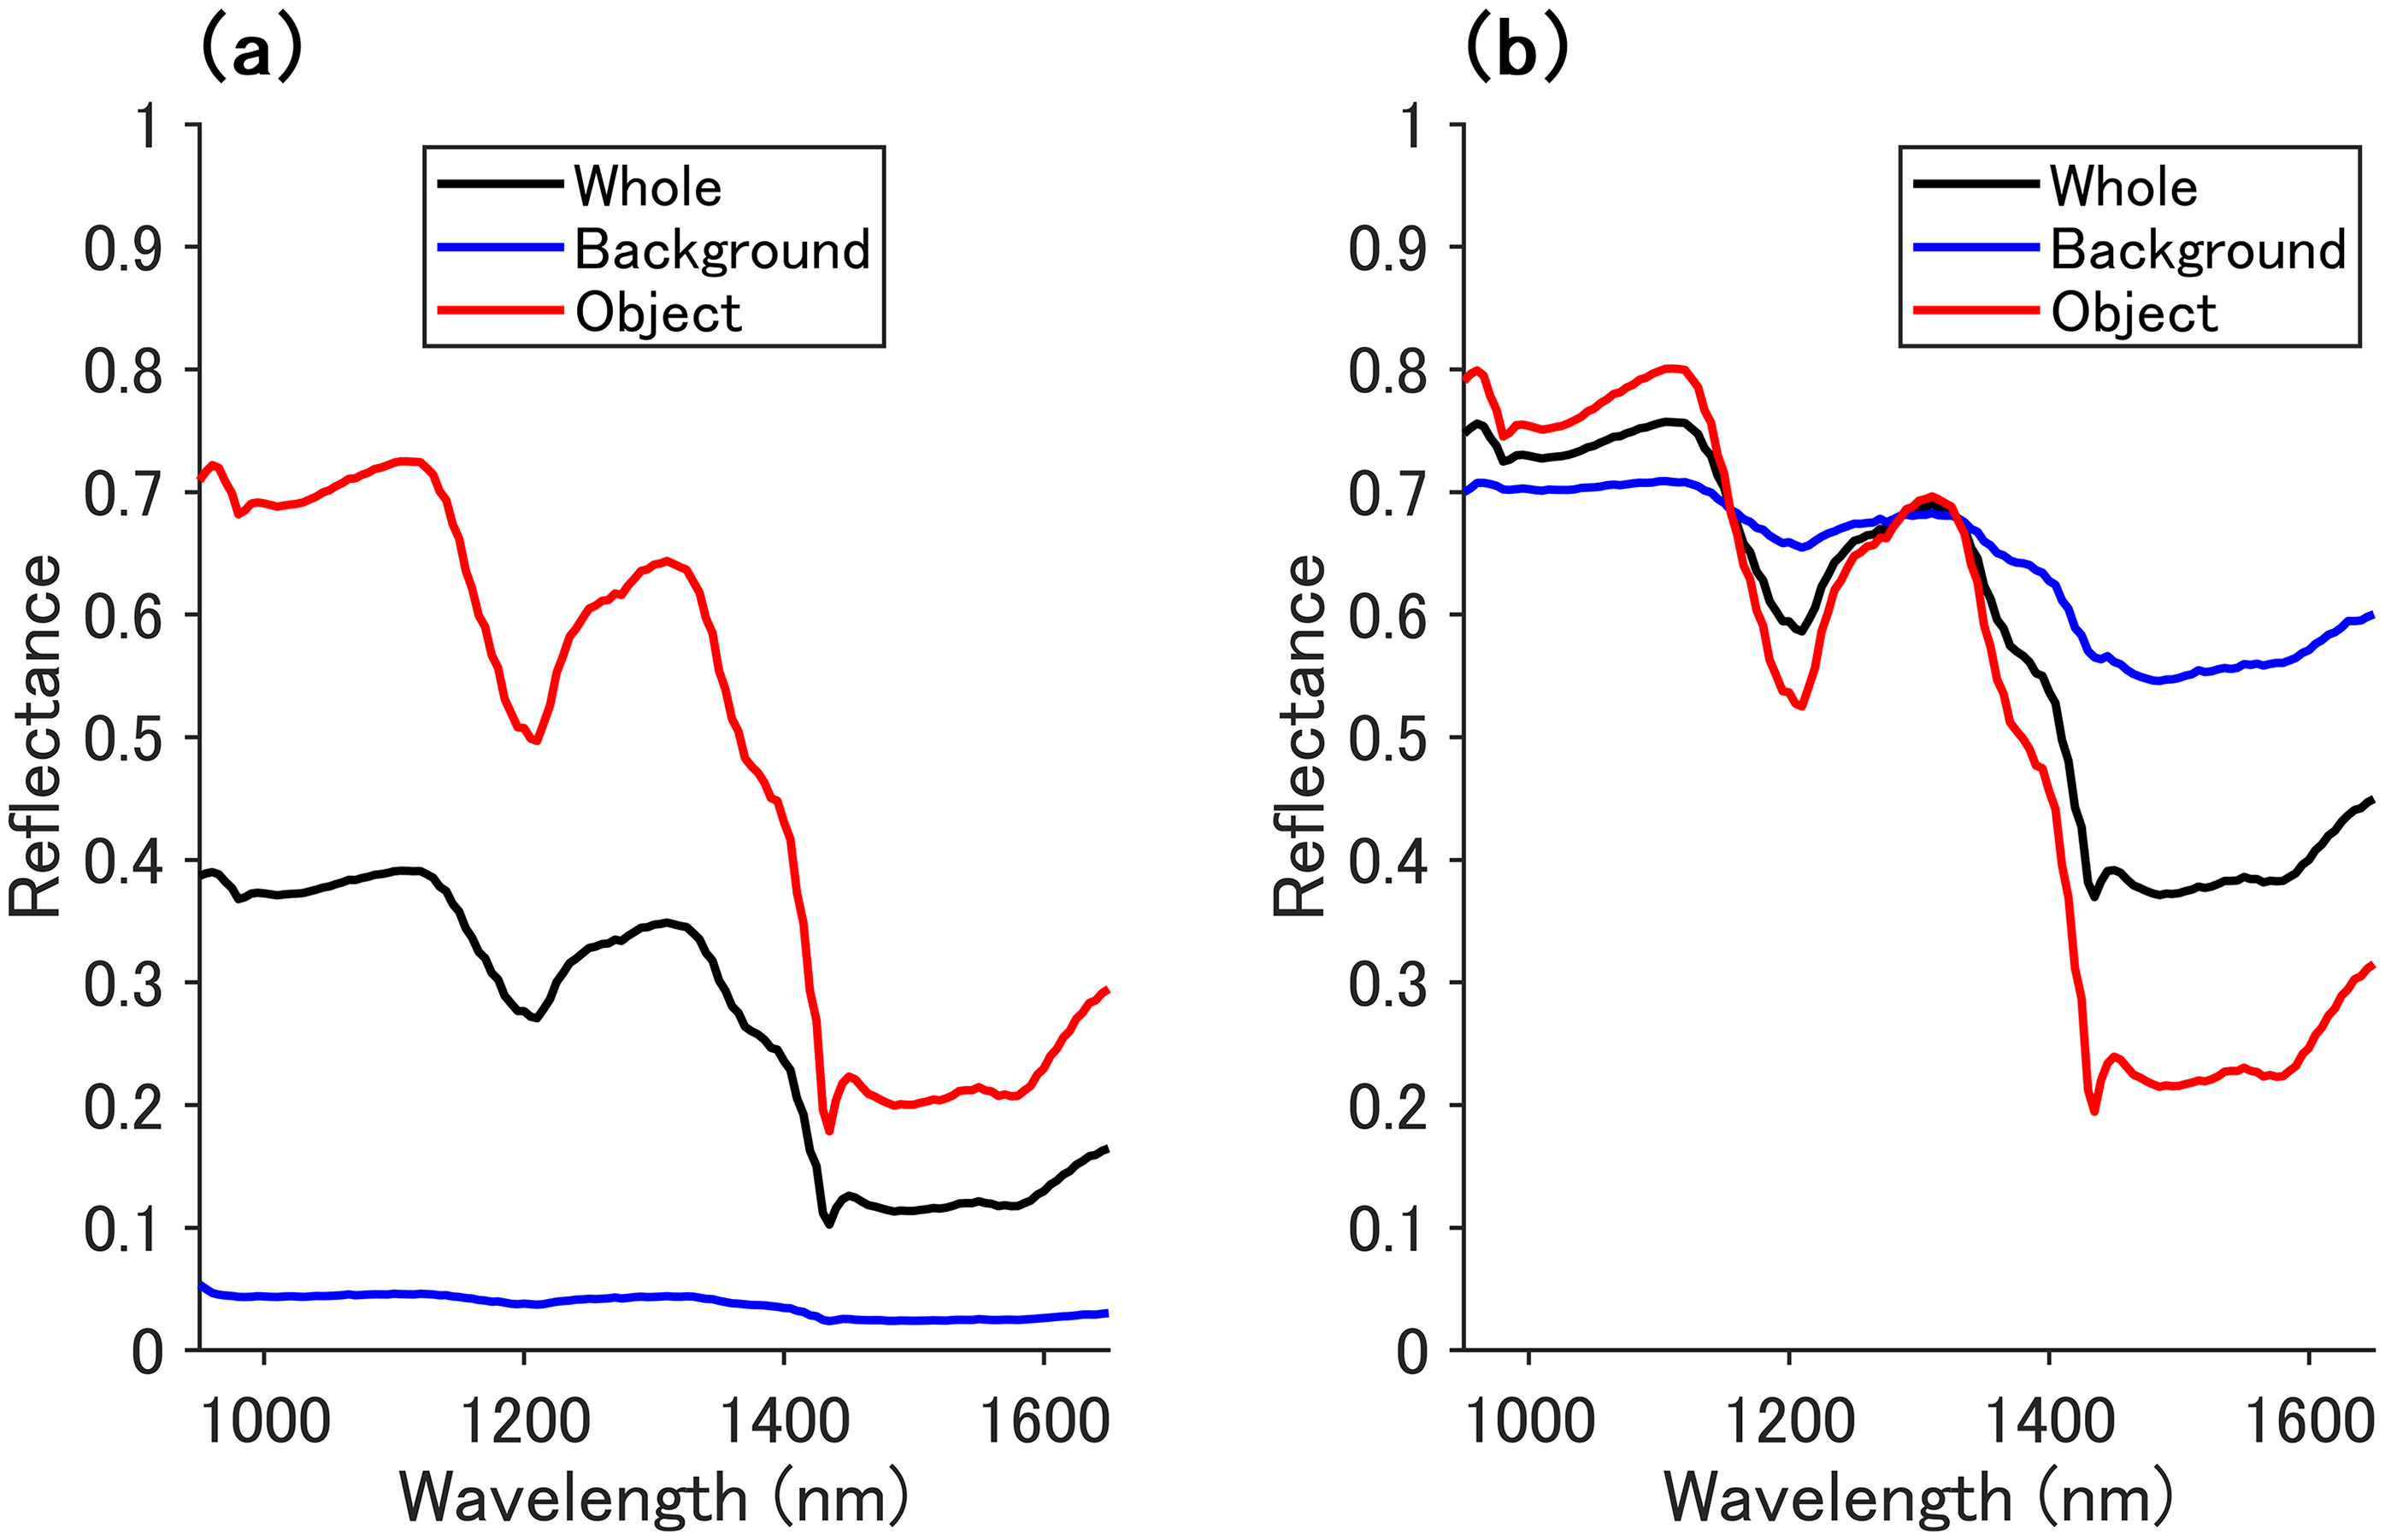
Mean spectra calculated using all pixels, only background pixels, and only object pixels for the pastry placed on the (a) low-reflectance sheet and (b) white paper.
Comparison to the PCA-Based Method
A plot of the PC1 and PC2 scores, calculated from 31 136 spectra (Data Analysis section), is presented in Figure 7. To improve the readability, the data on the plot were displayed by thinning every 10 points. Additionally, the points were colored to distinguish between the background (blue) and object (red) pixels, referring to the results shown in Figures 5 and S2 (Supplemental Material). According to the results for the pastry placed on the low-reflectance sheet (Figure 7a), the PC scores were mainly spread along the PC1 axis with a contribution rate of 99.5%. The PC1 scores corresponding to the background pixels clustered close to −3, while those corresponding to the object pixels were mostly located between 2 and 4. Therefore, the threshold between the two clusters was easily determined; for example, the position where the PC1 score is equal to zero could be selected as the threshold.
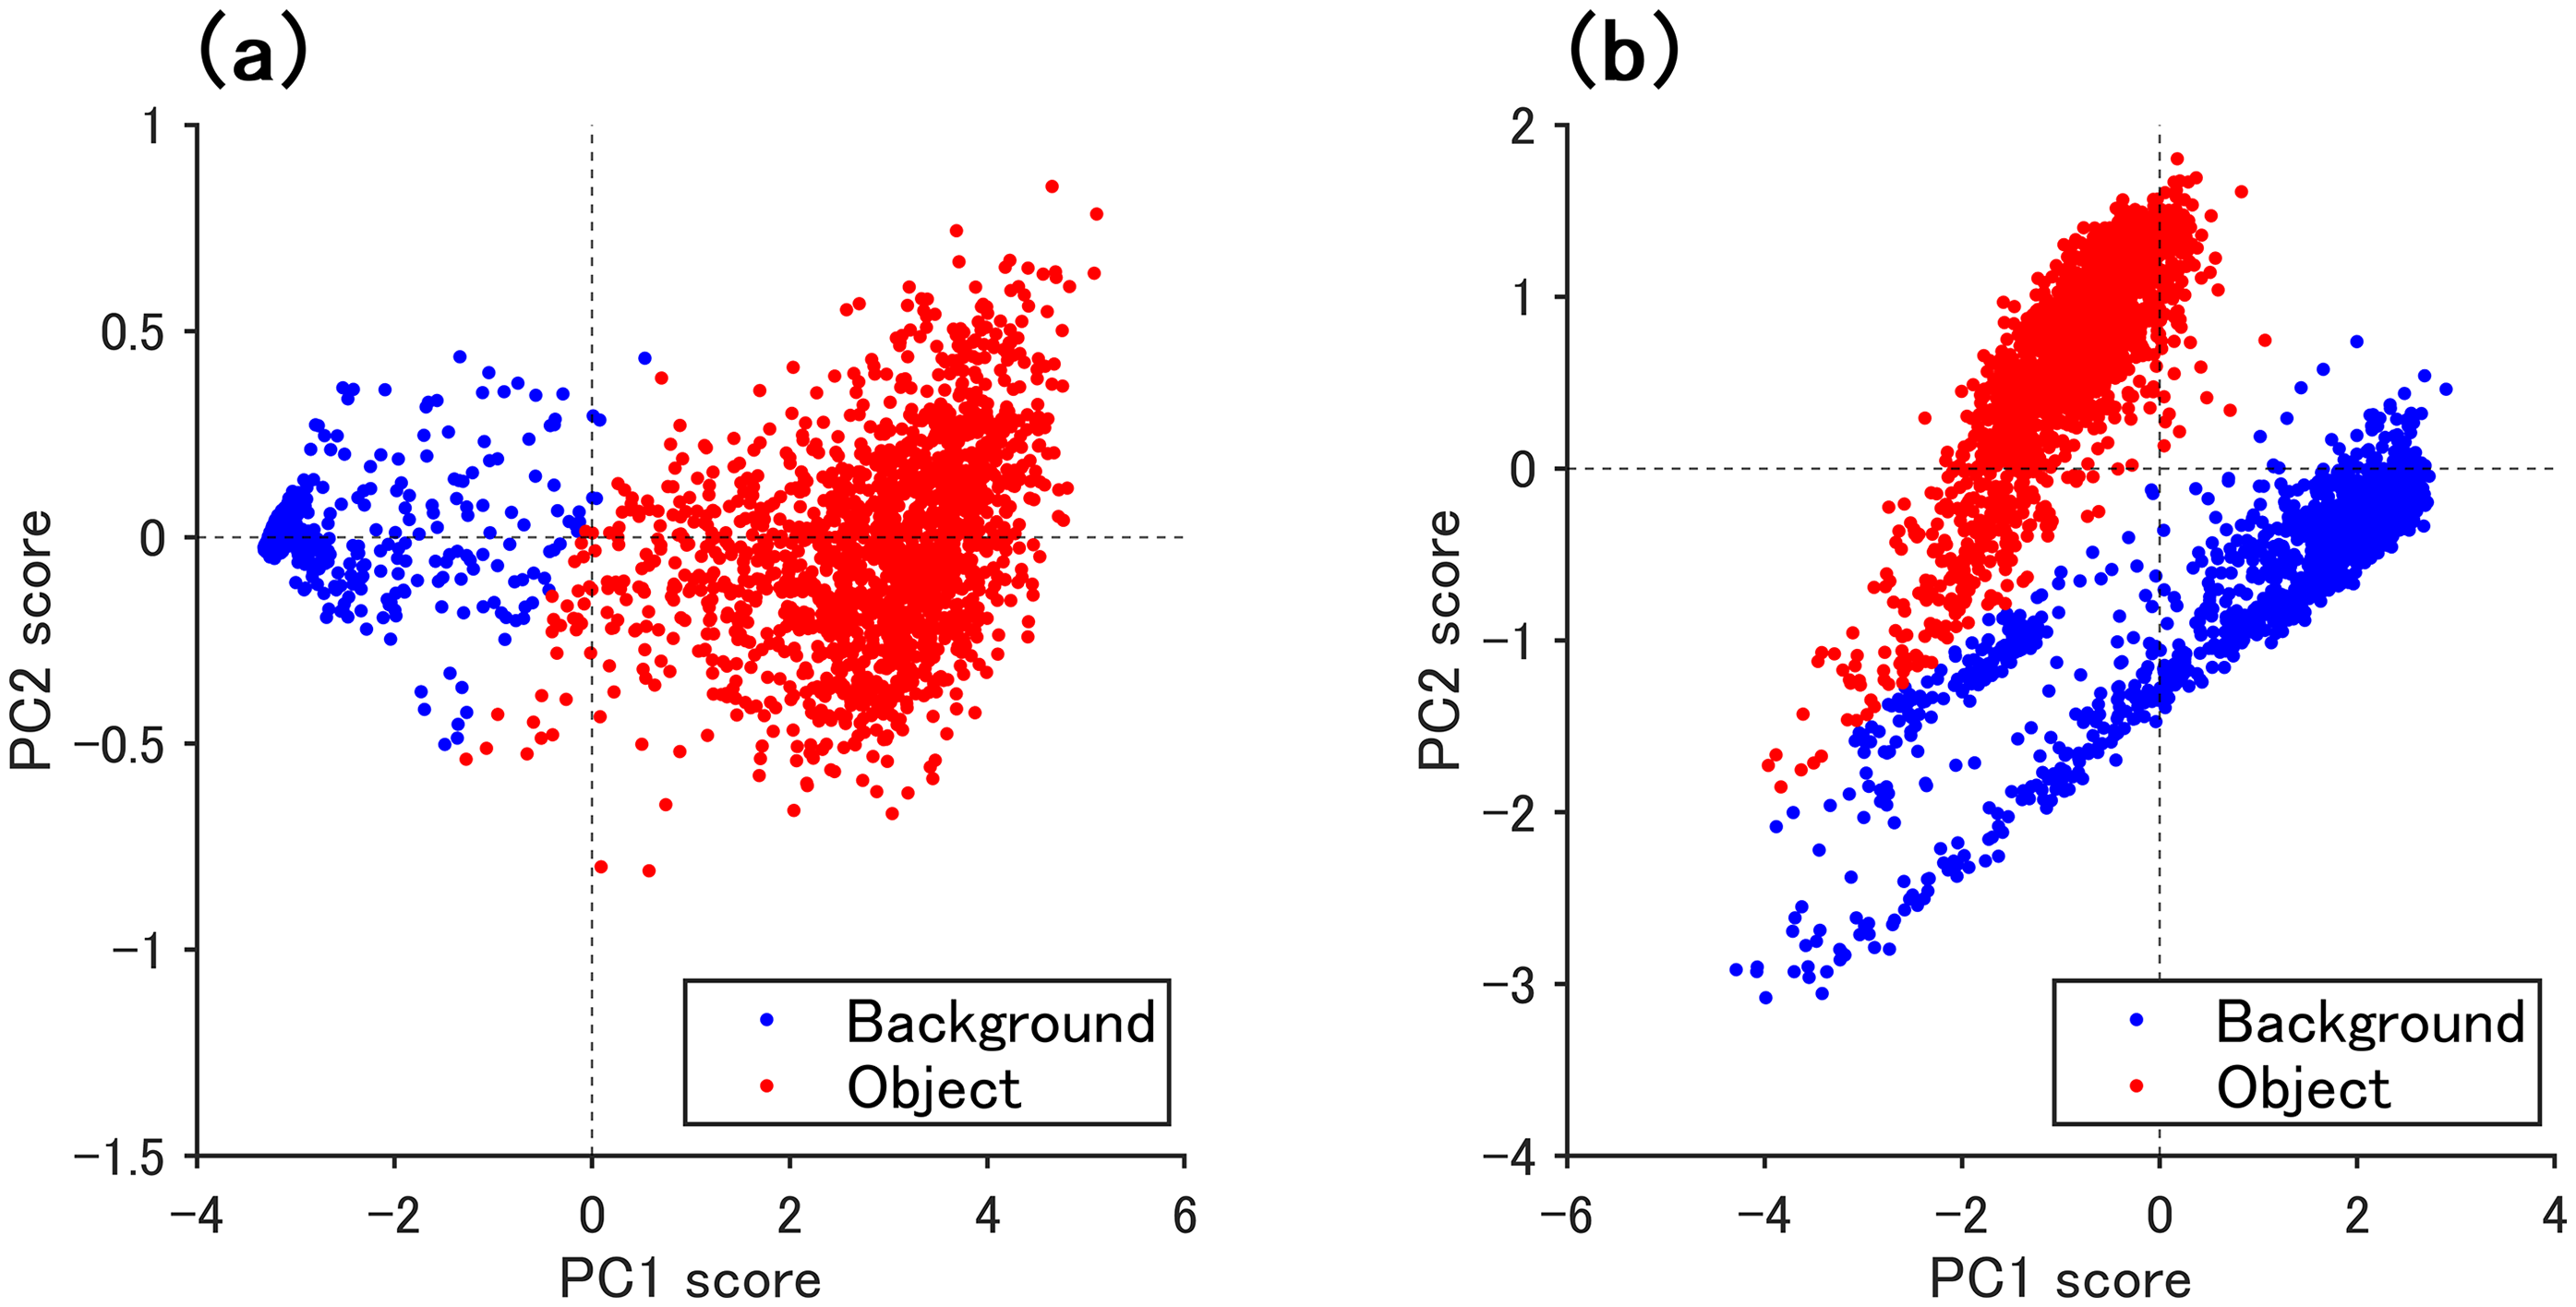
Plots of PC1 and PC2 scores of the pastry placed on the (a) low-reflectance sheet and (b) white paper. To improve readability, data are displayed by thinning out every 10 points and colored to distinguish background pixels (blue) and object pixels (red) based on the results shown in Figures 5 and S2 (Supplemental Material).
In contrast, determining the threshold for the plot shown in Figure 7b, which represents the PC scores of the pastry placed on the white paper sheet, was challenging. More specifically, the scores described a pair of comet-like distributions, forming two clusters that spread along both the PC1 and PC2 axes, with contribution rates of 77.1 and 22.6%, respectively. The PC1 scores for the background pixels clustered mostly around 2.2, while those for the object pixels clustered near −1. For such a pair of comet-like distributions, it was necessary to set the threshold using manual selection with ellipsoidal boundaries. However, in the plot shown in Figure 7b, several trials were required to recognize that the plots corresponding to the background pixels clustered slightly between −1 and −3 on the PC1 axis, and between −1 and −2 on the PC2 axis. Thus, compared to the PCA-based method, the px-wise SD method offered a more efficient approach for background pixel removal.
Advantages of the Px-Wise SD Method
This research demonstrates the efficacy of the px-wise SD method, which employs the px-wise SD of reflectance for background pixel removal from NIR hyperspectral data. The proposed method exhibits various notable features. Firstly, the px-wise SD method does not require any prior specification of background pixels, thereby allowing for unsupervised background removal. Such removal is achieved by identifying background pixels from the histogram peak with the lowest SD. Furthermore, by adjusting the threshold, specific pixels can be identified. For example, by limiting the SD range between 0.120 and 0.141 in Figure 5a, the pixels mainly corresponding to the hole in the pastry can be extracted. Secondly, the proposed method requires a low computational memory load. As discussed in the Background Pixel Removal section, the only computations required involve SD calculations, histogram creation, and threshold determination. Furthermore, histogram creation can be omitted using the method of Otsu. Since the majority of numerical computation programming languages include functions for performing the aforementioned tasks, no special programming tools are required. Moreover, the generated data size consists only of the SDs for a specific number of pixels, enabling significantly faster computation compared to the PCA-based method, and thereby avoiding insufficient random-access memory issues on a personal computer. 19
However, one disadvantage of the proposed method is that in the case where the spectral baseline has a slope, a large SD may result, thereby rendering background removal ineffective. In such cases, either excluding the wavelength range where the baseline has a slope or applying a derivative treatment to correct the baseline slope is necessary.
Conclusion
The proposed method based on the pixel-wise standard deviation (px-wise SD) of reflectance demonstrates promising results in removing background pixels from NIR hyperspectral images. This method employs the SD of reflectance in each spectrum as a spectral feature to distinguish between the spectra of background and object pixels. The essential computation involves calculating only the SD, which is computationally less intensive than PCA. Additionally, since the px-wise SD for background pixels typically exhibits low values, prior labeling is unnecessary, and the peak with a lower SD in the histogram can be assumed to correspond to the background pixels. This approach effectively removes background pixels even when using white paper, which has not been recommended as a background material for NIR-HSI. Moreover, it avoids manual labeling and requires less computation, enhancing its practical applicability. The effectiveness of the proposed method was demonstrated using the hyperspectral data of a pastry placed on two different background materials, namely a low-reflectance sheet and white paper. Background pixels were efficiently removed for the low-reflectance sheet because both the mean and SD of reflectance exhibited a bimodal distribution in the histogram. By setting a threshold between the two peaks, the background and object pixels were distinguished, enabling successful background pixel removal. However, when a white paper sheet was employed as the background, the mean reflectance failed to effectively separate the pixels, and the PCA-based method required several trials to determine a threshold for distinguishing between the background and object pixels. Nonetheless, applying the proposed method produced a SD histogram, wherein the background and object pixels formed peaks with lower and higher SDs, respectively. In addition, a small peak appeared corresponding to the pixels in the area surrounding the pastry or the hole in the pastry. The threshold set by the Otsu method successfully separated the object pixels from the other pixels, thereby achieving successful background pixel removal even using white paper as the background. When comparing the mean spectra, the mean spectrum calculated using all pixels was found to be distorted by the background pixel spectrum, regardless of the background material. Conversely, removing the background pixels allowed for the correct calculation of the mean spectrum. The obtained results therefore demonstrate that the proposed method provides a reliable mean spectrum to perform mean centering in further spectral analyses, such as PCA and partial least squares discriminant analysis.
Supplemental Material
sj-docx-1-asp-10.1177_00037028251368377 - Supplemental material for Background Pixel Removal for Near-Infrared Hyperspectral Images Based on the Pixel-Wise Standard Deviation of Reflectance
Supplemental material, sj-docx-1-asp-10.1177_00037028251368377 for Background Pixel Removal for Near-Infrared Hyperspectral Images Based on the Pixel-Wise Standard Deviation of Reflectance by Takuma Genkawa and Akifumi Ikehata in Applied Spectroscopy
Footnotes
Acknowledgments
Declaration of Conflicting Interests
The authors declared the following potential conflicts of interest with respect to the research, authorship, and/or publication of this article: Takuma Genkawa holds a granted Japanese patent (JP7645598) related to the proposed method. 42 An international patent application based on this patent is currently under review. No licenses or assignments have been made at the time of submission. Akifumi Ikehata declares that he has no known competing financial interests or personal relationships that could have influenced the work reported in this study.
Funding
The authors disclosed receipt of the following financial support for the research, authorship, and/or publication of this article: this work was supported by JSPS KAKENHI (Grant no. JP23K18068).
Supplemental Material
All supplemental material mentioned in the text is available in the online version of the journal.
References
Supplementary Material
Please find the following supplemental material available below.
For Open Access articles published under a Creative Commons License, all supplemental material carries the same license as the article it is associated with.
For non-Open Access articles published, all supplemental material carries a non-exclusive license, and permission requests for re-use of supplemental material or any part of supplemental material shall be sent directly to the copyright owner as specified in the copyright notice associated with the article.