
Abstract
Clinical applications of Raman spectroscopy (RS) typically rely on fiber optic probes that directly interface with the tissue site. These devices are designed with small diameters, enabling them to navigate narrow body cavities and seamlessly integrate into routine medical instruments. However, the performance of conventional RS fiber probes suffers during noncontact operation due to decreased collection efficiency and a larger laser spot size that restricts spatial precision. To address these limitations, a novel RS probe design is presented here that can efficiently collect both fingerprint (FP) and high-wavenumber (HW) regions of the Raman spectrum at an offset from the target tissue using a miniature lens at the probe tip. The development process began with stochastic light propagation simulations that served as a foundation for the device’s expected performance improvements compared to a standard RS probe design, which were then experimentally verified. Lenses were fabricated from various materials, including fused silica, quartz, sapphire, and calcium fluoride, to assess the impact of aberrant lens emissions on the analysis of tissue Raman features within the FP and HW spectral regions. Signal quality metrics are reported from in vivo tissue using each type of lens, demonstrating that crystalline lenses best preserve the weak Raman signal generated by tissues during dual-region RS analysis. Still, the ideal lens type will ultimately depend on material characteristics and which spectral region is required for tissue interrogation. This device demonstrated a 90% increase in signal intensity and a four-fold improvement in spatial selectivity compared to a conventional RS probe during noncontact operation. Finally, one embodiment of the noncontact probe is described to showcase a clinically compatible prototype, which incorporates a widefield camera module for positioning guidance during in vivo use.
This is a visual representation of the abstract.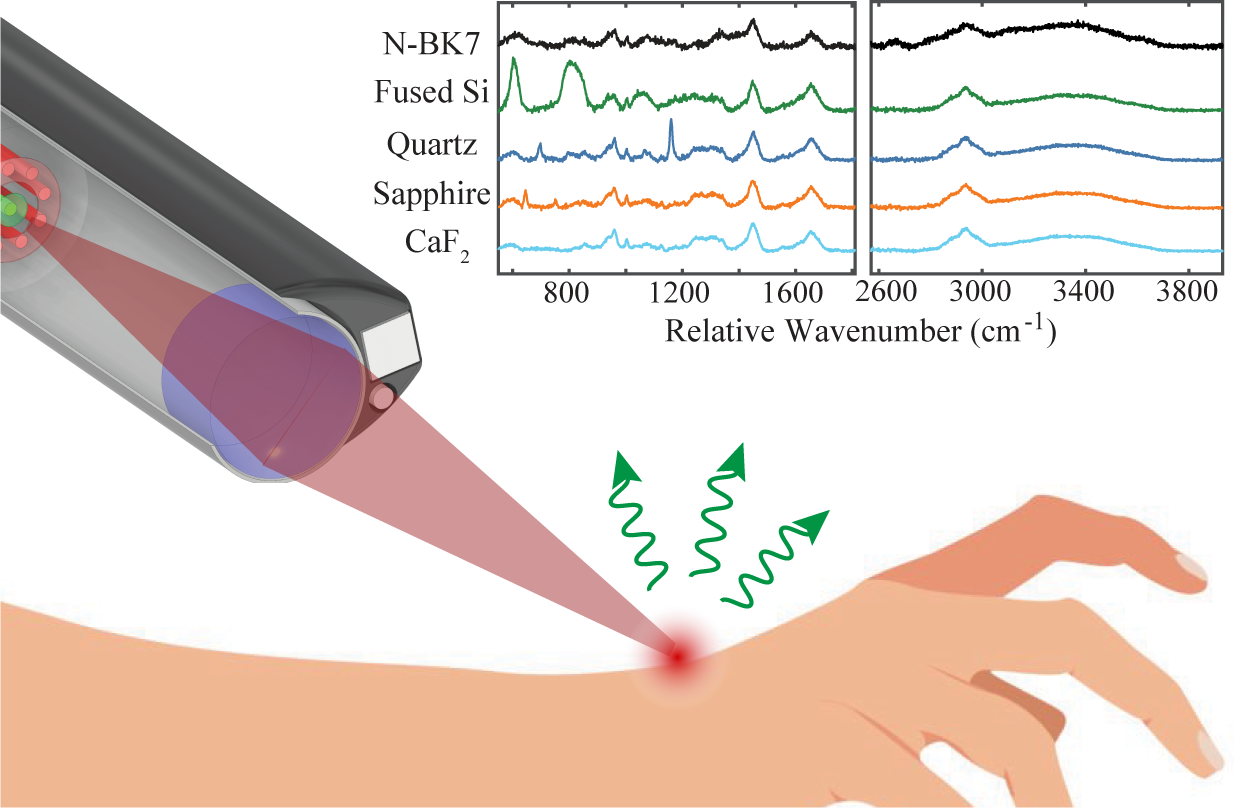
Introduction
Raman spectroscopy (RS) is a label-free optical method capable of nondestructively sensing molecular composition and structure. 1 The Raman effect describes inelastic light scattering, where incident photons interact with molecular vibrations, causing an instantaneous energy transfer and a detectable shift in the wavelength of scattered light. The Raman spectrum thereby encodes the presence and abundance of molecular species, creating an optical ‘fingerprint’ of the sample. Among the diverse applications that have utilized this technique for molecular sensing, in vivo RS pertains to the subset of studies that use this technique to analyze tissues and biofluids in their native environment within the body. The rapid and noninvasive nature of spectroscopic tools has generated significant interest in advancing RS-based tools for clinical diagnostics. 2
In most cases, in vivo RS studies rely on fiber-based devices. 3 Optical fibers offer the key advantage of decoupling the light source and spectrometer from the tissue site, allowing for remote RS measurements at the point of care. Compared to free-space optical systems, fibers are also relatively thin and flexible. These characteristics enhance the versatility of RS and its adoption into clinical workflows, as the optical design can be tailored for specific anatomical locations within handheld devices or integrated into standard medical devices. Fiber-based designs for in vivo RS are typically constructed with a forward-facing fiber bundle that delivers the laser source with a central fiber and collects the Raman signal with one or multiple adjacent fibers. 4 Commonly known as volume probes, they capture diffuse light emitted from the tissue volume directly beneath the probe tip.
Volume probe designs have been reported with sufficiently small diameters for insertion into clinical endoscopes, 5 intravenous catheters, 6 and even hypodermic needles. 7 However, these devices rely on direct contact with the target tissue due to the inherent limitation in light-gathering ability imposed by the numerical aperture (NA) of fiber optics, with typical values between 0.1–0.3, and because tissues exhibit weak Raman scattering power. By customizing the tip of a volume probe with careful arrangements of optical elements (e.g., beveled fibers, ball lens, mirrors), the light collection cone of the fiber optics can be modified to better overlap with the illumination cone and enhance light-gathering ability. 8 This principle increases collection efficiency and may be leveraged to geometrically align laser illumination and RS collection at targeted depths to interrogate specific tissue layers. 9
While these volume probe designs unveil opportunities for optimizing RS devices that directly interface with the sample, probe-tissue contact may not always be practical. Direct tissue contact in a clinical setting raises concerns for proper sanitization, especially when analyzing infectious diseases or exposed tissues during surgical procedures. Probe contact may also cause damage to delicate tissue sites (e.g., tympanic membrane, peripheral nerves, brain matter) or otherwise cause discomfort for awake patients (e.g., tonsils, cornea, open wounds). Efforts to integrate RS into medical endoscopes or catheters make use of the auxiliary instrument channel, where the native imaging camera is used to position the RS probe within small body cavities like the nasopharynx, 10 gastrointestinal tract, 11 esophagus,12,13 or colon. 14 In these scenarios, probe-tissue contact occludes the endoscopic camera view, which would ideally be maintained while the probe is guided and positioned over targeted tissue zones. Robotic-assisted surgical systems represent another prospect for noncontact RS with a small device diameter, as obstructing the camera view during probe-tissue contact inhibits robotic control of Raman measurements. 15
The performance of standard RS volume probes suffers when the device is separated from the tissue surface for two primary reasons. First, the coupling efficiency of the diffusely scattered Raman light quickly decreases as the working distance increases. 16 Second, the diverging light cone exiting a fiber optic causes laser radiation to cover a large tissue region at longer working distances. This effect inherently limits the spatial specificity of which tissue zone is analyzed. An imaging lens should compensate for these limitations by creating an optical relay of the fiber bundle onto the tissue site.
To our knowledge, the only reported designs of a small-diameter noncontact RS probe with a relay lens were intended to detect the presence of surface-enhanced Raman spectroscopy (SERS) reporter molecules.14,17,18 These devices used a miniature fused silica lens, which emits a fluorescent response to the 785 nm laser source. While they could effectively detect the strong extrinsic SERS signals, the lens’ floursecence contribution dominates in vivo spectra and limits the ability to resolve the relatively weak Raman scattered light generated by the tissue specimen.18,19 Indeed, similar considerations are taken when choosing a sample substrate for microscopic RS studies of biologics. Studies typically rely on reflective (e.g., stainless steel, aluminum foil) or specialized crystalline substrates like sapphire or calcium fluoride (CaF2) to avoid aberrant background signals generated by the substrate and preserve the sample’s Raman spectral signature.20,21 Therefore, it is critical to determine how different lens materials respond to the intense RS laser radiation when designing a noncontact RS probe for analyzing tissue Raman spectra in vivo.
Most biomedical RS studies have focused on the fingerprint (FP) region, between 500–1800 cm−1, which is rich in biomolecular signatures from various macromolecules including lipids, proteins, collagen, DNA, and amino acids. 22 However, the high wavenumber (HW) region also provides valuable information about higher energy vibrational modes corresponding to C–H vibrations from lipids and proteins between 2800–3000 cm−1, and O–H vibrations associated with partially or fully bound water molecules within tissues, from 3000–3600 cm−1. Evidence suggests that combining spectroscopic information from both regions of the Raman spectrum can expand diagnostic accuracy, 23 which can be technologically achieved by utilizing two laser sources at appropriate wavelengths to avoid instrument complexity for dual-region detection.15,24,25 Important to this work, the fluorescent properties of the lens substrate material are dependent on the source wavelength. Since independent laser sources are used for dual-region RS, the lens’ background signals are different for the FP and HW regions and should be independently characterized.
Here, we present the design and performance validation of a novel in vivo RS probe optimized for analyzing both FP and HW regions of Raman spectra during noncontact operation. Nonsequential ray simulations provide a basis for improved collection efficiency and beam confinement compared to a standard RS probe. Micro-lenses made of different materials are compared to determine which can sufficiently resolve FP and HW spectral features from in vivo tissue. We further detail the construction of one embodiment of the noncontact probe that provides endoscopic visualization capabilities with a miniature camera. Device performance was then validated by empirically measuring collection efficiency and spatial resolution on tissue specimens to determine clinical relevance.
Experimental
Materials and Methods
The in vivo RS system consists of a laser source, imaging spectrograph, charge-coupled device (CCD), and fiber probe, as depicted in Figure 1a. The laser module contains two narrowband, wavelength-stabilized laser diodes at 785 and 680 nm (II0785/680 MU0350MS, Innovative Photonic Solutions). A high-throughput imaging spectrograph with a 100 µm slit (HT-SPEC-785, EmVision LLC) receives light from the probe collection fibers and spectrally disperses the optical signal. A thermoelectrically cooled deep-depleted CCD (Blaze 400HR, Teledyne Princeton Instruments, USA) records the spectrum through communication with a personal laptop.
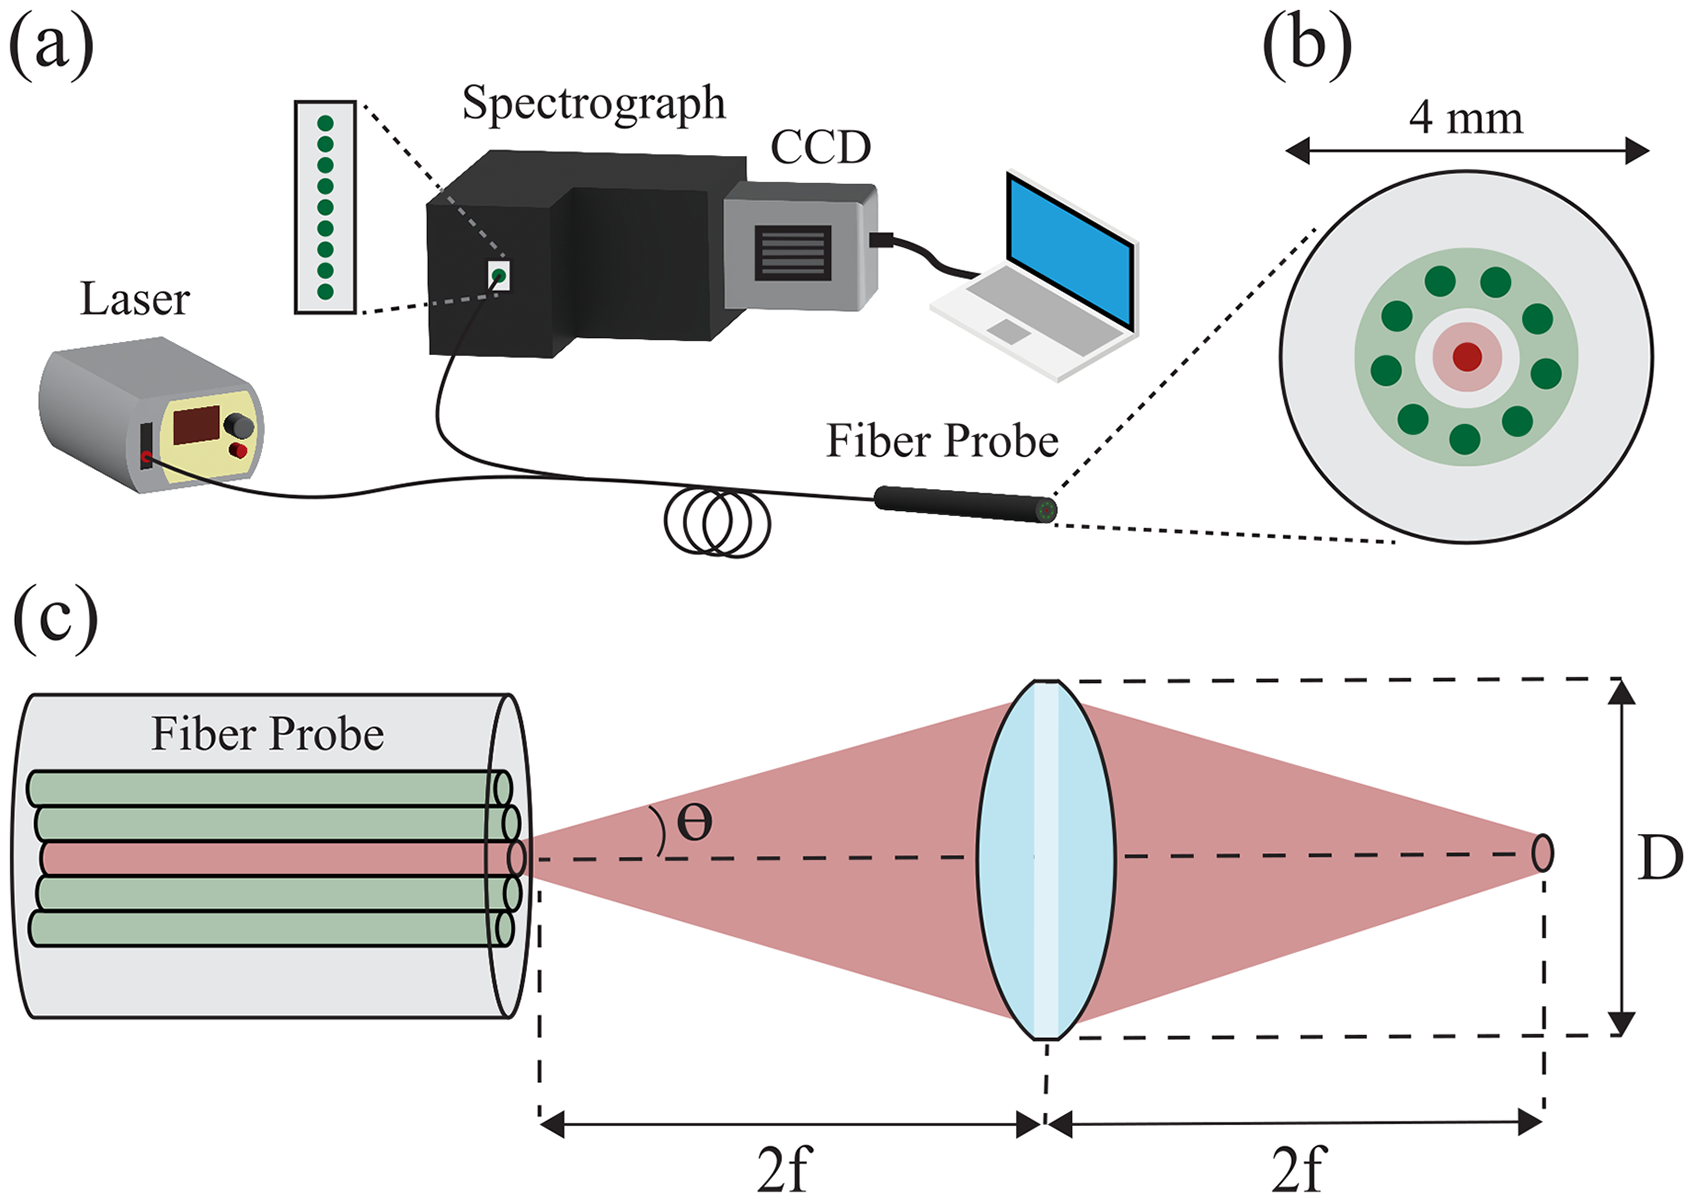
(a) Schematic of the RS system, including 785/680 nm laser, CCD, imaging spectrograph, and fiber probe. (b) Zoomed view of the fiber bundle, consisting of a central laser fiber (red circle) affixed with a laser filter (light red circle) and a concentric ring of nine collection fibers (green circles) covered by an annular-shaped emission filter (light green ring). (b) Pictorial description of a biconvex lens creating an optical relay of the fiber optic. D: lens diameter. 2f: Two-focal length distance of optical relay. θ: Half-angle of fiber beam divergence.
The spectrograph’s wavelength dispersion was calibrated using the atomic emission spectrum of a neon–argon lamp, and the relative wavenumber axis was then independently calculated for the 785 and 680 nm laser lines that correspond to the FP and HW regions, respectively. Calibration error was confirmed with chemical standards to ensure it was below the system's spectral resolution of 8 cm−1. A tungsten–halogen white-light source (UIS-LS-30 W, StellarNet Inc., USA) was used to correct the system’s wavelength-dependent intensity response.
Spectral Acquisition and Preprocessing
The following camera parameters were set for all measurements: Medium gain, 1 MHz readout speed, vertical hardware binning, –80 °C cooling setpoint, and 2-second exposure time. Data acquisition was controlled via LightField software (Teledyne Princeton Instruments, USA) for readout from the CCD. Laser power was set to 60 mW for the 785 nm diode and 40 mW for the 680 nm diode, measured at the probe tip, so that both FP and HW regions of the Raman spectrum provided similar signal counts with a fixed exposure time. The room lights were turned off during acquisition to prevent ambient light from entering the probe or spectrograph.
Baseline estimation algorithms fit a curve to the measured spectrum to subtract the background component of the spectrum and isolate the Raman features. The modified polyfit method 26 was used here, which asymmetrically fits a polynomial of a specified order to the raw spectrum. For FP spectra, a sixth-order polynomial was applied. The HW region, however, contains much broader Raman bands that tend to be overfitted during this procedure and influence the shape of spectral features after the baseline is removed. An analogous piece-wise fitting approach was employed here to remedy this effect, which uses the spectral regions between 2600–2770 cm−1 and 3780–3900 cm−1 for fitting data due to the absence of intense Raman bands, as proposed by others.27,28 A third-order polynomial was applied to estimate the HW background profile, as the background is slower varying than FP spectra and provides the most reasonable quality of fit. Data preprocessing was performed using Matlab v.R2023b software (The Mathworks Inc., USA).
Multivariate statistical analysis was applied to the RS measurements in the Camera Guidance section below using principal component analysis (PCA) to visualize spatial variability in the data. This method projects the spectra into orthogonal directions of maximal variance by calculating the eigenvectors of the covariance matrix associated with the spectral dataset. 29 PCA projection helps visualize the clustering of spectra in a reduced-dimensional space and was implemented using the “pca” function in Matlab.
Fiber Probe and Imaging Lens
A standard RS fiber bundle (EmVision LLC) was manufactured to support the collection of Raman spectra in vivo. Figure 1b describes the components of the fiber bundle at the probe tip, which has an outer diameter of 4 mm. The proximal end of the 300 µm core laser fiber (0.22 NA) terminates at the center of the bundle and is affixed with an 800 nm short pass filter to block extraneous wavelengths from reaching the sample. A concentric ring of nine 300 µm core collection fibers with equivalent NA surrounds the laser fiber to accumulate diffusely reflected light from the sample. An annular-shaped 800 nm long-pass filter covers the collection fibers to reject backscattered laser light.
The design of an imaging lens for a miniature RS probe should first consider the smallest practical lens size. Here, the relationship between fiber beam divergence and the geometry of an imaging relay is used to calculate the required lens diameter that captures the fiber illumination/collection cones. This optical arrangement is pictorially described in Figure 1c, where the lens is placed two focal lengths (2f) away from the fiber face to create an image relay 2f in front of the lens. The fiber NA is directly related to the half-angle of beam divergence (
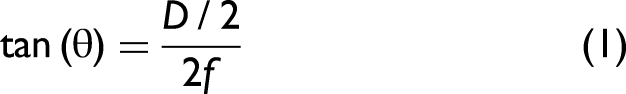

As the fiber's NA increases, the lens diameter must also increase to capture the marginal rays at the steepest divergence angles supported by the fiber optic. Furthermore, the minimum lens diameter increases as the focal length and, consequently, the working distance of the imaging relay extends. Depending on the unique operational and application requirements, this generalized relationship between lens diameter, working distance, and fiber NA can be followed. As a proof-of-concept, the noncontact RS probe was designed here to support application in the pediatric ear canal, which would benefit from noncontact spectral acquisition by avoiding contact with delicate middle ear tissues. The dimensions of a child’s ear canal, which is 10–17 mm long and has a diameter of 4–5 mm at the narrowest portion, 30 set the primary design constraint for the imaging lens. Using Eq. 1, the biconvex lens for this embodiment of the noncontact RS probe was designed to have a focal length of 4.5 mm, which provided a reasonable compromise between an image relay working distance of 9 mm and a lens diameter of 4 mm to accommodate in vivo RS measurement of a pediatric eardrum.
Collection Efficiency Simulation
When designing illumination and collection optics for medical devices, it is valuable to use specialized light propagation analysis that captures realistic absorption and scattering of biological tissues. For this purpose, FRED software (v.22.40.4, Photon Engineering) was used to simulate the standard and noncontact fiber probes. Diffuse scattering and absorption in tissue were simulated using Monte Carlo-based stochastic ray propagation. A Henyey–Greenstein scatter model 31 was applied to a tissue volume representing semi-infinite bulk tissue with optical properties matching those of skin. These values were set to the reported optical properties of human cadaver tissue at or near 800 nm, 32 corresponding to the spectral detection window of Raman scattered light, which states an absorption coefficient of 0.4 cm−1 and a reduced scattering coefficient of 14 cm−1. The fiber bundle plane served as the launch and detection point for rays within the simulation. An illumination source was positioned at the center with an aperture of 300 µm a divergence angle of 12.7 degrees to model the laser fiber core diameter and NA, respectively.
This arrangement of optical and scattering components is depicted in Figure 2, which shows a subset of 1000 incident rays colored red and post-scattered rays colored blue after interacting with the tissue volume. The FRED simulation of a standard RS probe at a 9 mm working distance to the tissue surface is presented in Figure 2a. The proposed noncontact probe design was simulated by adding a biconvex lens with 4 mm diameter, center thickness of 2 mm, focal length of 4.5 mm and refractive index of 1.43. The lens was placed 2f, or 9 mm, in front of the fiber bundle plane to create an imaging relay conjugate to the tissue surface (Figure 2b). Because the lens would need to be secured to the probe with a rigid lens tube, a hollow tube was added to surround the noncontact probe and block extraneous rays from entering the detector plane.
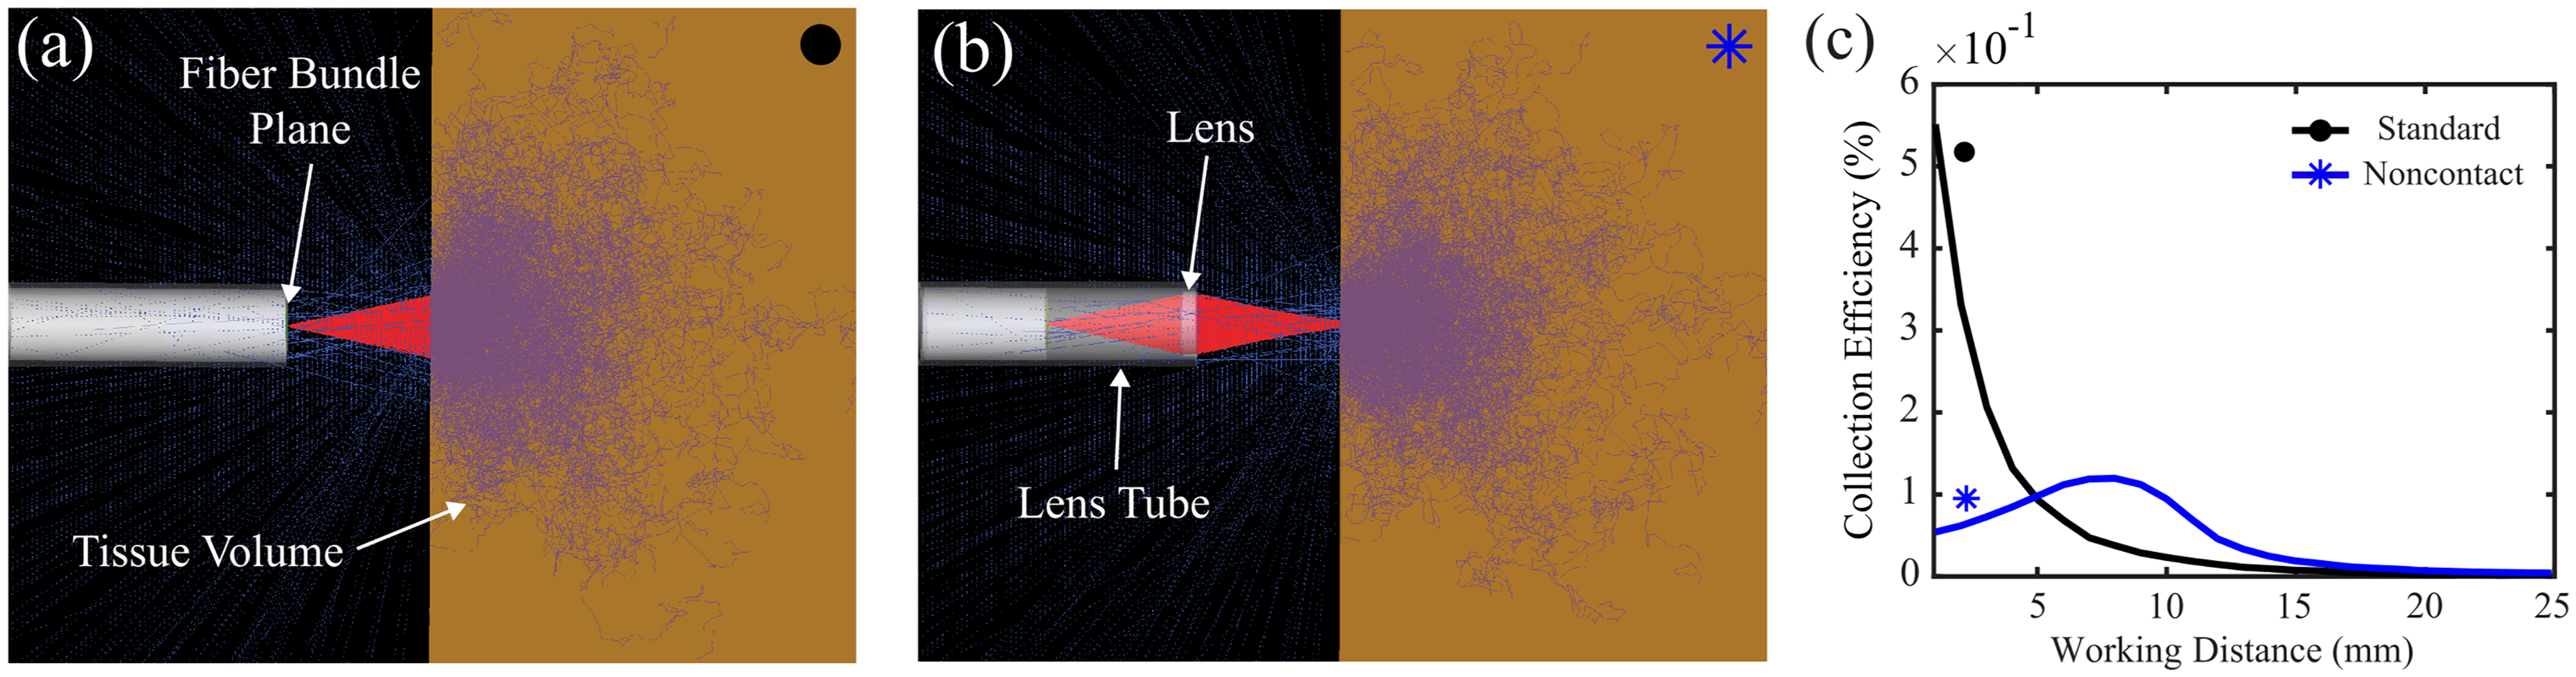
FRED simulation of light collection from the tissue scattering model. (a) Image of the optical and scattering components for (a) the standard RS probe and (b) the noncontact probe. Incident rays are colored red and post-scattered rays are colored blue. (c) Simulated collection efficiencies between 1–25 mm working distances for the standard probe (black, circle) and the noncontact probe (blue, asterisk).
The simulation was set to launch 1 W of illumination power partitioned into 3 million rays. Rays that returned to the fiber bundle plane after interacting with the tissue volume were recorded with a 100 × 100-pixel irradiance detector. To accurately simulate light collection supported by the NA of fibers within the probe, rays incident on the detector were first filtered using an angular ray filter. This selectively detected a subset of rays with a directional cosine of 0.976 or less, corresponding to an angle ≤12.7° relative to the fiber axis. To analyze the light that would be coupled into the collection fibers of the RS probe, the irradiance map was again filtered to the region that overlaps with the dimensions and position of the annular filter in the fiber bundle (depicted in Figure 1b). This was achieved by overlaying an annular mask, with an outer diameter of 3.5 mm and an inner diameter of 2 mm, onto the irradiance map returned from the simulation (Figure S1, Supplemental Material). Finally, detected power was calculated by summing the filtered irradiance map and multiplying by the annular area of 6.48 mm2. Light collection efficiency was defined by detected power relative to incident power, which was evaluated at variable working distances by axially shifting the probe relative to the tissue volume in 1 mm increments. Figure 2c shows the simulated collection efficiency versus working distance for both probe designs between 1–25 mm.
The illumination spot size at the sample was simulated by positioning a detector plane at a working distance of 9 mm from the probe tip (Figure S2, Supplemental Material). Using a Gaussian model, the FRED simulation predicts the standard probe to illuminate the sample with a 1/e2 intensity diameter of 4.2 mm. In comparison, the 1/e2 intensity diameter for the noncontact probe was predicted to be 0.45 mm at the 9 mm offset, indicating that focusing the excitation beam with the miniature lens is expected to reduce the local illumination zone at the sample surface by nearly tenfold.
Lens Fabrication and Characterization
Miniature biconvex lenses were fabricated from various refractive materials with a diameter of 4 mm and a center thickness of 2 mm. Multiple lens materials were investigated for a noncontact RS probe, including fused silica, quartz, calcium fluoride (DelMar Photonics, USA), and sapphire (AWI Industries, USA). The refractive index (RI) and surface curvature of a lens determine its optical power. Because the investigated lens materials have RIs that range between 1.43–1.76, the radii of curvature for each biconvex lens were individually tailored to achieve equivalent optical power. Optical design software (Zemax OpticStudio 2023, USA) was used to optimize the spot size across the excitation and detection regime for this RS application, between 680–850 nm (Figure S3, Supplemental Material). Fused silica and quartz lenses shared an equivalent optical design because they have matching RIs. Although these lenses are not chromatically corrected, spherical aberrations were shown to dominate imaging performance due to their small f-number. 33 An advantage of sapphire’s higher RI is that the optimized radius of curvature was larger than the other materials to achieve the desired optical power. Spherical aberrations were thereby decreased, and the sapphire lens design minimized RMS spot size compared to the other custom lenses (Table S1, Supplemental Material).
Following manufacture, the background signals generated by each lens were measured by arranging the standard volume probe and lens into the imaging relay configuration depicted in Figure 1c. The lenses were retained in a custom aluminum chuck and positioned 9 mm in front of the fiber bundle to create an optical relay. In addition to the custom-manufactured lenses, the intrinsic signal of a commercially available N-BK7 singlet lens (no. 32-022, Edmund Optics) with equivalent focal length and closely matching diameter was also compared to understand the limitations imposed by common glass optics when designing a noncontact RS probe. An equivalent glass lens with broadband antireflective (AR) coating (no. 49-452, Edmund Optics) was also measured to investigate the benefits of such coatings in minimizing lens signal contributions. The spectral response of each lens to laser irradiation at 785 and 680 nm was recorded in air, with no sample underneath the probe/lens assembly. Spectra were averaged over 40 acquisitions to minimize noise.
Signal Quality
The quality of a Raman spectrum reflects the amount of detectable Raman signal relative to the amount of signal variance arising from instrumental and shot noise sources. The background represents the unusable portion of the measured signal, which includes all non-Raman photons that only exaggerate shot noise. Contributions to the background include sample autofluorescence, stray light, and fluorescent emissions from system components excited by the laser source. As background counts increase, so does the shot noise present in the detected spectrum. 34 Using our previously reported procedure, 35 two metrics were calculated to capture these aspects and quantify Raman signal quality. A dataset of 40 spectra was acquired, and photobleaching effects were eliminated using multiplicative scatter correction. 36 Baseline estimation was then applied to the average spectrum to approximate Raman (S) and background (B) signal intensities at 1400 cm−1 for the FP region and 2950 cm−1 for the HW region. The signal-to-background ratio (SBR) was calculated as the ratio S/B, and the Raman signal-to-noise ratio (SNR) is computed as the ratio of S and the standard deviation of the peak intensity across the 40 spectra within the dataset.
Results and Discussion
RS Lens Characterization
The intrinsic lens signals represent a background signal component that persists during in vivo RS measurements and interferes with detecting Raman spectral features arising from tissue. Each lens type generates a distinct fluorescent emission profile when excited with the 785 and 680 nm lasers. This lens response is accumulated by the probe’s collection fibers, representing a background signal that persists during in vivo RS measurements. These intrinsic signals were obtained in air, according to the Lens Fabrication and Characterization section above.
Comparing the FP response of silica-based lenses, the N-BK7 glass generated the strongest and most broadband emission, tenfold more intense than any other tested material. The AR coating successfully suppresses much of this aberrant signal contribution from the N-BK7 lens, decreasing the intensity of the background by 50%. The fused silica and quartz lenses, composed of a more purified form of silica, generated a much weaker background relative to N-BK7. Still, they presented notable spectral features throughout the FP region that overlap with the relative wavenumbers important for tissue diagnostics between 600–1750 cm−1. Figure 3a shows that sapphire and CaF2 are ideal for FP detection, as they generated the weakest background signals compared to the other lens materials.
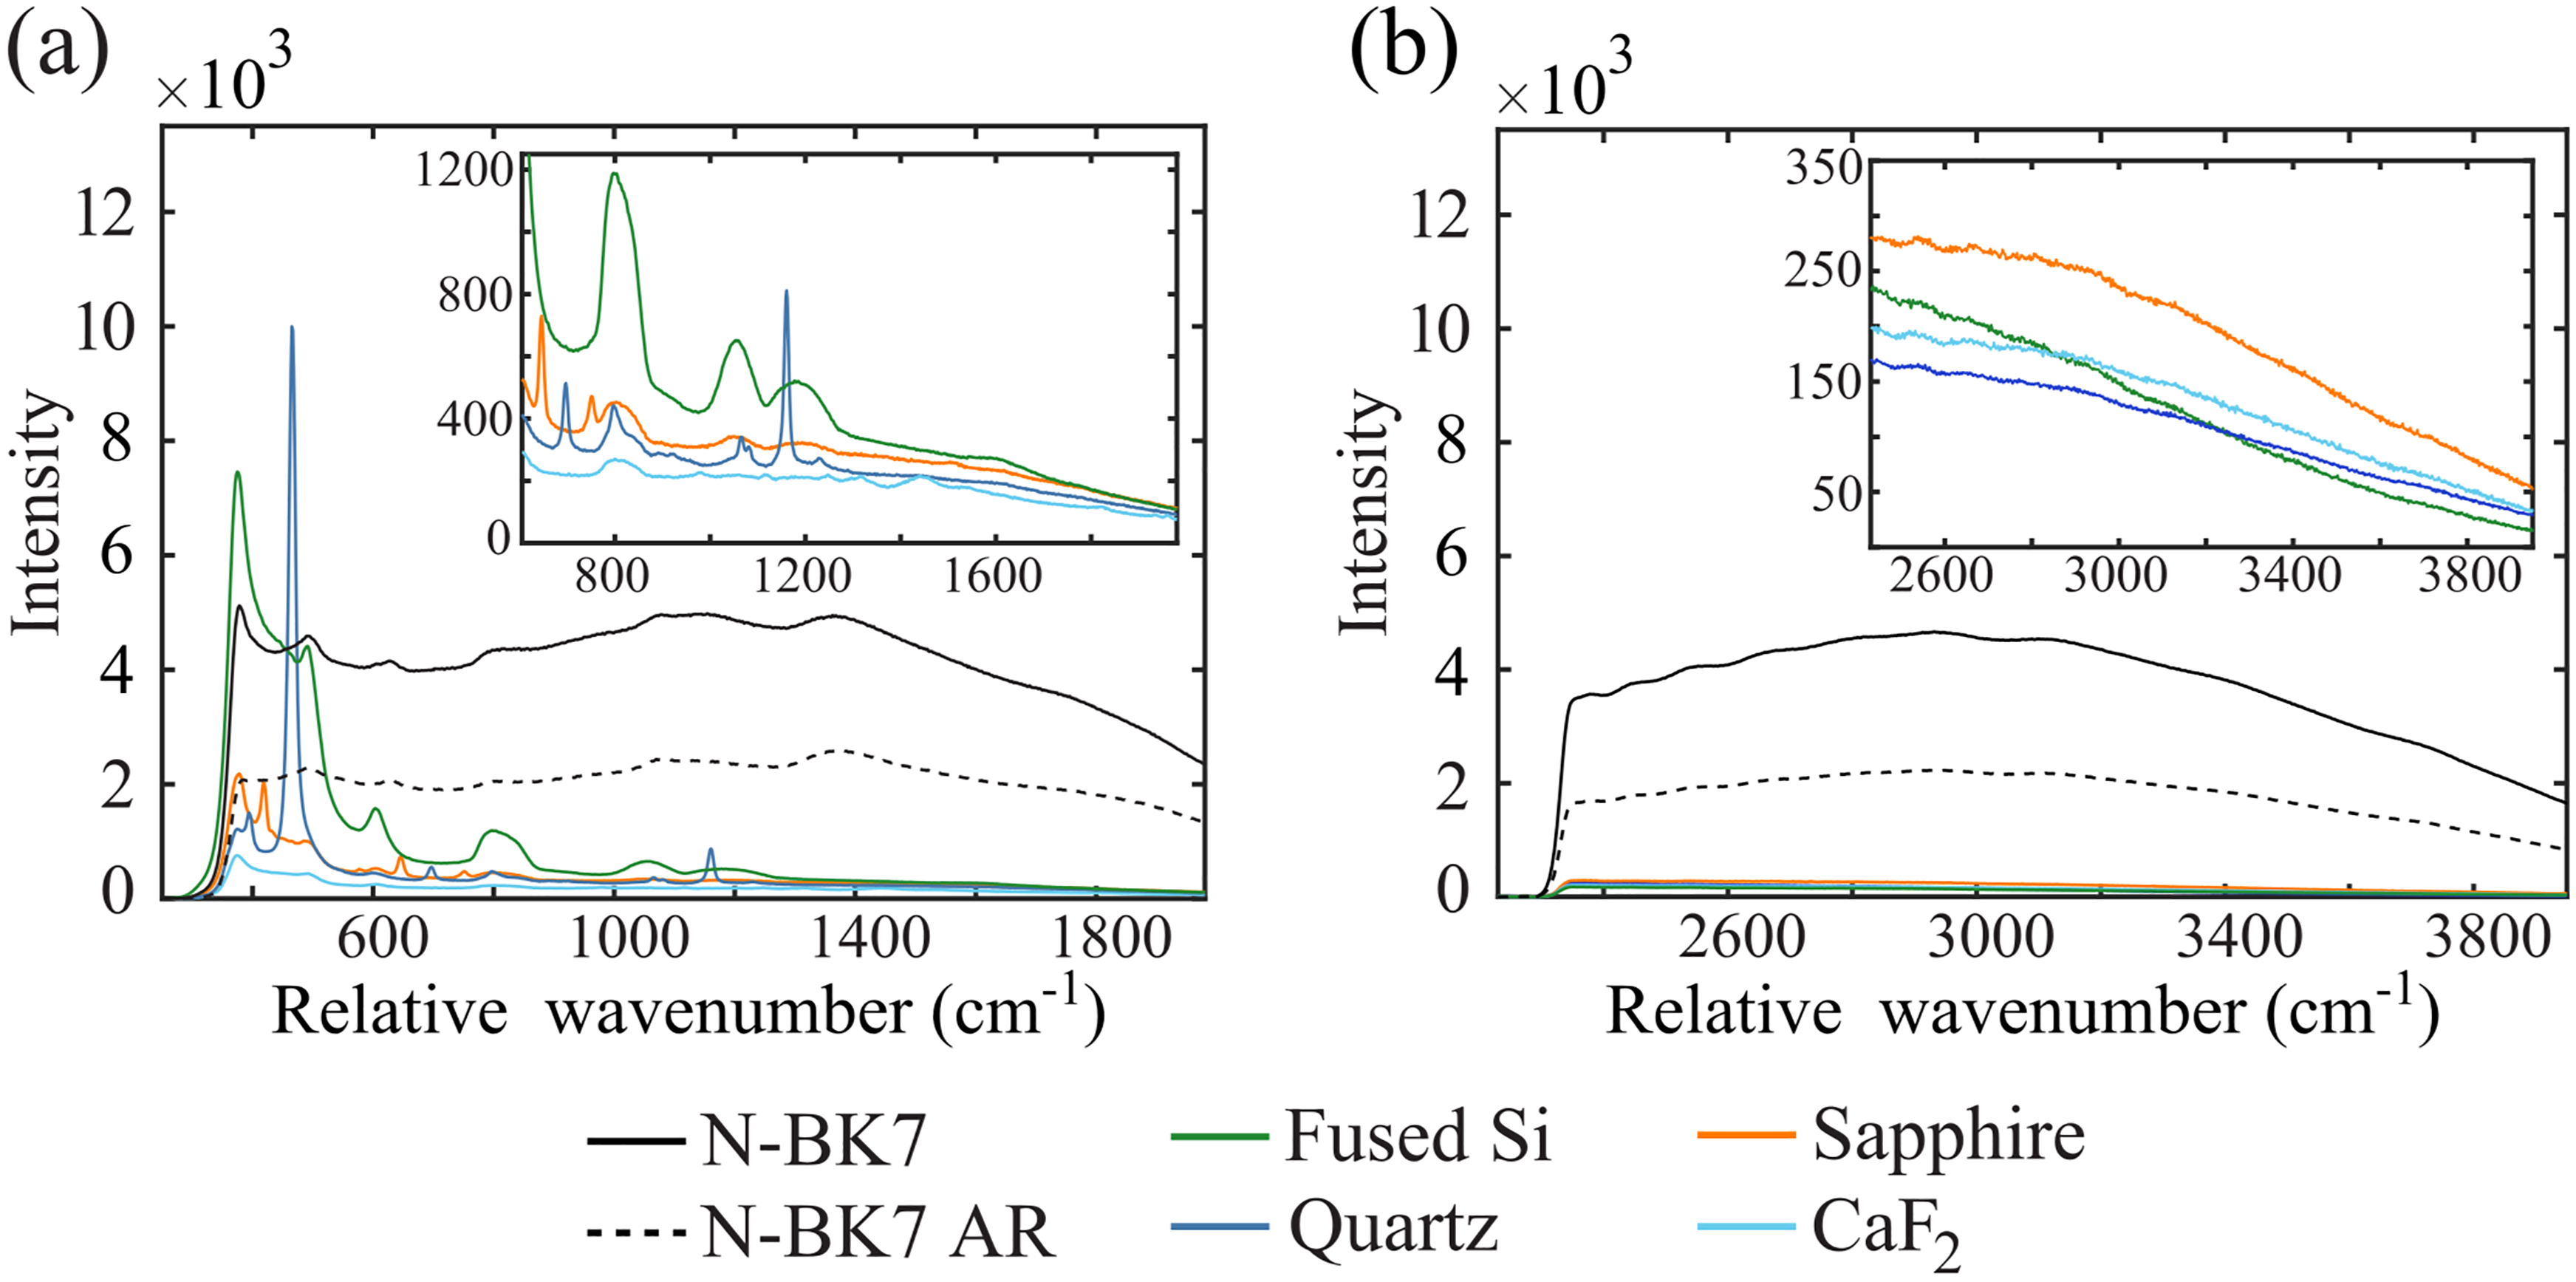
Spectral response of various RS lenses excited under two conditions: (a) 785 nm laser, corresponding to relative wavenumbers of the FP region, and (b) 680 nm laser, corresponding to the HW region. The tested lenses include BK7 silica (solid black), BK7 with antireflective (AR) coating (dotted black), fused silica (green), quartz (blue), sapphire (orange), and calcium fluoride (cyan).
The HW background signals in Figure 3b revealed that N-BK7, with or without AR coating, similarly generates a prominent background signal when excited at 680 nm. However, fused silica and quartz performed equivalently to sapphire and CaF2, demonstrating that collecting HW spectra allows more flexibility in designing a lens for a noncontact RS probe.
These intrinsic lens signals verified that each lens type generates a unique emission profile to the RS laser lines. Still, the relative intensity of these background signals to tissue spectral features would ultimately determine which is ideal for an in vivo RS probe. FP and HW Raman spectra of a human subject’s forearm were collected using each lens and preprocessed (Figure S3, Supplemental Material). The resulting FP spectra are presented in Figure 4a, where the spectra were normalized to the 1440 cm−1 peak to visualize the relative intensity of spectral features emitted by the lens to those generated by the tissue. This peak was chosen because it is the most prominent Raman band within tissue spectra and experienced the least interference from lens background signal across all tested materials. The interfering spectral features from each lens were then isolated by calculating the difference between these signals and the intrinsic tissue spectrum measured with the standard probe in contact with the tissue. Figure 4b shows these difference spectra and highlights spectral regions with notable lens emission bands in the FP region. The difference spectra for sapphire and CaF2 are of the lowest intensity, confirming that they best preserve the FP spectral features of the target tissue and, therefore, are optimal for a noncontact RS probe designed for detecting this spectral region. Similarly, the HW spectra from each lens are given in Figure 4c normalized to the 2950 cm−1 peak, and the associated difference spectra are shown in Figure 4d. The HW difference spectra verify that fused silica, quartz, sapphire, and CaF2 perform equivalently for preserving tissue spectral features in this region of the Raman spectrum.
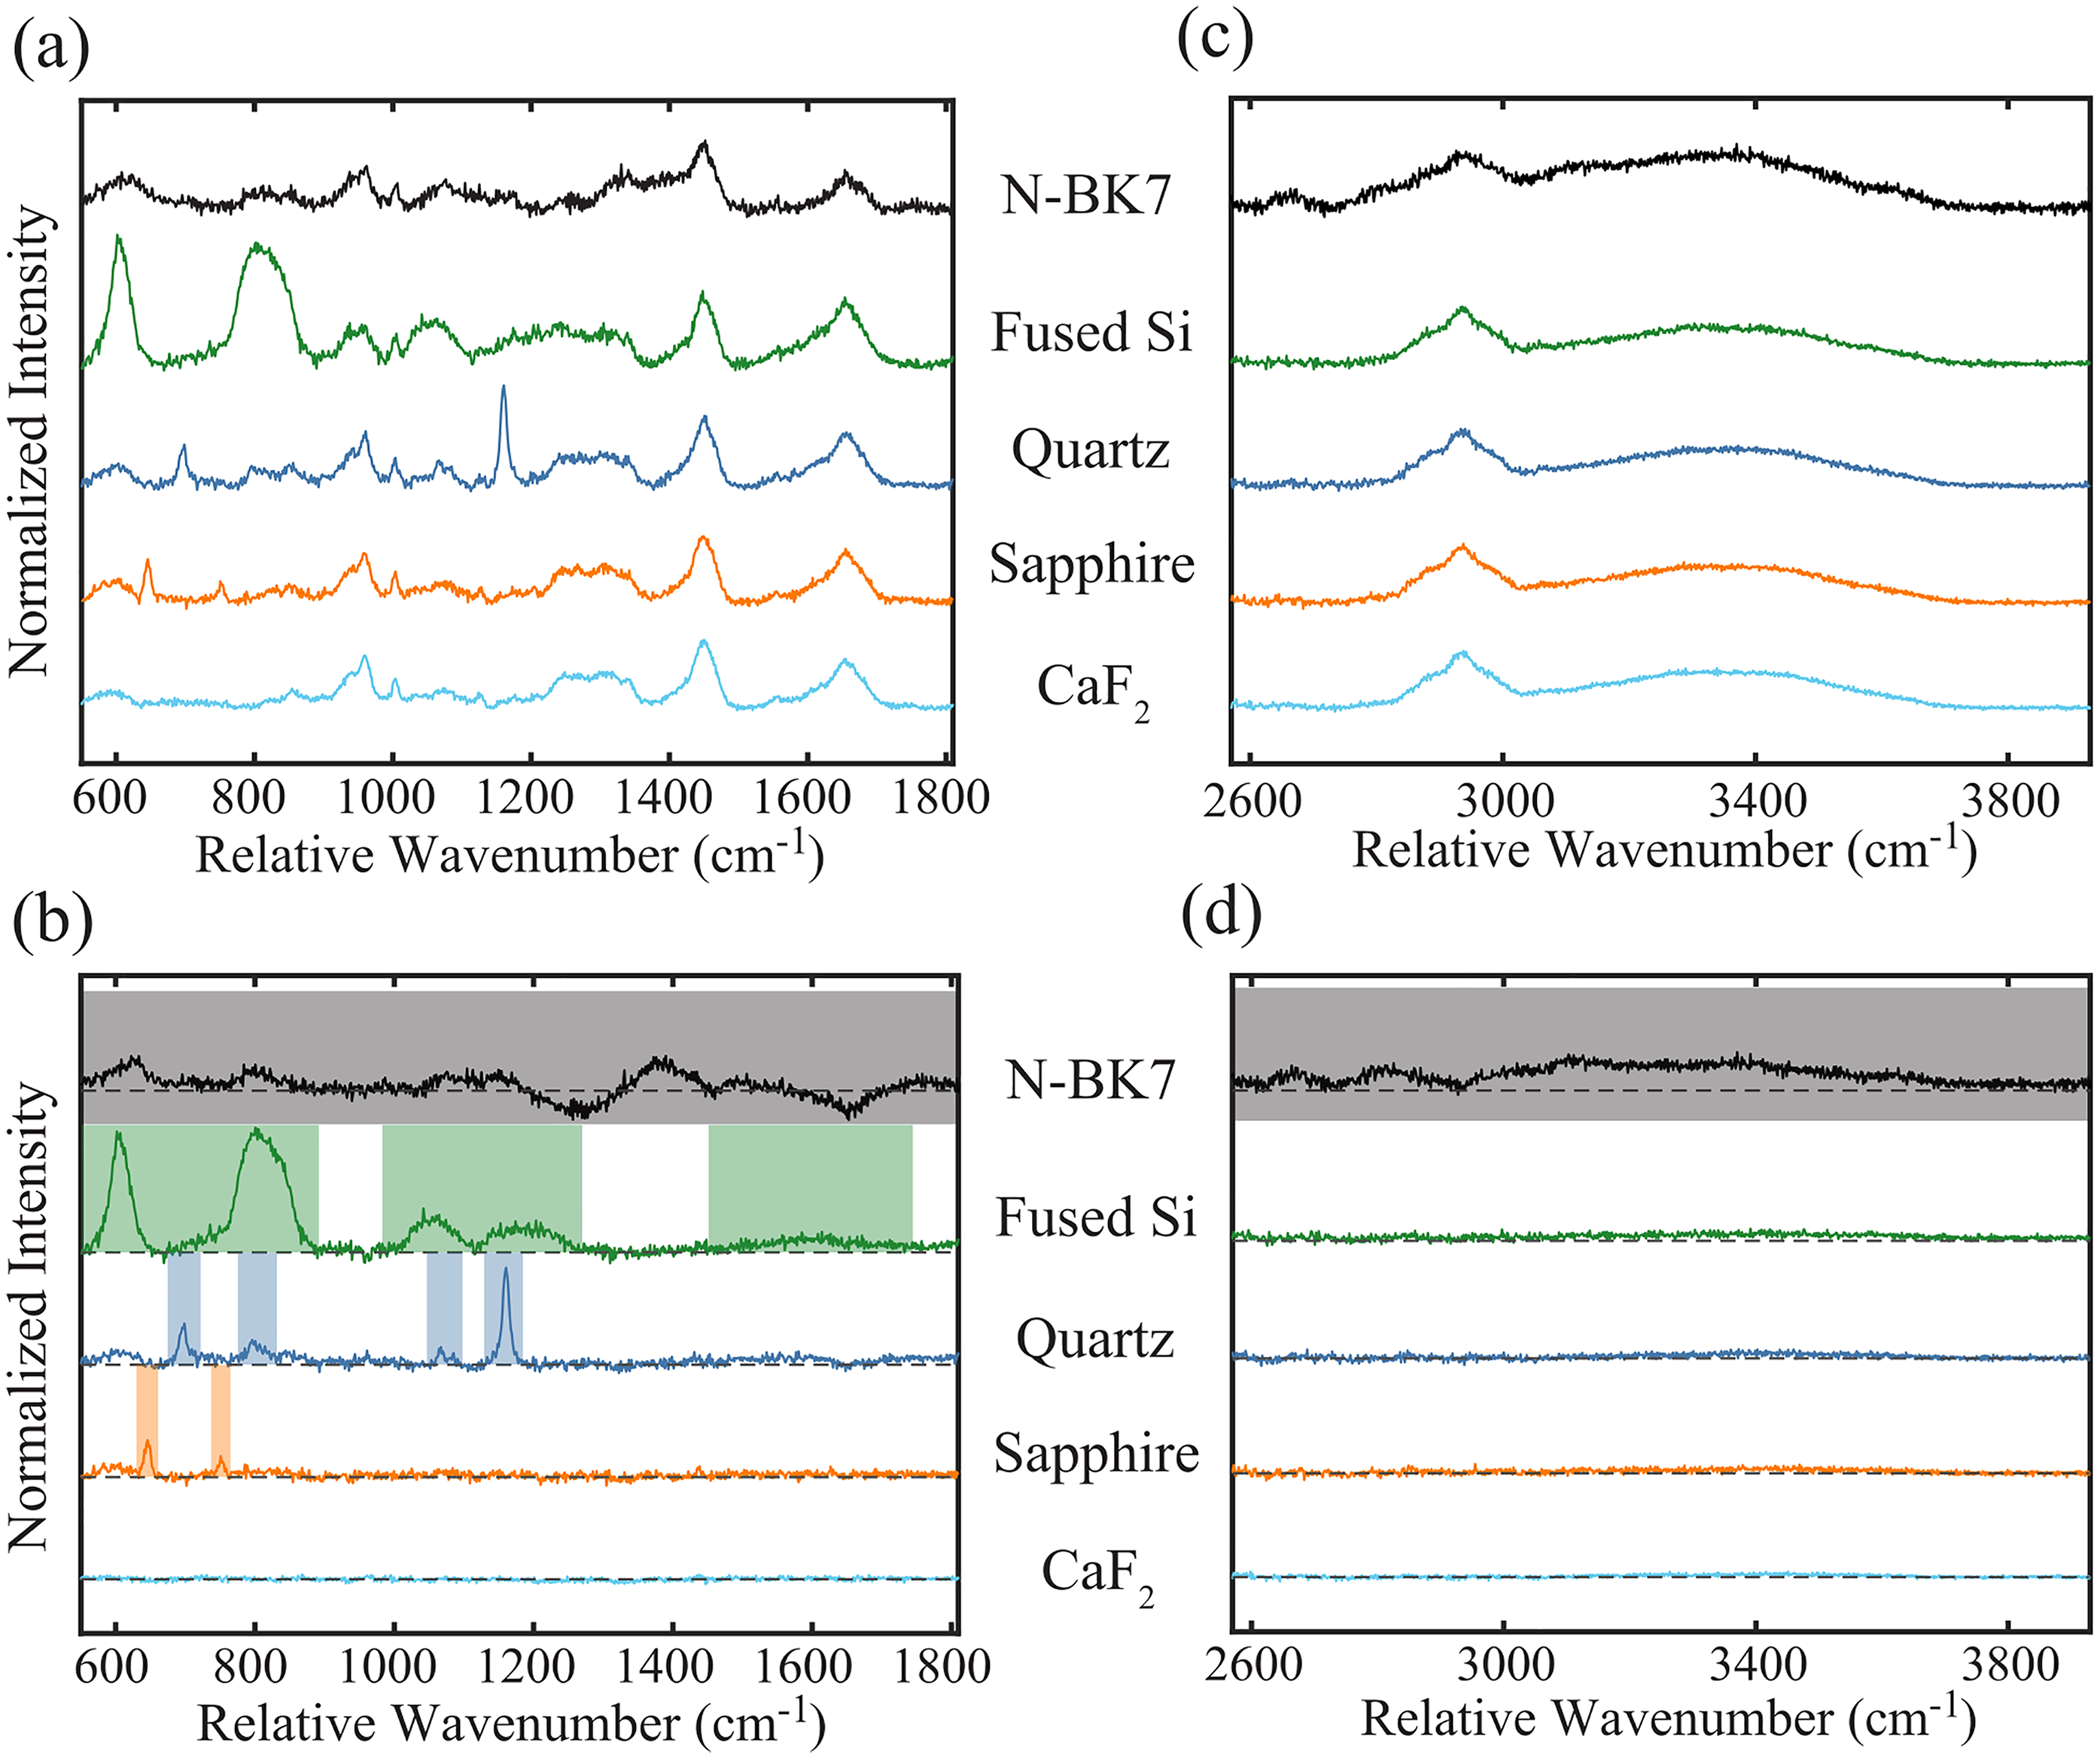
Normalized tissue Raman spectra measured with the miniature lenses, offset for clarity. (a) A single baseline-subtracted spectrum from each lens is shown for the FP region. (b) Difference FP spectra, plotted with the zero-crossing (dotted line) and highlighted regions associated with lens signal interference. (c–d) Similar lens and difference spectra from the HW region.
Lens Signal Quality from In-Vivo Tissue
The material characteristics of a lens used within a noncontact RS probe limit the resolvability of tissue Raman spectral features in three distinct ways. First, the intrinsic response of the lens to laser excitation may generate prominent spectral features arising from photoluminescence processes (e.g., fluorescence, phosphorescence) or Raman scattering. These features are detected in the tissue Raman spectrum and confound spectral analysis of tissue Raman features. Second, any broadband emissions from the lens add further background to the measured spectrum, thereby increasing the shot noise present in the signal. Lastly, the lens’ refractive index affects both the transmitted laser power reaching the sample and the amount of Raman scattered light collected from the sample due to reflective losses. These combinatory effects were quantified using SBR/SNR metrics of the tissue data collected by each lens. The signal quality metrics were calculated at 1440 and 2950 cm−1 for the FP and HW regions, respectively. Table I summarizes each lens's refractive index, light transmission percentage, RS spectral interference regions, and SBR/SNR.
Lens material properties and signal quality metrics for the FP and high HW regions. The SBR and SNR were calculated from the Raman spectrum of in vivo tissue.
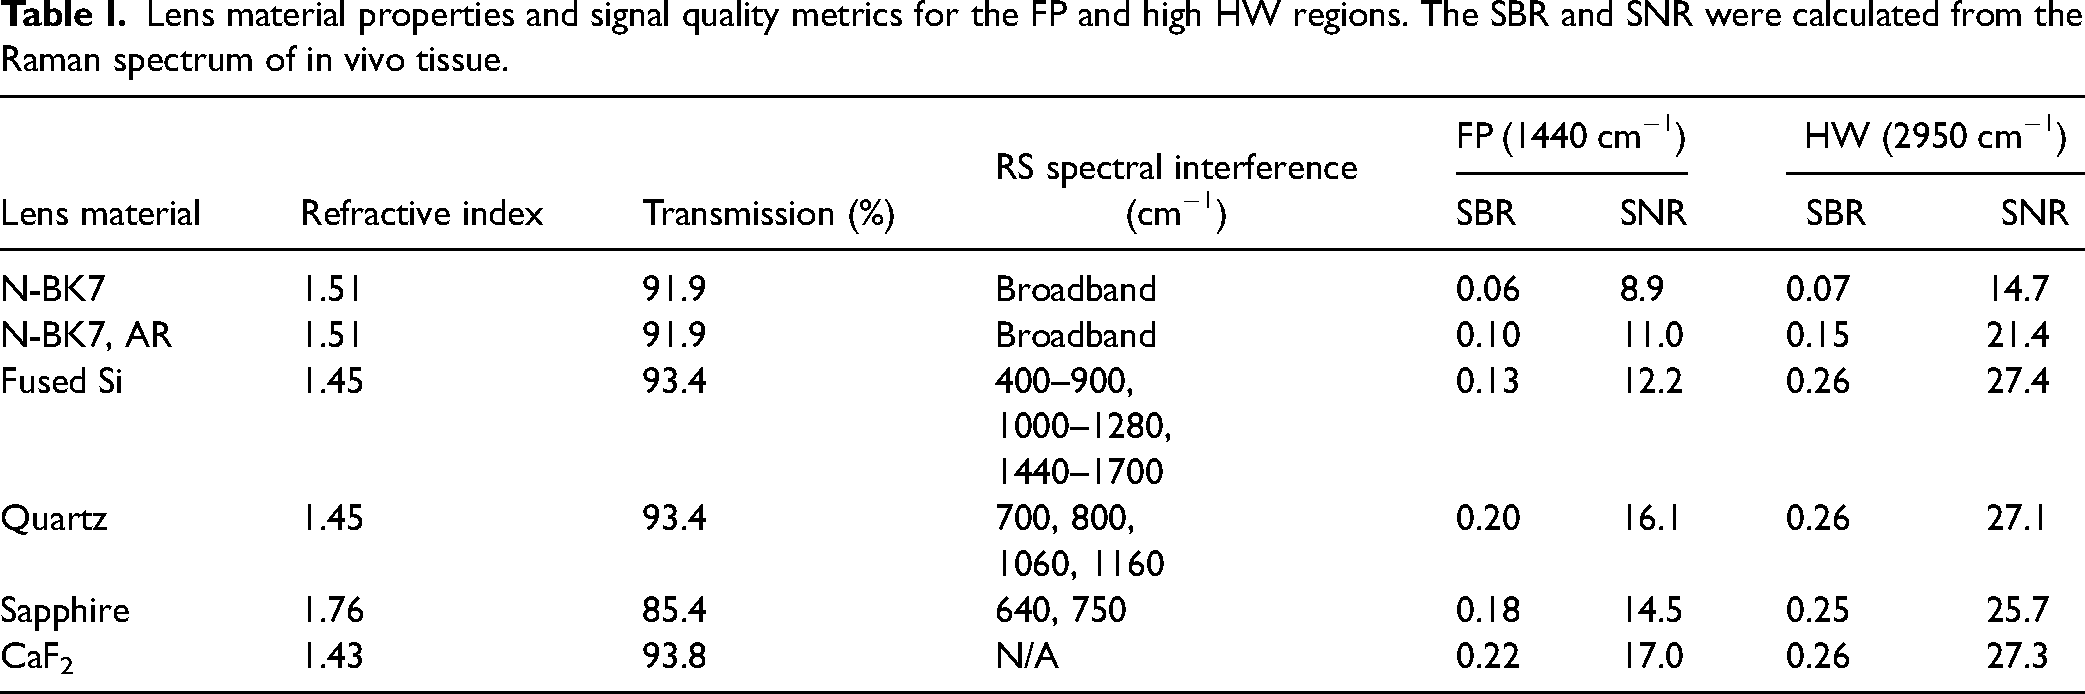
The N-BK7 glass lens, which generated the strongest spectral interference, presents the lowest SBR of the tissue Raman signal. This metric was similar between the FP and HW regions at ∼0.06. The increased proportion of background signal with glass thereby limited the SNR in the FP and HW regions to 8.9 and 14.7, respectively. Results show that adding AR coating minimized the glass lens background, allowing for an improved SBR and SNR. While this indicates that AR coating successfully decreases lens background, glass lenses remain suboptimal for an in vivo RS probe. The signal quality metrics for the non-glass lenses differed between the FP and HW regions. For example, fused silica presented multiple interfering spectral bands and a moderate overall background signal within the FP spectrum that decreased SBR and SNR compared to quartz, sapphire, and calcium fluoride (CaF2). Yet, fused silica behaved equivalently to the other lenses for HW data collection. Quartz held similar SBR and SNR to sapphire and CaF2 in the FP region, but it generated multiple specific Raman peaks throughout the FP region of similar relative intensity to tissue Raman features.
Due to their minimal interfering bands and superior SBR/SNR within both FP and HW regions, sapphire and CaF2 lenses offered the best signal quality for dual-region RS detection. However, sapphire’s higher refractive index compared to CaF2 moderately decreased the signal intensity and SNR and generated two weak Raman peaks at 640 and 750 cm−1. Overall, the CaF2 lens was shown to have optimal performance for detecting the FP and HW regions with the highest signal quality metrics among all tested materials. Therefore, it was chosen as the image relay lens for the noncontact RS probe prototype.
Noncontact RS Probe
A prototype of the noncontact probe design, depicted in Figure 5a, was fabricated that incorporates the RS fiber bundle and associated filters, CaF2 lens, a miniature color camera (NE2D_RGB, AMS Osram, Austria), and a 400 μm white light illumination fiber (M118L02, Thorlabs, USA). The lens was fitted inside a custom-machined, stainless-steel lens tube with a wall thickness of 0.1 mm that added negligible thickness to the diameter of the assembled probe. During assembly, this lens tube was positioned over the RS fiber bundle at the appropriate position to achieve beam focus at the intended working distance of 9 mm (Figure 5b). The camera and illumination fiber provide wide-field visualization of the device position during in vivo use, which were attached to the probe using a custom chuck that was 3D printed with biocompatible resin (RS-F2-SGAM-01, Formlabs, USA). This chuck was designed with a minimal footprint to accommodate the imaging components, increasing the long-axis diameter of the probe by only 1 mm. Broadband illumination of the imaging field was provided by a white-light LED (MCWHF2, Thorlabs). Figure 5c presents a picture of the assembled device, with components held together by epoxy and finally enclosed with medical-grade polyolefin heat shrink tubing (U2-016-CLR, Cobalt Polymers, USA) to organize the optical fibers and camera data cable.
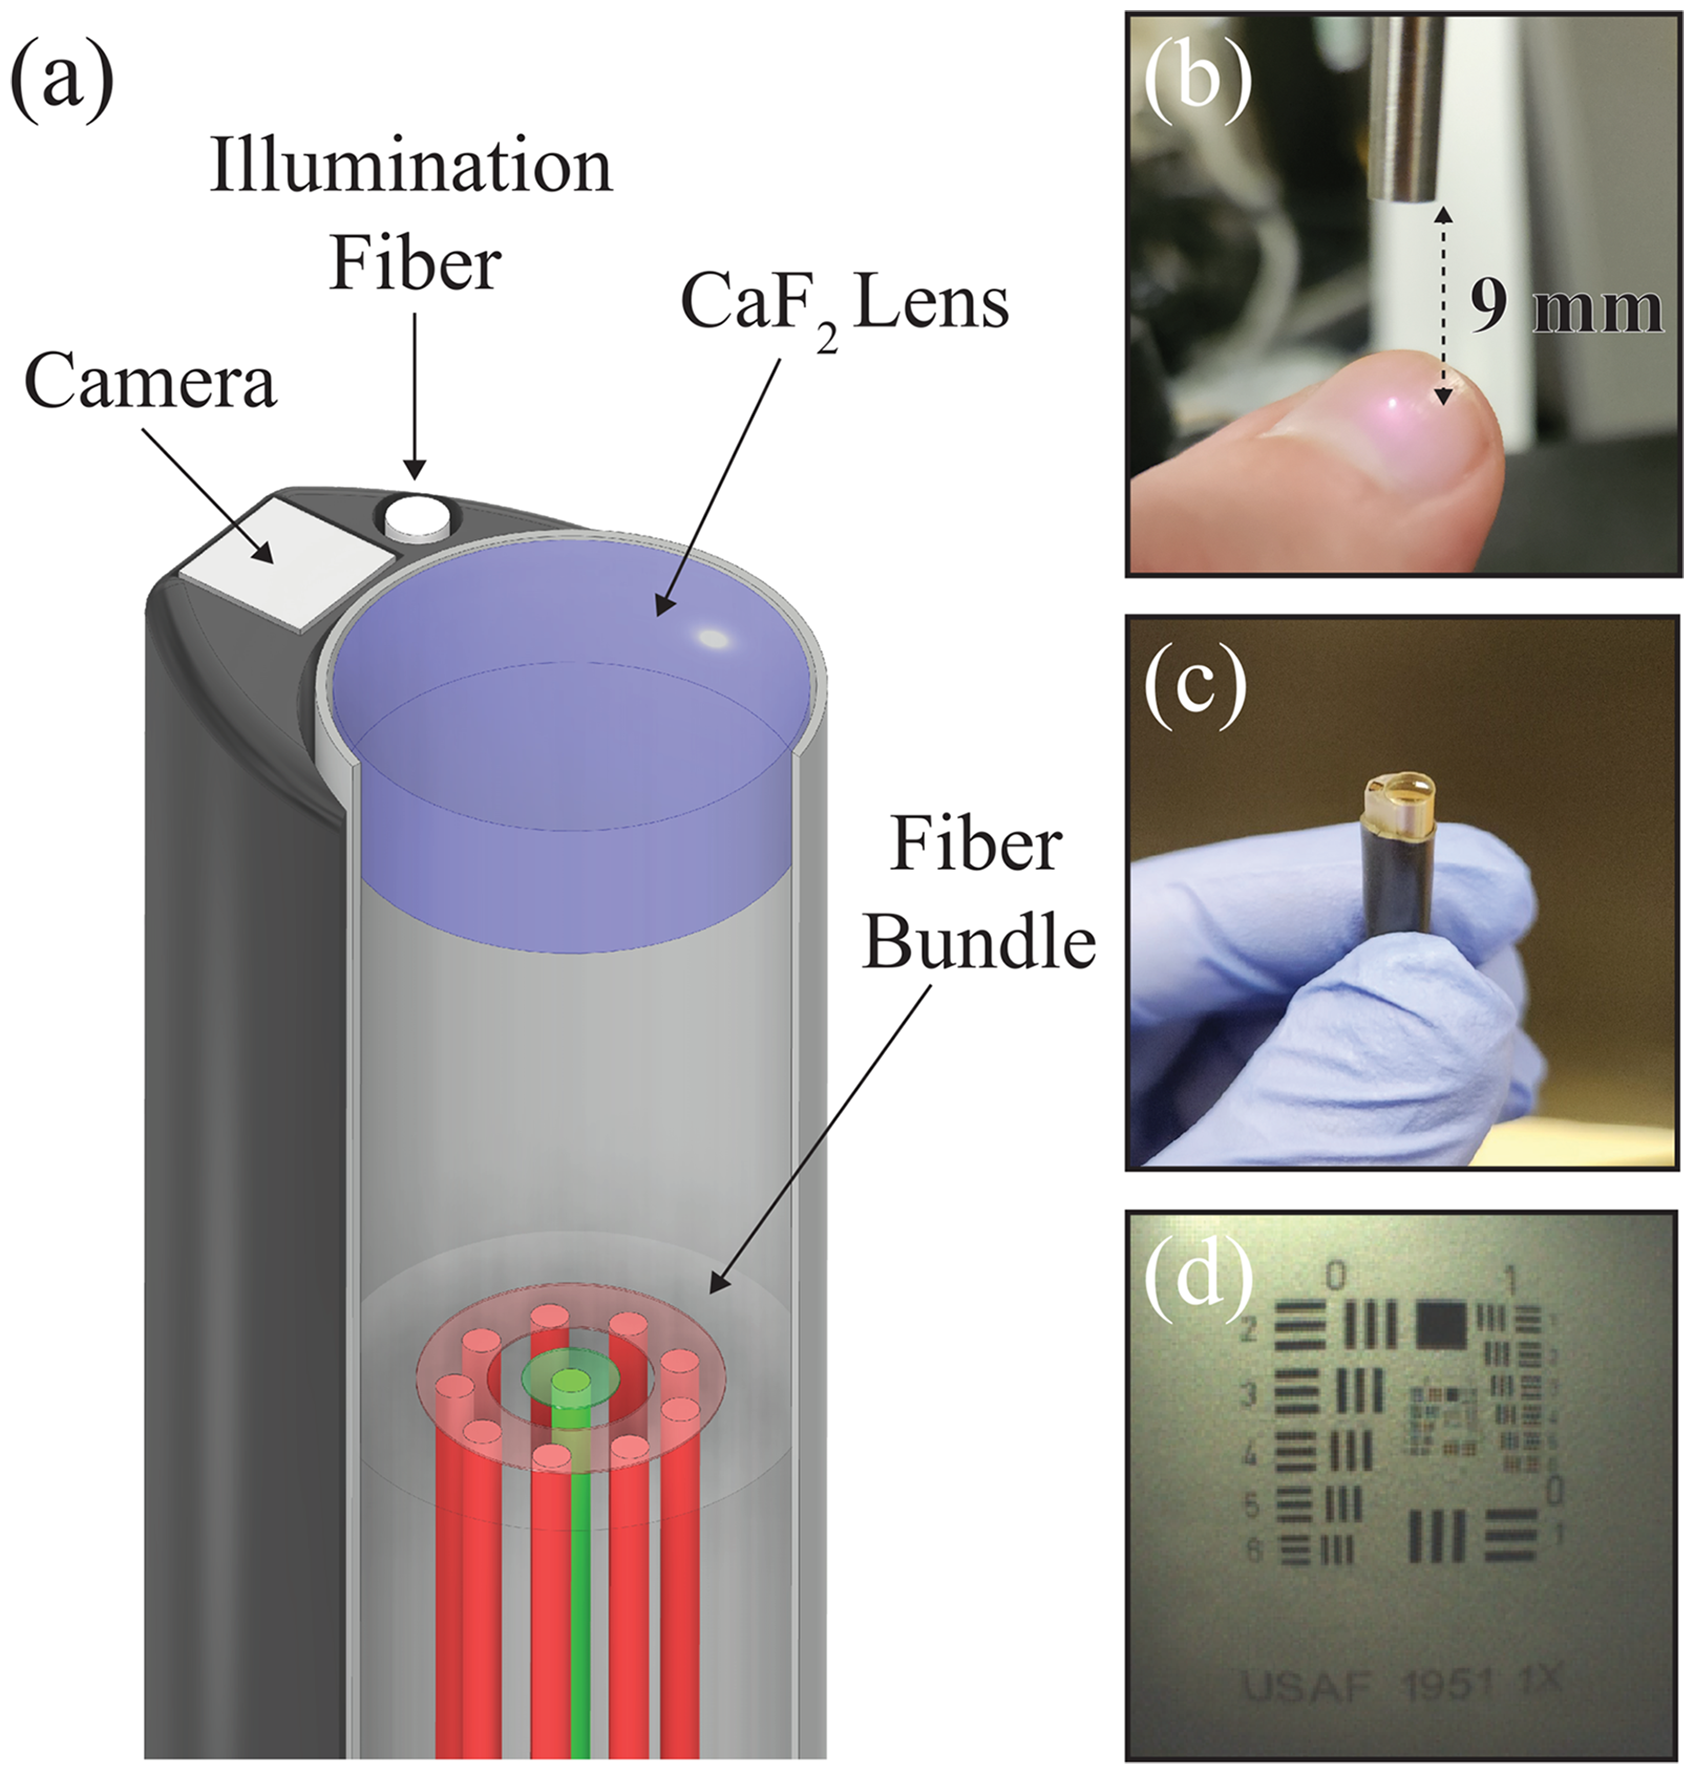
Prototype of the noncontact RS probe design. (a) Schematic of the device, including fiber bundle, CaF2 lens, miniature camera, and illumination fiber. (b) Lens to tube to secure RS lens. (c) Picture of the assembled device. (d) Camera view of Airforce target.
The compact dimensions of the miniature camera allowed this design to maintain a small diameter for in vivo applications but constrained its imaging capabilities. Figure 5d shows the camera positioned over an Airforce resolution target (R3L3S1PR, Thorlabs) at a 9 mm working distance, which could resolve Group 1 Element 3 and an associated imaging resolution of 2.52-line pairs per millimeter. The spot size of the focused RS laser was also limited by optical aberrations induced by the miniature RS lens, as expected by the FRED simulation of the focused spot profile. A beam profiler (WinCamD, DataRay, USA) was used to measure the beam spot size at the focus, which was determined to be 0.44 mm using the 1/e2 intensity criterion of a Gaussian model. Similarly, the standard probe illumination diameter at the 1/e2 intensity criterion was measured to be 4.5 mm at the intended working distance of 9 mm (Figure S2, Supplemental Material). Both spot size measurements agreed with the FRED simulation results, showing a near tenfold decrease in the local illumination zone at the sample surface with the noncontact probe.
A consequence of integrating the camera and illumination fiber into the probe tip for positioning guidance is that the white light and laser sources must be sequentially shuttered during RS spectral acquisition to avoid saturating the spectrometer. A custom acquisition environment was developed using Python to synchronize the light sources and readout from the spectrometer CCD through a serial communication protocol.
Camera Guidance
Camera guidance was tested on an arrangement of synthetic samples, where the wide-field imaging provided feedback to position the RS probing beam. This sample arrangement included ∼2 mm diameter pieces of acetylsalicylic acid, acetaminophen, polypropylene, and polyethylene atop a Raman-silent CaF2 slide (CAFP75-25, Crystran, UK). Raman spectra were acquired from five adjacent locations over each component, as described in Figure 6a. The average spectrum from these five adjacent locations is presented for the standard probe (Figure 6b) and the noncontact probe (Figure 6c). The resultant spectra demonstrate that the standard probe measured a mixture signal due to the 4.5 mm spot size of the RS laser in this configuration exciting multiple of the synthetic samples. In contrast, the focused laser spot provided by the noncontact probe repeatably measured the distinct Raman spectrum from each sample. Additionally, no signal was measured when the focused beam was positioned over the void at the center. This discrepancy in spatially isolating the signals is further visualized by the PCA plots in Figures 6d–e, which show superior clustering of the spectra with the noncontact probe.
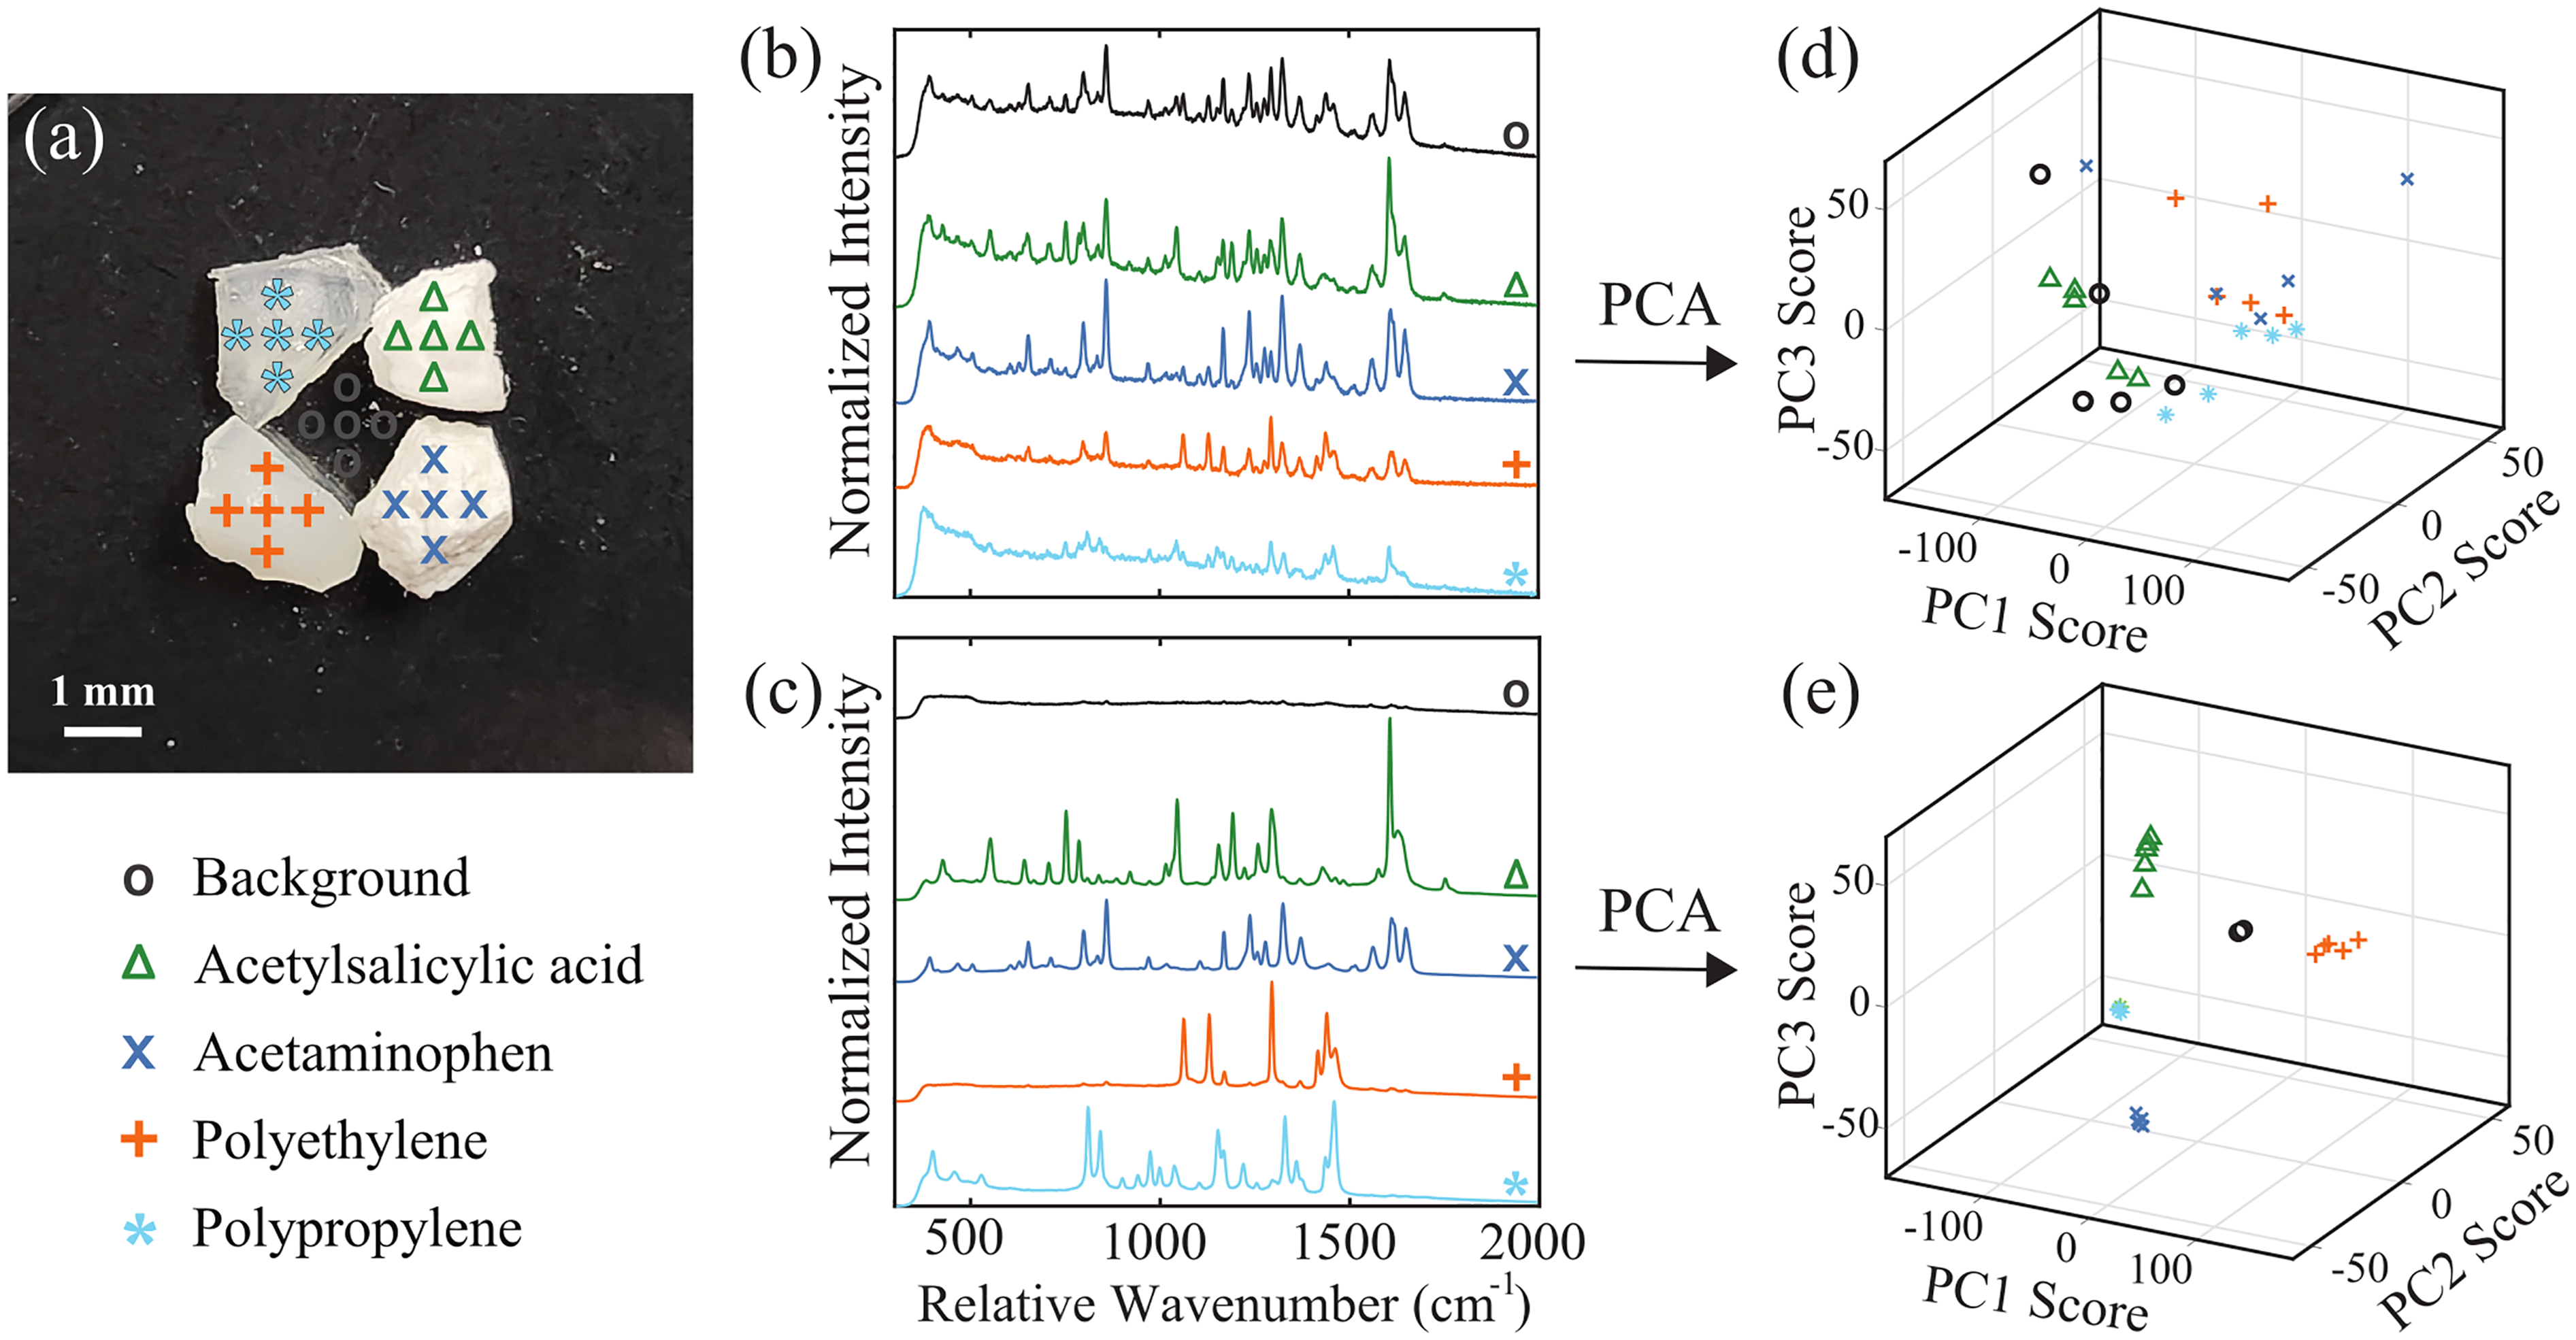
Comparison of spatial signal isolation for standard and noncontact RS probes. (a) Sample arrangement and measurement positions, including acetylsalicylic acid (triangle), acetaminophen (x), polyethylene (cross), polypropylene (asterisk), and background (circle). The average spectrum from each sample, normalized to the mean and offset for clarity, using (b) the standard probe and (c) the noncontact probe. (d–e) The associated PCA scores for the datasets.
Performance Validation
Light collection from a synthetic sample is unlike tissues due to differences in their associated optical properties and Raman scattering cross-sections. These sample-dependent effects may alter how efficiently Raman signals are coupled into the collection fibers and where those Raman scattered photons are generated within the tissue. So, the following sections will describe empirical measurements of how collection efficiency and spatial precision improve when the noncontact RS probe is used to analyze the Raman spectra of in vivo tissue.
Collection Efficiency
Collection efficiency was empirically measured at varied working distances over the forearm of a human subject, which was stably positioned under the RS probe. The standard and noncontact probes were secured in a chuck attached to a manual stage to control the probe-tissue offset. Raman measurements were acquired while the probes were axially translated away from the tissue surface in 1 mm increments to compare signal intensity to the FRED simulation results. Figure 7a shows the measured signal strength for working distances between 1–25 mm, where the average intensity of the measured spectrum was scaled to fit the FRED simulation results by minimizing the mean squared error as previously reported. 37 Figure 7b presents the raw spectrum measured by the standard probe in contact (solid black line) and at 9 mm working distance (dotted black line), as well as that measured by the noncontact probe at 9 mm working distance (blue line). Figure 7c provides the same data after background subtracted to isolate the Raman signal component, showing that the CaF2 lens successfully preserves all tissue-related spectral features and provides data equivalent to the standard probe. These results verify that the optimal configuration for maximum collection efficiency of in vivo RS spectra is achieved when the fiber bundle is in contact with the tissue. The noncontact probe, however, does provide an advantage in the collected signal intensity when the device is offset from the tissue surface.
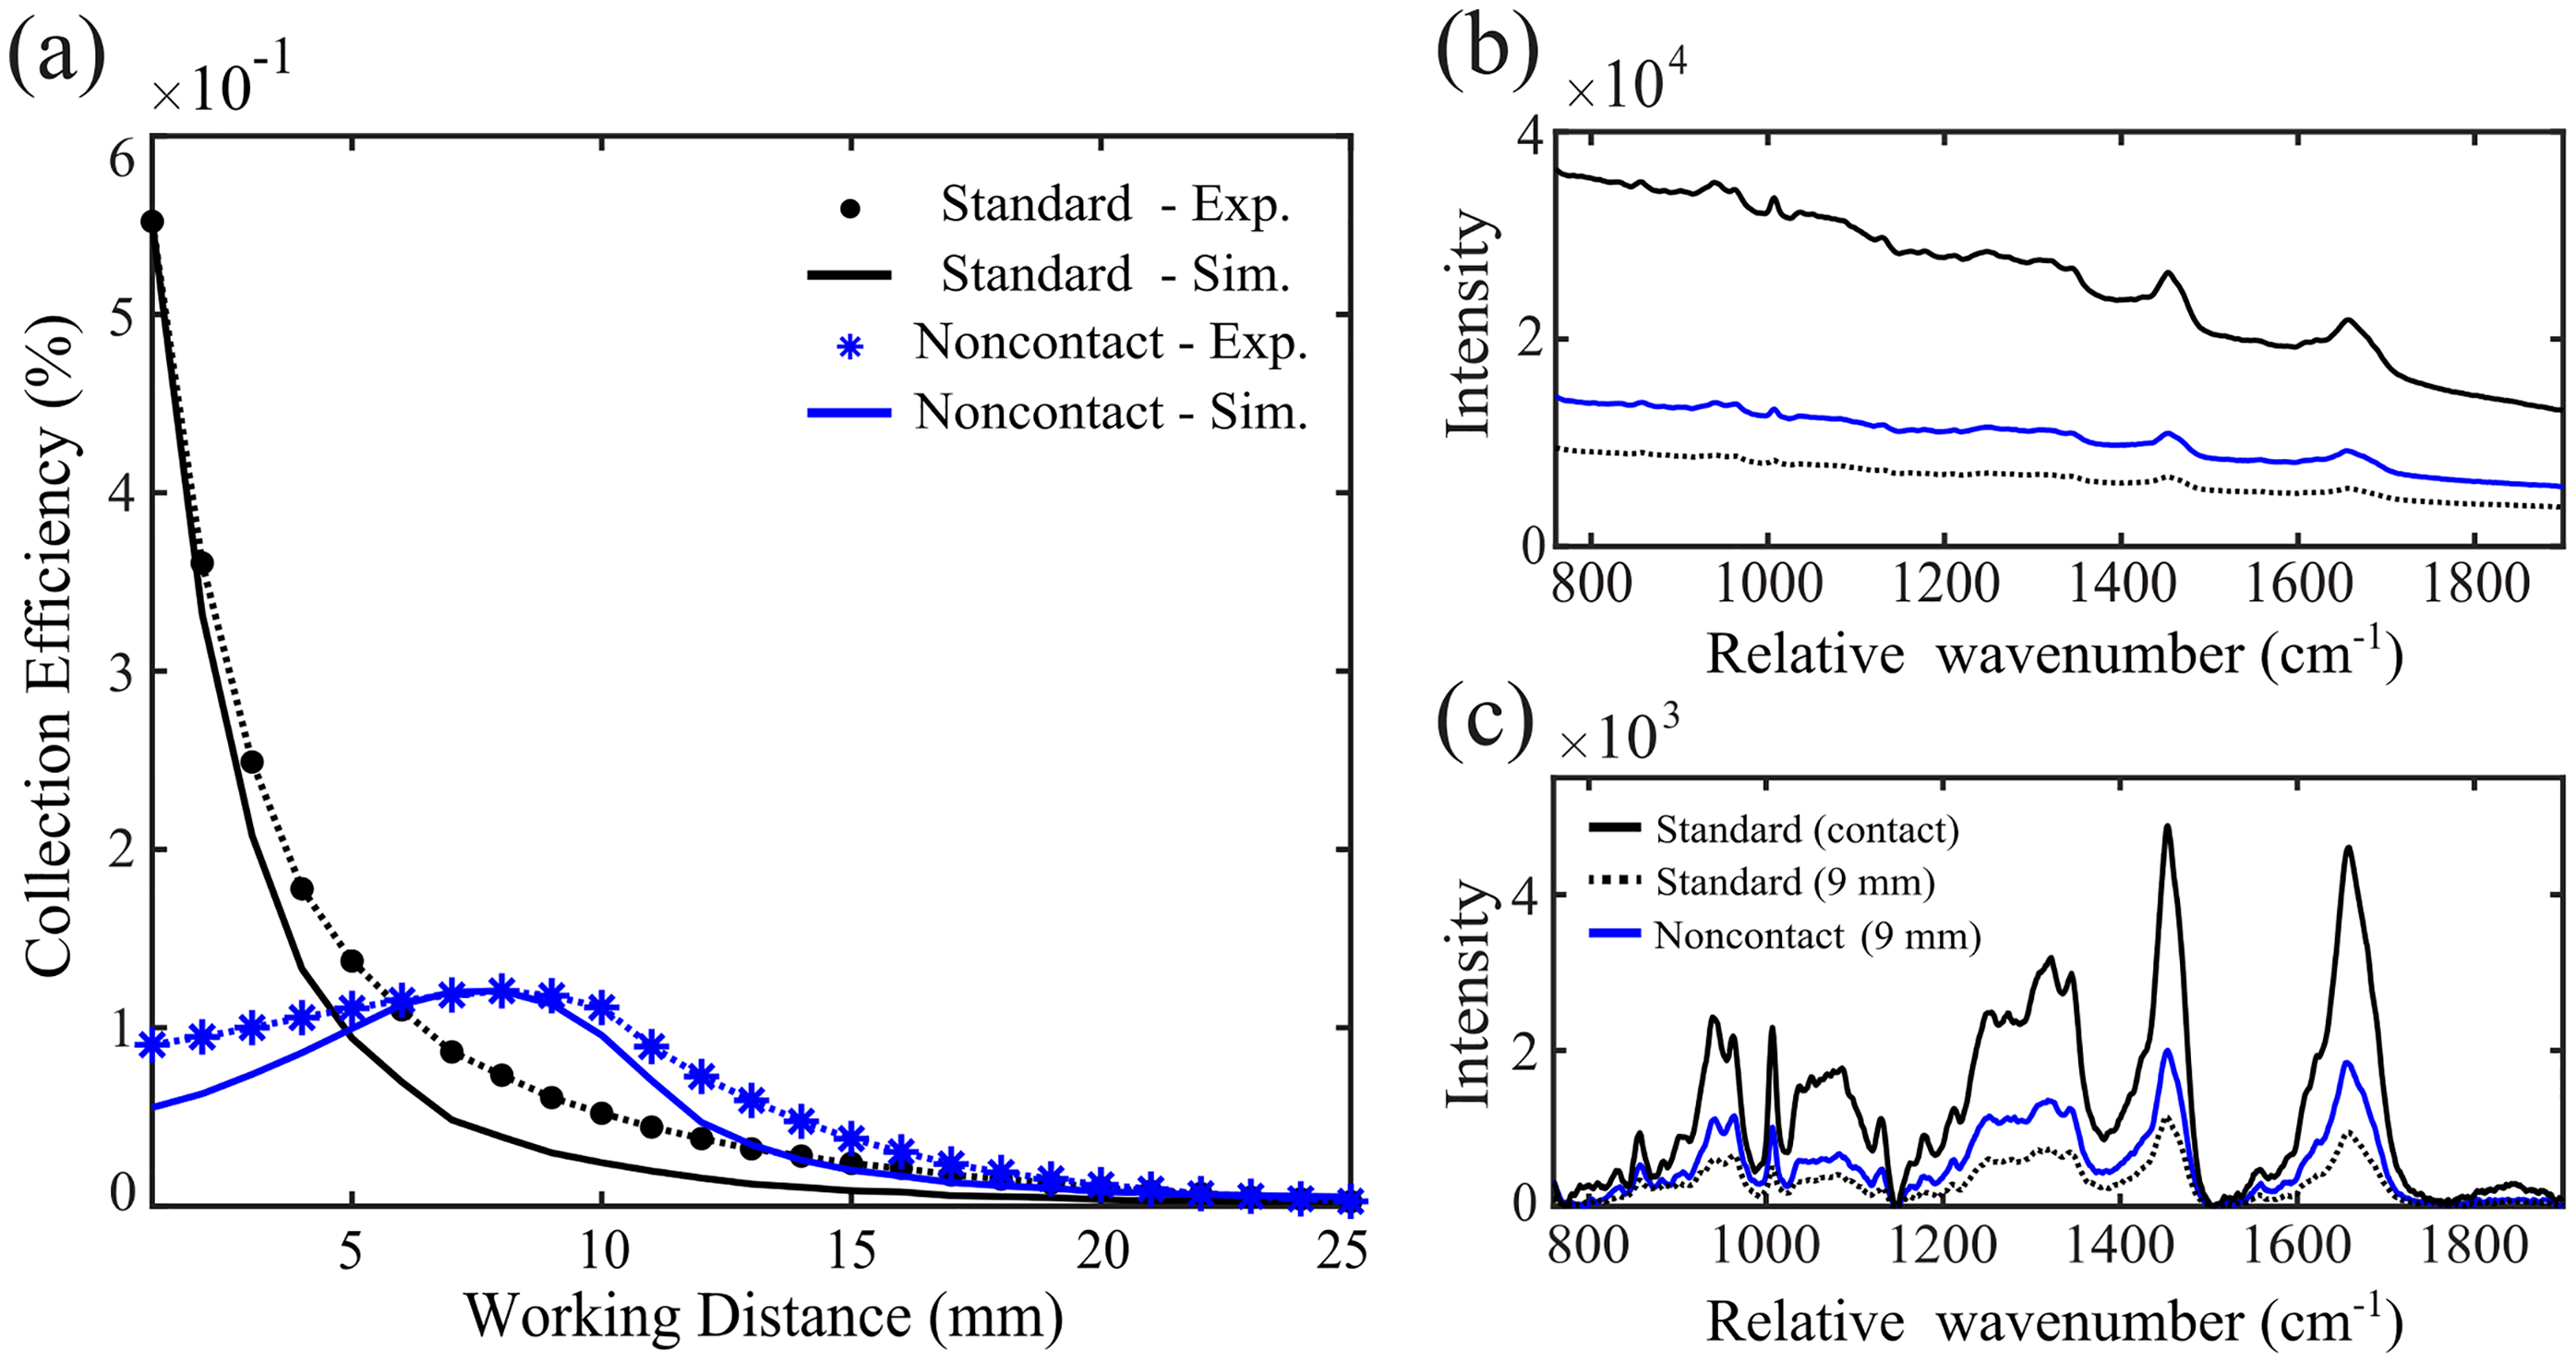
Simulated versus experimental collection efficiency. (a) Average signal intensity at variable working distance, measured at 1–25 mm offsets from tissue surface, is scaled to simulation results for the standard (circles) and noncontact (asterisks) probe. (b) Raw spectra from in vivo tissue with a standard RS probe in near-contact (black), and measurement at 9 mm working distance for standard (dotted) and noncontact (blue) probe designs. (c) Pre-processed RS spectra of the same conditions.
While the overall trends in collection efficiency were consistent with simulation, the fall-off in signal intensity versus working distance was not as drastic as predicted. In the simulation, collection efficiency of the noncontact probe was expected to increase by 200% compared to the standard probe at the 9 mm working distance, whereas it experimentally showed to increase by 90%. This could be due to manufacturing tolerances of the RS fiber bundle and lens, variances in the sample's optical properties, or limitations of the simulation in modeling surface roughness. Also, Raman scattering is typically modeled by isotropic scattering, 9 which was not incorporated into this stochastic light propagation model. These results also show that the diffuse nature of the Raman signal and collection geometry of the miniature imaging relay provides an extended range over which the signal intensity is at maximum for the noncontact probe, where RS signal intensity varied by only 5% within the working distance range of 6–10 mm.
Edge-Spread Response
Differences in laser confinement between the standard and noncontact RS probes was shown to impact the spatial specificity of the Raman signal in the Camera Guidance section above. A practical method to empirically measure this effect on a diffusely scattering material-like tissue is through the edge-spread response. This is performed by line-scanning the beam across the edge of a sample or a boundary with a sharp differential in composition, as previously reported for RS applications.38,39
Here, the RS probes were positioned over the fat-muscle boundary of a bovine tissue specimen at a 9 mm working distance to verify the benefit offered by the noncontact probe in differentiating local heterogeneities in tissue composition. Spectra were acquired as the sample was laterally translated in 0.25 mm increments with a manual stage for a total of 8 mm on either side of this transition zone (Figure 8a). The 1003 cm−1 peak is related to symmetric ring breathing of phenylalanine and is distinct to the muscle Raman spectrum, while the 1295 cm−1 peak is assigned to the CH2 twisting vibration indicative of adipose tissue (Figure 8b). The ratio of these two peaks was calculated at each scan position to generate the edge-spread response, which was fit with a sigmoid function and normalized between 0–1 (Figure 8c). The spatial precision in differentiating tissue composition was related to the width Δx over which the ratio intensity increases from 0.1 to 0.9 within the transition zone, which provides a reasonable estimate for lateral resolution. 40 This analysis revealed an edge width of 4.3 mm for the standard probe, which was comparable to the measured illumination diameter of 4.5 mm at a 9 mm working distance. The noncontact probe demonstrated an edge width of 1.1 mm, double the measured spot size of 0.44 mm. Therefore, the scattering properties of tissue were seen to limit the achievable localization of biochemical information. Still, the noncontact probe offers four times the improvement in lateral signal confinement relative to the standard probe.
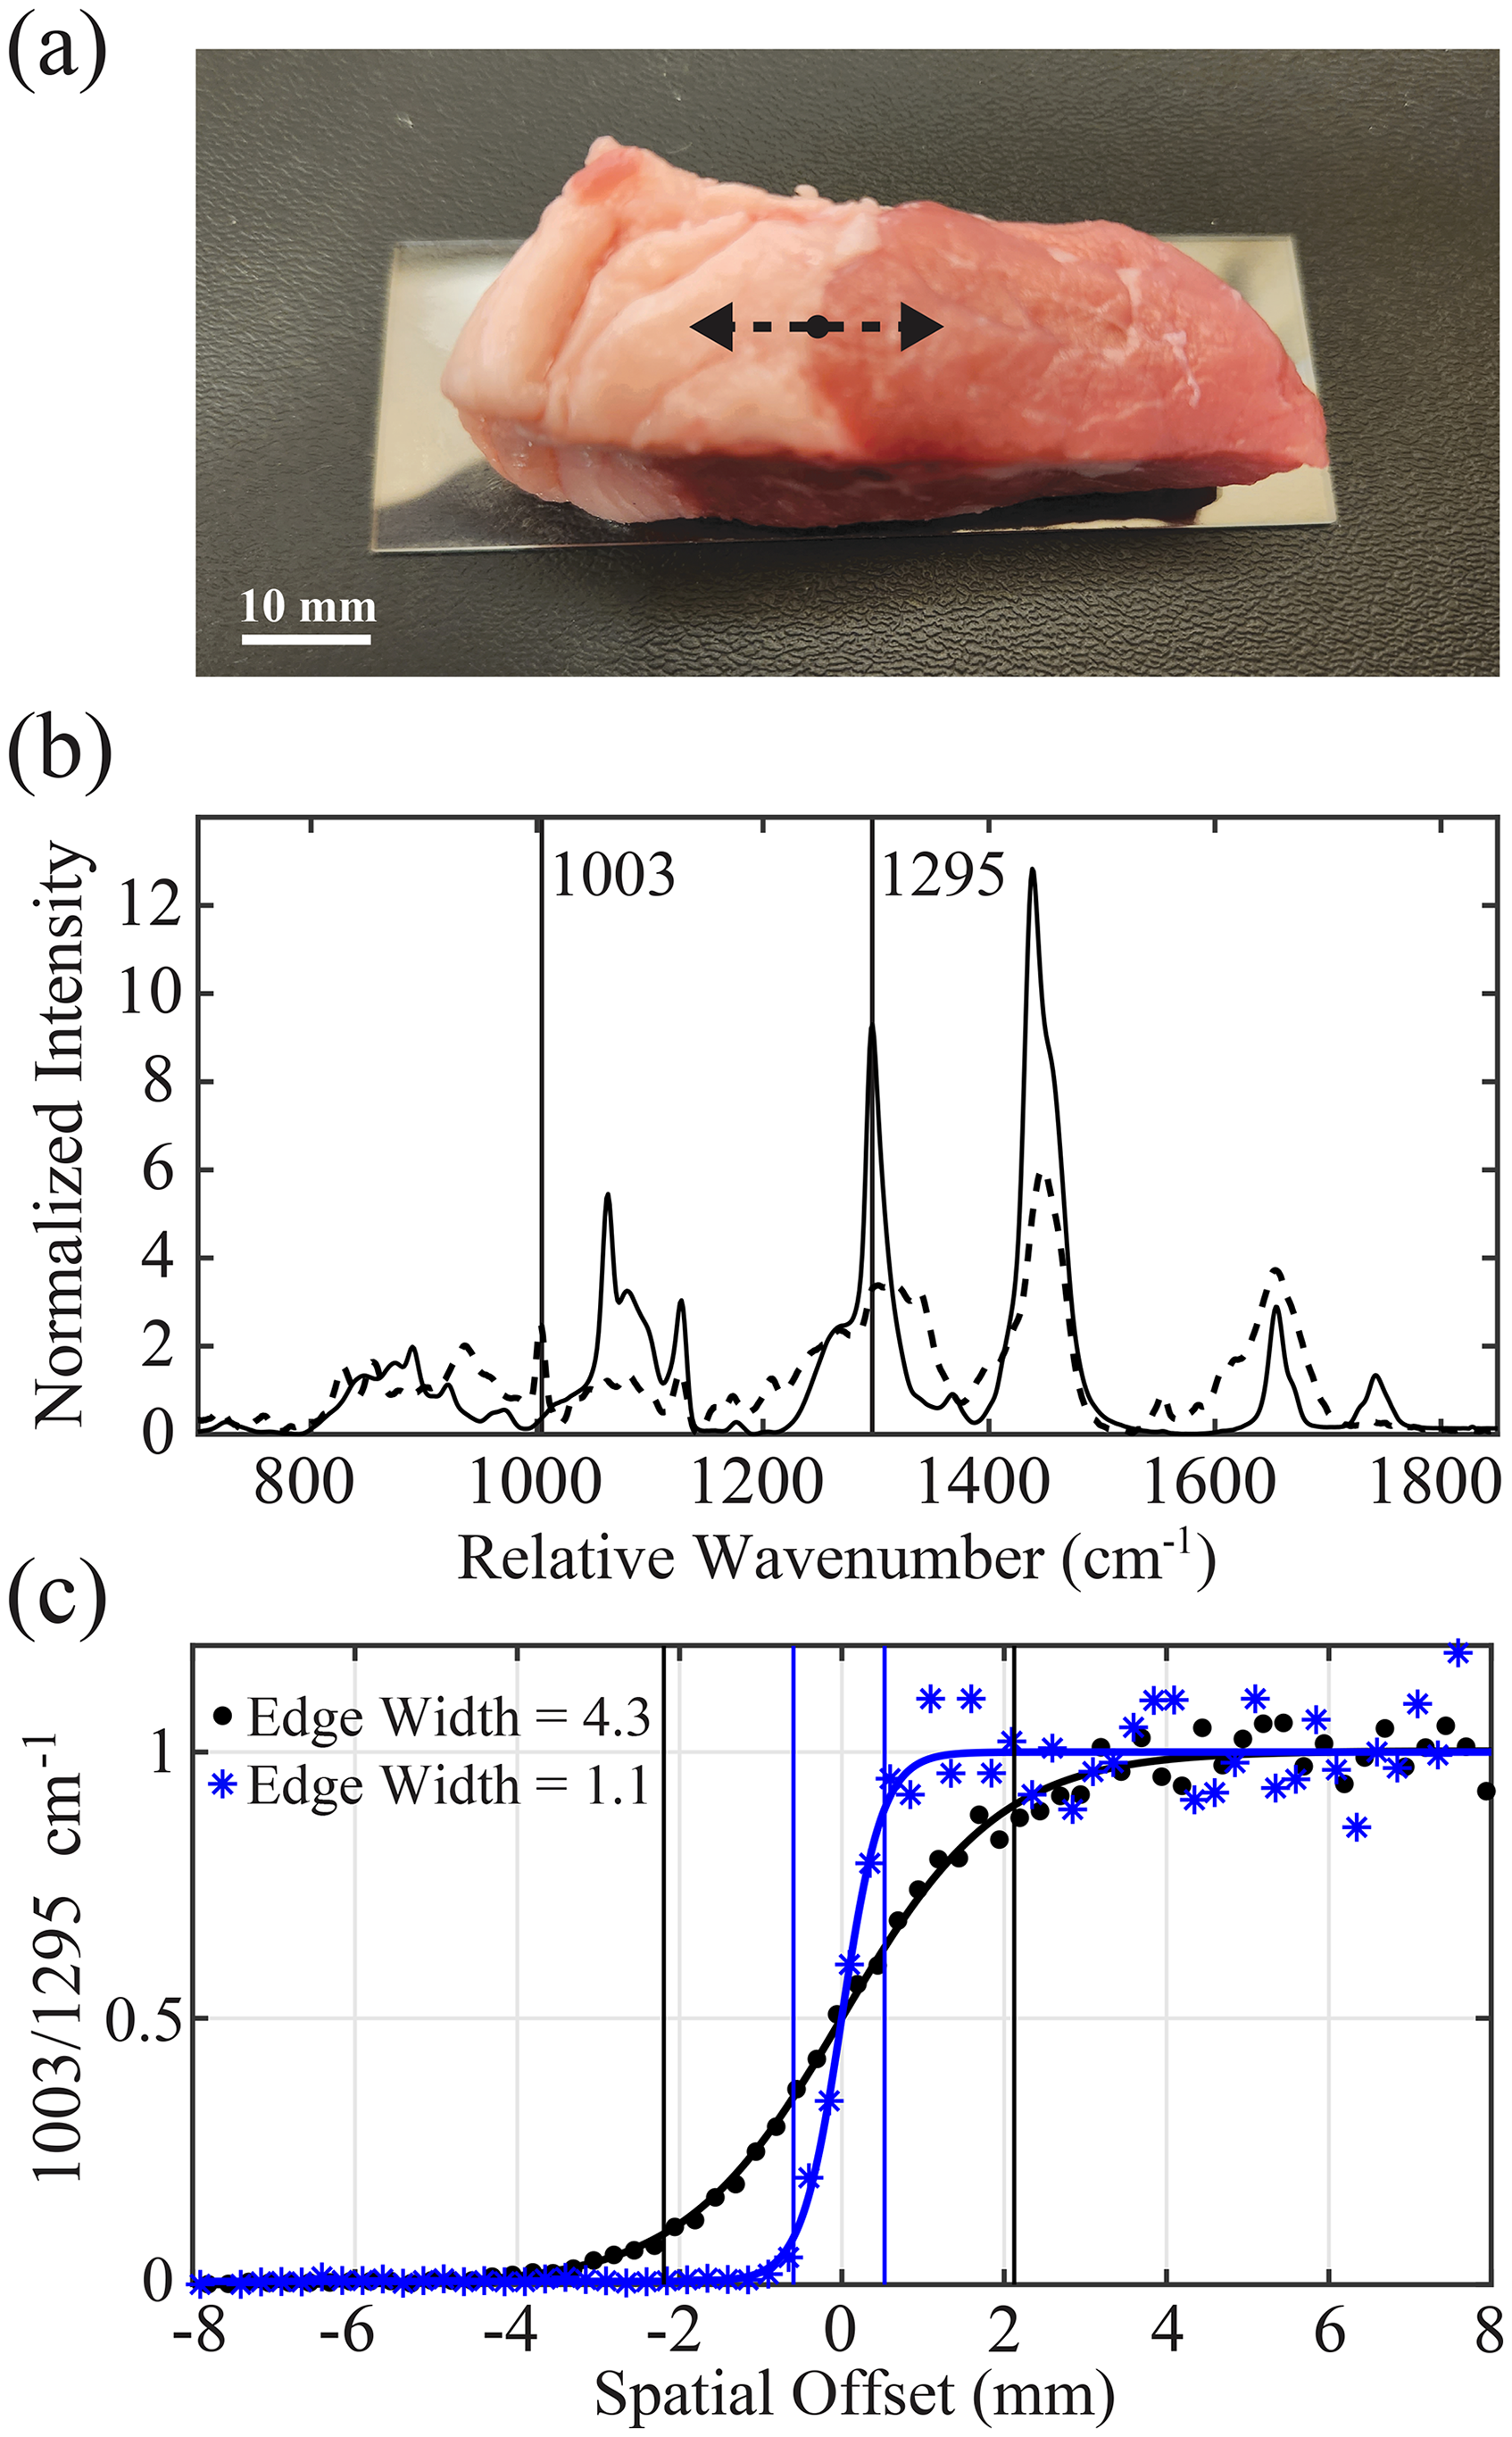
Edge spread response for estimating lateral signal confinement. (a) Bovine tissue specimen with fat-muscle transition and scan path (dashed arrow). (b) Spectra of the fat (solid) and muscle (dashed) zones and peak assignments used for the 1003/1295 cm−1 ratio metric. (c) Sigmoid fits of this ratio for the standard (circles) and noncontact (asterisks) probe.
Clinical Implementation
Promoting the adoption of RS into clinical practice requires maintaining a small diameter to improve its usability in routine patient care. Many realistic applications will involve guiding the probe through small body cavities or integrating into the instrument channels of clinical endoscopes, which typically have 2–4 mm diameters. Noncontact operation is also beneficial when analyzing delicate tissues or when sanitization is a priority. As a proof-of-concept, the presented prototype has a diameter of 4 mm without the camera module and could realistically fit into most adult colonoscopes. With the camera module, the handheld device provides a stand-alone solution for noncontact RS analysis of exposed tissues or to visually guide the probe through narrow structures like the ear canal, sinuses, colon, esophagus, or vaginal canal. If necessary, the diameter of the noncontact RS probe could be tailored by adjusting the working distance of the lens or fiber NA to support a given in-vivo application.
The optimal choice of lens material will depend on application-specific requirements. While CaF2 provided the highest signal quality for dual-region detection among the tested RS lens materials, it is a delicate crystal. CaF2 is relatively soft, which poses challenges in manufacturing custom lens geometries and makes it susceptible to scratching during long-term usage. It is also hygroscopic, which may lead to water absorption over time, especially with frequent use within moist body cavities or if device sanitization is required. These physical characteristics would lower the durability of this crystal for use as a fiber probe lens over time. Sapphire, a much harder and more stable crystal, may be an optimal choice if the Raman signal contributions at 640 and 750 cm−1 within the FP region do not constrain spectral analysis. Given the improvement offered by AR coating in minimizing background signal from the glass lens, crystalline lenses with such coatings should also be explored to optimize device performance further. An AR coating on a sapphire lens would be advantageous because of the high refractive index of this crystal, which induces more reflective losses of the Raman signal and was shown to impact SNR. Furthermore, if the application requires collecting only the HW region, then specialized crystals can be avoided. Fused silica is a cheaper and more commercially available lens material that was shown to perform equivalently to sapphire and CaF2 in collecting the HW region of the Raman spectrum.
The performance validation as described in the Collection Efficiency section above confirmed that collected signal intensity versus working distance agreed with the simulated trends for skin measurements. However, different tissues have unique absorption and scattering properties that may influence the device’s performance relative to a standard RS probe. FRED simulations were repeated using the associated optical properties of several tissue types that could benefit from noncontact RS scans, including colon, brain, and eye (Table S2, Supplemental Material).41,42 Simulation results indicate that tissues with higher scattering coefficients are expected to further improve collection efficiency of the noncontact RS probe compared to a standard probe at the designed working distance of 9 mm (Figure S5, Supplemental Material). However, more sophisticated simulations are necessary to understand the impact of unique penetration depths and optical scattering of excitation photons versus the detected Raman photons. The FRED simulations effectively embed Monte Carlo-based light propagation with the flexibility to model light collection through various optical elements, yet they fundamentally captured the excitation light's diffuse reflectance profile. In the future, specialized Monte Carlo approaches that simulate tissue Raman scattering and autofluorescence 43 will be investigated to assess and optimize the noncontact probe design at different excitation–detection regimes.
Finally, the presented prototype incorporated a miniature camera to guide the lateral positioning of the device during in vivo use but provides no feedback on the axial position relative to the tissue surface. Inconsistencies in probe-tissue offset may limit signal repeatability and spatial localization of spectral features. Range-sensing optical strategies could provide the operator with additional information on the active working distance of the probe. Some examples include low-coherence interferometry to measure depth-resolved reflectance 44 or focal length divergence measurements that utilize the spot size of the beam seen by the guidance camera to estimate probe-tissue offset, 45 which were not explored here but will be investigated for future development.
Conclusion
The performance of a standard RS volume probe suffers during noncontact operation due to decreased collection efficiency and expanded laser illumination on the sample. Here, the development process of a small-diameter noncontact RS probe demonstrated that an imaging optic can circumvent these limitations and effectively measure both FP and HW regions of the Raman spectrum at a distance from the tissue surface. Results showed that silica optics are inferior for Raman spectral acquisition due to aberrant signal contributions that limit the ability to resolve tissue RS spectral features. CaF2 and sapphire were identified as optimal lens materials for dual-region detection, while fused silica or quartz could adequately resolve the HW region. A clinically compatible prototype with a wide-field camera module provides positioning guidance during in vivo use while maintaining a small diameter of 4 × 5 mm. The performance of this device during noncontact operation was experimentally validated on in vivo tissues, which showed improved collection efficiency and enhanced spatial resolution compared to a standard probe. In the future, the effectiveness of this noncontact RS probe for routine tissue diagnostics will be assessed to determine its clinical utility.
Supplemental Material
sj-docx-1-asp-10.1177_00037028251367062 - Supplemental material for Noncontact Fiber Optic Probe for Clinical Applications of Raman Spectroscopy
Supplemental material, sj-docx-1-asp-10.1177_00037028251367062 for Noncontact Fiber Optic Probe for Clinical Applications of Raman Spectroscopy by Sean Fitzgerald, Eric Marple, Jay Werkhaven and Anita Mahadevan-Jansen in Applied Spectroscopy
Footnotes
Acknowledgments
The authors are grateful to Alec Walter (Vanderbilt University, Nashville, Tennessee, USA) for the useful discussions and textual edits of this work.
Declaration of Conflicting Interests
The authors declared no potential conflicts of interest with respect to the research, authorship, and/or publication of this article.
Funding
The authors disclosed receipt of the following financial support for the research, authorship, and/or publication of this article: This work was supported in its entirety by the National Institutes of Health under grant no. R01EB028615.
Data Availability
Data underlying the results presented in this paper are not publicly available at this time but may be obtained from the authors upon reasonable request.
Supplemental Material
All supplemental material mentioned in the text is available in the online version of the journal.
References
Supplementary Material
Please find the following supplemental material available below.
For Open Access articles published under a Creative Commons License, all supplemental material carries the same license as the article it is associated with.
For non-Open Access articles published, all supplemental material carries a non-exclusive license, and permission requests for re-use of supplemental material or any part of supplemental material shall be sent directly to the copyright owner as specified in the copyright notice associated with the article.