
Abstract
Significant dehydration can increase thermoregulatory and cardiovascular strain and impair physical and cognitive performance. Despite these negative effects, there are currently no objective, non-invasive tools to monitor systemic hydration. Raman spectroscopy is an optical modality with the potential to fill this gap because it is sensitive to water, provides results quickly, and can be applied non-invasively. In this work, high wavenumber Raman spectroscopy has been developed toward detection of systemic hydration via validation with tissue-mimicking phantoms, followed by three in vivo feasibility studies to investigate the relationship between spectral features and systemic hydration. The area under the curve (AUC) of the water bands and the ratio of water bands to CH bands are Raman-derived metrics that can be used to describe systemic hydration. Here, we determined a trend in decreasing water bands AUC after exercise, although the magnitude of the change was highly variable. In investigating the sources of variability, we identified significant inter-subject variability and a failure of current clinical standards to benchmark our developed technique against. Despite the high variability, we found that multiple anatomical locations were suitable for collecting the spectral measurements. While the high degree of variability may confound the use of Raman spectroscopy for non-invasive hydration monitoring, when implementing additional study standardization, significant differences (p <.05) in spectral metrics can be identified before and after exercise. Raman spectroscopy can allow for rapid, non-invasive detection of systemic hydration, which would improve routine hydration monitoring and reduce the incidence of negative side effects associated with dehydration.
This is a visual representation of the abstract.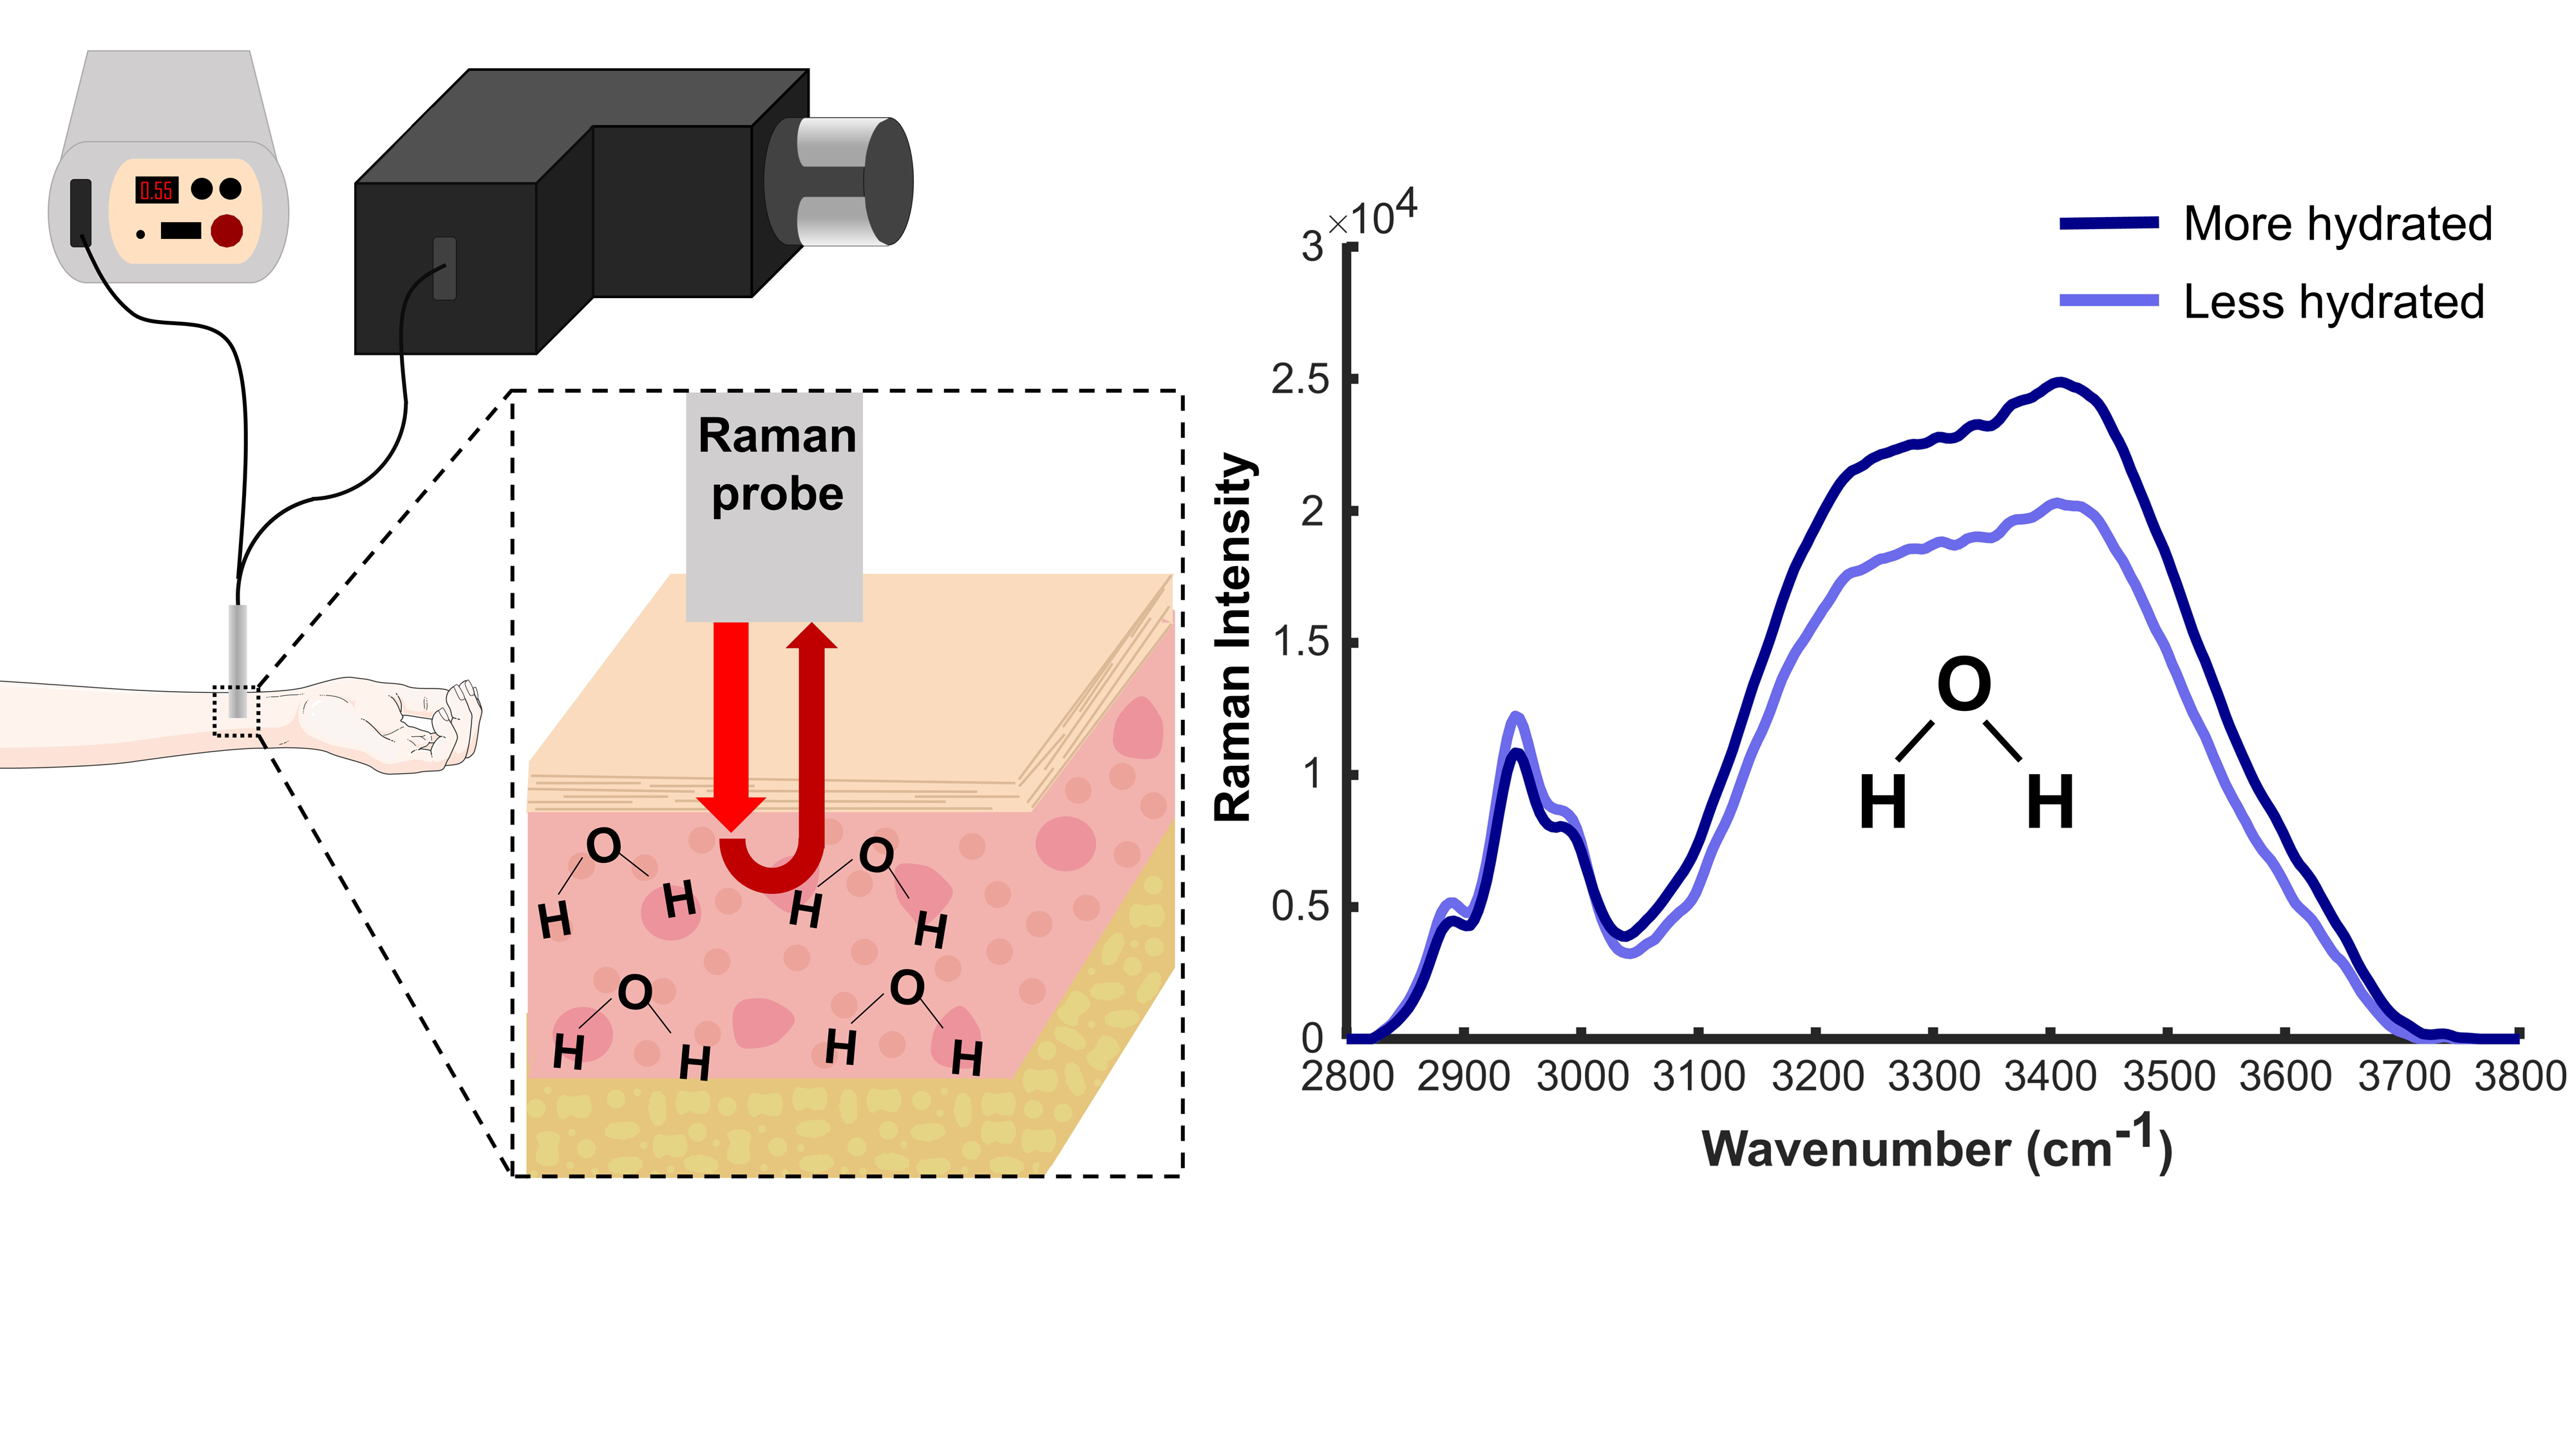
Introduction
The lack of tools to rapidly and non-invasively assess hydration status in real-time limits the effectiveness of preventing severe dehydration across a wide spectrum of clinical, athletic, and occupational settings. Dehydration has severe physical and cognitive effects, including increased thermoregulatory stress and cardiovascular strain and impaired memory and reaction time. 1 The ability of the body to regulate temperature is reduced by dehydration, and core body temperature increases as dehydration increases. 2 Dehydration has been shown to significantly increase heart rate and decrease mean arterial pressure and cardiac output. 3 Various other physiological systems including the gastrointestinal, urinary, and integumentary systems have been shown to be negatively affected by dehydration.4–8 Cognition has been shown to decline with increasing dehydration across numerous age groups.9–13 Inadequate hydration also leads to a decrease in physical and cognitive function, including strength, endurance, and hand–eye coordination.1,14–17 The thirst reflex, or the sensation of being thirsty in response to dehydration, may not be sufficient in preventing dehydration, in scenarios such as exercising in extreme heat, high-intensity exercise, and in the elderly population. 18 Military personnel may also be at high risk for severe dehydration due to high-intensity activities and harsh environmental conditions; this may inhibit their ability to perform their duties caused by dehydration-related physical and cognitive decline. 19 Thus, in these scenarios, without routine hydration monitoring, significant dehydration may occur leading to the negative effects previously detailed. 18 Finally, chronic dehydration, which is common in the elderly population and children, can have serious health consequences yet often goes unrecognized.20,21 Routine monitoring can help reduce the negative effects of dehydration caused by acute and chronic dehydration.
There is currently no single hydration assessment technique accepted as a gold standard that does not require invasive procedures or laboratory-level analysis. While analysis of total body water via isotope dilution or neutron activation analysis is sometimes considered the gold standard, this process is time-consuming and labor-intensive, making it impractical for routine or repetitive use. 22 More traditional and commonly used methods to measure hydration include plasma osmolality, urine osmolality, urine specific gravity, salivary flow rate, and body mass change, but none of these methods are both rapid and non-invasive. Plasma osmolality measures the solutes present in plasma, requires whole blood sample collection by a trained phlebotomist and analysis in a laboratory, and may only be sensitive to severe fluid loss. 23 Urinary measures are simpler to collect but reflect all the urine that has accumulated in the bladder since the last bladder void, rather than providing real-time hydration status. Additionally, urine metrics can be affected by bolus fluid intake or lag in response to body water losses. 24 Saliva markers have shown high variability and are easily confounded when fluid and food intake is not restricted. 25 Finally, pre- to post-exercise change in body weight is one of the easiest and most used methods, where fluid loss is represented by calculating the change in body weight before and after the study protocol or exercise regimen. Despite its ease of use, many factors must be taken into consideration, including food and beverage intake and urinary or fecal matter gains and losses, and may be confounded by failing to account for respiratory tract water loss and shift of water state via the metabolism of macronutrients. 26
Emerging techniques to measure hydration status continue to evolve and include ultrasonic assessment of hydration and chemical sensors for sweat or saliva analysis.27–33 There are significant limitations of all current hydration monitoring techniques; thus, there is a need for the development of a rapid, non-invasive technique for assessing hydration status. Optical techniques are potentially advantageous for hydration monitoring due to their rapidness and non-invasive nature. Recent advancements in this area include the development of an imaging platform to assess capillary-refill time for assessing significant dehydration in pediatric patients reported by Shavit et al. 34 This technique has only been demonstrated for severe dehydration, and it may not be able to measure lower levels of body water loss. Near-infrared spectroscopy has been a popular area of interest in the optical analysis of hydration but mainly focuses on skin hydration. Water has strong absorption around 1450 nm, and this principle has been utilized to investigate skin hydration in many studies.35,36 While near-infrared spectroscopy has been applied to study skin hydration, there is currently no link between skin hydration and systemic hydration. 33 Finally, speckle-based detection of hydration status has been proposed by Ozana et al., but this study cited a significant limitation of various blood chemicals potentially confounding the hydration measurement. 37
Raman spectroscopy (RS) is a sensitive and non-invasive optical modality that shows potential for real-time hydration monitoring. RS is an inelastic scattering technique that provides information related to the biochemical components of a sample and is advantageous over other techniques due to its sensitivity and measurement speed.38,39 The Raman spectrum is made up of two regions, the fingerprint region (FP) from 500 to 1800 cm−1 and the high wavenumber region (HW) from 2800 to 3800 cm−1. 40 While the FP region is most commonly used for biological sample analysis, there is limited water information available in the FP region, as the water features in the FP region overlap with strong protein and lipid features (∼1640 cm−1). 41 On the other hand, high wavenumber RS shows rich water information relating to OH stretching between 3000 and 3800 cm−1.40,42 This region allows analysis of water content and the dynamics of water hydrogen bonding.40,43,44
Previous use of RS for water analysis has focused on localized determination of water content including assessing brain edema, analyzing tumors, determining bone mineral ratios, and identifying natural moisturizing factors in skin. RS has been demonstrated to accurately predict the percentage of water in brain tissue by utilizing partial least squares regression. 45 The use of RS for intraoperative assessment of tumor margins has been proposed, as cancerous tissue has been shown to contain a higher percentage of water than normal tissue. 46 This technique has shown efficacy for discriminating oral squamous cell carcinoma from healthy tongue and bone tissues, breast cancer from surrounding tissues, and cervical dysplasia from normal tissue.47–53 This technique has also been applied toward detecting and staging nasopharyngeal carcinoma in vivo. 54 RS has also been applied to study the percentage of collagen and mineral-bound water in bone and its relationship to the mechanical properties of bone. 55 RS has been used to determine the concentration of water and natural moisturizing factors in the skin. 56 Our group has previously demonstrated that RS can detect differing water content in the cervix of pregnant mice. In vivo RS was used to compare the hydration of the cervix in pregnant and nongravid mice and was able to detect significantly different water content between the two groups. 40 Preliminary studies from Puppels et al. using RS to quantify hydration status have been conducted in patients undergoing dialysis and endurance cyclists, 57 although this work was limited by the lack of comparison of the RS technique to gold standards, making it difficult to benchmark their RS approach with clinical standards or currently used methods.
While RS has been used to investigate water content previously, here we correlate RS-derived hydration information against currently used methods and examine sources of variability. This study aims to investigate the feasibility of high wavenumber RS to monitor changes in systemic hydration and evaluate sources of variability toward the implementation of RS for hydration monitoring. Toward this goal, exercising individuals were recruited to characterize the relationship between RS-derived hydration metrics and hydration status using in vivo RS. Additionally, various sources of variability were assessed including inter-subject variability, variability between clinical standards, sex-related differences, anatomical location influences, and variability between repetitive measurements. We found that RS can be used to quantify hydration, but the numerous sources of variability must be accounted for toward developing RS-derived metrics to determine hydration status. Utilization of high wavenumber RS for hydration monitoring offers a rapid, non-invasive method for measuring hydration which can be beneficial in identifying potentially dangerous dehydration.
Experimental
Materials and Methods
Raman Spectroscopy System. For this study, Raman spectra were acquired using two fiber-optic probe-based Raman systems. System 1 consists of a diode laser (680 nm) (1804b000 Fat Boy, Innovative Photonic Solutions) coupled to a custom-designed fiber-optic probe (EmVision, LLC) containing one excitation fiber (300 μm, 0.22 NA) and three collection fibers (300 μm, 0.22 NA) spaced 1 mm around the excitation fiber and organized concentrically. The collection fibers deliver the backscattered light to an imaging spectrograph (HT spectrograph, EmVision, LLC) which disperses the light onto a thermoelectrically cooled, deep-depleted charge-coupled device (CCD) camera (Pixis 400BR, Teledyne Princeton Instruments). The system has a spectral resolution of 8 cm−1. System 2 utilizes the same 680 nm wavelength diode laser coupled to a fiber-optic probe with one excitation fiber (200 μm, 0.22 NA) and six collection fibers (300 μm, 0.22 NA) organized concentrically around the excitation fiber (1 mm spacing from excitation to collection fibers; EmVision, LLC). The fiber-optic probe is coupled to an imaging spectrograph (LS785, Teledyne Princeton Instruments) which disperses the light onto the same thermoelectrically cooled, deep-depleted CCD camera as used in System 1. The spectral resolution of System 2 is 5 cm−1. Both systems are controlled with a laptop and a custom LabVIEW program. Monte Carlo modeling performed previously using a reduced scattering coefficient (µs’ = 2.07 at 680 nm) in the range of skin's reduced scattering coefficient (µs’ = 1.5–2.5 at 680 nm) 58 shows that the effective measurement depth of these probes is 1.2 mm. 59 This probe configuration and effective measurement depth results in Raman signal being collected from both the epidermal and dermal layers of the skin. 60 Each system was calibrated to a NIST white light and calibrated daily using a piece of green glass in order to compare data across the two systems.
Tissue-Mimicking Phantom Validation
Tissue-mimicking gelatin phantoms were created with water content ranging from 65 to 90% water in 5% increments, which is representative of the water content found in most human tissues. 40 To prepare gelatin phantoms, gelatin powder was slowly added to deionized water and mixed over gentle heating. Once all the gelatin was dissolved, the mixture was poured into molds and allowed to cool to room temperature. Each phantom was then removed from the molds and placed on top of aluminum foil for RS measurements. System 1 was used for the gelatin phantom study. The fiber-optic RS probe was placed in light contact with the phantom, and spectra were acquired for 5 s using 50 mW of laser power at 680 nm. Five measurements were taken per phantom and averaged to account for heterogeneity in sample preparation.
In Vivo Studies
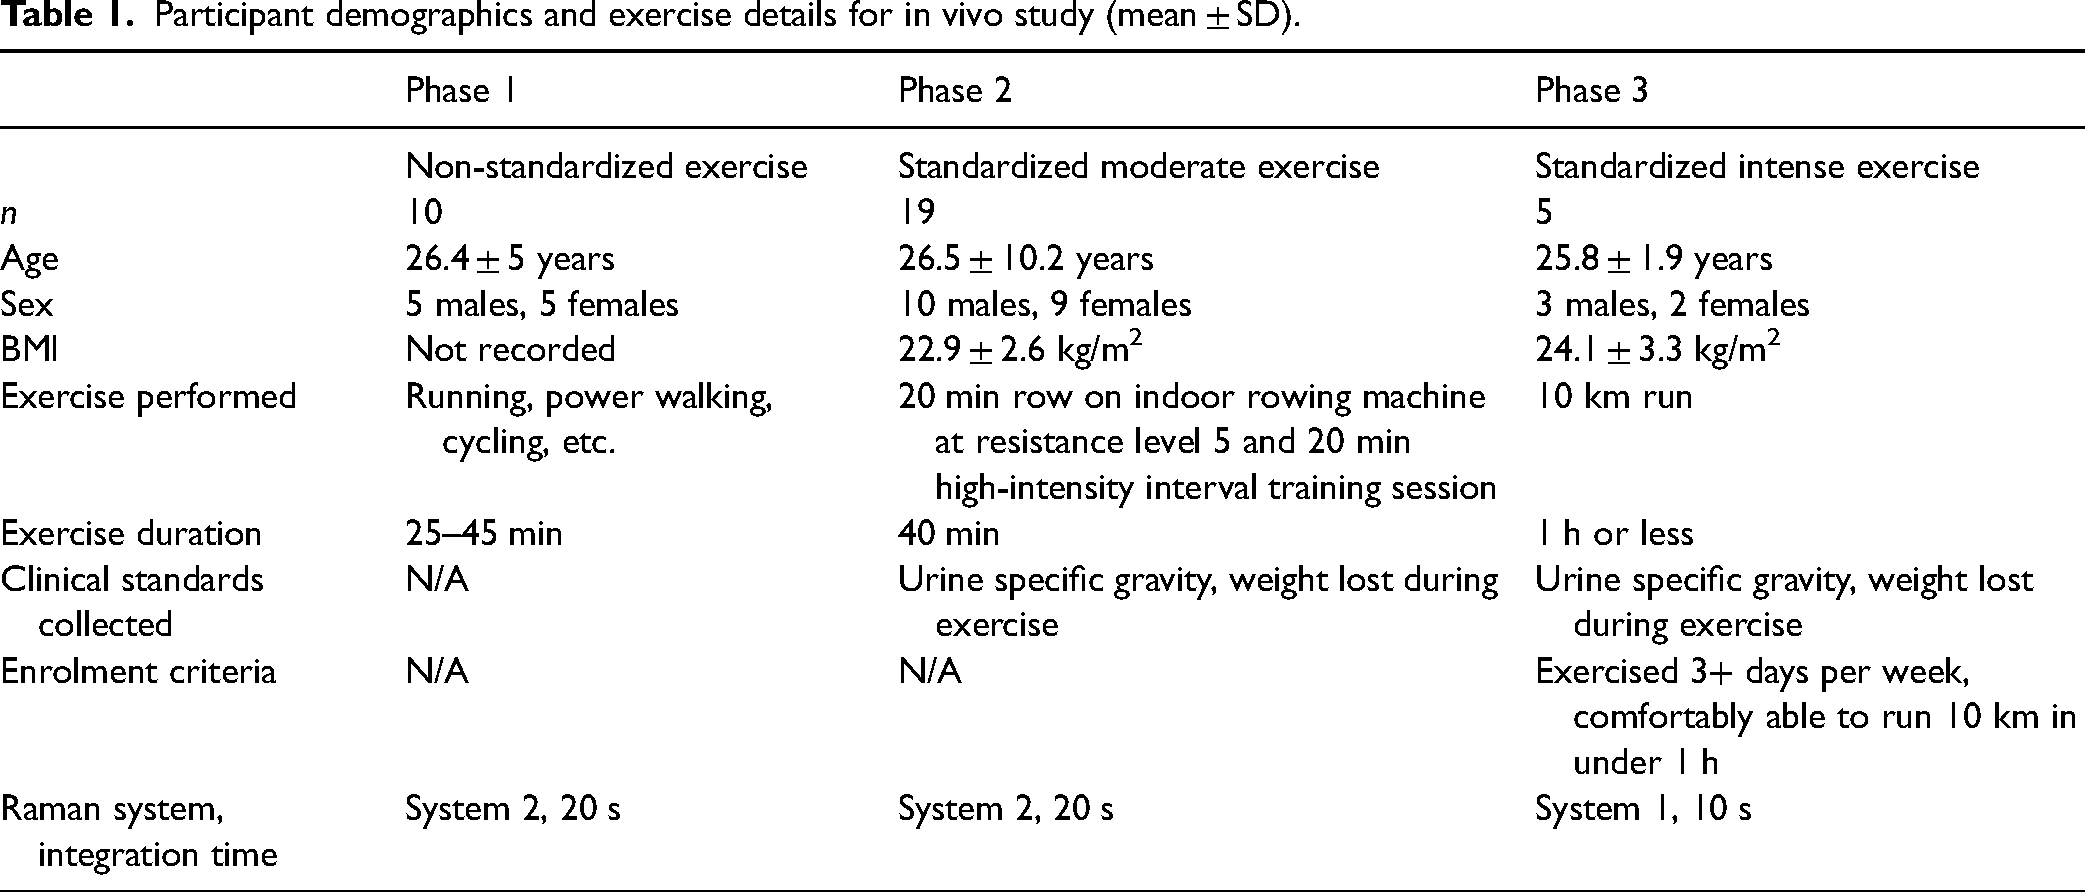
To assess spectral changes associated with varying levels of dehydration, three phases of an in vivo feasibility study were performed. All study participants were enrolled using written informed consent under a protocol approved by Vanderbilt University's Institutional Review Board (IRB 201193) following the guidelines of the Declaration of Helsinki. In total, 34 participants took part in this study with n = 10 in Phase 1, n = 19 in Phase 2, and n = 5 in Phase 3. Participant demographics for each study are shown in Table I.
Participant demographics and exercise details for in vivo study (mean ± SD).
Study Protocols
Three different exercise protocols were utilized in each phase and ranged from non-standardized exercise to standardized intensive exercise (Table I). In Phase 1, participants were asked to exercise between 25 and 45 min and could choose the type of exercise they performed. The exercises performed included running, power walking, and cycling. In Phase 2, participants completed a standardized workout consisting of a 20 min session on an indoor rowing machine (resistance level 5) followed by a 20 min high-intensity interval training (HIIT) workout. For Phase 3, only participants who routinely exercised (e.g., exercised three or more days per week) were enrolled. Participants were asked to complete a 10 km self-paced run within 1 h. Additionally, for Phase 3, each participant engaged in a pre-exercise hydration protocol that consisted of drinking 500 mL of water the night before the study and 500 mL of water the morning before arriving at the laboratory to ensure all participants were below the euhydrated urine specific gravity threshold of 1.02. 61 For all three studies, participants’ water intake was minimal during exercise and was recorded. Clinical standards (urine specific gravity and body weight measurements) and Raman spectra were collected before and after each exercise regimen.
Data Acquisition
Spectra in Phases 1 and 2 were collected using System 2, and spectra in Phase 3 were collected with System 1. For all three phases, RS measurements were collected before and after each exercise regimen. In this study, 50 mW of laser power (680 nm) was used for spectral collection and was calibrated prior to each study participant. The RS probe was held by each participant and placed in light contact with the skin for the measurement collection. In Phases 1 and 2, measurements were taken from four locations on the body to determine if there is an optimal location for collecting spectral information related to hydration. The locations measured were the top of the hand (dorsal hand), the inside of the wrist, the inner bicep, and the back of the knee. These locations were chosen to investigate the influence of skin thickness, regional sweat rate, and upper versus lower body. For Phase 3, measurements were collected from the inside of the wrist and inner bicep. Each location was wiped with an alcohol wipe prior to collecting the Raman spectra to reduce spectral contributions from contaminants on the skin. For Phases 1 and 2, a single 20 s accumulation was collected, and for Phase 3, one 10 s accumulation was collected at each measurement location. The integration time for Phase 3 was decreased to 10 s due to an increase in the signal-to-noise ratio (SNR) of the RS system utilized in this phase. In Phase 3, measurements at each location were repeated three times to assess measurement homogeneity. To collect these repetitive measurements, each participant removed the probe from the measurement area and replaced it in approximately the same location.
For Phases 2 and 3, two clinical standards were used to assess hydration, (i) urine specific gravity (uSG) and (ii) body weight lost during exercise. Participants were given a sterile specimen collection cup, and they provided a urine sample before and after the exercise regimen. Each urine sample was stored at room temperature and analyzed within 12 h of collection. To determine the uSG, each sample was gently mixed by pipetting up and down four times, and 300 µL of the sample was pipetted onto the prism of a handheld urine refractometer (PAL-10S Pocket Urine Refractometer, ATAGO). The sample temperature was allowed to stabilize for 15 s on the prism prior to recording the uSG value. Each sample was measured three times to ensure reproducibility. Between each sample measurement, the refractometer was cleaned with 70% ethanol and deionized water. To calculate body weight change after exercise, each participant was weighed on a digital scale to the nearest 0.05 kg (Ozeri ProMax, Ozeri) before and after the exercise period.
Data Processing and Analysis
The same data processing and analysis protocol was used for data collected on both Raman systems throughout all phases of the study. Spectra were calibrated using the spectral peaks of a neon–argon lamp, 4-acetamidophenol, and cyclohexane. Spectral response was accounted for using a NIST-calibrated tungsten lamp, and daily calibration was performed using a piece of green glass. Lastly, the fluorescent background was subtracted by fitting the spectra with a third-order polynomial. 62 The processed spectra were analyzed to derive two hydration metrics. The two metrics utilized here were the area under the curve (AUC) of the water bands and the ratio of water bands to CH bands. The AUC of the water bands (“water AUC”) was calculated by integrating between 3050 and 3700 cm−1. To calculate the ratio of water bands to CH bands, the AUC of the water bands (3050–3700 cm−1) was divided by the AUC of the CH bands (2800–3040 cm−1).40,42,56 To determine the degree of change between pre-exercise and post-exercise spectral metrics, the percent change was calculated by subtracting the pre-exercise metrics from the post-exercise metrics and dividing by the pre-exercise metric. All spectral processing and analysis were performed in Matlab 2024 (The Mathworks, Inc.).
Statistical Analysis
The water AUC and water-to-CH ratio of the gelatin phantoms were analyzed using a one-way ANOVA. In the human subject study phases, two-way random effects ANOVAs were used to analyze the effects of inter-subject variability and pre-/post-exercise on the water AUC. Bartlett's test and F-tests of equality of variance were used to investigate the variance of the measurement locations. Pearson's correlation tests were used to determine the correlation between the water AUC, the uSG percent change, and the percent of body weight lost during exercise. An F-test of equality of variance was performed to determine significant differences between the female and male groups’ clinical standards and water AUC distribution. A two-way repeated measures ANOVA was used to determine the effect of inter-subject variability, pre-/post-exercise, and repetitive measurements within the water AUC from Phase 3. Mann–Whitney tests were used to determine the significance of the difference between the pre-exercise and post-exercise water AUC of each participant in Phase 3. An alpha value of 0.05 was used for all statistical analyses. Statistical analysis was performed using GraphPad Prism 10 (GraphPad Software). All data are presented as mean ± standard deviation (SD), except where otherwise indicated.
Results
Gelatin-based tissue-mimicking phantoms at a series of hydration levels were measured to determine the optimal spectral metrics for assessing hydration status. Figure 1a shows an observable increase in the amplitude of the water bands as known water content increases from 65 to 90%. From this data set, two spectral metrics were identified: (i) water AUC and (ii) the ratio of the water bands to the CH bands. The percentage of water in the gelatin phantoms was plotted against water AUC (Figure 1b). This shows that there is a statistically significant increase in the water AUC as the water content in the gelatin phantoms increases (p < .0001). Additionally, the ratio of the water-to-CH bands was plotted against the known phantom water content, and a statistically significant increase in the ratio in response to increasing water content is shown (p < .0001) (Figure 1c).
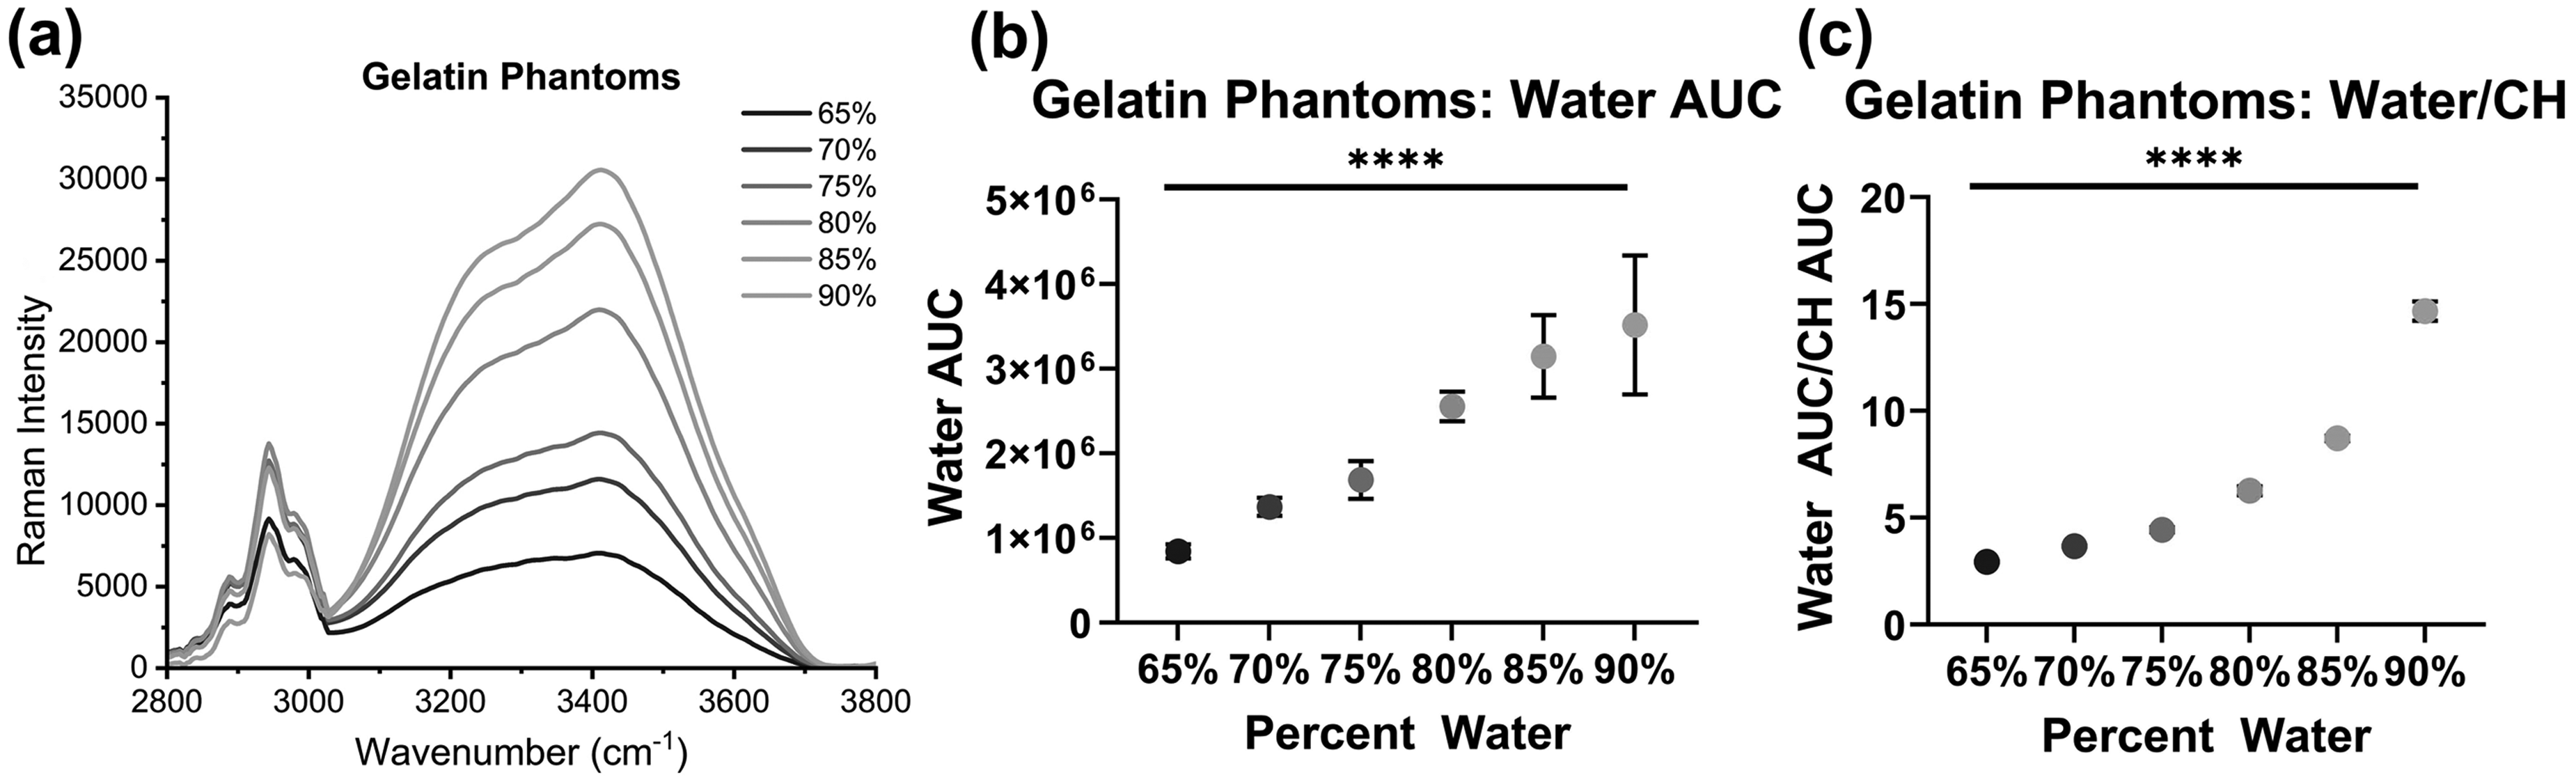
(a) HW spectra of gelatin phantoms with water content from 65 to 90%. (b) The water AUC (mean ± SD) for each water concentration showing a significant increase in AUC as water content increases. (c) Water-to-CH ratio (mean ± SD) showing a significant increase in ratio as water content increases (****p < .0001).
In order to evaluate how spectral changes correlate against changes in hydration as determined by weight loss percentage, the individual and mean water AUC percent change from Phase 2 are presented for each data collection site in Figure 2. The majority of the percent change values are negative, indicating a decrease in the water AUC after exercise, which represents a decrease in the participant's hydration following the exercise regimen, but the magnitude of the change varied greatly between sites. For example, at the inner wrist location, the water AUC percent change ranged from −39 to −0.38%. Additionally, for each location, there are at least three or more data points that are positive percent changes, indicating there was an increase in water AUC after exercise. The high degree of variability in the magnitude and direction of the percent change values led us to assess the sources of variability present. The largest source of variability was identified to be inter-subject variability using a two-way random effects ANOVA. For Phase 2, inter-subject variability was significant (p < .05) and accounted for over 76% of the variability at each location (Figure S1, Supplemental Material). This variability between subjects identifies the need to design studies that account for these sources of inter-subject variability and points to the need for paired analysis.
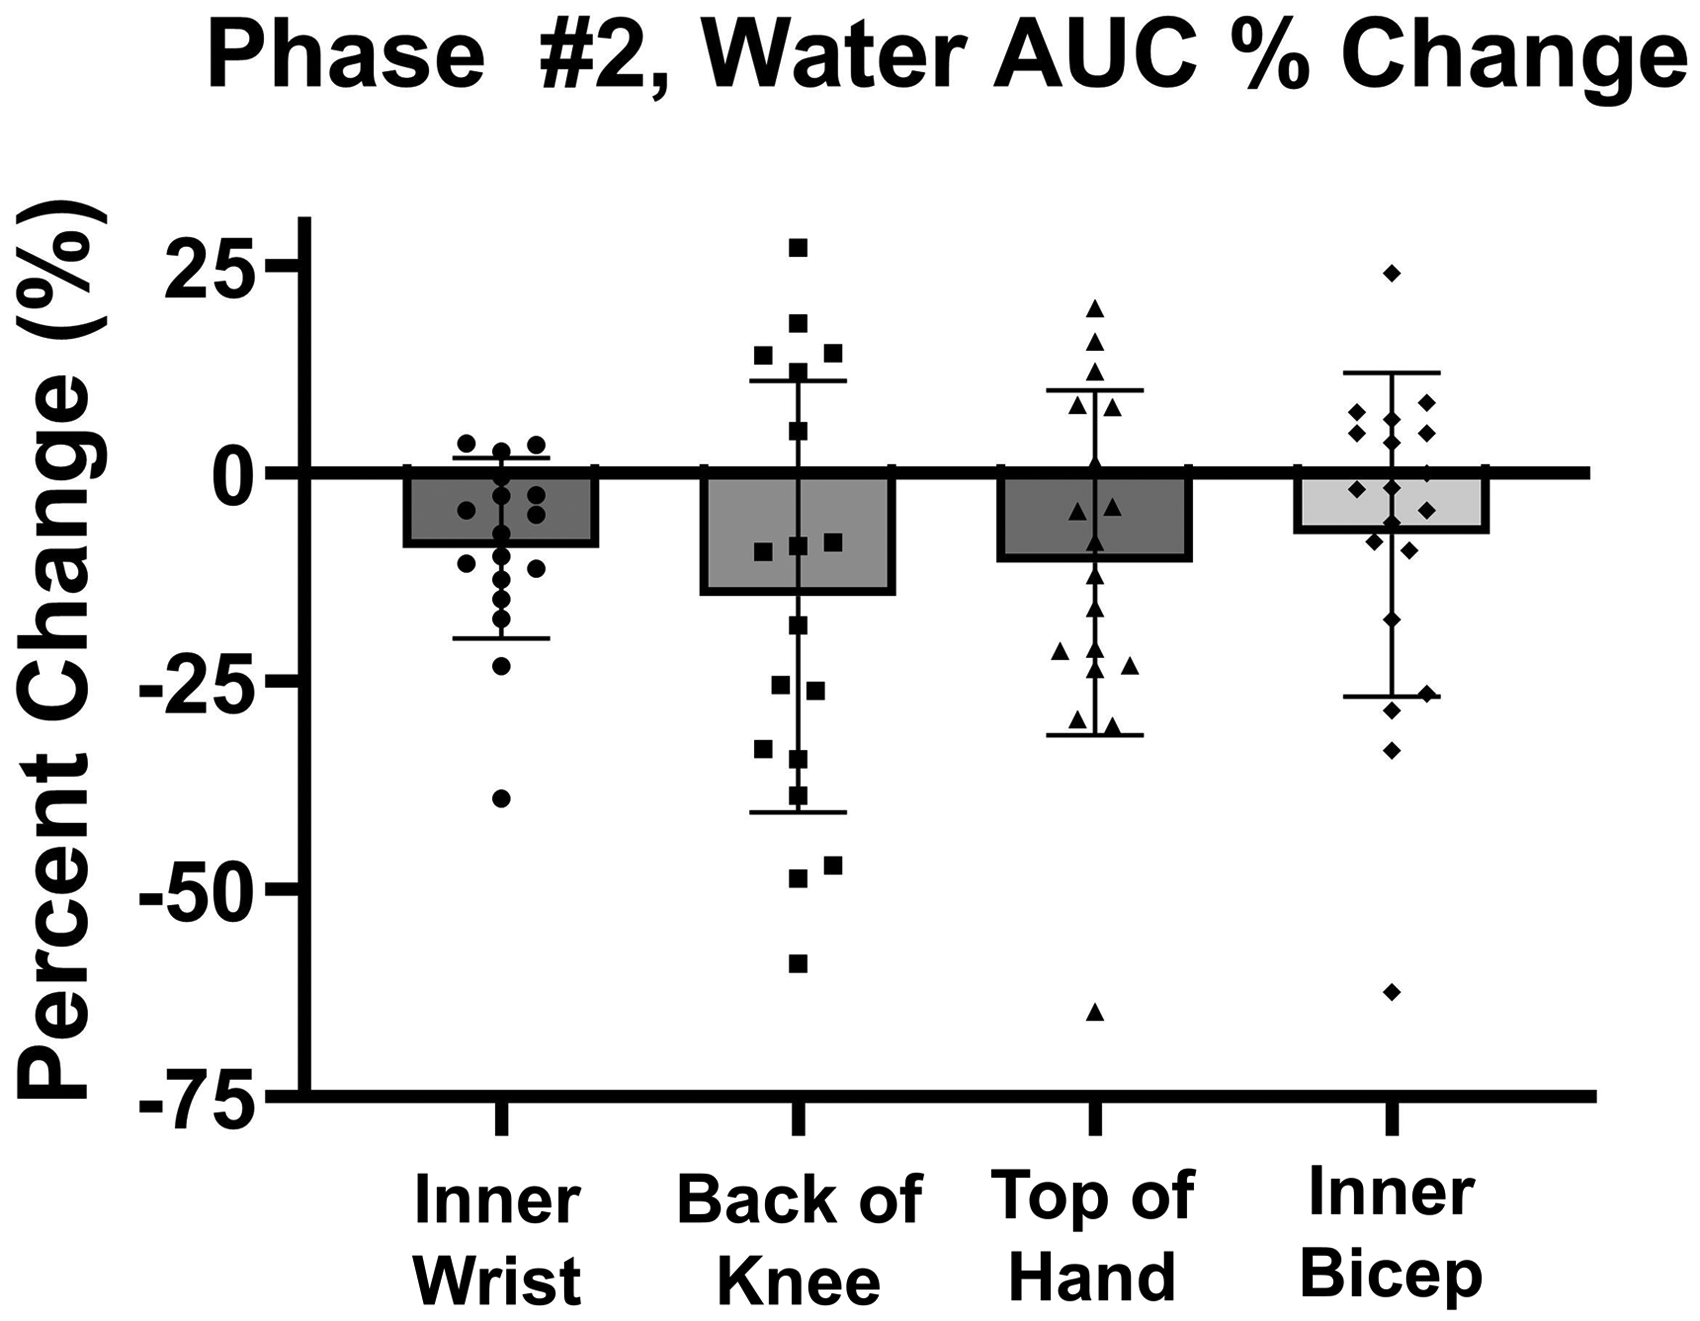
Percent change of the water AUC for each location demonstrating a general trend of negative percent change values, indicating a trend in decreasing water AUC after exercise, but high degrees of variability in magnitude are seen.
To determine if there is an optimal location for collecting RS-based hydration measurements, spectra were collected from four locations: the inner wrist, back of the knee, top of the hand, and inner bicep. In subjects from Phase 2, the percent change in the water AUC was plotted for each location, and the SD and range of percent change values were calculated (Figure 3). Bartlett's test was performed to determine site-to-site variability. Results reveal a statistically different standard deviation (p < .05) between the four locations. Furthermore, F-tests of equality of variance between each measurement location show that the inner wrist had a statistically different standard deviation than the other three locations (p < .05). Based on the statistically lower standard deviation and the tighter range of values (Figure 3), the inner wrist location was chosen for the rest of the analysis.
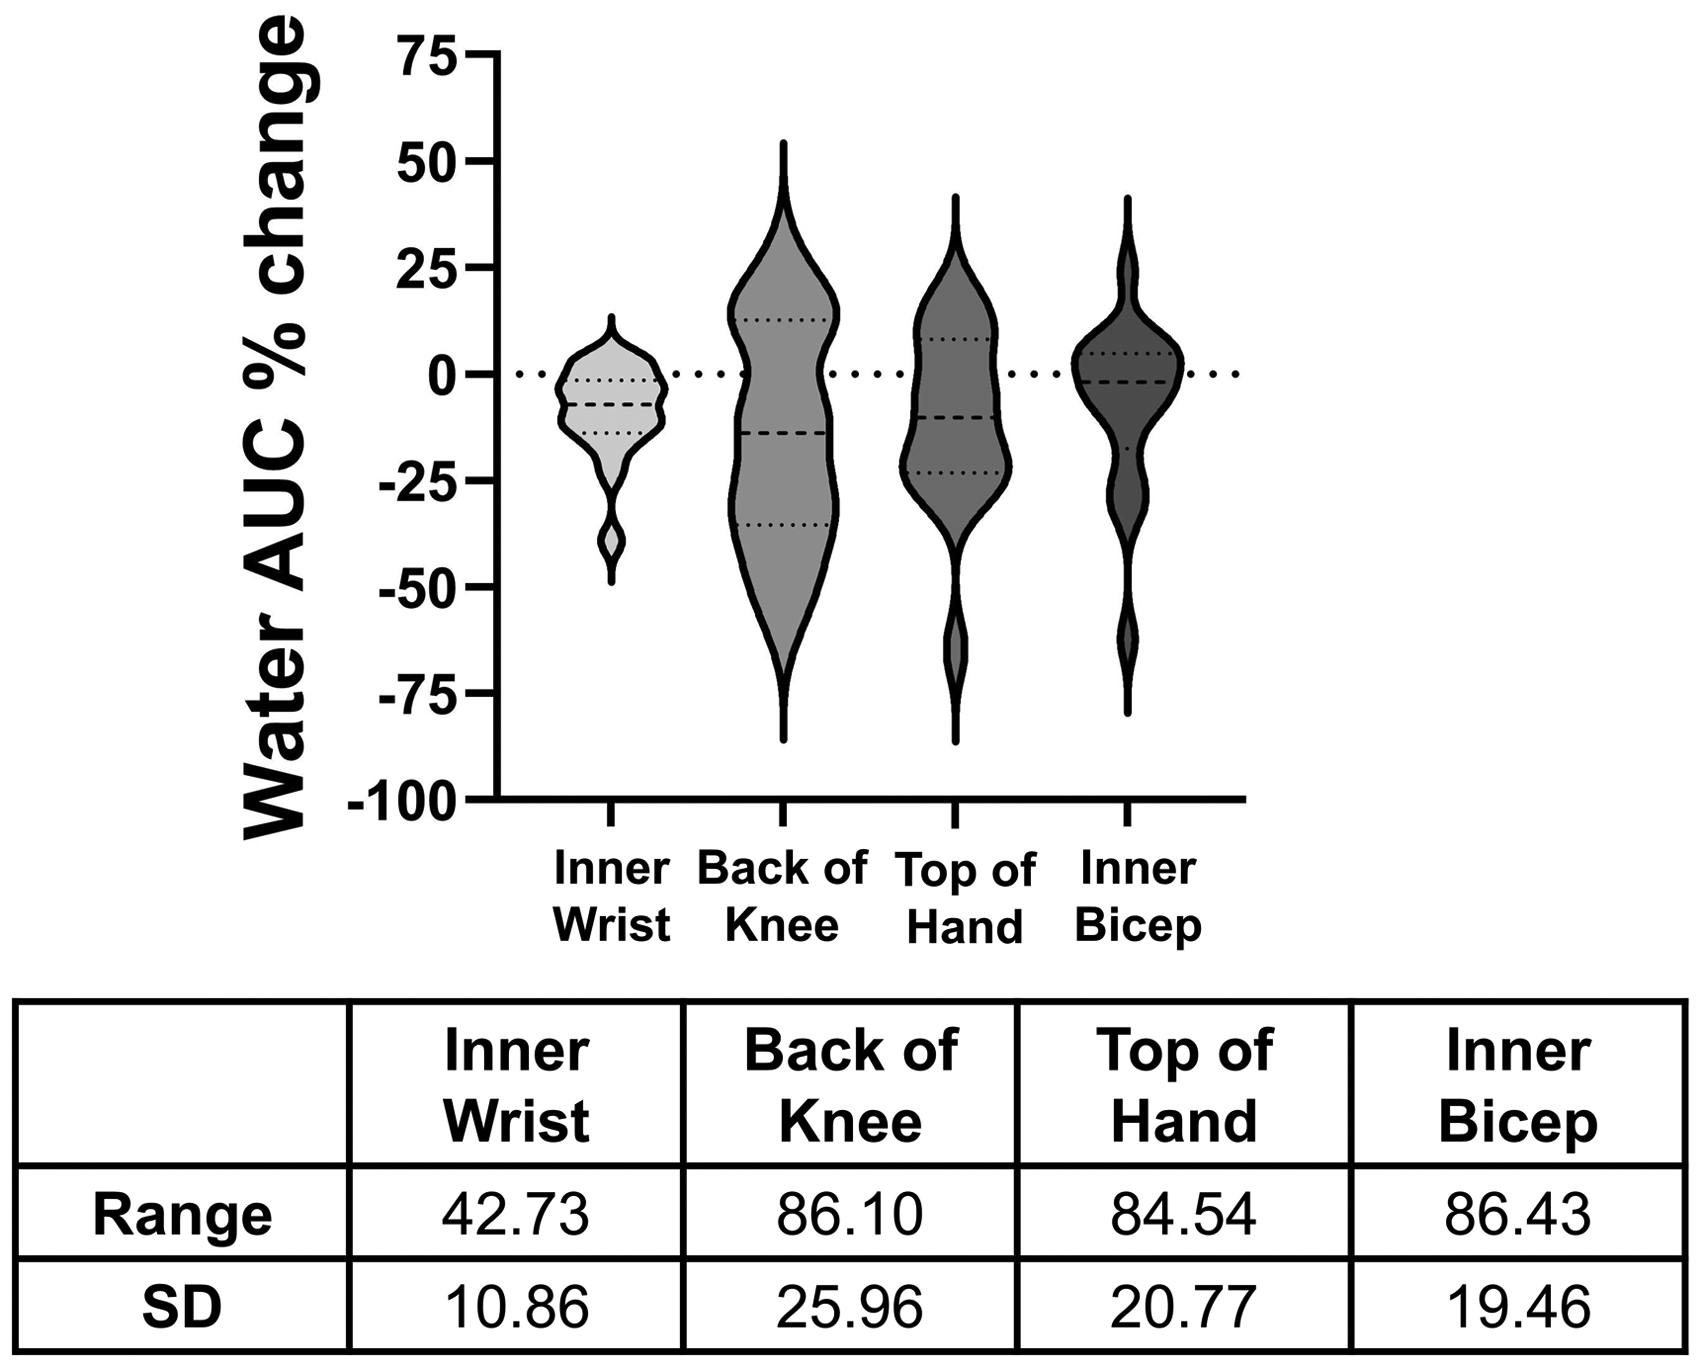
Violin plot of the percent change of the water AUC for the four locations measured and the range and SD of the percent change values for the four locations.
The effect of standardizing the exercise duration and protocol was investigated by comparing the water AUC and water-to-CH ratio across the three in vivo studies. Phase 1, which utilized unstandardized exercise type and duration, showed the largest range and SD in percent change values for both metrics (Figure 4). Phase 2, the moderate standardized exercise protocol, showed smaller ranges and SD for both metrics. This trend of decreasing range and SD was also observed in Phase 3, for the water-to-CH ratio and the water AUC.
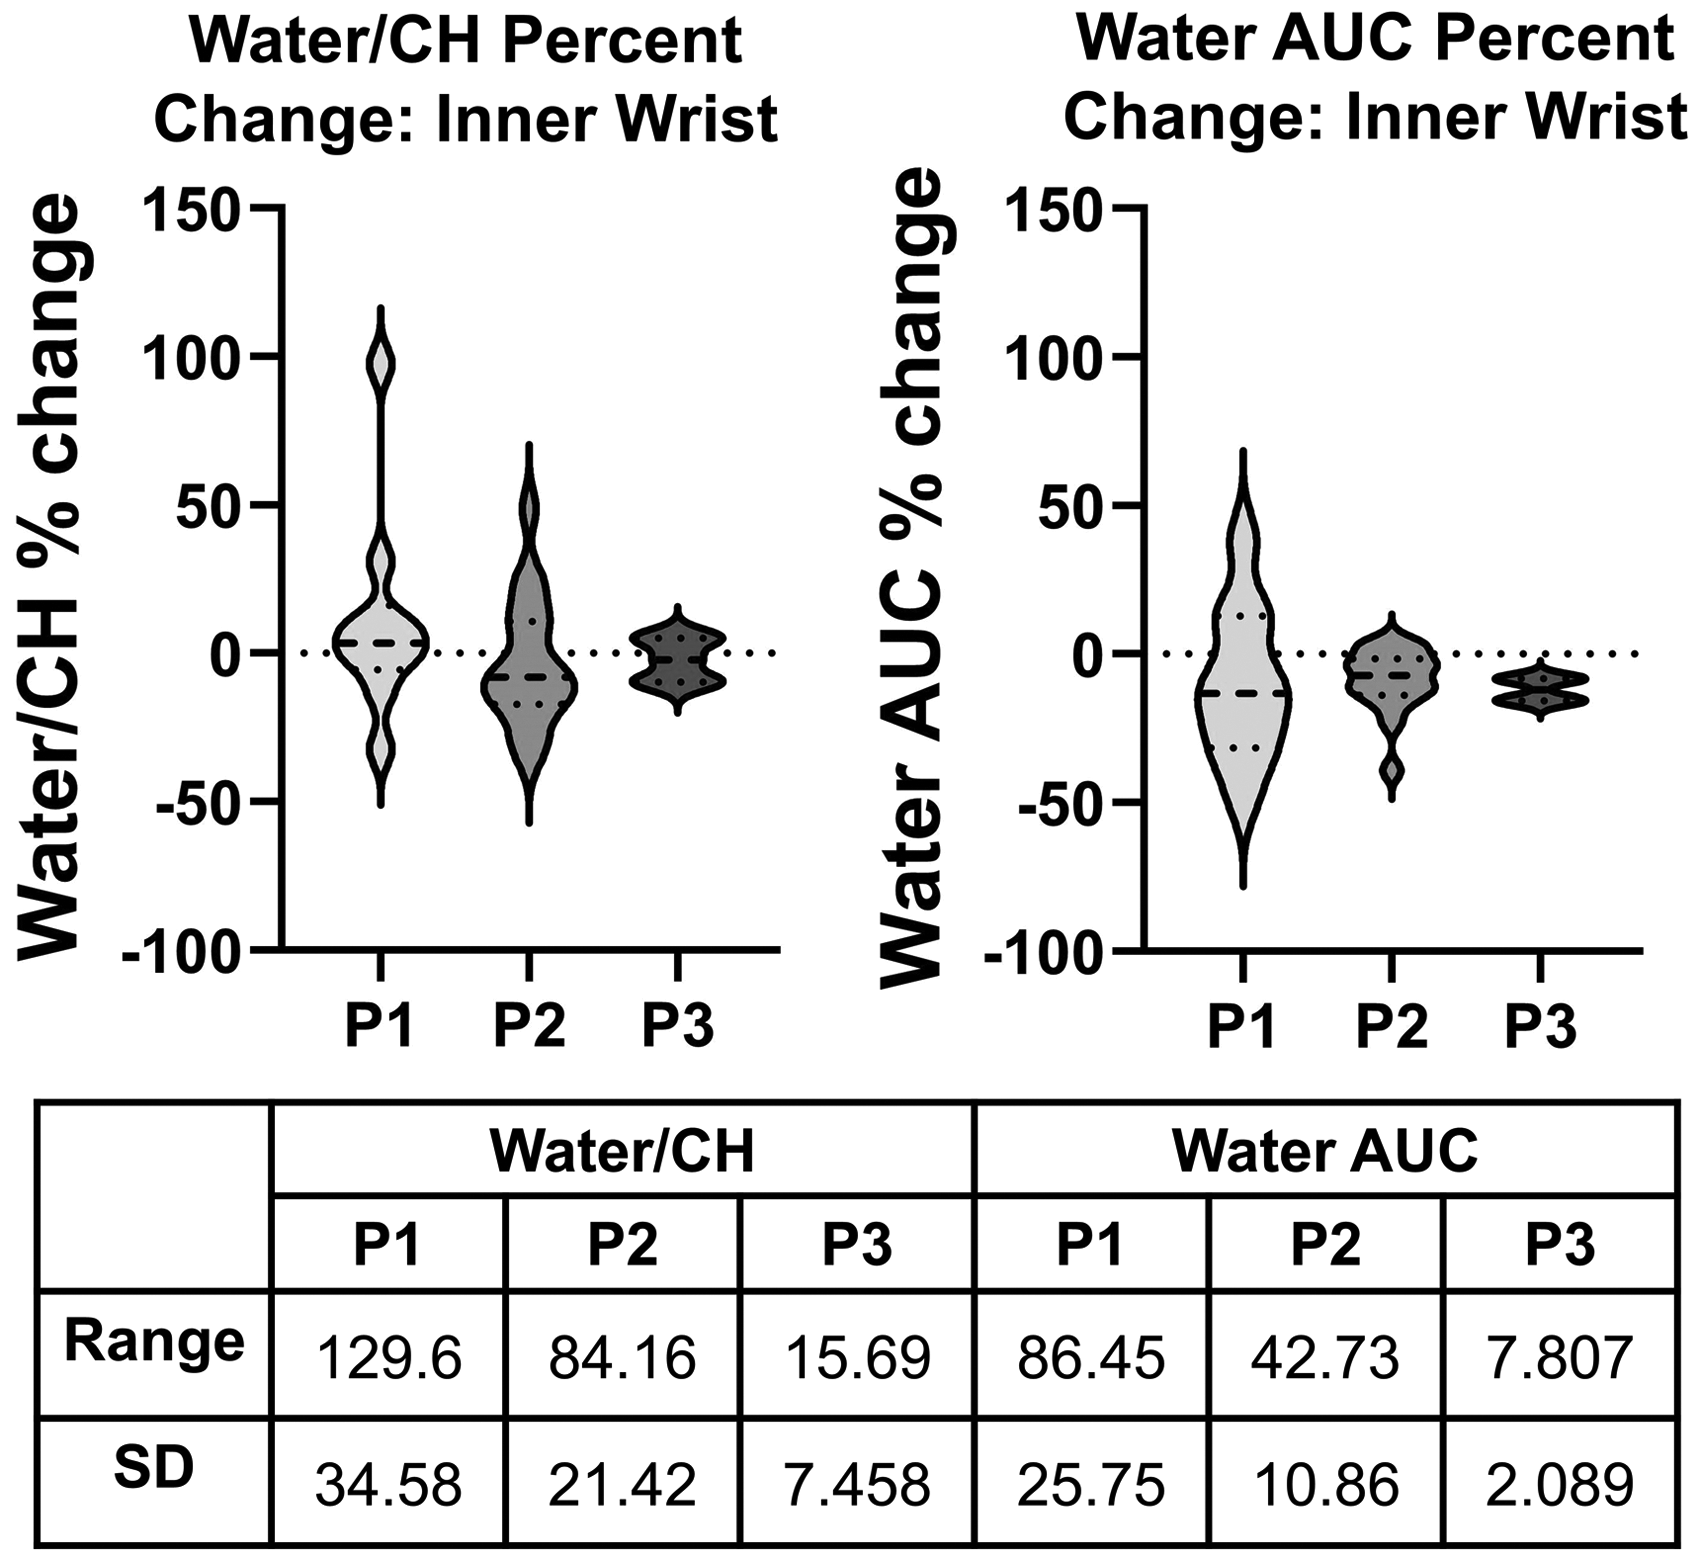
Violin plots of the percent change of the water-to-CH ratio (left) and water AUC (right) and the range and SD of percent change values showing the effect of increasing exercise standardization from Phases 1 to 3. (P1, unstandardized exercise; P2, standardized moderate exercise; P3, standardized intense exercise).
An important step toward developing RS for non-invasive hydration monitoring is to benchmark the technique against currently used non-invasive methods for hydration assessment. The two standards chosen for this study are uSG and body weight change. The uSG percent change and the percent change in the water AUC were plotted, and the Pearson correlation coefficient was calculated between the two values (Figure 5a). The correlation coefficient was calculated as r = −0.15, indicating a very low correlation between the two metrics. This process was repeated using the body weight change (Figure 5b). The correlation coefficient between body weight change and percent change of the water AUC was calculated to be r = −0.41, indicating a moderate correlation. When comparing the two standards to each other, the Pearson correlation coefficient was calculated to be r = −0.11, indicating a very low correlation (Figure 5c). To investigate potential causes of the weak correlation between the two commonly used hydration assessment techniques, we separated the data by sex, as literature shows there may be differences in the dehydration dynamics between females and males.63–67 We identified no difference between the uSG percent change between the male and female group but saw a significant difference between the weight loss percentage between the two groups (p < .001) (Figure 6a). The male group's weight loss percentage was clustered more tightly and showed significantly different variance than the female group's percent weight loss (p = .0008). When segmenting the water AUC by sex, a similar pattern was observed of the male group being clustered more tightly than the female group, although the variance was not significantly different (p = .122) for the two groups (Figure 6b). Lastly, the Pearson correlation coefficients were recalculated with the data grouped by sex. In all cases, grouping by sex increased the magnitude of the correlation coefficients. When comparing uSG and water AUC percent change, the magnitude of the correlation coefficients remained below 0.4, indicating a very low correlation (Figure 6c). The male group's correlation coefficient between the weight loss percent change and water AUC percent change reached a value of 0.82, indicating a strong correlation. The correlation between the two standards was also recalculated when grouped by sex, and the correlation coefficients increased in magnitude (male: r = −0.28, female: r = 0.17), but remained only weakly correlated. Analyzing by sex may help to benchmark the developed RS technique against currently used hydration assessment methods but does not substantially affect the agreement between the two standards used in this study, indicating the limitations of using current non-invasive techniques as a gold standard.
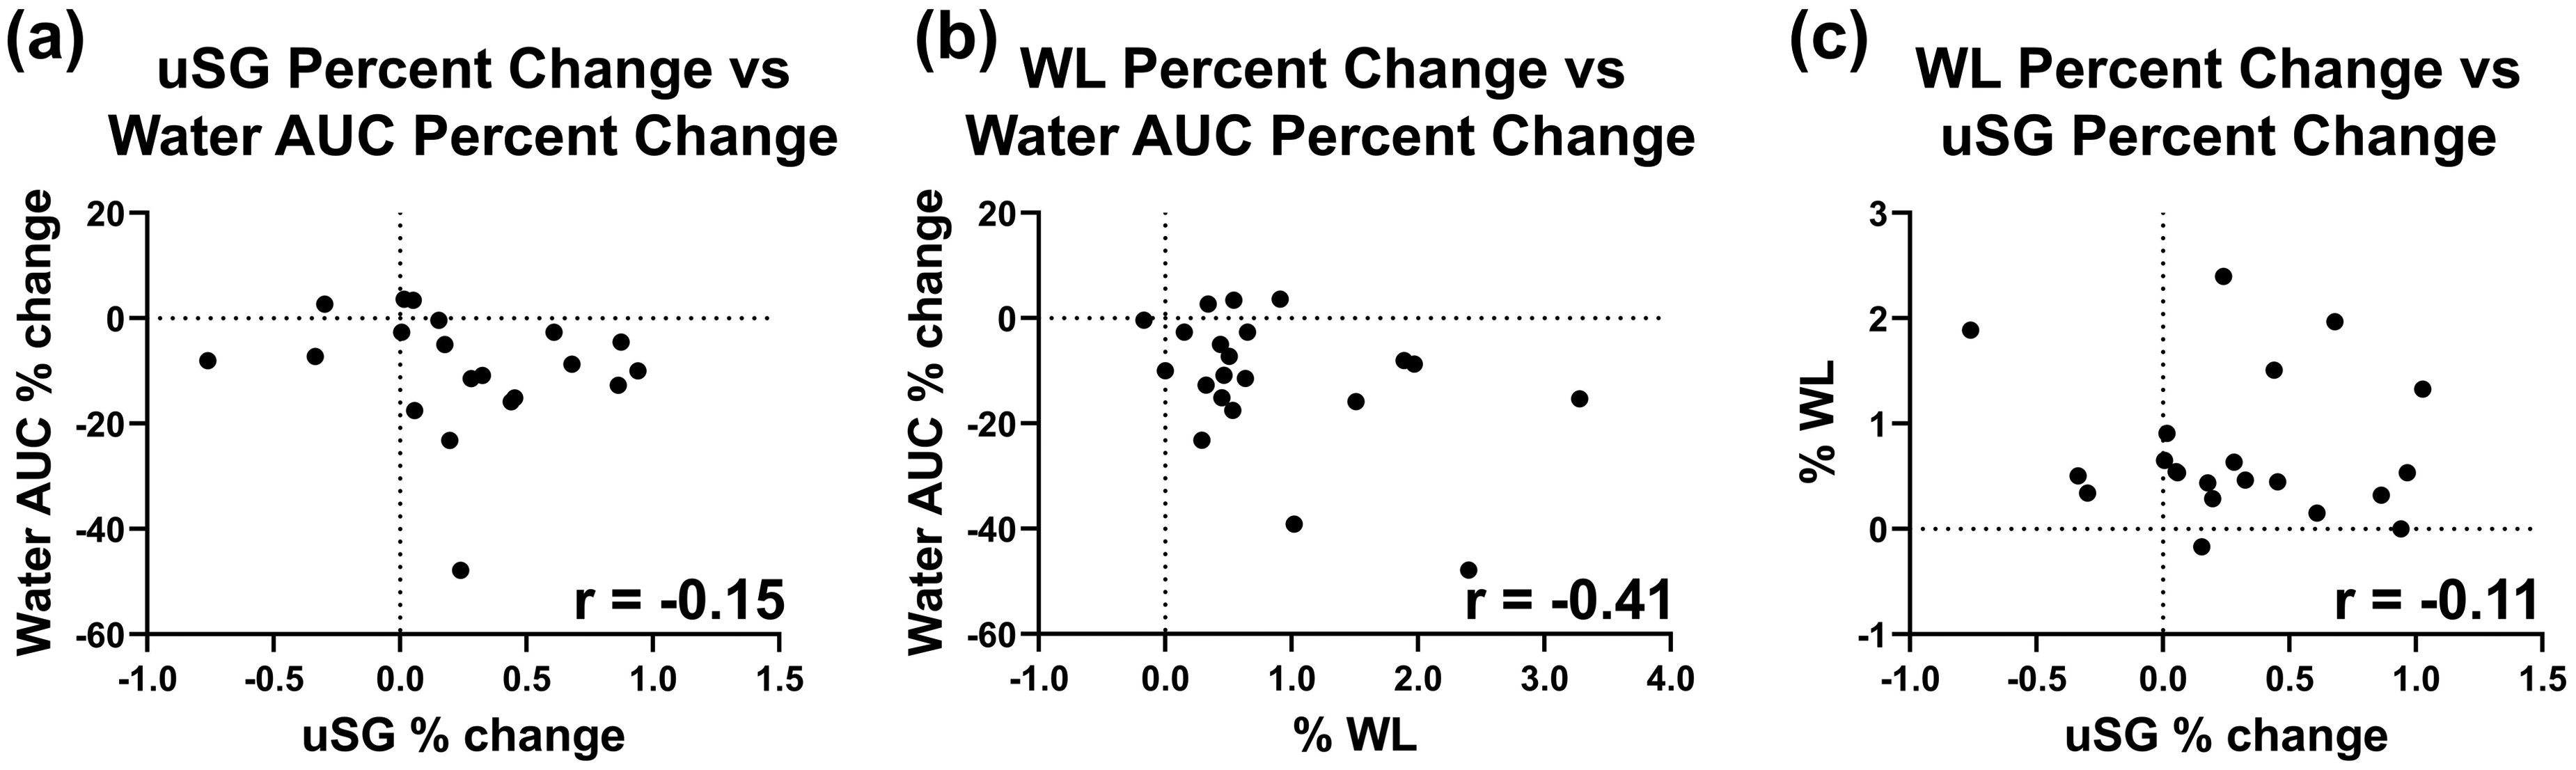
Scatter plots of the water AUC and uSG percent change (a) and weight loss (WL) percent change (b) with the Pearson correlation coefficient showing weak or no correlation between the metrics. (c) Scatter plot of uSG percent change and WL percent change with the corresponding Pearson correlation coefficient showing weak correlation.
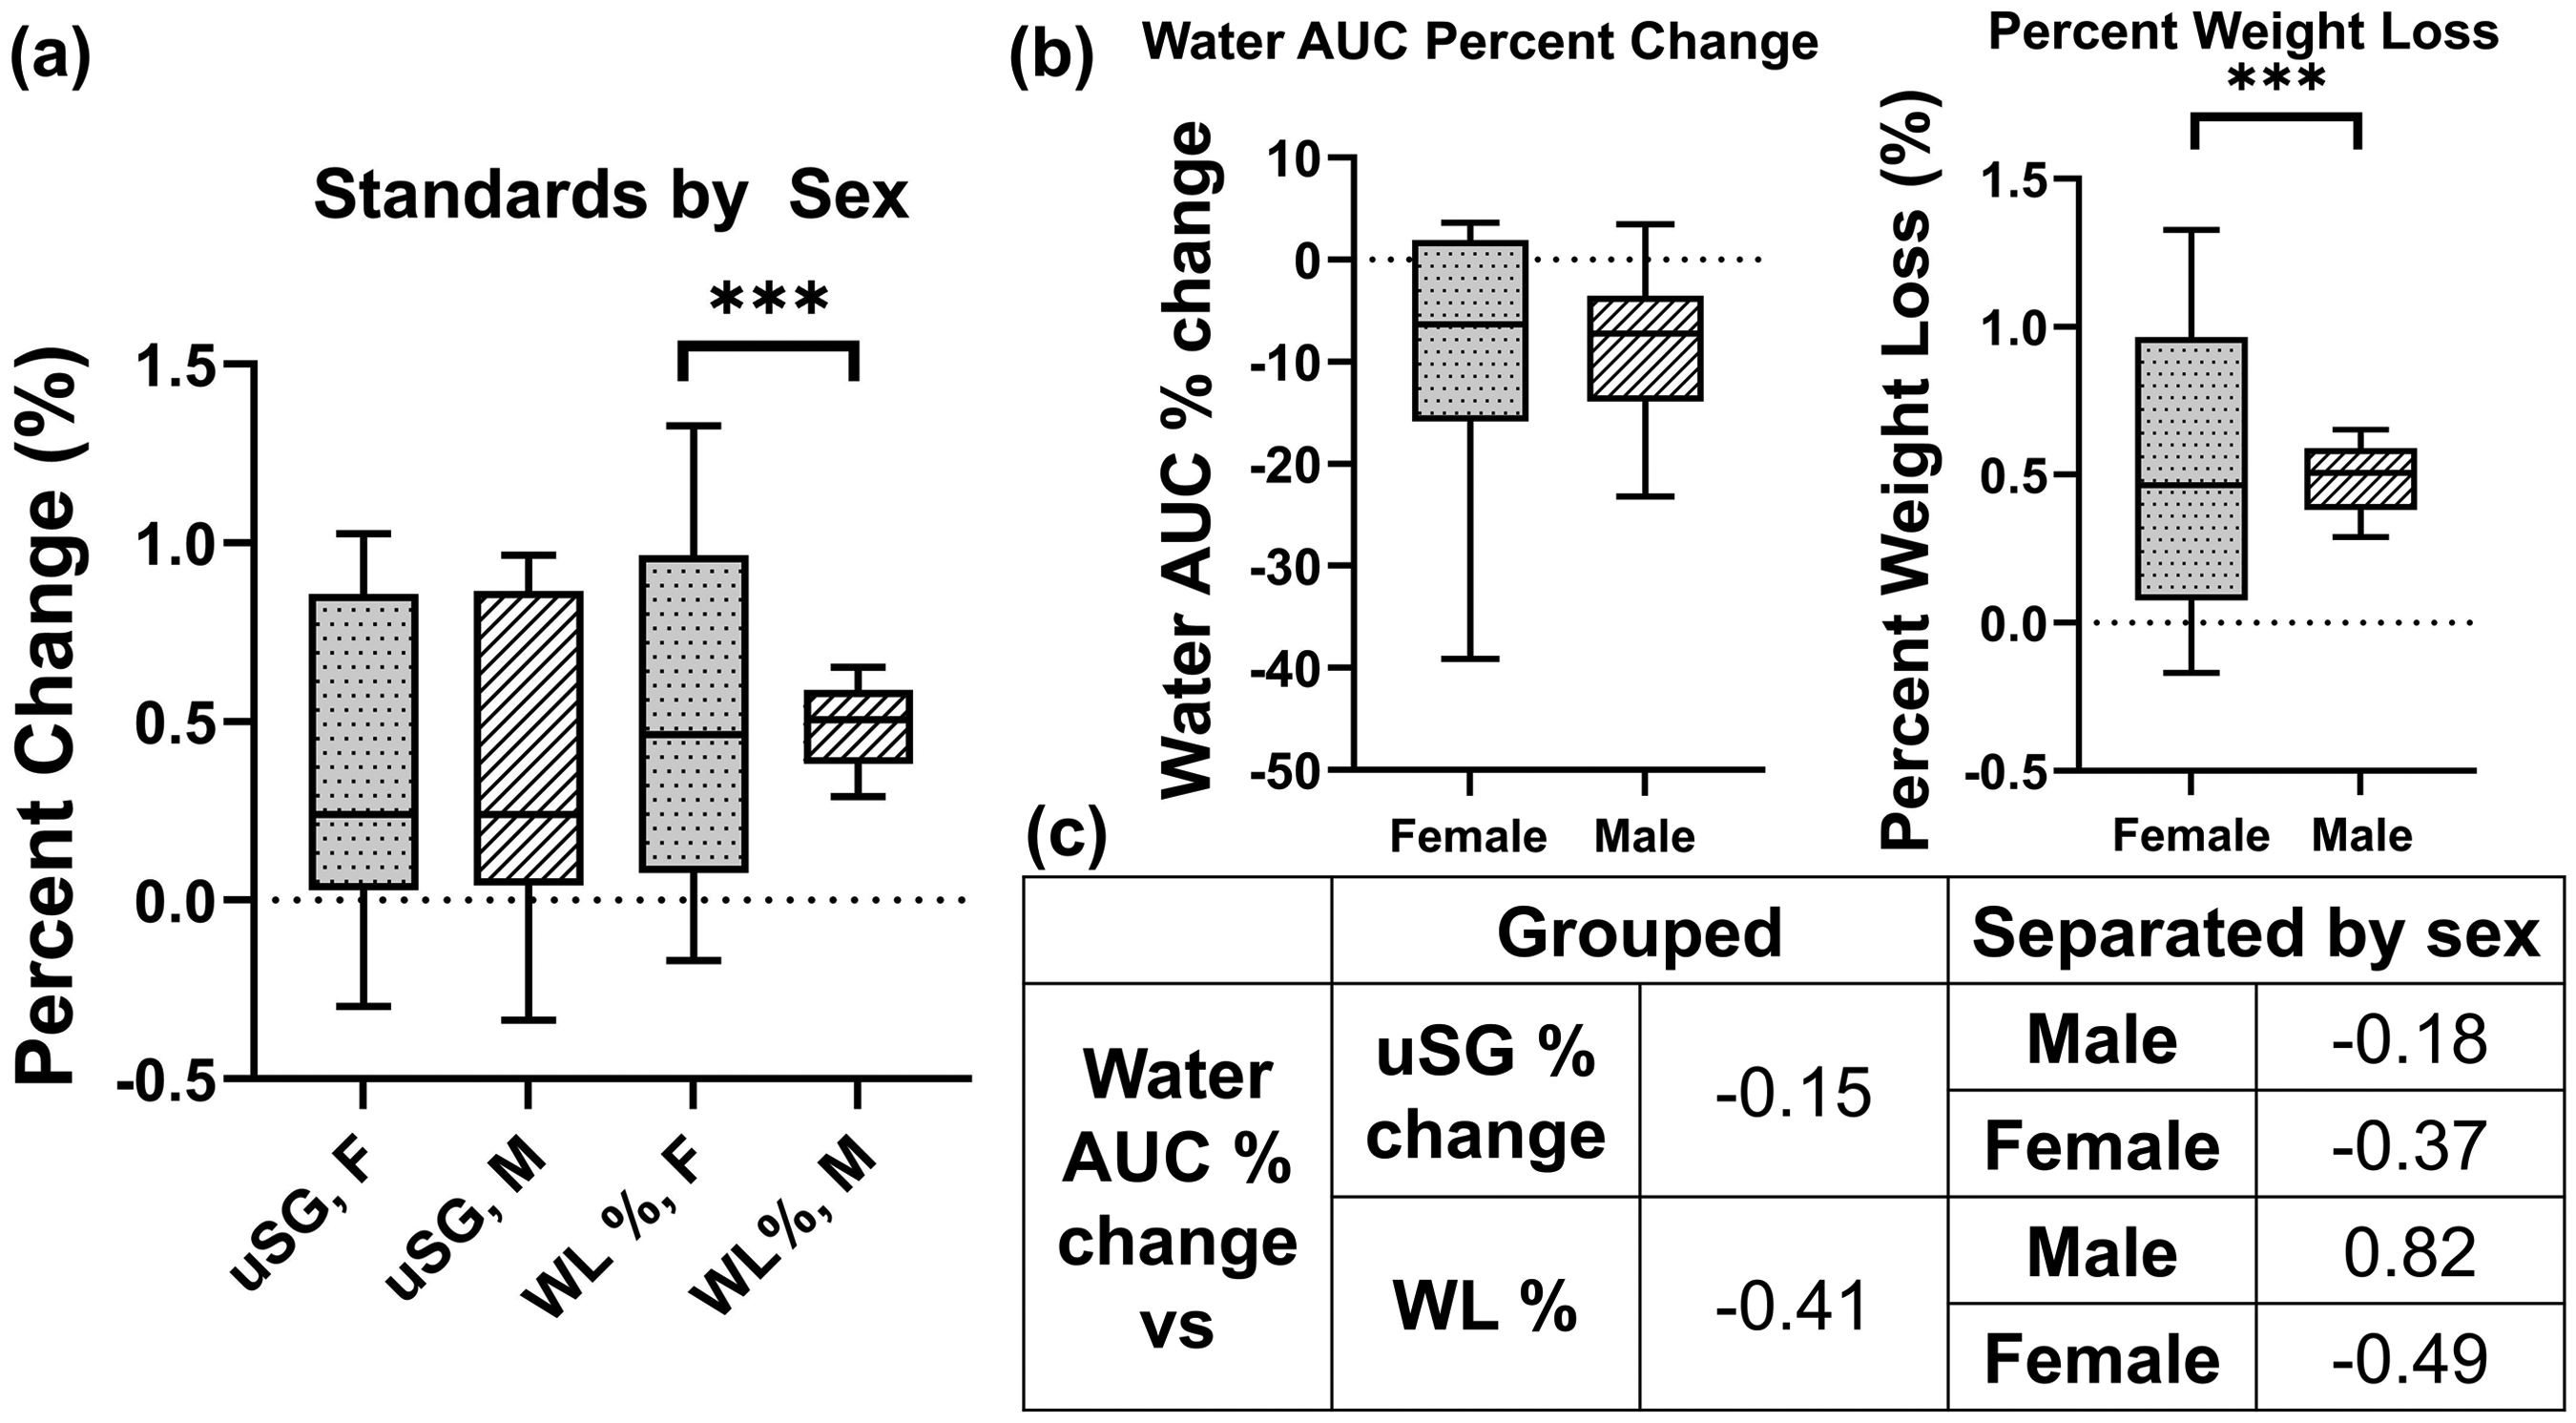
(a) Clinical standards separated by sex highlighting the significant difference in distribution between the weight loss (WL) percentage of males and females. (b) Water AUC grouped by sex displaying a similar distribution as the percent WL for each sex. (c) Pearson correlation coefficient calculated for the total group (left side) and when data is separated by sex (right side), showing an increase in magnitude in correlation when grouped by sex (F-test significance: ***p < .001).
In Phase 3, all participants were ensured to have a uSG < 1.02 before the study and were well-conditioned for the exercise regimen (Table I). The final change made in this study was to make three measurements from each location before and after the exercise regimen. These repeat measurements allowed us to assess the homogeneity of the location between measurements. These repeat measurements were highly variable for some participants, as highlighted in Participant 3 in Figure 7a. These measurements (“trials”) were also found to be a significant source of variability (Figure 7b). Despite the high degree of variability seen within the repetitive measurements, there was a trend of the mean water AUC decreasing after exercise in all four participants (Figure 7c). This indicates that despite the high variability between measurements, there is still a large difference between pre- and post-exercise hydration that is detectable using RS. P1 was not included in this analysis due to only one measurement being taken at each location before and after exercise.
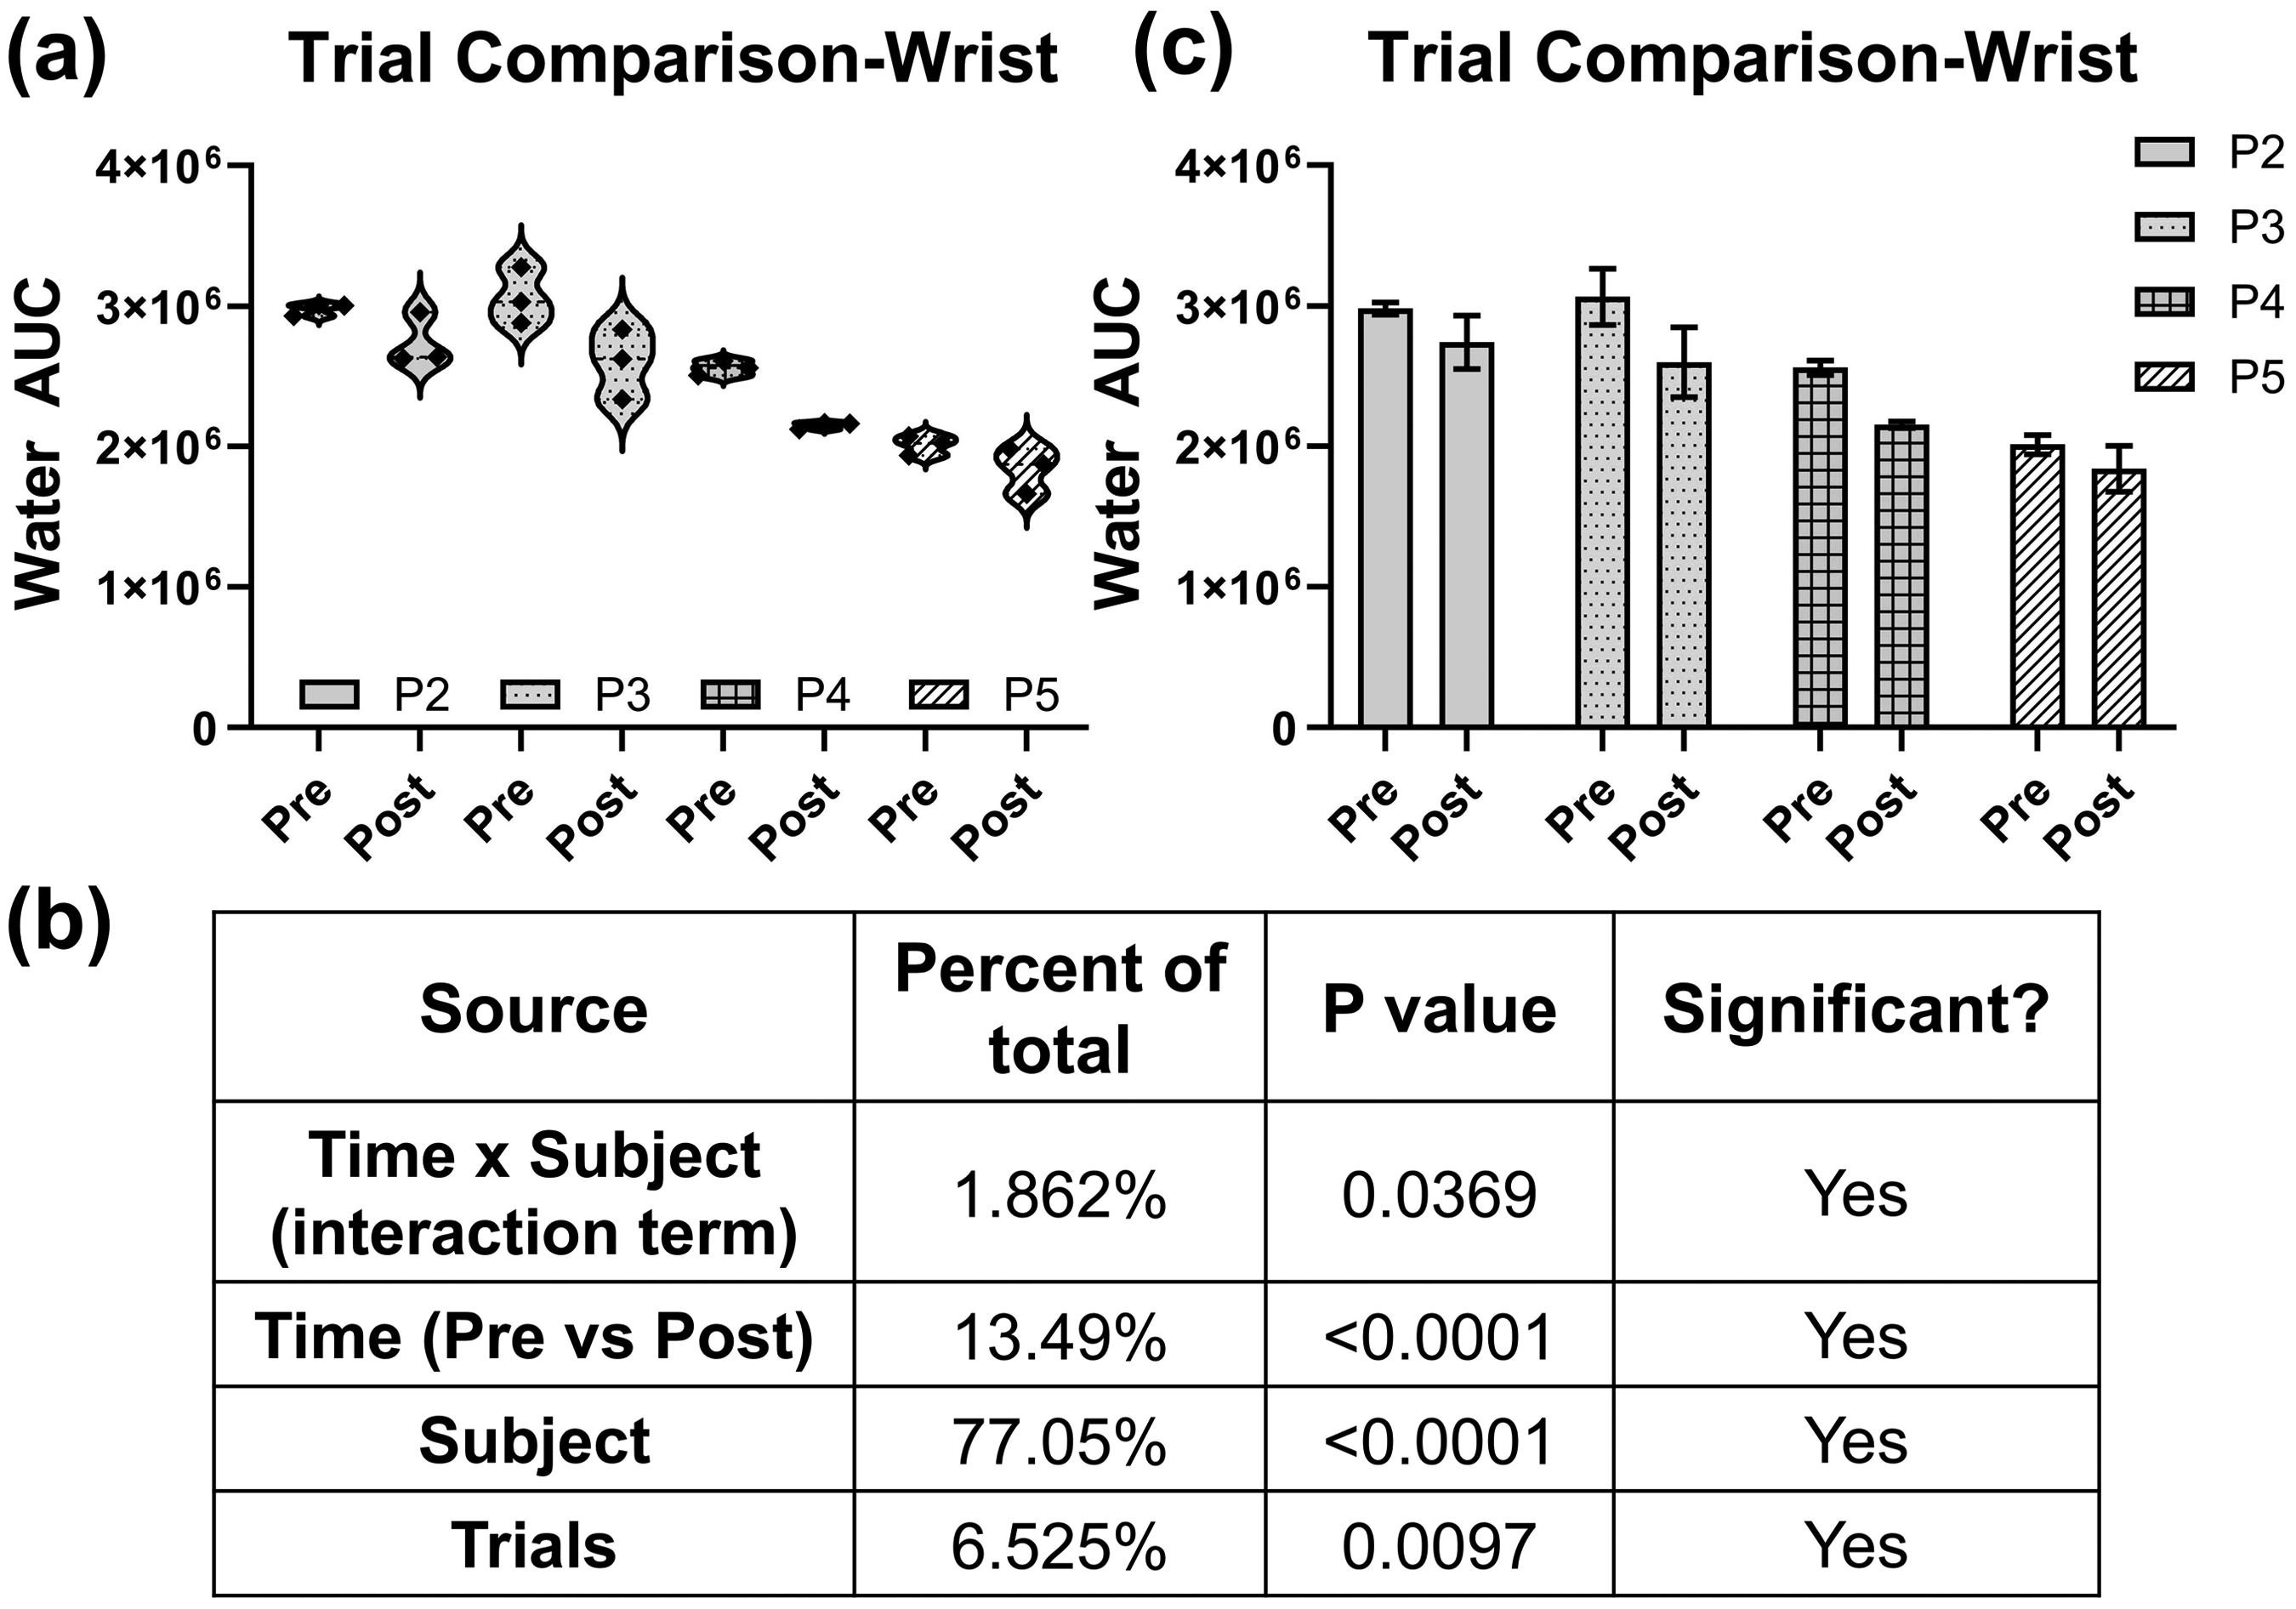
(a) Violin plots of repetitive measurements for P2–P5 showing a high degree of variability between repetitive measurements. (b) Analysis of variability results shows significant inter-trial variability. (c) Bar plots (mean ± SD) representing the trend in decreasing water AUC after exercise.
Discussion
In this study, high wavenumber RS for non-invasive monitoring of hydration has been developed. This method has been demonstrated to show changes in water content in gelatin tissue-mimicking phantoms correlated with two spectral metrics, the water AUC and water-to-CH ratio. Furthermore, preliminary results from in vivo studies indicate that spectral features show changes in systemic hydration, although a large degree of variability exists. Factors such as exercise standardization, measurement heterogeneity, and inter-subject variability must be considered to develop RS for accurate hydration monitoring. Utilizing RS for hydration monitoring is advantageous because the method is rapid and non-invasive.
Gelatin phantoms of varying water content show a distinct spectral response to the changing water content. There is an overall increase in the intensity of the water bands, from 3050 to 3700 cm−1 (Figure 1a). This band increased incrementally as the known water content in the gelatin phantom increased, indicating a direct spectral response to the increasing water content. To investigate the optimal quantitative spectral metric for assessing water content and hydration status, we identified two metrics from this gelatin phantom study: the ratio of water bands to CH bands and the water AUC. The ratio of water-to-CH bands, representing protein and lipid contributions, has been used previously in reports of water analysis using RS and has been shown to correlate well with known water content; thus, this metric was used in the present gelatin phantom study.47,56,57 There was a significant increase in the water-to-CH ratio (p < .0001), indicating that this metric described water content accurately in this phantom study (Figure 1c). The other metric chosen, the water AUC, was chosen to exclusively look at water features, as there may be varying protein and lipid contributions under the skin when translating this technique in vivo.68,69 This metric also showed a significant increase (p < .0001) in water AUC with an increase in known water content in the gelatin phantoms (Figure 1b). This phantom study not only confirmed that RS can detect changes in water content but identified two key spectral metrics for describing water content using RS, which were then utilized in our in vivo studies.
After determining the relationship between water content and spectral metrics in gelatin phantoms, we performed three phases of an in vivo feasibility study to investigate the relationship between spectral metrics and systemic hydration. When analyzing Phase 2 (n = 19), the percent change of the water AUC was plotted for each location (Figure 2). The majority of percent change values were negative, indicating a decrease in water AUC after exercise as compared to before. Based on the results from the gelatin phantoms that show that the water AUC increases with increasing hydration, this negative percent change could be attributed to decreasing hydration. The magnitude of percent change does vary greatly; for example, the percent change in the inner wrist location ranges from −39% to −0.38%.
Furthermore, we hypothesize that the magnitude of the percent change of the water AUC varies largely for a few reasons. First, we found that the starting hydration of our study participants varied greatly (Figure S2, Supplemental Material). Between Phases 2 and 3, seven participants were above the uSG threshold of 1.02, indicating that these participants were not well hydrated at the beginning of the exercise. 61 This pre-exercise dehydration could have impacted the intensity at which each participant conducted the study exercise, thereby decreasing their dehydration during the exercise protocol. 70 The exercise regimen was also kept constant, despite differences in sex, body type, and conditioning, which could have affected the performance of some participants, thereby reducing their amount of dehydration. While most percent change values were negative in Phase 2, at each measurement location, there were at least three values that were positive, indicating an increase in hydration throughout the exercise. These increases in water AUC are hypothesized to be due to differences in the placement of the fiber-optic RS probe when collecting measurements. Adipose tissue only contains approximately 5–10% water while the skin and muscle contain a much higher proportion of water at 40 and 75%, respectively.63,71,72 Due to these large differences in water content based on tissue type, if a measurement is taken in a location that has a larger proportion of subcutaneous fat or has heterogeneous subcutaneous fat distribution, the RS metrics may not accurately reflect the systemic hydration status. However, the majority of values were negative, indicating that RS can detect changes in hydration after exercise and requires careful placement of the RS probe for measurement.
To identify sources of variability within each measurement location, two-way random effects ANOVAs were performed using the data collected in Phase 2 for each location. Results show that there was a significant contribution of variability between subjects, with inter-subject variability responsible for at least 76% variability at each location (Figure S1, Supplemental Material). While some degree of inter-subject variability can be expected, the large amount of variability can overshadow the spectral changes we may see due to changing hydration status. We hypothesize that the overarching inter-subject variability could be caused by a few factors. Differing levels of pre-exercise hydration, as shown by the pre-exercise uSG values, could have affected the exercise intensity each participant was able to perform and could have affected the net water loss during the exercise (Figure S2, Supplemental Material). Additionally, while all participants in Phase 2 followed the same exercise protocol, which increased the standardization of the study, this does not allow for personalization of the exercise protocol to each participant's ability level. In this study, we enrolled participants who exercised 0–1 times per week as well as participants who exercised four or more times per week. When subjecting these participants to the same exercise regimen, it is expected that the participants who routinely exercise may be able to perform with lower effort than participants who do not regularly exercise. The lack of exercise personalization may have contributed to the large degree of inter-subject variability and can be addressed in future studies to decrease this type of variability. Furthermore, differences in the skin color of the participants are likely to contribute to the inter-subject variability by altering the optical properties of the skin. Darker skin tones have a greater amount of melanin which increases the absorption coefficient of the epidermal layer, thereby reducing the penetration depth of the excitation light. Additionally, melanin granules have been shown to impact the scattering coefficient in different skin tones. 73 This change in the measurement depth and scattering coefficient between participants, as a result of varying skin tone, could affect the hydration information measured using RS. Future studies will account for skin pigmentation by recording participants' skin tone using a scale such as the Pantone SkinTone Guide.74,75 By taking these factors into account, we aim to decrease the significant inter-subject variability in future studies.
In developing an RS-based method for assessing systemic hydration status, it is important to take the measurement location into consideration. In Phases 1 and 2, four locations were tested: the top of the hand (dorsal hand), the inside of the wrist, the inner bicep, and the back of the knee. These locations were chosen to determine the influence of regional sweat rate, skin thickness, and upper body versus lower body on the spectral metrics. Literature shows that the regional sweat rate varies greatly, with the dorsal hand, back of the knee, and inner bicep showing low to moderate sweat rate while the inner wrist shows a high sweat rate.76,77 The skin thickness at the locations chosen ranged from lower at the inner wrist and top of hand locations and higher at the inner bicep and back of the knee locations. 60 We also wanted to identify if the upper body versus lower body would have an effect on the spectral measurements because increased blood flow heterogeneity during exercise in the upper body, specifically the arms, could affect water diffusion and distribution in the upper body. 78 When comparing the percent change values of the water AUC from the four locations, we found a statistical difference in the variance of the locations (Figure 3). The standard deviations of each location were compared using F-tests and showed that the inner wrist has significantly lower variability than the other three locations. This shows that the wrist may be an optimal anatomical location for collecting RS measurements. Furthermore, this location is easily accessible, which is beneficial for future implementation of this RS-based hydration monitoring technique in various scenarios and populations, such as military or athletic populations.
The exercise regimen was progressively more standardized and more rigorous as we transitioned from Phases 1 to 3 (Table I). This included standardizing both the duration and type of exercise performed. To examine the effect of exercise standardization on the variability in spectral metrics, we plotted the percent change of the water-to-CH ratio and the percent change of water AUC for each study (Figure 4). As the exercise standardization increases, the range of percent change values decreases for both metrics. Additionally, the SD of the percent change values decreased as the study standardization increased for both spectral metrics utilized in this study. The results indicate that highly standardized studies must be conducted to ensure an understanding of how spectral features change in response to varying levels of systemic hydration. Following highly controlled studies, real-world data collection can take place that is more representative of the use cases, such as at a sports game or on the battlefield.
To benchmark the developed RS-based method for assessing systemic hydration, two commonly used hydration assessment techniques were chosen to be clinical standards. Weight loss percentage is one of the most commonly used metrics in exercise studies and urine specific gravity (uSG) is widely used in medical clinics, by sports associations, e.g., National Collegiate Athletics Association (NCAA), and in various exercise studies.22,79,80 Despite the widespread use of these techniques, we identified a low to moderate correlation between the water AUC and either metric with a Pearson correlation coefficient of −0.15 for the uSG percent change and −0.41 for the percent weight lost (Figures 5a and b). We additionally found minimal correlation between the two standards with a Pearson correlation coefficient of −0.11, showing that the two standards themselves do not agree with each other or the spectral metrics used in this study (Figure 5c). We hypothesize that both methods may have significant degrees of error relating to the timing which may skew the hydration values. Literature has shown that urine indices of hydration can lag behind systemic hydration. 24 This may be due to urine indices being indicative of all the urine in the bladder at the time the sample is taken, so it provides a value of hydration since the previous bladder void, not a snapshot of the person's hydration status at the time the sample is collected. In our studies, we did not control the time since the last bladder void prior to collecting urine samples so this could have induced variability in the uSG of each participant. Secondly, percent weight loss during an exercise period can fail to account for certain types of water loss, which can induce a degree of error on the metric. Weight lost during exercise is typically attributed solely to fluid lost as sweat during exercise but fails to consider respiratory water loss and weight changes due to carbohydrate or fat metabolism. 26 While our studies’ exercise regimens were generally short (between 25 min and 1 h) and significant carbohydrate or fat metabolism should not have a large effect on body weight during this duration, it is possible this contributed to the disagreement between standards. Additionally, participants’ weights were collected while clothed in their exercise wear, which could have held sweat and contributed to the disagreement between standards. The sources of error identified in the use of two commonly used clinical standards could have affected the correlation between the chosen standards and the RS-derived water AUC. Toward the development of RS-derived metrics for systemic hydration analysis, it is necessary to account for the sources of error within the standard used such as by accounting for fluid intake up to 12 h before participants perform exercise regimens. Finally, the disagreement between the two commonly used hydration metrics further reiterates the need for the development of a rapid, non-invasive hydration monitoring tool, such as an RS-based tool.
In an effort to further investigate the variability in the two standards chosen, we evaluated the effect of sex as a factor that could affect the accuracy of the standards. Literature has identified various differences in the dehydration dynamics of females and males including significant differences in uSG, urine color, and body mass change when pair-matched according to exercise time and body mass index (BMI), significantly higher sweat rates in males, and a delay in time to start sweating in females.64,66,67 It is hypothesized that these differences may have a multifactorial cause. Females have been shown to have more surface area per unit mass than males. 66 Hormonal variations throughout the menstrual cycle may induce changes in systemic hydration and may affect the degree of water loss during exercise. 65 Females may have naturally lower water content than males and, at the same weight, have more body fat than males. 63 In correlation with these known or hypothesized differences, we identified significant differences between the spectral responses and standards in relation to hydration in our studies. When separating the clinical standards into female and male groups, we saw a significant difference (p < .001) in the variance and distribution of the male group's percent weight loss compared to the female group (Figure 6a). The percent weight loss of the male group was tightly clustered with a range of 0.363, while the female group had a range of 1.497. Additionally, the male group had a lower coefficient of variation (the ratio of the SD to the mean) of 25.72% compared to the female group's coefficient of variation of 97.47%. We also found a similar pattern of tighter distribution in the male group when the water AUC percent change was analyzed by sex (Figure 6b). This indicates that despite the moderate correlation between the water AUC and percent weight lost, the two metrics cluster similarly, indicating the physiological validity of our RS results. Lastly, when the Pearson correlation was repeated on the sex-segregated values, an increase in the magnitude of all correlation coefficients was seen (Figure 6c). This highlights the importance of ensuring there are adequate numbers of both males and females in future studies and may indicate that separate studies tailored to each sex may be beneficial when developing this RS-based hydration monitoring method. Furthermore, the strong correlation (r = 0.82) found between weight loss percent change and water AUC percent change for the male group shows the potential of RS for monitoring physiological hydration, benchmarked by currently used standards.
Phase 3 took into account various factors of importance discovered from Phases 1 and 2 that have been discussed above, including a pre-study hydration protocol and ensuring all participants were routinely active and thus adequately conditioned to perform the required exercise. This study also included collecting three repetitive measurements at each measurement location to assess the homogeneity within each location. Within three of the four participants who had repeated measurements conducted, there was a large degree of variability (Figure 7a). To assess the variability, the coefficient of variation was calculated and ranged from 1 to 9%. The repetitive measurements (“trials”) were a significant source of variability (p < .01) (Figure 7b). We hypothesize this variability could be stemming from two sources: physiological heterogeneity within the measurement location and RS instrumentation variability. As discussed previously, the water content in fat is significantly lower than in skin and muscle.63,71,72 If the probe was located where there was high heterogeneity of the composition of the underlying tissue at that location, this could induce a high degree of variability between the repetitive measurements. This study used normal physiological landmarks to place the probe in approximately the same location. Future studies will use fiducials to mark the measurement location to ensure the repetitive measurements are being taken in the same place. On the instrumentation side, previous research in our group has shown that changes in the orientation of the probe and pressure applied to the probe can impact the resulting spectra. 81 This could also indicate that a single measurement may not be sufficient to capture accurate hydration status information and future studies should investigate the use of continually acquired spectra throughout the exercise regimen. Regardless of the high inter-measurement variability seen, a trend in decreasing water AUC after exercise was seen in all of the participants (Figure 7c). The pre-exercise hydration levels, as represented by pre-exercise uSG values below 1.02, serve to ensure that all participants have similar hydration status at the start of the study and may aid in decreasing inter-subject variability. Additionally, this exercise regimen slightly increased the personalization of the exercise to the ability level of each participant by allowing the participants to run at a comfortable pace, as long as they completed the 10 km run in 1 h or less. Finally, this study also only recruited participants who were routinely active with an average exercise per week of three days. More pronounced changes are expected with future studies as further standardization is incorporated such as enrolling well-conditioned athletes and having participants exercise for a longer duration.
Throughout this work, RS has been utilized to non-invasively detect changes in systemic hydration. After determining that the water AUC and water-to-CH ratio are appropriate hydration metrics, three phases of an in vivo feasibility study were conducted to investigate the relationship between these spectral metrics and systemic hydration. A negative percent change, indicating a decrease in hydration after exercise, was found in the majority of participants’ results, yet the magnitude of change varied. Additionally, a few percent change values were identified to be positive, indicating an opposite trend. The RS-based measurements were impacted by factors such as large inter-subject variability and disagreement between commonly used non-invasive hydration assessment methods. Future studies will take these factors into consideration by conducting additional highly standardized exercise regimens, ensuring adequate numbers of males and females in each study, and utilizing uSG as a pre-hydration metric with nude body weight loss as the principal standard to quantify water loss. Despite these factors, RS shows great promise for hydration monitoring that is both rapid and non-invasive.
Conclusion
In summary, RS has shown feasibility for non-invasively detecting systemic hydration in exercising individuals. Gelatin-based tissue-mimicking phantoms have been utilized to validate the relationship between water content and two spectral metrics, the water AUC and the water-to-CH ratio. These metrics were then calculated from spectra collected from study participants before and after an exercise regimen and their relationship to systemic hydration has been explored. The wrist was found to have the lowest variation and is beneficial for future implementation of RS-based hydration monitoring as it is easily accessible. Multiple sources of variability have been identified including significant inter-subject and repetitive measurement variability, and these sources of variability must be taken into consideration for future studies. Despite this variability, this study shows that the advancement of RS for hydration monitoring has the potential to make inter-activity hydration monitoring a reality, thereby reducing the incidence of the negative side effects of dehydration and avoiding dangerous dehydration scenarios.
Supplemental Material
sj-pdf-1-asp-10.1177_00037028241307043 - Supplemental material for Characterizing Variability in Non-Invasive Hydration Monitoring Using Raman Spectroscopy
Supplemental material, sj-pdf-1-asp-10.1177_00037028241307043 for Characterizing Variability in Non-Invasive Hydration Monitoring Using Raman Spectroscopy by Anna S. Rourke-Funderburg, Laura J. Elstub, Trevor Voss, Richard L. Liao, Laura E. Masson and Anita Mahadevan-Jansen in Applied Spectroscopy
Footnotes
Acknowledgments
The authors would like to thank Dr. Eric O’Neal at the University of North Alabama for his help in proofreading this manuscript. Parts of the graphical abstract figure were generated using Servier Medical Art, provided by Servier, licensed under a Creative Commons Attribution 3.0 unported license.
Declaration of Conflicting Interests
The authors declared no potential conflicts of interest with respect to the research, authorship, and/or publication of this article.
Funding
The authors disclosed receipt of the following financial support for the research, authorship, and/or publication of this article: This work was supported by the U.S. Army Medical Research and Development Command, (grant number W81XWH-20-2-0064).
Supplemental Material
All supplemental material mentioned in the text is available in the online version of the journal.
References
Supplementary Material
Please find the following supplemental material available below.
For Open Access articles published under a Creative Commons License, all supplemental material carries the same license as the article it is associated with.
For non-Open Access articles published, all supplemental material carries a non-exclusive license, and permission requests for re-use of supplemental material or any part of supplemental material shall be sent directly to the copyright owner as specified in the copyright notice associated with the article.