
Abstract
Fourier transform spectrometers typically use a presumed monochromatic reference source to track and correct errors in optical path difference changes. This paper will conduct a theoretical analysis to show that non-monochromatic light sources with symmetric spectral profiles can also be used as reference sources without adding errors. An experiment was carried out using a symmetric broadband superluminescent diode (SLED) as reference light to measure the spectrum of some other SLED light sources to experimentally demonstrate this finding.
This is a visual representation of the abstract.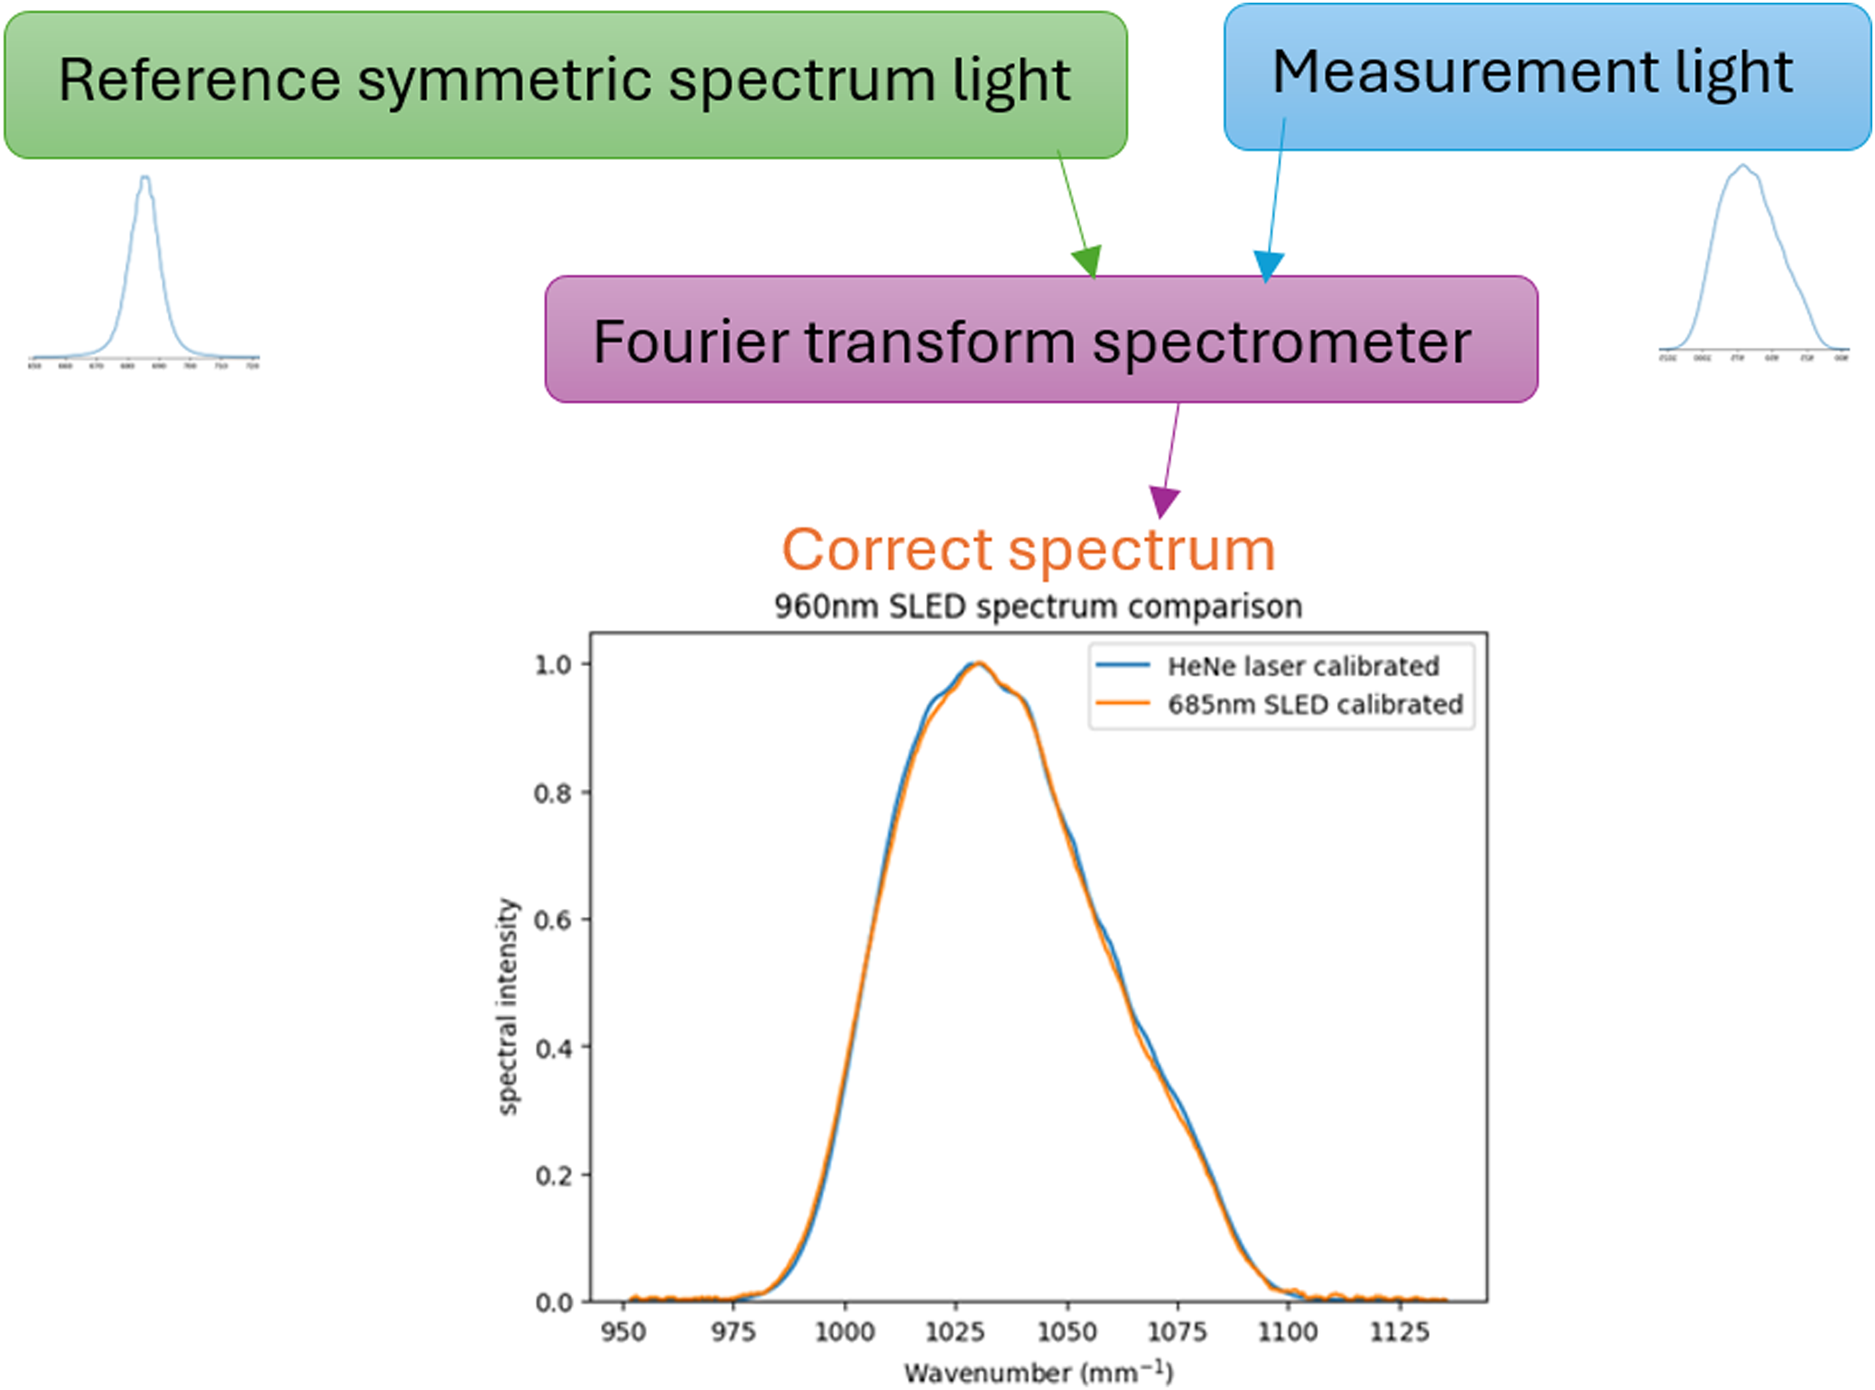
Keywords
Introduction
Fourier transform spectrometers typically require a dedicated reference light source to track optical delay changes precisely. The obtained tracking information is then used to either adjust the movement of the translation devices directly on the fly,1–3 or used to change the sampling rate dynamically so that the sampling points will be spread uniformly in the optical path difference (OPD) space,4–6 or stored for use later in data processing such as resampling the non-uniform data.7–9 The reference lights are typically monochromatic or assumed to be monochromatic light sources because the interferogram of a monochromatic light source is a simple sine wave that can be used to extract optical path position information easily. Sometimes it is also possible to utilize a portion of the measurement light for reference. 10 While it is desirable to have reference light as monochromatic as possible, it may bring drawbacks. For example, the commonly used helium–neon (HeNe) laser may be problematic for situations requiring small sizes such as miniaturized Fourier transform spectrometers.11,12 And a good monochromatic light source can be very expensive. This paper will attempt to broaden the selection of reference light sources by theoretically proving that non-monochromatic light sources with symmetric spectral profiles can also serve as reference light without introducing any more errors and without the need to change data processing methods or system designs. This paper will use some superluminescent diodes (SLEDs) to experimentally demonstrate this theoretical finding. This paper should also be beneficial to other optical technologies that rely on changing OPDs precisely.
Theory
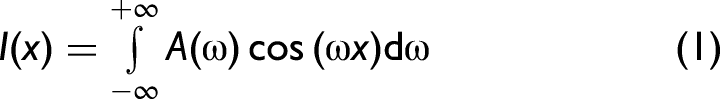
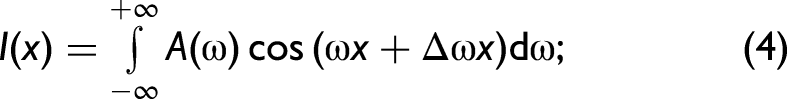
The interferogram from a multi-frequency light source can be considered as the simple addition of various cosine waves generated by each frequency component in the light source. Suppose that the interferometer in the spectrometer has been properly compensated so that every one of those cosine waves will have 0 phase at the point of zero OPD, then the interferogram can be expressed as:
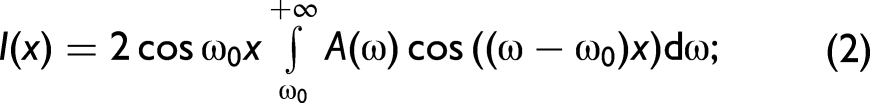
The existing methods in using reference light sources will not need to be modified because in real life the interferograms of reference light will never have perfectly constant amplitude due to many factors such as mirror misalignments and divergence of beam, etc. Thus, the existing techniques have already needed to tolerate amplitude variations of reference interferogram to some extent. For example, the most common technique of utilizing the reference interference signal is zero crossing which means taking one sample data whenever the reference interference signal reaches zero value. Obviously, in such a method the amplitude variation of the reference interferogram will not matter as long as it remains a cosine wave.
The above derivation had assumed that the interferometer is properly compensated. If the interferometer is not properly compensated, the interferogram will become:
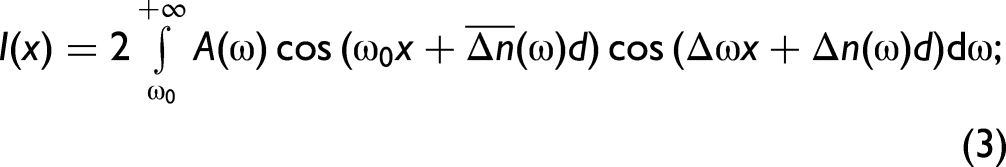
The drifts in the spectrum of reference light also need to be considered. In the traditional method of monochromatic reference light source, a slight drift in the frequency of reference light will only cause the obtained spectral result to shift slightly without other errors. The same property can be said of the symmetric non-monochromatic reference light source, a slight shift in the central frequency of reference light will only cause the measurement spectral result to shift slightly although symmetric broadband light sources may have bigger frequency instabilities than some typically used monochromatic reference light sources. But there may be a work around to this issue by using a standard sample with an already known spectral profile to correct the shifts so that accurate wavelength information can still be obtained. And if the spectral shape of the reference light also changes slightly but remains symmetrical, it will still cause no error either because this will only cause the cosine wave amplitude modulation envelope of the reference light interferogram to change slightly. Only if the spectral shape of the reference light changes asymmetrically that some spectral errors can be incurred. In such a case, it will be equivalent to adding a small amount of unwanted frequency components to the reference light source. But monochromatic light sources can also contain a small amount of unwanted light components and suffer this kind of error. So, in general, symmetric reference light can be resistant to spectral drifts in similar ways as monochromatic reference light. However, the same cannot be said about asymmetric light sources. Any drift in the spectrum of asymmetric light will cause its interferogram shape and zero crossing positions to change irregularly as can be judged from the following equation:
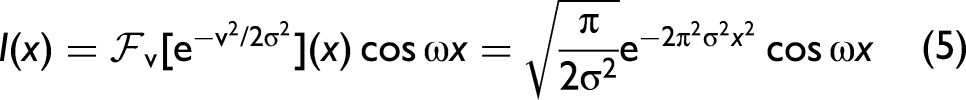
A symmetric continuous broadband light source will have limited coherence length. This is one drawback compared to the monochromatic source. Many broadband light sources have a Gaussian-like bell-shaped spectrum profile. For a Gaussian spectrum, the relation between the coherence length and the width of the spectrum is very simple because the Fourier transform of a Gaussian function will also be a Gaussian function. It can be derived from the convolution theorem of the Fourier transform that the interferogram of a Gaussian spectrum light source will be,
If a spectrum is made from several Gaussian functions added together, then its interferogram will also be a simple addition of the Fourier transform of these individual Gaussian components. Thus, the width of this interferogram will then be no larger than the width of the Fourier transforms of the narrowest Gaussian component.
Commercial Fourier transform spectrometers have typical scanning lengths in the order of magnitude of 1 cm. Suppose that the reference light interferogram is 1 cm wide, then the resolution of the resulting measurement spectrum would be about 1 cm–1 in wavenumber which is the inverse of wavelength. To get a better idea in terms of wavelength, one can also use the following relationship:

Experimental
Materials and Methods
This study would use an experiment to demonstrate using a symmetric non-monochromatic light source as a reference source by using a Thorlabs HRS015 frequency stabilized 632.8 nm HeNe laser and several SLEDs from Superlum including a 685 nm SLED-MS-261 and a 960 nm SLED-MS-481-MP-SM. The HeNe laser is a good monochrome light source and is used to establish the exact spectrum of the SLED light sources. Then it uses one of the SLED sources which has a symmetric spectrum as the reference source to measure the spectra of other SLEDs. A cube corner retroreflector or Mach–Zehnder type of Fourier transform spectrometer will be built for this experiment. Figure 1 shows the design of the spectrometer. There are four equal ports in this design, and they can be used interchangeably for either light input or detector output. This property is helpful because this experiment needs to frequently change light sources. Two identical Thorlabs PDA100A-EC switchable gain photodetectors were used together with a Thorlabs BS013 beamsplitter. The translation stage used is Physik Instrumente M-531.DDX. This experiment would use the simple non-uniform sampling scheme where the translation stage moving speed will vary during the scan and then it would use a non-uniform fast Fourier transform to process the data by using the position information obtained from reference interferograms. 13
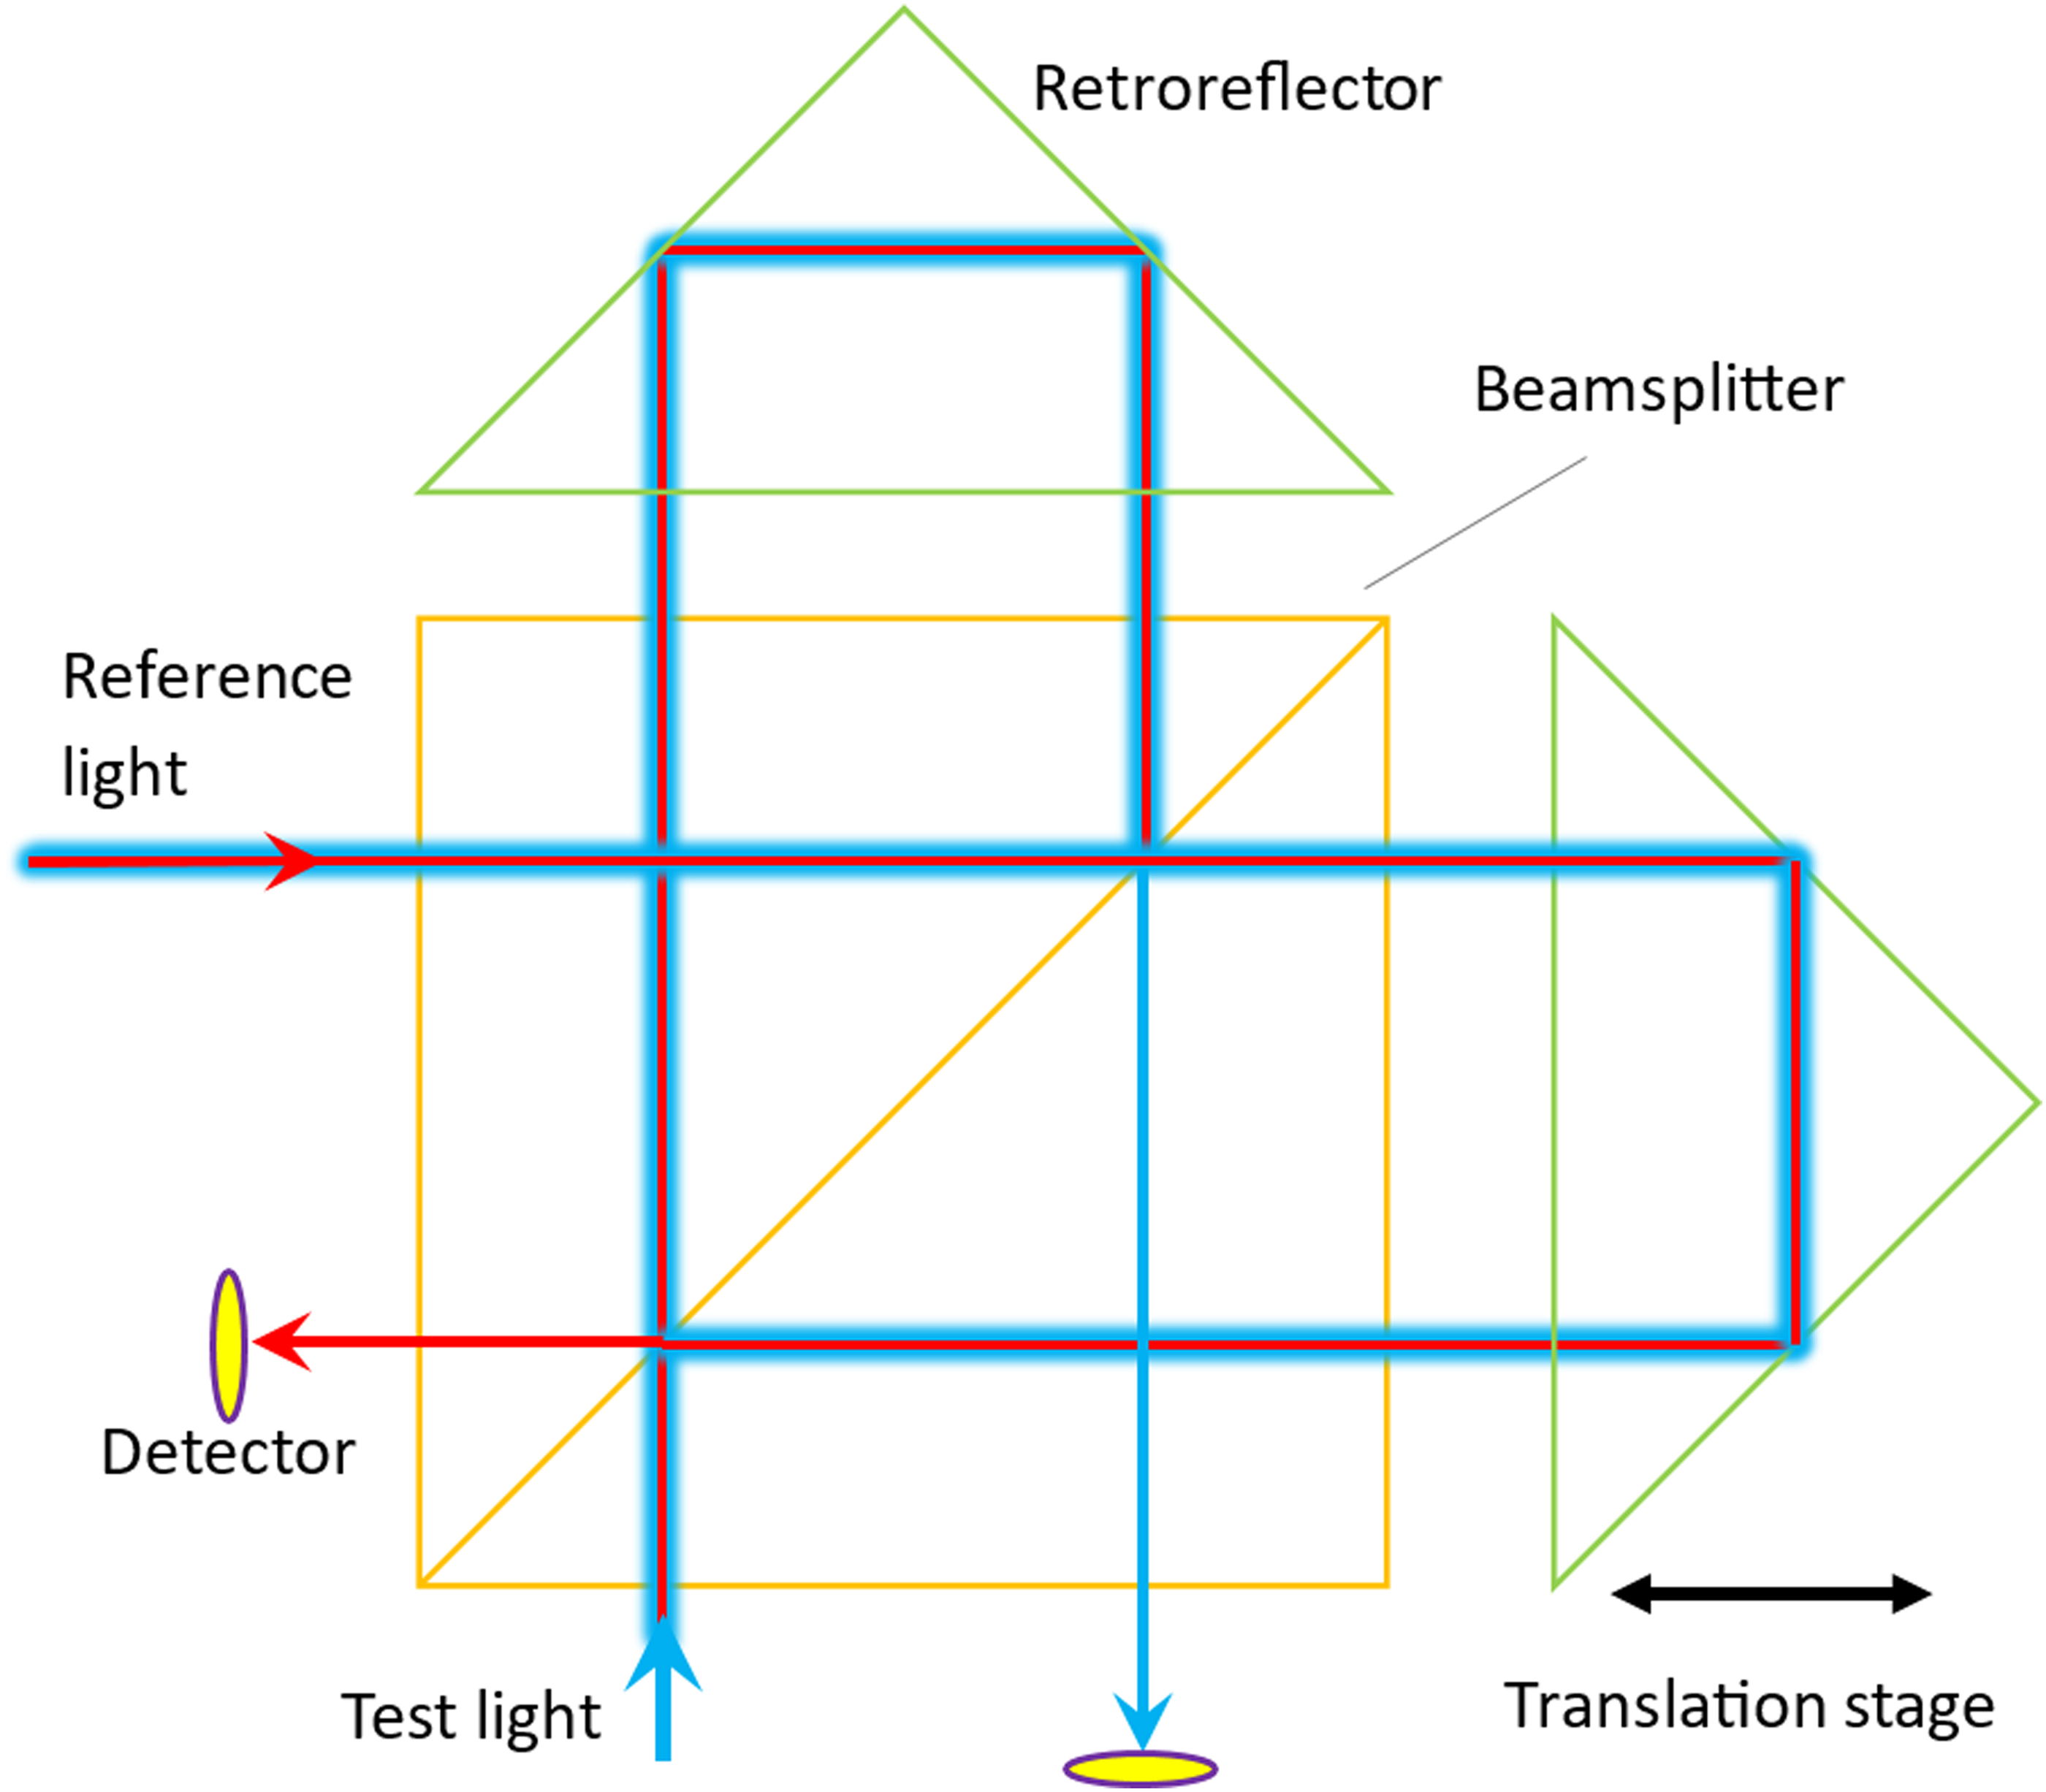
Setup design of this experiment.
Figure 2 shows an obtained example of the 685 nm SLED interferogram and corresponding calculated 685 nm SLED spectrum using the reference HeNe laser as well as its zero crossing positions and their linear regression analysis. The spectrum is plotted against wavenumber rather than the more conventional wavelength to reflect its symmetricity most accurately or asymmetricity since this theory is derived in wavenumber. It shows that the 685 nm SLED has a close to symmetrical spectral profile with ∼10.5 nm full width half-maximum. Its interferogram consists of one large bell-shaped envelope plus two small auxiliary bell-shaped envelopes on the sides. The zero crossing positions are obtained by cubic spline interpolation of the interferogram, and the zeroth index of the zero crossing points corresponds to the one that is nearest to the maximum of the interferogram. The errors to the linear fit of zero crossing positions of the 685 nm SLED interferogram are very small and <7 nm, which quantitatively shows that the interferogram of the 685 nm SLED is very close to a perfect amplitude modulated cosine wave. The slope of the linear fit is about 342.7 nm per step which indicates that the central frequency of the spectrum is about 685.4 nm. About 200 zero crossing points were used for the linear fitting as shown in the figure which is just sufficient to cover the full width of the 960 nm SLED interferogram shown in the next figure. Beyond this range, the fitting errors will increase due to much-diminished signal amplitude. Figure 3 shows a 960 nm plus the reference 685 nm SLED interferogram, and the comparison of its spectrum calibrated by HeNe laser and 685 nm SLED, respectively. These two spectra overlap with each other very well.
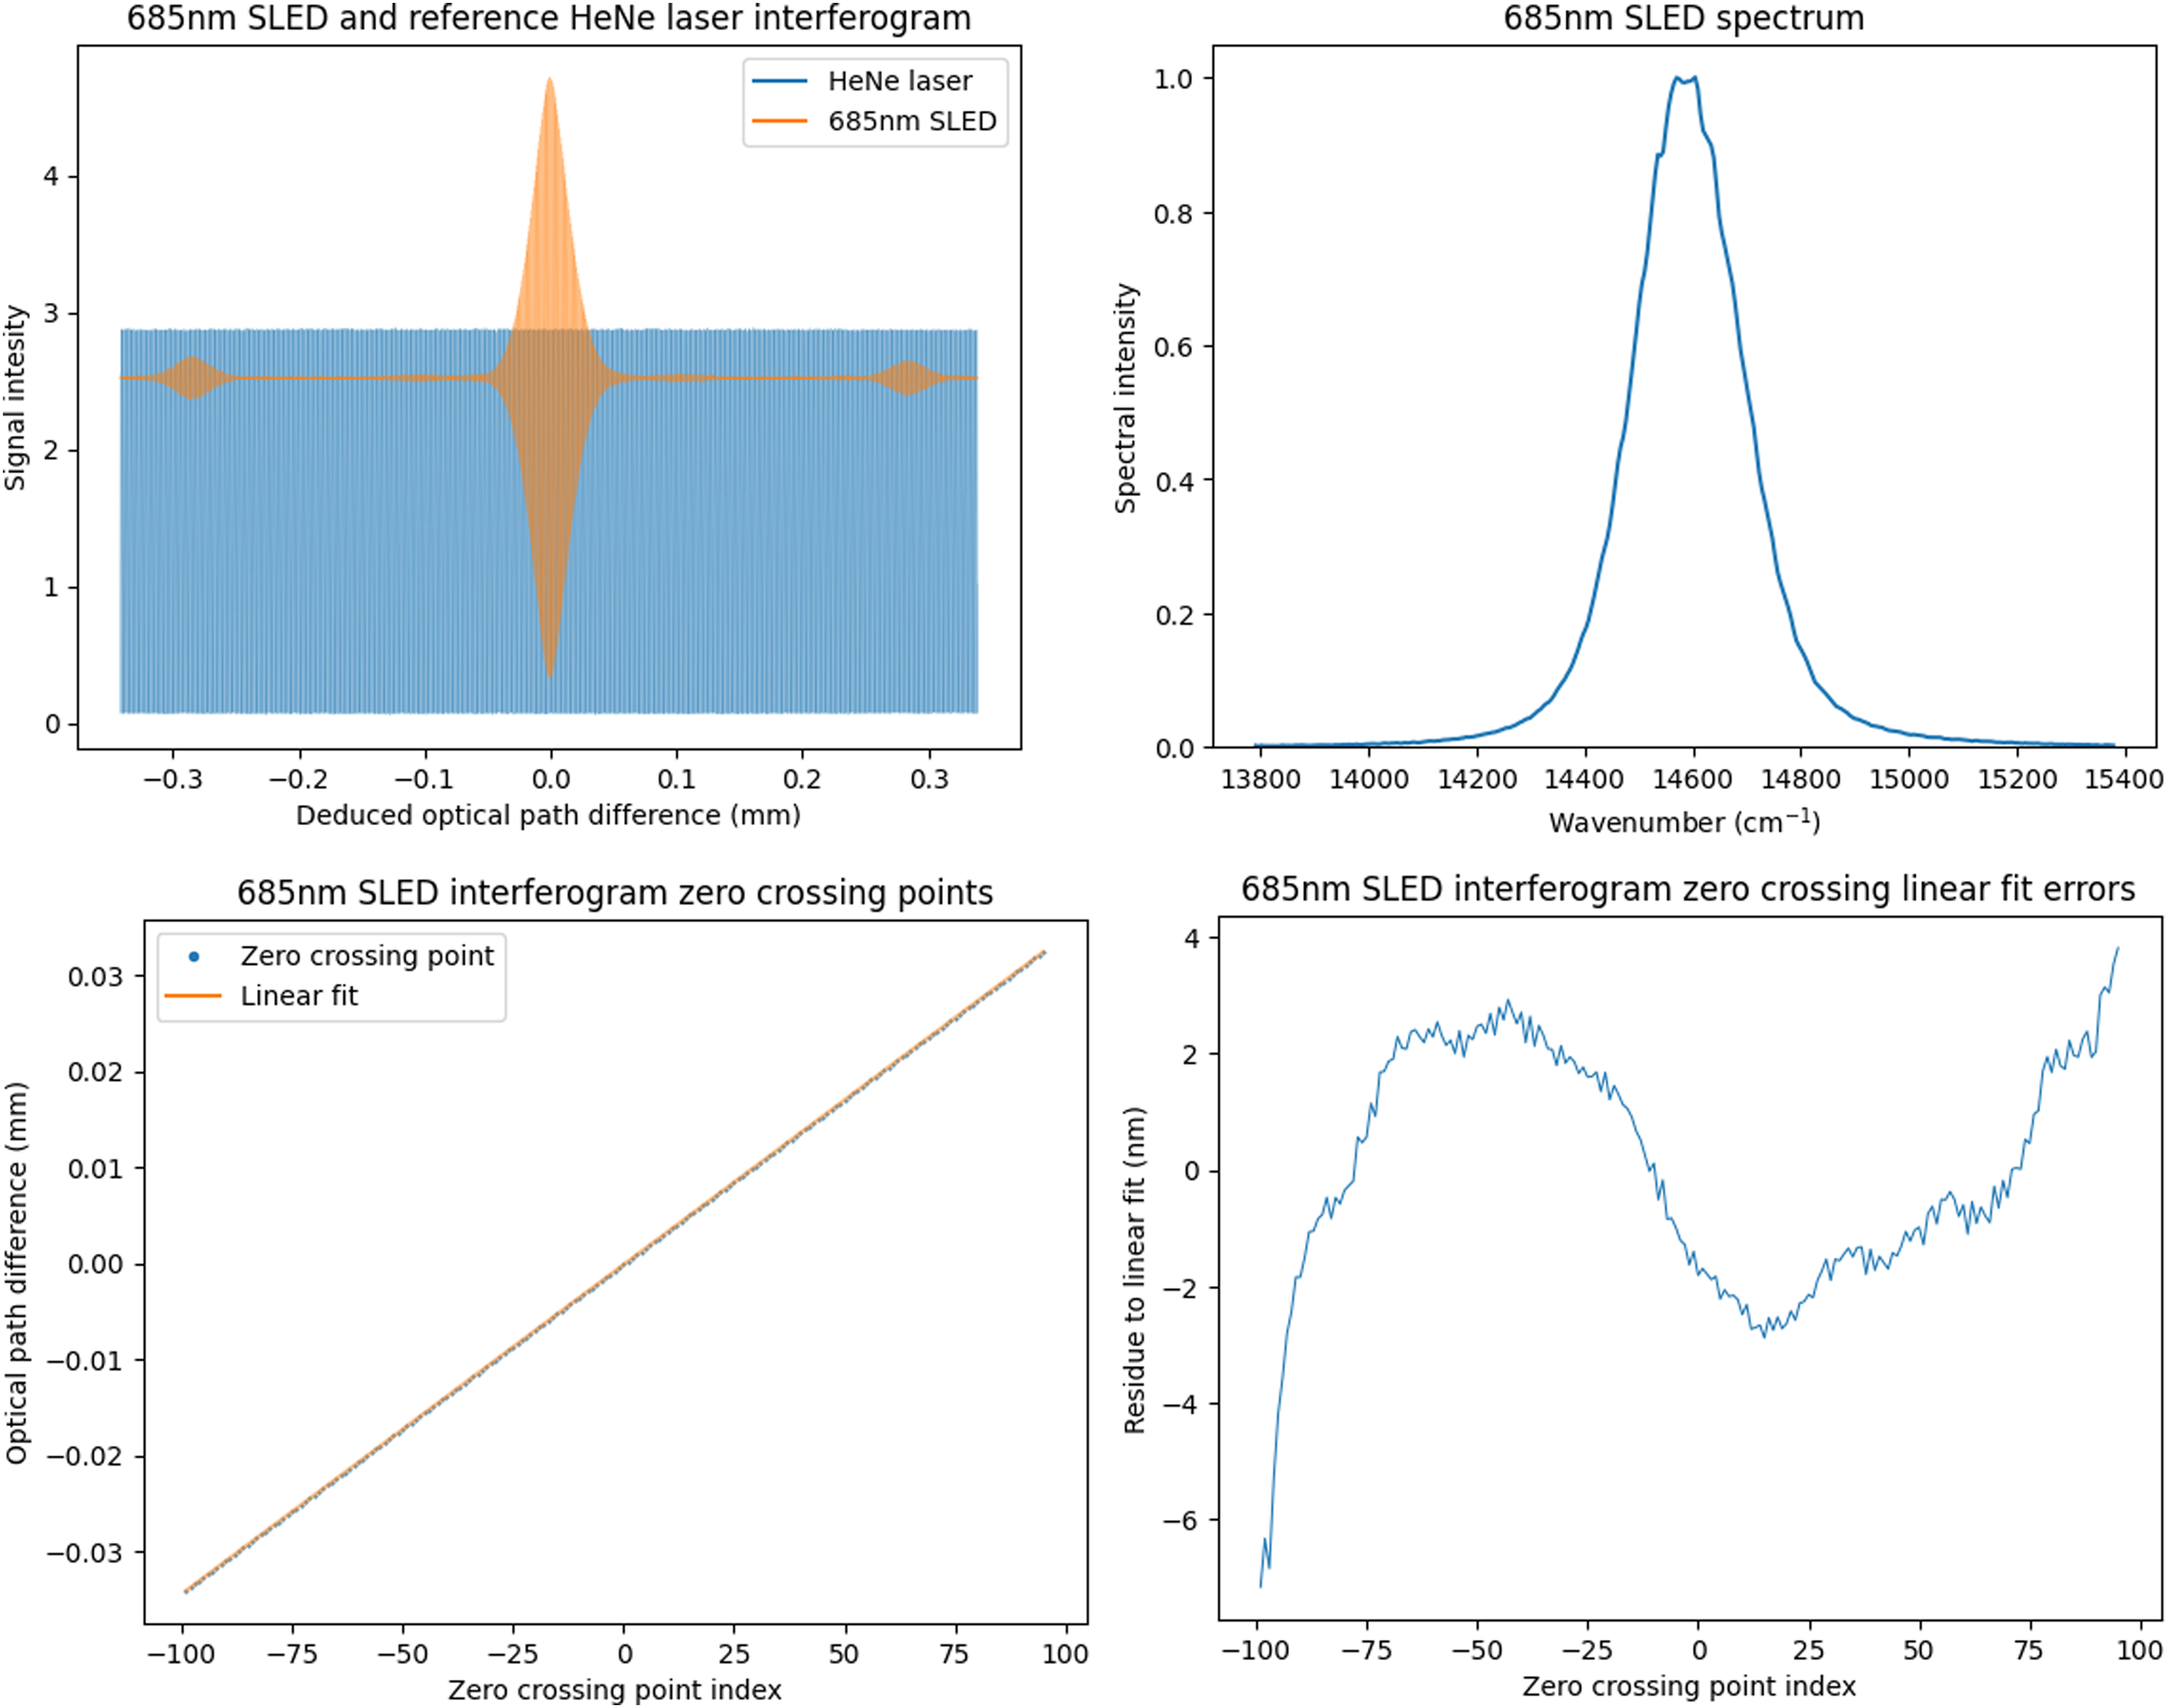
An example of 685 nm SLED and HeNe laser interferogram (top left), the corresponding 685 nm SLED spectrum (top right), the zero crossing positions of the 685 nm SLED interferogram and their linear fit (bottom left), and the errors to linear fit (bottom right).
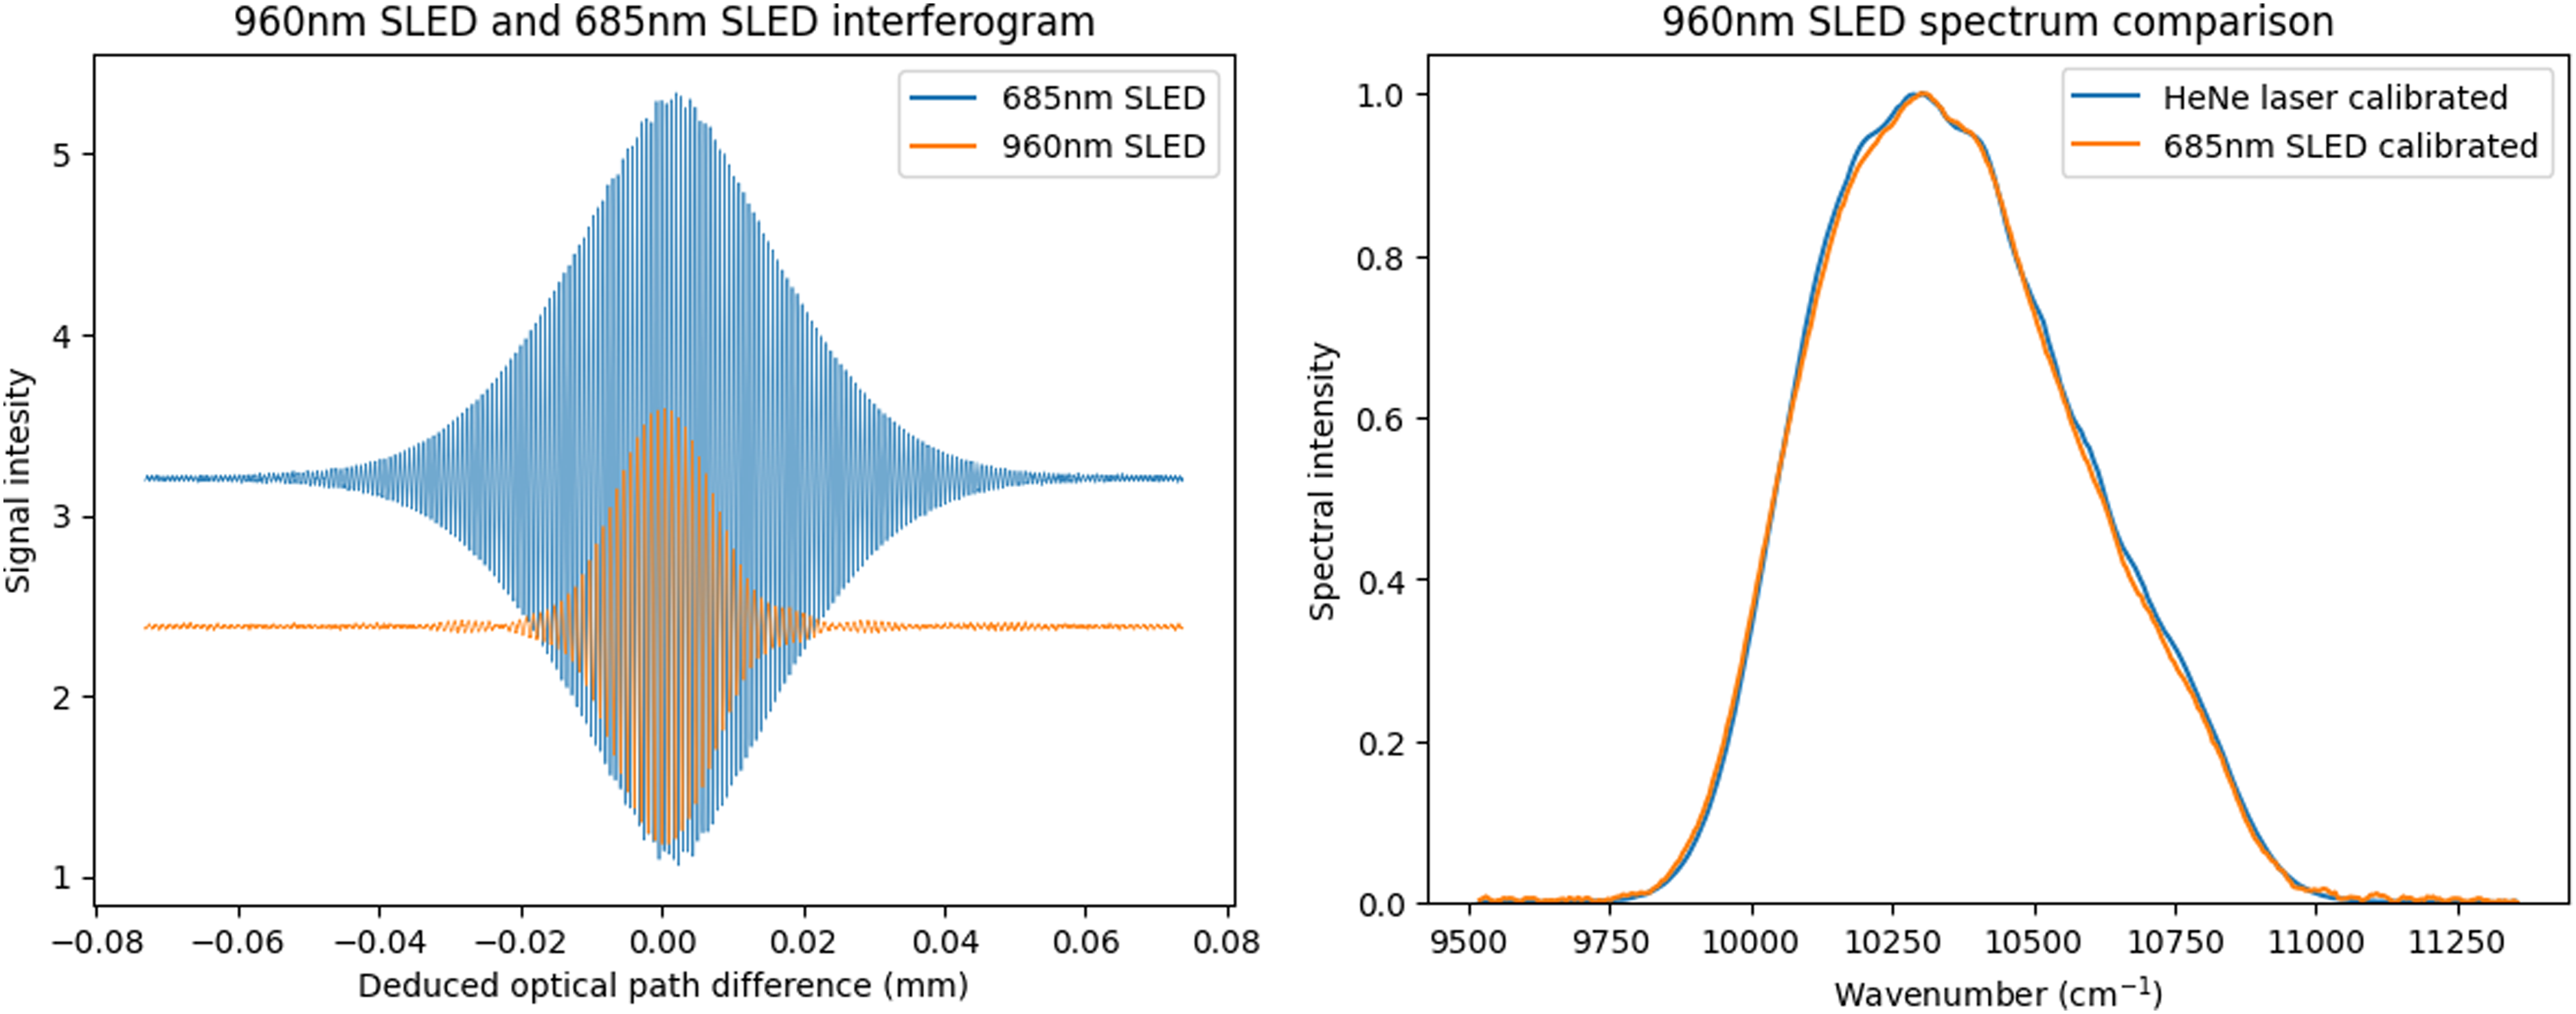
The 685 nm and 960 nm SLED interferogram (left) and 960 nm SLED spectra calibrated by 685 nm SLED and HeNe laser, respectively (right).
Results and Discussion
Most beamsplitter substrate materials will have a frequency-dependent refractive index which will result in the various cosine wave components in the interferogram having different phases at the point of zero OPD if the interferometer is not compensated. Without compensation using a symmetric light source may still work but some errors will be introduced. The experiment in this paper worked very well because the used cube beamsplitter is quite symmetrical and because the 685 nm SLED has a very narrow bandwidth so errors caused by compensation issues can be small.
In Figure 3, the 960 nm SLED spectrum calibrated by the 685 nm SLED differs slightly from the one calibrated by the HeNe laser. This is likely not due to the 685 nm SLED output spectrum not being symmetrical enough, but rather due to the output spectrum of the SLEDs used by this experiment being not very stable and would vary from run to run. This is normal because the spectrum of SLED depends heavily on temperature and current etcetera.14–16 The need to frequently change light sources in this experiment also made matters worse because little time was available for the SLEDs to stabilize after turning on before acquiring data. Several SLEDs of various wavelengths were tried in this experiment, and it was found that the spectrum stability of these SLEDs is not all the same and would differ quite a bit. The 960 nm and 685 nm SLEDs were not the least stable ones. This study does not have the ability to change or maintain the stability of the temperature and current of the SLEDs.
The experiment in this study has also revealed one shortcoming with using symmetric broadband light as a reference source in Fourier transform spectrometers which is that the coherence length of a broadband light source would be very short so it can only be used for low-resolution spectrometers. Theoretically, there is a possible solution to this problem, which is to use a symmetric multimode laser which will have a much longer coherence length although such kind of laser may be unrealistic to find, and the spectrum of multimode lasers may also not be stable. Perhaps it would be more likely to use a polarizer or a series of polarizers to turn a nonsymmetric laser into a symmetrical one. While a multimode laser may be more expensive than light-emitting diode light sources, it is likely to still be significantly cheaper than the high-end monochromatic single-mode lasers. And perhaps even more importantly, this can help broaden the selection of reference light sources for situations where a monochromatic laser is less accessible. Another possible solution would be to use a narrow bandpass filter or a monochromator on the presumably broadband measurement light source to generate a narrow symmetric light source. The problem is that narrow enough bandpass filters may not be available in the market. A 0.1 nm bandpass wide filter is probably needed to achieve a 1 cm order of magnitude long coherence length depending on the value of central frequency. And after passing the filter the light intensity may become too much reduced to have a good signal-to-noise ratio. Nevertheless, this study has demonstrated that it is very possible to use a broadband light source to measure the spectrum of other broadband light sources with very remarkable accuracy.
Actually, no reference light sources in real life are perfectly monochromatic. The reference light sources in Fourier transform spectrometers are only monochromatic in the sense that they can be approximated to be monochromatic within the relatively short scanning length compared to the coherence length. The significance of this paper is that it shows that as long as the spectrum of the reference light is symmetrical then the non-monochromaticity of the reference source will not cause any errors.
Theoretically, any asymmetric light source could be used as a reference light if one would resort to brute force numerical methods. Because the spectrum of a reference light is already known, theoretically the sample point OPD positions of any reference light interferogram can be numerically reverse-engineered by comparing it with the theoretically predicted interferogram profile and zero crossing positions. However, such a hypothetical brute-force method would have a lot of drawbacks. It would require significantly different and more complicated data processing methods and possibly even significant changes to the design of the experiment. Given that such a method does not bring any performance gains, it may not be worth to make these changes. And it will likely work less well too due to possible variations in the spectrum of the reference light for reasons detailed in the theory section. The lack of analytical solutions will mean that any spectral drifts will cause unpredictable errors. Although it is possible to correct for the drifts in the spectrum of reference light by using a monochromatic light to regularly calibrate it, this would defeat the purpose of using asymmetric light as reference light if one can have regular access to a monochromatic light source. Thus, such a hypothetical numerical brute force method is probably not very practical. To the best of our knowledge, this hypothetical method has never been attempted in the literature before.
Conclusion
This paper has proposed to use a symmetric spectrum non-monochromatic light source instead of monochromatic light as a reference source in Fourier transform spectrometers. It has used an experiment to demonstrate that a symmetric broadband light source can measure the spectrum of other broadband light sources very accurately. It has also provided analysis to show why asymmetric light is unfit for use as reference light.
Supplemental Material
sj-docx-1-asp-10.1177_00037028241305415 - Supplemental material for Symmetric Non-Monochromatic Light as Reference in Fourier Transform Spectrometers
Supplemental material, sj-docx-1-asp-10.1177_00037028241305415 for Symmetric Non-Monochromatic Light as Reference in Fourier Transform Spectrometers by Muqian Wen in Applied Spectroscopy
Footnotes
Declaration of Conflicting Interests
The author declared no potential conflicts of interest with respect to the research, authorship, and/or publication of this article.
Funding
The author received no financial support for the research, authorship, and/or publication of this article.
Supplemental Material
All supplemental material mentioned in the text is available in the online version of the journal.
References
Supplementary Material
Please find the following supplemental material available below.
For Open Access articles published under a Creative Commons License, all supplemental material carries the same license as the article it is associated with.
For non-Open Access articles published, all supplemental material carries a non-exclusive license, and permission requests for re-use of supplemental material or any part of supplemental material shall be sent directly to the copyright owner as specified in the copyright notice associated with the article.