
Abstract
Volatile organic compounds (VOCs) are an ever-growing hazard for health and environment due to their increased emissions and accumulation in the air. Quantum cascade laser-based infrared (QCL-IR) sensors hold significant promise for gas monitoring, thanks to their compact, rugged design, high laser intensity, and high molecule–specific detection capabilities within the mid-infrared spectrum's fingerprint region. In this work, tunable external cavity QCLs were complemented by an innovative germanium-on-silicon integrated optics waveguide sensing platform with integrated microlenses for efficient backside optical interfacing for the tunable laser spectrometer. The waveguide chip was coated with a mesoporous silica coating, thereby increasing the signal by adsorptive enhancement of VOCs while at the same time limiting water vapor interferences. Different least square fitting methods were explored to deconvolute the resulting spectra, showing subparts-per-million by volume (sub-ppmv) limits of detection and enrichment factors of up to 22 000 while keeping the footprint of the setup small (29 × 23 × 11 cm³). Finally, a use-case simulation for the continuous detection of VOCs in a process analytical technology environment confirmed the high potential of the technique for the monitoring of contaminants. By successfully demonstrating the use of photonic waveguides for the monitoring of VOCs, this work offers a promising avenue for the further development of fully integrated sensors on a chip.
This is a visual representation of the abstract.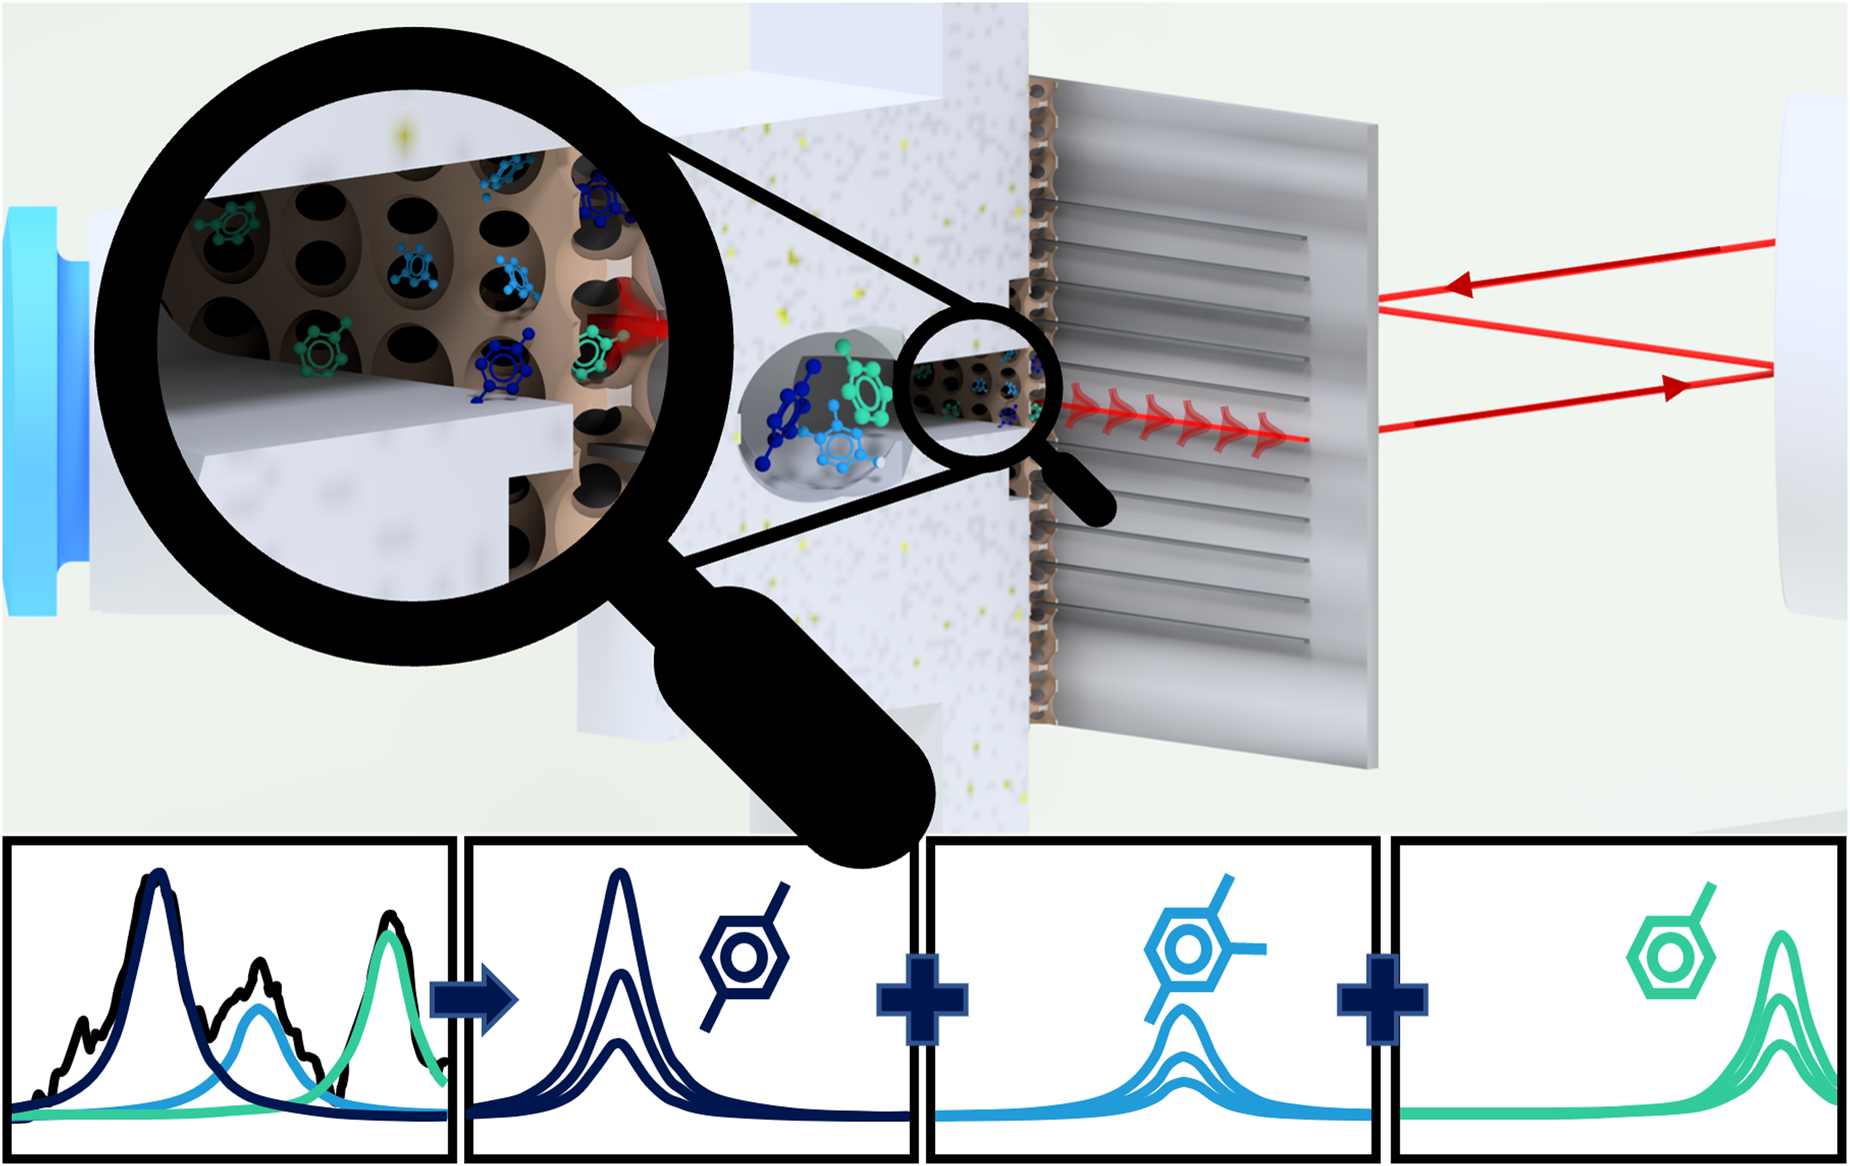
Keywords
Introduction
Volatile organic compounds (VOCs) are a class of organic compounds with high vapor pressure at atmospheric conditions. Anthropogenic VOC emissions are formed during combustion processes, in the paint and ink industry, the generation of fossil fuels, and farming. They account for total global emissions of 100 Mt per year. 1 Many of those show harmful effects on humans, animals, and plants alike and are classified as environmental contaminants. 2 Therefore, it is important to continuously monitor their concentrations, especially in high-exposure environments such as gas stations, industry, and indoors. Here, concentrations can peak into the ppmv range.3,4 The increasing need for environmental protection and personal safety has driven the development of a wide range of VOC sensors, 5 among them (electro)chemical VOC sensors, 6 gravimetric sensors, 7 or nontargeted approaches using gas chromatography coupled with mass spectrometry (GC-MS). 8 However, these sensors suffer from limitations such as lack of selectivity, interference with other compounds in the air (e.g., water vapor), or high cost and bulkiness, as is the case with GC-MS. Consequently, detecting low concentrations of VOCs from a complex atmosphere remains a significant challenge.
Mid-infrared (mid-IR) spectroscopy probes the characteristic ro-vibrational modes of molecules and shows great promise to selectively detect VOCs in complex atmospheres. 9 Going beyond traditional Fourier transform infrared (FT-IR) spectroscopy, quantum cascade lasers (QCL) or interband cascade lasers can be employed, making use of their inherently high intensity to enable higher sensitivities. 10 However, to reach the high sensitivities needed for trace gas analysis in absorption mid-IR spectroscopy, long interaction lengths are needed. These are typically realized by employing bulky and expensive multipass cells, also necessitating high sample volumes. 11
For more compact devices, sensing schemes based on indirect absorption, such as the photothermal and photoacoustic effects can be employed, reaching limits of detection (LODs) down to the parts-per-trillion by volume (pptv) range.12,13 For multigas sensing, the nonbroadband nature of these very sensitive and selective devices once again results in bulkier designs. 14 Integrated evanescent field sensing schemes based on mid-IR QCL spectroscopy and waveguides have been demonstrated. They offer very small footprints and broadband applications going toward a Lab-on-a-Chip approach. 15 However, the propagation losses in the mid-IR region, which are still in the range of 10 dB cm−1 for most waveguides or 2.5 dB cm−1 for more efficient Ge-on-Si systems, 16 limit the optical path lengths for gas sensing applications.
By employing enrichment layers, the concentration of target analytes in the probed volume of the waveguide can be locally increased. Hence, the sensitivity of waveguide-based sensing schemes can be enhanced while reducing the pathlengths and, thus, propagation losses. One approach can be the preconcentration of analytes before interaction with the sensor, which has been demonstrated successfully for other sensing methods such as gas chromatography, 17 sensors based on surface acoustic waves, 18 or a combination of complementary sensors. 19 In recent years, it has also been shown that the use of thin layers of various materials can significantly improve the sensitivity of evanescent field sensing schemes by acting as preconcentrators for VOCs. These materials include polymers for VOCs in water, 20 metal oxides, 21 and mesoporous materials (e.g., mesoporous silica). 22 Our recent report also showed a proof of concept using enrichment layers for Ge-on-Si systems, reaching low ppm LODs for toluene in water. 23
In this contribution, we present a multigas sensor based on our previously presented platform, as outlined in Figure 1. In our approach, the QCL light is coupled into the Ge-on-Si optical waveguides from the backside of the chip using monolithically integrated microlenses and grating couplers. The waveguide is complimented by a mesoporous silica coating, which allows for the enrichment of target analytes from the gas phase. The hydrophobic nature of the coating excludes water vapor from the probed volume of the waveguide. This significantly reduces the strong water vapor interferences with the characteristic fingerprint bands of VOCs. 24 The waveguide platform is mounted in an external cavity-QCL-based mid-IR spectrometer with a tuning range between 1750 and 1350 cm−1, covering the propagating wavelength range of 6.5–7.5 µm (1540–1335 cm−1) of the waveguide. For the validation of the sensor, we chose three different aromatic VOCs, namely, toluene, p-xylene, and 1,2,4-trimethylbenzene. We applied vapor samples of the individual VOCs as well as different VOC mixtures to the sensor, demonstrating sub-ppmv LOD and high stability against water vapor traces. Deconvolution of the overlapping spectra was performed using least square fitting methods such as multivariate curve resolution alternate least squares (MCR-ALS), with different algorithms evaluated in respect to the real-time applicability. This was then showcased in a sensor use-case simulation, where we determined the response and stability of the sensor. Although improvements in the long-term stability of the sensor still need to be made, we believe that this work facilitates future advances in moving integrated photonic technologies further toward real-world applicability.
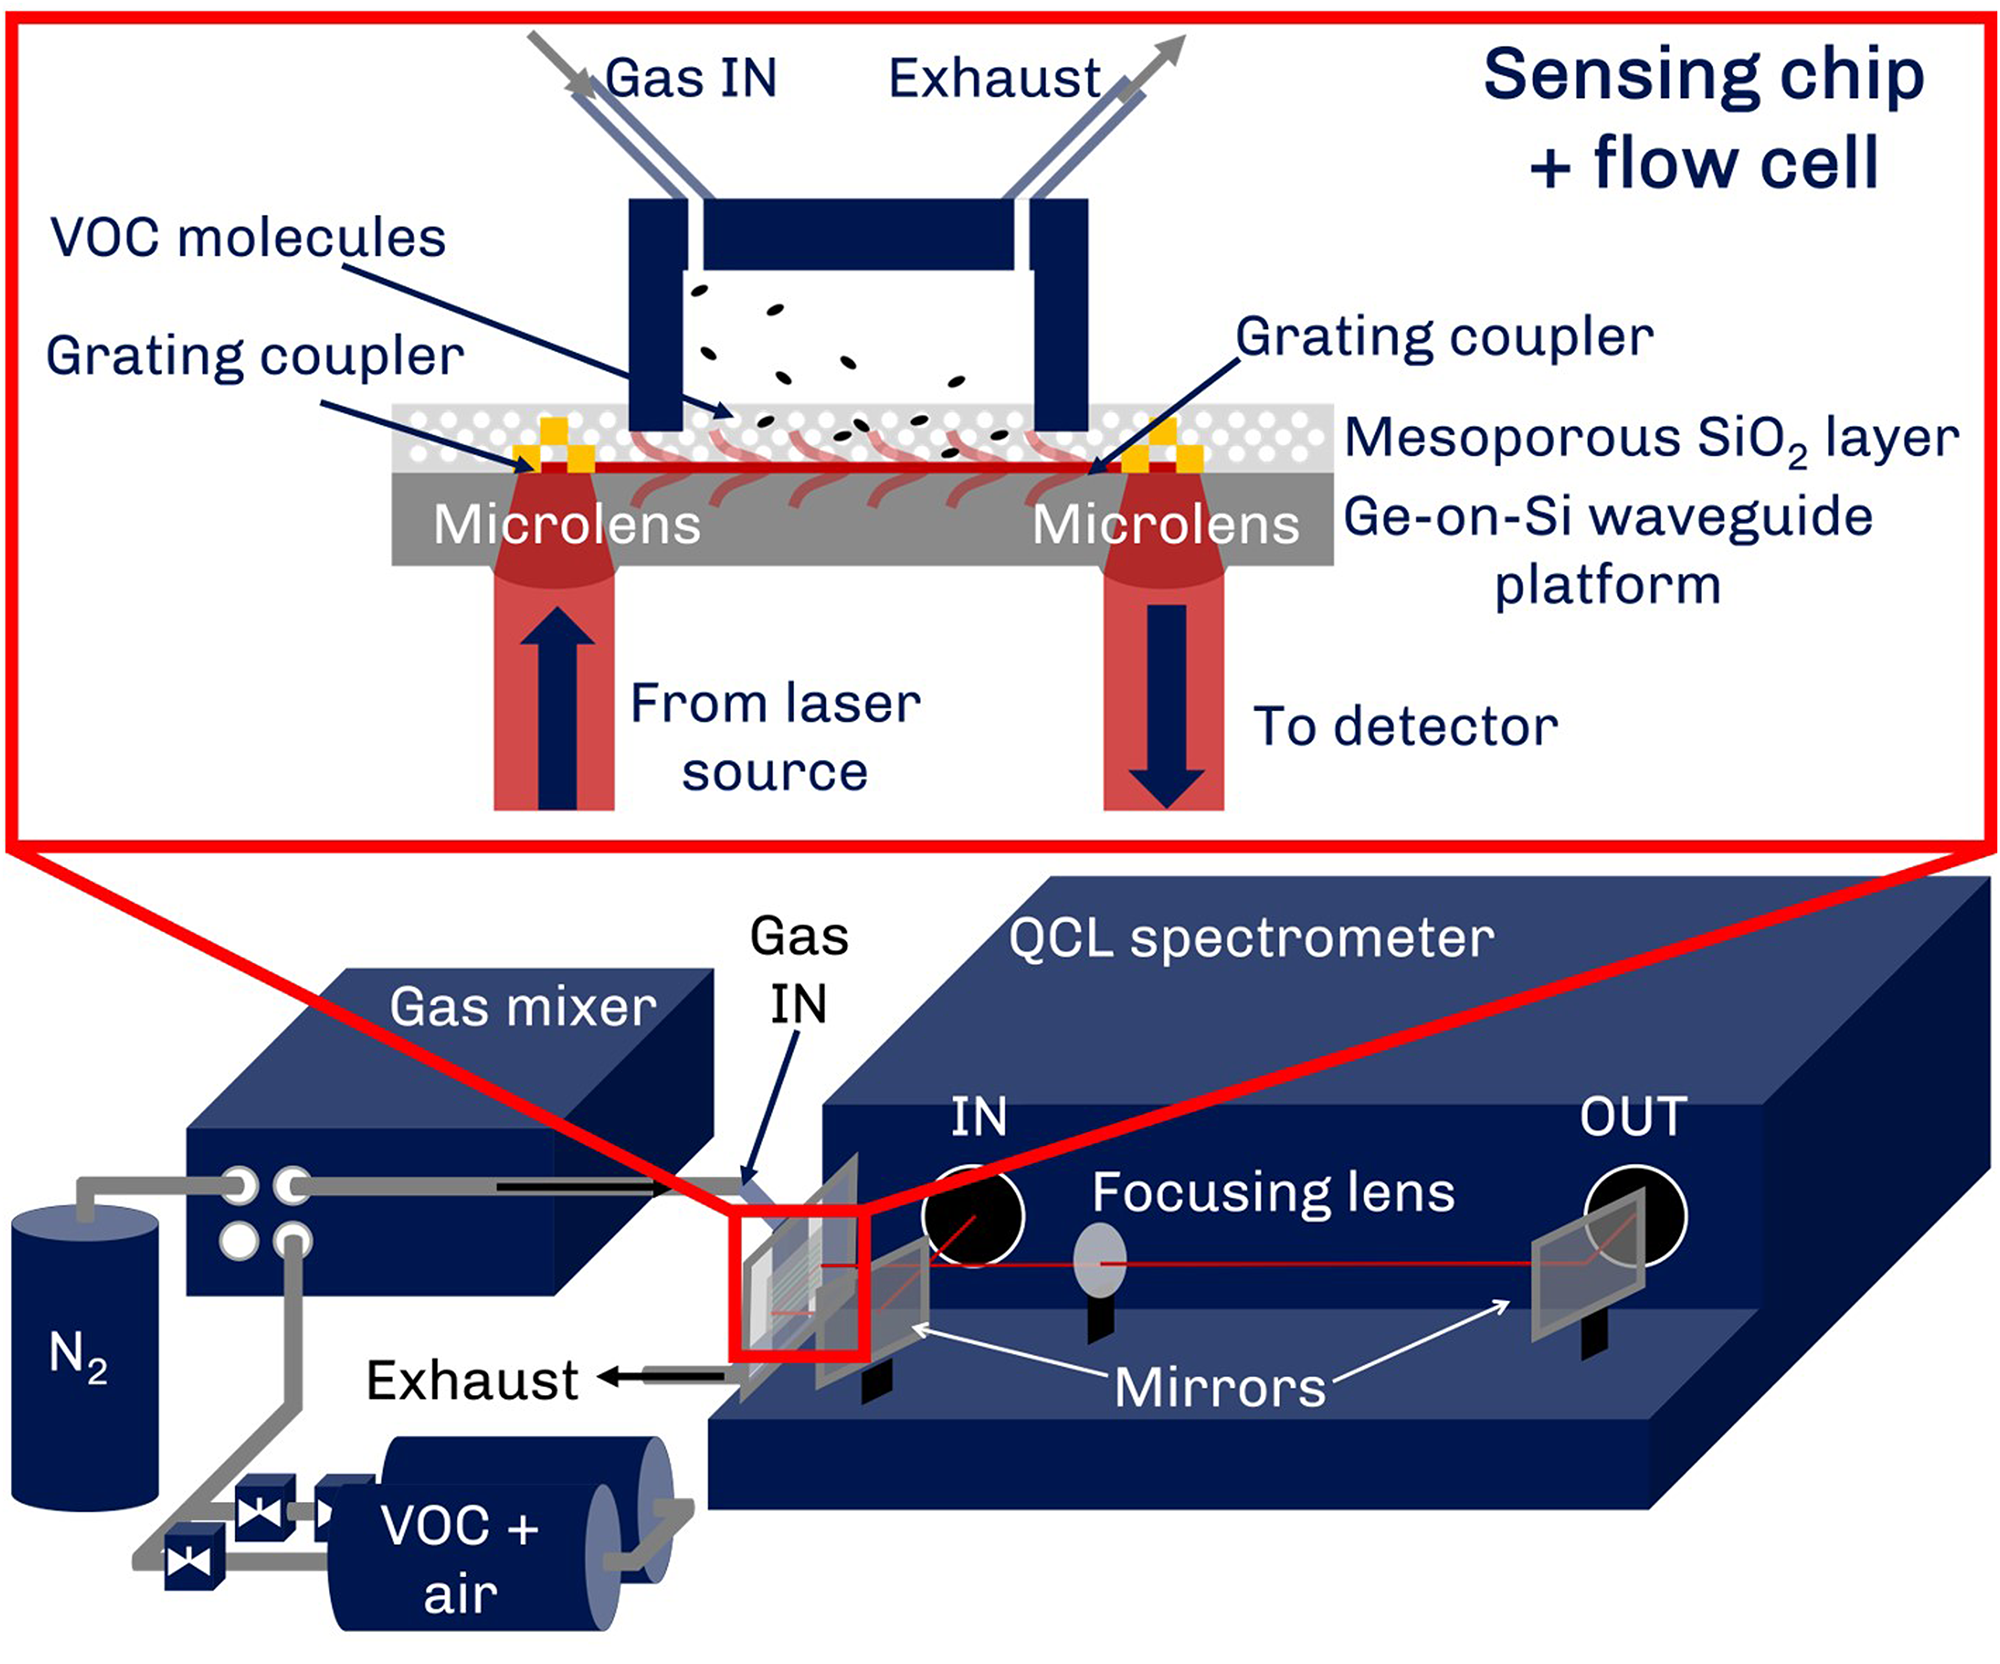
Schematic depiction of the multigas sensing platform and the enrichment concept and the gas sampling system as employed in this report. The sample VOC gas cylinder (VOC + air) and N2 for the dilution are connected to the gas mixer supplying the sensing chip with sample gas mixtures at a constant flow.
Experimental
Materials and Methods
Ethanol (EtOH, Chem-Lab, 100% p.a.), tetraethoxysilane (TEOS, Sigma-Aldrich 99.5%), hydrochloric acid (HCl, VWR, 37%), cetyltrimethylammonium bromide (CTAB, Sigma-Aldrich, 99%), hexamethyldisilazane (TCI Chemicals, >96.0%), toluene (VWR AnalaR NORMAPUR, 99.8%), and p-xylene (Merck, 99%), 1,2,4-trimethylbenzene (Sigma-Aldrich, p.s.) were used as received. Absolute acetone (Sigma-Aldrich, 99%) used for surface functionalization was dried over molecular sieves. Acetone and isopropyl alcohol (IPA) for rinsing the chips were used in technical quality.
Peak Deconvolution Using Least-Squares Fitting
The nature of absorption spectra being linearly dependent on the concentration c of the analyte as described in the Beer–Lambert law (Eq. 1) can be used for peak deconvolution using least-squares fitting (Eq. 2). By assuming the total spectrum D of a multicomponent mixture being the product of a loading matrix C, which is directly correlating to the concentration of the respective analytes, and a spectral matrix


On the other hand, MCR-ALS is a very powerful soft-modeling technique that can be used without knowing the pure component spectra but requires more computational power and calculation time. It iteratively improves the loading and spectral matrices starting from an initial estimation until a threshold value for the standard deviation of the residual matrix is reached. In the used Matlab toolbox, 27 the number of components was determined to be three to account for all three applied VOCs (four components were also tried to account for water, with no tangible improvement), with the initial estimate being generated using a method similar to the SIMPLISIMA algorithm. 28 We chose non-negative constraints for both the spectral and concentration matrices. For the comparison of the execution times, we used a desktop computer with an AMD Ryzen 5 3600 processor and 16 GB of RAM.
Fabrication of the Integrated Optics Waveguide Sensor
The sensor fabrication consists of three different parts: fabricating the grating couplers and waveguides, fabricating the microlenses, and applying the mesoporous coating.
After cleaving the sample from a 10.16 cm (4-in.), Ge-on-Si wafer, a photoresist coating (MIR701) was spin-coated onto the sample. Using ultraviolet (UV) lithography, we patterned the grating coupler and waveguide layout into the photoresist. This pattern was then transferred onto the 2 µm-thick germanium layer in one etch step through reactive ion etching (RIE) with a mixture of carbon tetrafluoride (CF4), sulfur hexafluoride (SF6), and H2, etching 1 µm of Ge. We subsequently removed the remaining photoresist by rinsing with acetone, IPA, and deionized water and then using oxygen plasma. Another UV-lithography step was used for a lift-off process so that a reflective layer of 1 µm of gold, deposited using e-gun evaporation, only covered the grating couplers.
Before defining the microlenses on the backside, we protected the top side with a thick layer of photoresist. Then, we polished the backside to minimize scattering effects. We applied a thick layer of AZ4562 (12 µm) to the backside and patterned it with UV lithography, leaving cylinders with a diameter of 250 µm. These were then reflowed on a hotplate at 150 °C, resulting in nearly spherical structures. These structures were transferred from the photoresist layer into the silicon using RIE with an SF6–O2 gas mixture and finally covered with a 900 nm thick SixNy antireflective coating using plasma-enhanced chemical vapor deposition. Finally, we removed the photoresist from the top by again rinsing in acetone, IPA, and deionized water and freed the surface from any remaining residues using oxygen plasma.
We prepared the sensing layer based on mesoporous silica with an ordered three-dimensional (3D) hexagonal pore structure in accordance with our previously reported method. 29 Three films were spin-coated onto the waveguide chip by using a sol solution with a molar ratio of 1:13:5:5·10−3:0.12 for TEOS:EtOH:H2O:HCl:CTAB. Between each coating step, the layers were annealed at 110 °C overnight. After the deposition of the three layers, we performed surface functionalization and template removal as previously reported. 29
Laser-Based Mid-IR Spectroscopy
For recording the IR spectra, we used the ChemDetect Analyzer (DRS Daylight Solutions, USA), a commercially available external cavity-QCL-based mid-IR spectrometer with a tuning range between 1750 and 1350 cm−1. During operation, the laser head was water cooled to 17 °C. We acquired the spectra using the proprietary ChemDetect software, with one spectrum consisting of 30 scans averaged over 15 s. The sensor chip was mounted in a custom-built waveguide mount we adapted from our previously reported add-on unit 23 for laser spectrometers to comply with the dimensions of the ChemDetect Analyzer. We determined the noise level and the transmittivity of the sensor by collecting 100% lines of the sensor flushed with N2.
Sample Preparation
The pure gas samples and gas mixtures were prepared using an adapted protocol from a previous report. 22 For this, 400–600 µL of the liquid VOCs were injected into a PTFE tubing connected to the evacuated gas reservoir (2 × 10 L Festo CRVZS Series, connected with stainless steel tubing). After filling the reservoir with pressurized air to 7 bar, the filled gas cylinder was then connected to an MCQ GB100 gas mixer (MCQ instruments, Italy) via a pressure-reducing valve to ensure a 1.5 bar operating pressure. N2 was connected to the second inlet of the gas mixer to dilute the gas samples.
To determine the VOC concentrations of the diluted gas samples, the outlet of the gas mixer was connected to a 4 cm gas transmission cell mounted in a Vertex 70v FT-IR spectrometer (Bruker, Germany) equipped with a liquid nitrogen cooled mercury–cadmium–telluride detector (InfraRed Associates, D* = 4 × 1010 cm Hz0.5 W−1 at 9.2 μm). Using this setup, the transmission cell was flushed with dilutions of the gas samples (with 2% steps between 0% and 10% and 10% steps between 10% and 100%) and collected the spectra with the Bruker Opus 8.1 software. They were recorded using a spectral resolution of 2 cm−1, 32 scans per spectrum (double-sided, backward forward acquisition mode). During all measurements, the sample compartment was flushed with dry air. The VOC concentrations were obtained by deconvoluting the mixed spectra using a Matlab R2021a script by applying an MCR-ALS algorithm to the collected spectra in the spectral range of the skeletal vibrations of the aromatic rings of the VOCs between 1400 and 1600 cm−1. The corresponding concentrations were calculated by multiplying the loadings with the respective pure spectra and comparing the areas with reference spectra (1 ppm, 1 m path length) from the PNNL database (for 1,2,4-trimethylbenzene, the spectrum of 1,2,3-trimethylbenzene was used under the assumption of a similar total absorption in the analyzed region).
Sensor Calibration
For the demonstration of the sensing capabilities, we applied several dilutions of VOC samples with concentrations between 0–800 parts per million by volume (ppmv) for the more volatile toluene and 0–200 ppmv for the less volatile p-xylene and 1,2,4-trimethylbenzene, to the sensing unit using a total flow rate of 500 mL min−1. We then tested the response of the sensor by applying a gas mixture of all three VOCs and determined the time it took for the equilibrium concentration and subsequent sensor regeneration to be reached.
For the calibration of the sensor, we applied pure VOC samples and all possible combinations at a total flow rate of 500 mL min−1 for 3 min, followed by a flushing step for another 3 min. We obtained the peak areas of the respective VOC components by deconvoluting the mixed spectra using a Matlab R2021a script by applying a NNLS algorithm to the collected spectra in the spectral range of the skeletal vibrations of the aromatic rings of the adsorbed VOCs between 1490 and 1525 cm−1 using Lorentzian functions as pure component spectra. We then calculated the calibration function by multiplying the loadings with the respective pure spectra and fitting the data using the Freundlich adsorption model.
Use-Case Simulation
For the demonstration of the sensing capabilities in a more realistic experimental setup, we applied dilutions of a mixture containing all three VOCs with concentrations between 0–200 ppmv (for the more volatile toluene) and 0–100 ppmv (for the less volatile p-xylene and 1,2,4-trimethylbenzene) to the sensing unit using a total flow rate of 500 mL min−1. To simulate a realistic application of the sensor, the concentrations of the dilution were increased and decreased over a time period of 66 min.
Next, we deconvoluted the mixed spectra by applying the same NNLS algorithm to the collected spectra in the spectral range of the skeletal vibrations of the aromatic rings of the adsorbed VOCs between 1490 and 1525 cm−1 using Lorentzian functions as pure component spectra. Finally, we applied the calibration model to the deconvoluted spectra to obtain the measured concentrations of the respective VOC components.
Results and Discussion
Evaluation of the Sensing System
Figure 1 depicts a schematic of the sensing setup. The mounted chip is housed in a gas flow cell, which is fed with VOC mixtures from the outlet of the gas mixer. The two inlets of the gas mixer are connected to the VOC sample and N2 used for dilution, respectively.
The transmittivity of the waveguide structure and the noise levels was determined by acquiring 100% lines of the coated waveguide during N2 flow. The single channel spectrum and 100% lines are shown in Figure 2.
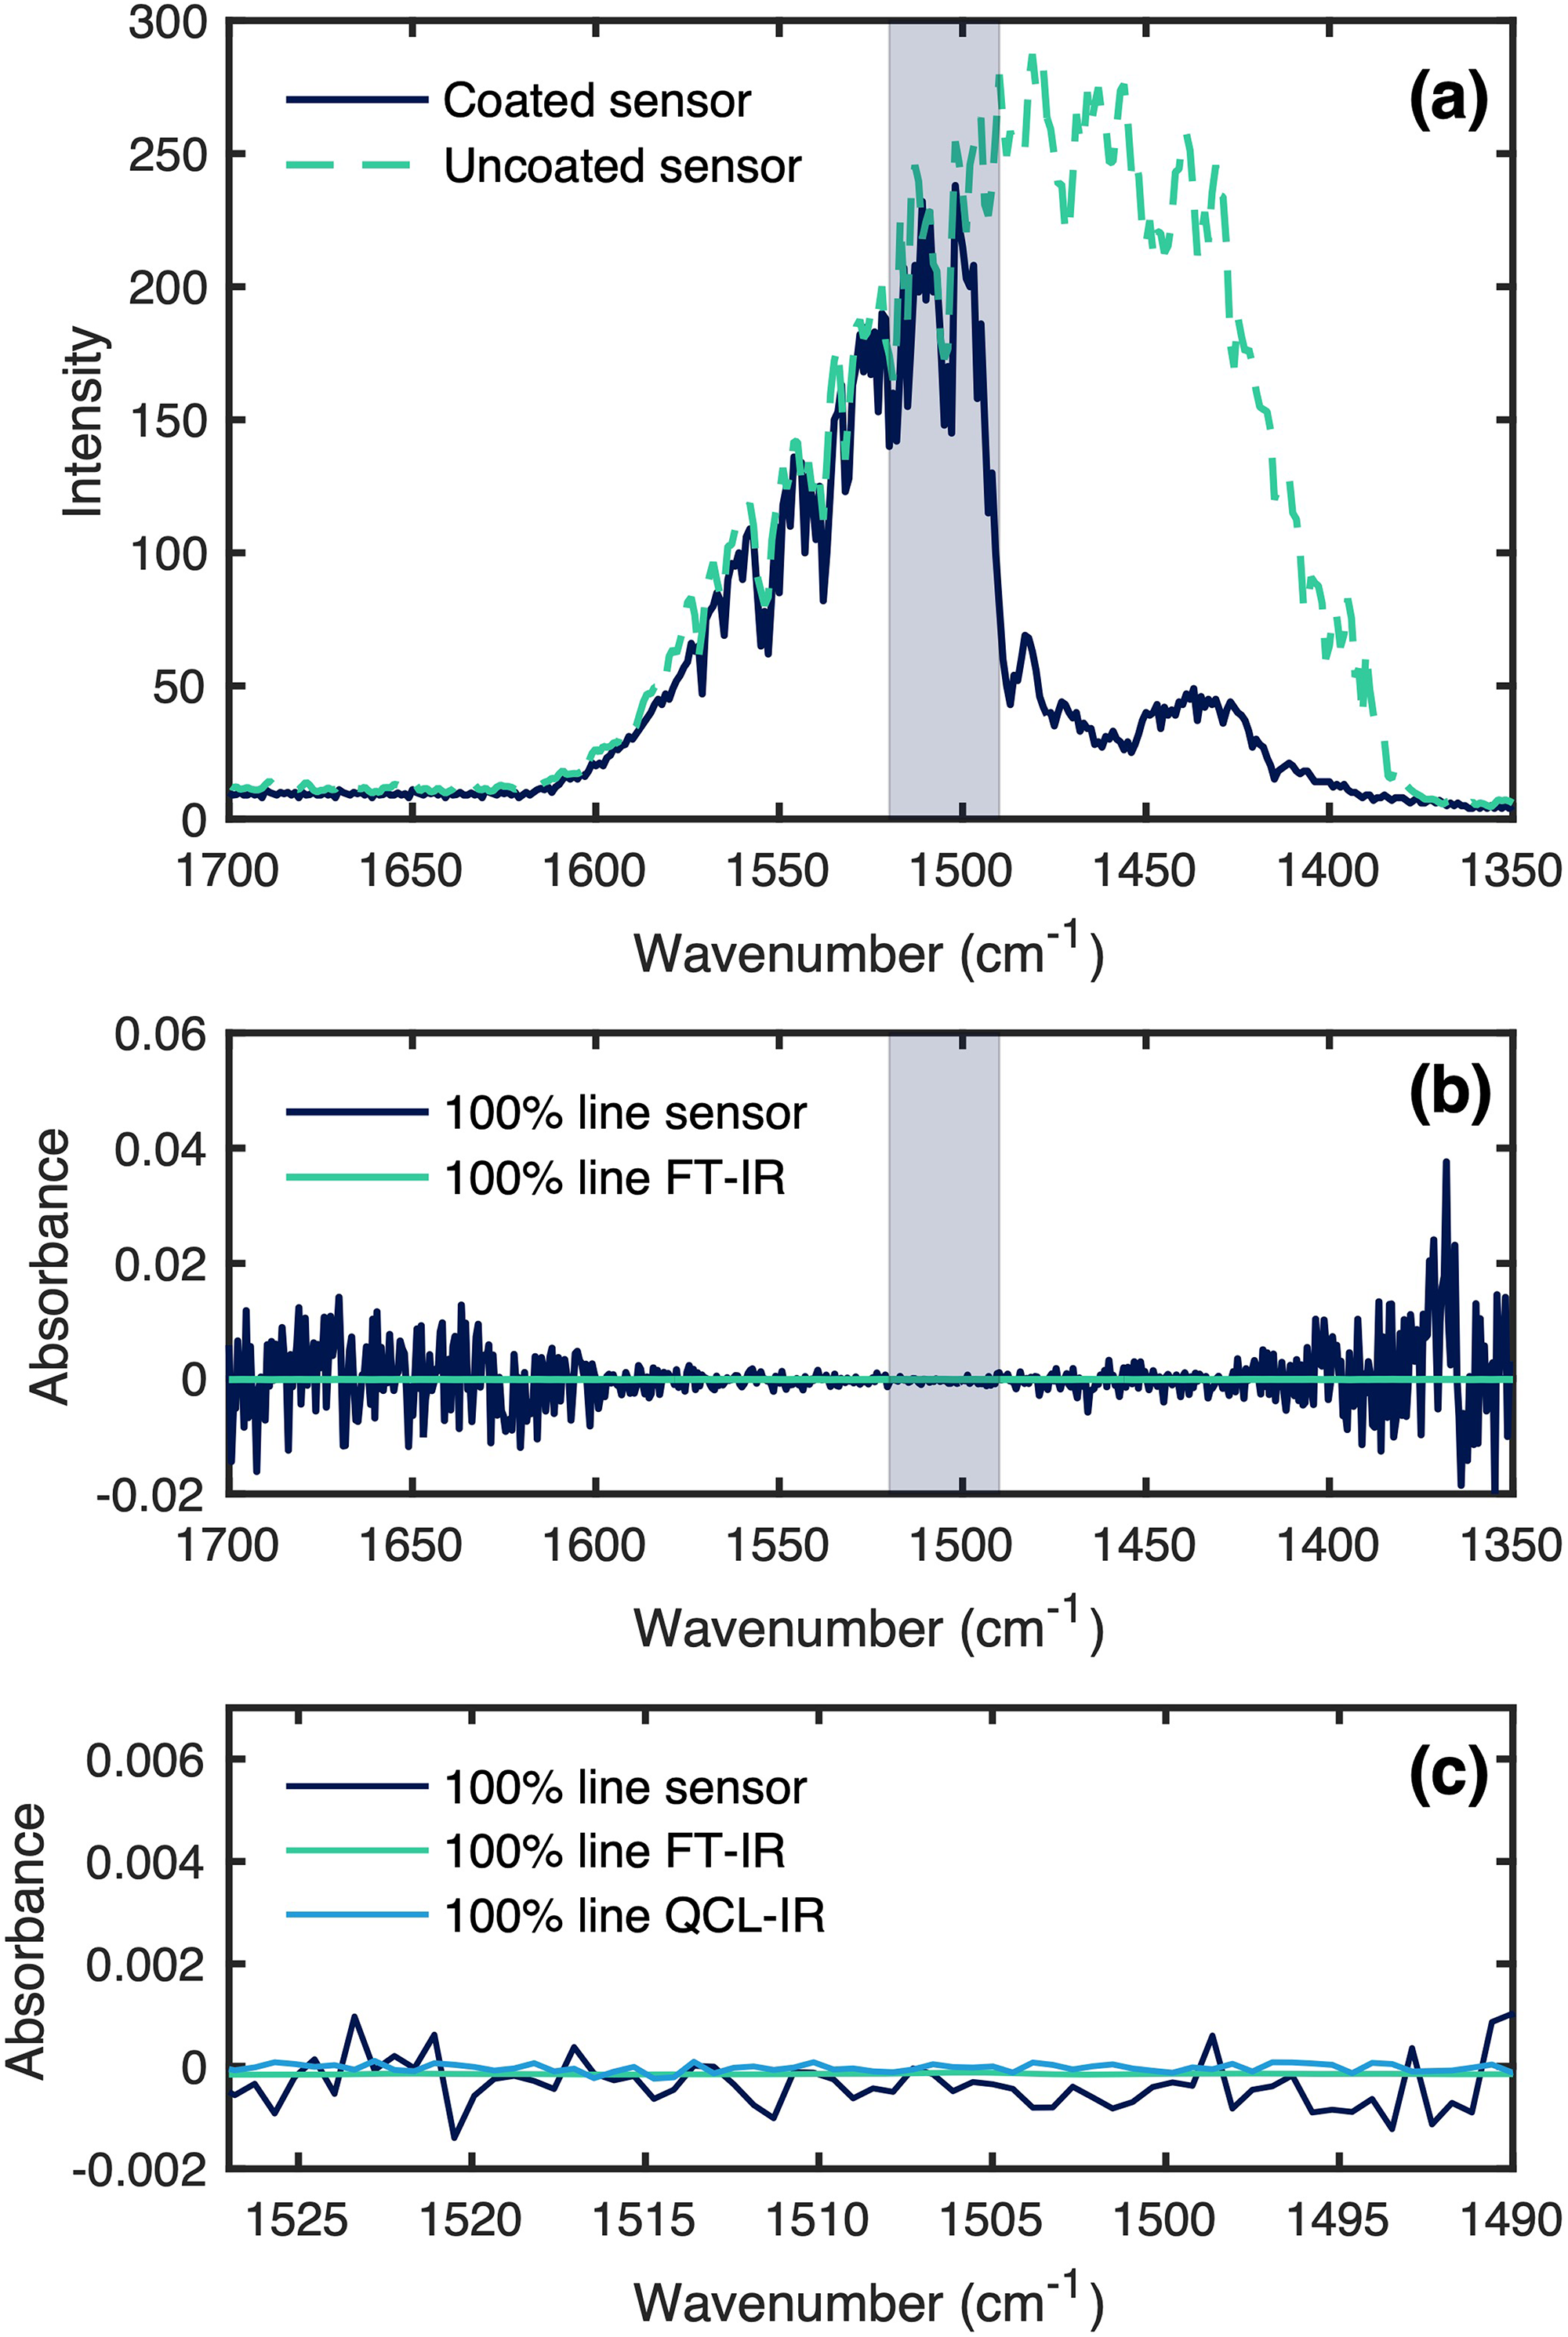
(a) Single channel spectrum of the coated and uncoated waveguide, with the region of interest for VOC sensing marked. (b) A 100% RMS lines of the sensor (blue) compared to a transmission cell in an FT-IR spectrometer, with the region of interest for VOC sensing marked. (c) Region of interest for VOC sensing shown zoomed out with a 100% RMS line of the QCL-IR spectrometer acquired in transmission.
The noise floor of the sensor was determined by evaluating the root mean square (RMS) noise of the 100% lines in the spectral range from 1530 to 1490 cm−1, resulting in a noise floor of 4.80 × 10⁻⁴. This equates to about 46 times the noise of a 4 cm gas transmission cell in a high-end FT-IR spectrometer and six times the noise of the QCL-IR spectrometer in transmission mode using the same settings. The noise floor of the waveguides depends on the intensity of the signal reaching the detector and, thus, needs to be considered in relation to anticipated waveguide losses. The measured propagation losses at 1490 cm−1 equate to 4 dB (2.5 dB cm−1, 1.6 cm waveguide length). Further losses are added at the microlenses and the grating coupler. Using a grating pitch of 1.87 µm in the simulations and combining these losses (microlenses + grating coupler), an optical interfacing efficiency of 10% was calculated for 1490 cm−1. 23 Other losses to be considered may be caused by absorptions by the mesoporous layer, as can be seen in Figure 2a. However, the IR transmittance only decreases below 1490 cm−1, and the losses caused by the silica cladding can be disregarded for VOC sensing. Nonetheless, the new QCL-based spectrometer allowed us to improve the noise level by a factor of 42 compared to our previous report. 23 The improvements of the noise floor can be attributed to the dynamic adjustment of the QCL spectrometer's laser power for lower transmission applications together with a generally more stable emission as well as the implementation of a more efficient and compact optical setup.
The characterization of the sensing layers confirmed the 3D hexagonal pore structure and a layer thickness of 1.71 µm, which covers the evanescent field of the waveguides. The results of the characterization are featured in the Supplemental Material and are in accordance with our previous publications.29,30
Sensor Calibration
For the initial calibration of the sensor, we applied several dilutions of samples of the individual VOC and all possible mixtures with concentrations between 0–800 ppmv (for the more volatile toluene) and 0–200 ppmv (for the less volatile p-xylene and 1,2,4-trimethylbenzene) to the sensing unit at a total flow rate of 500 mL min−1. In Figure 3, the spectra of adsorbed p-xylene, toluene, and 1,2,4-trimethylbenzene are displayed in comparison to their gas phase spectra. The bands correspond to the respective skeletal ring vibrations in liquid phase at 1497 cm−1 (toluene), 1507 cm−1 (1,2,4-trimethylbenzene), and 1517 cm−1 (p-xylene). This is due to the formation of a condensed phase of adsorbed molecules and the interaction with other molecules, leading to broadening effects of the absorption bands, as can be seen in Figure 3 (bottom). In addition, we found out that water vapor traces did not spectroscopically interfere with the recorded spectra. (Figure S6, Supplemental Material). This can be attributed to the hydrophobic surface functionalization of the mesoporous enrichment layer, which excludes water from the probed volume of the sensor.
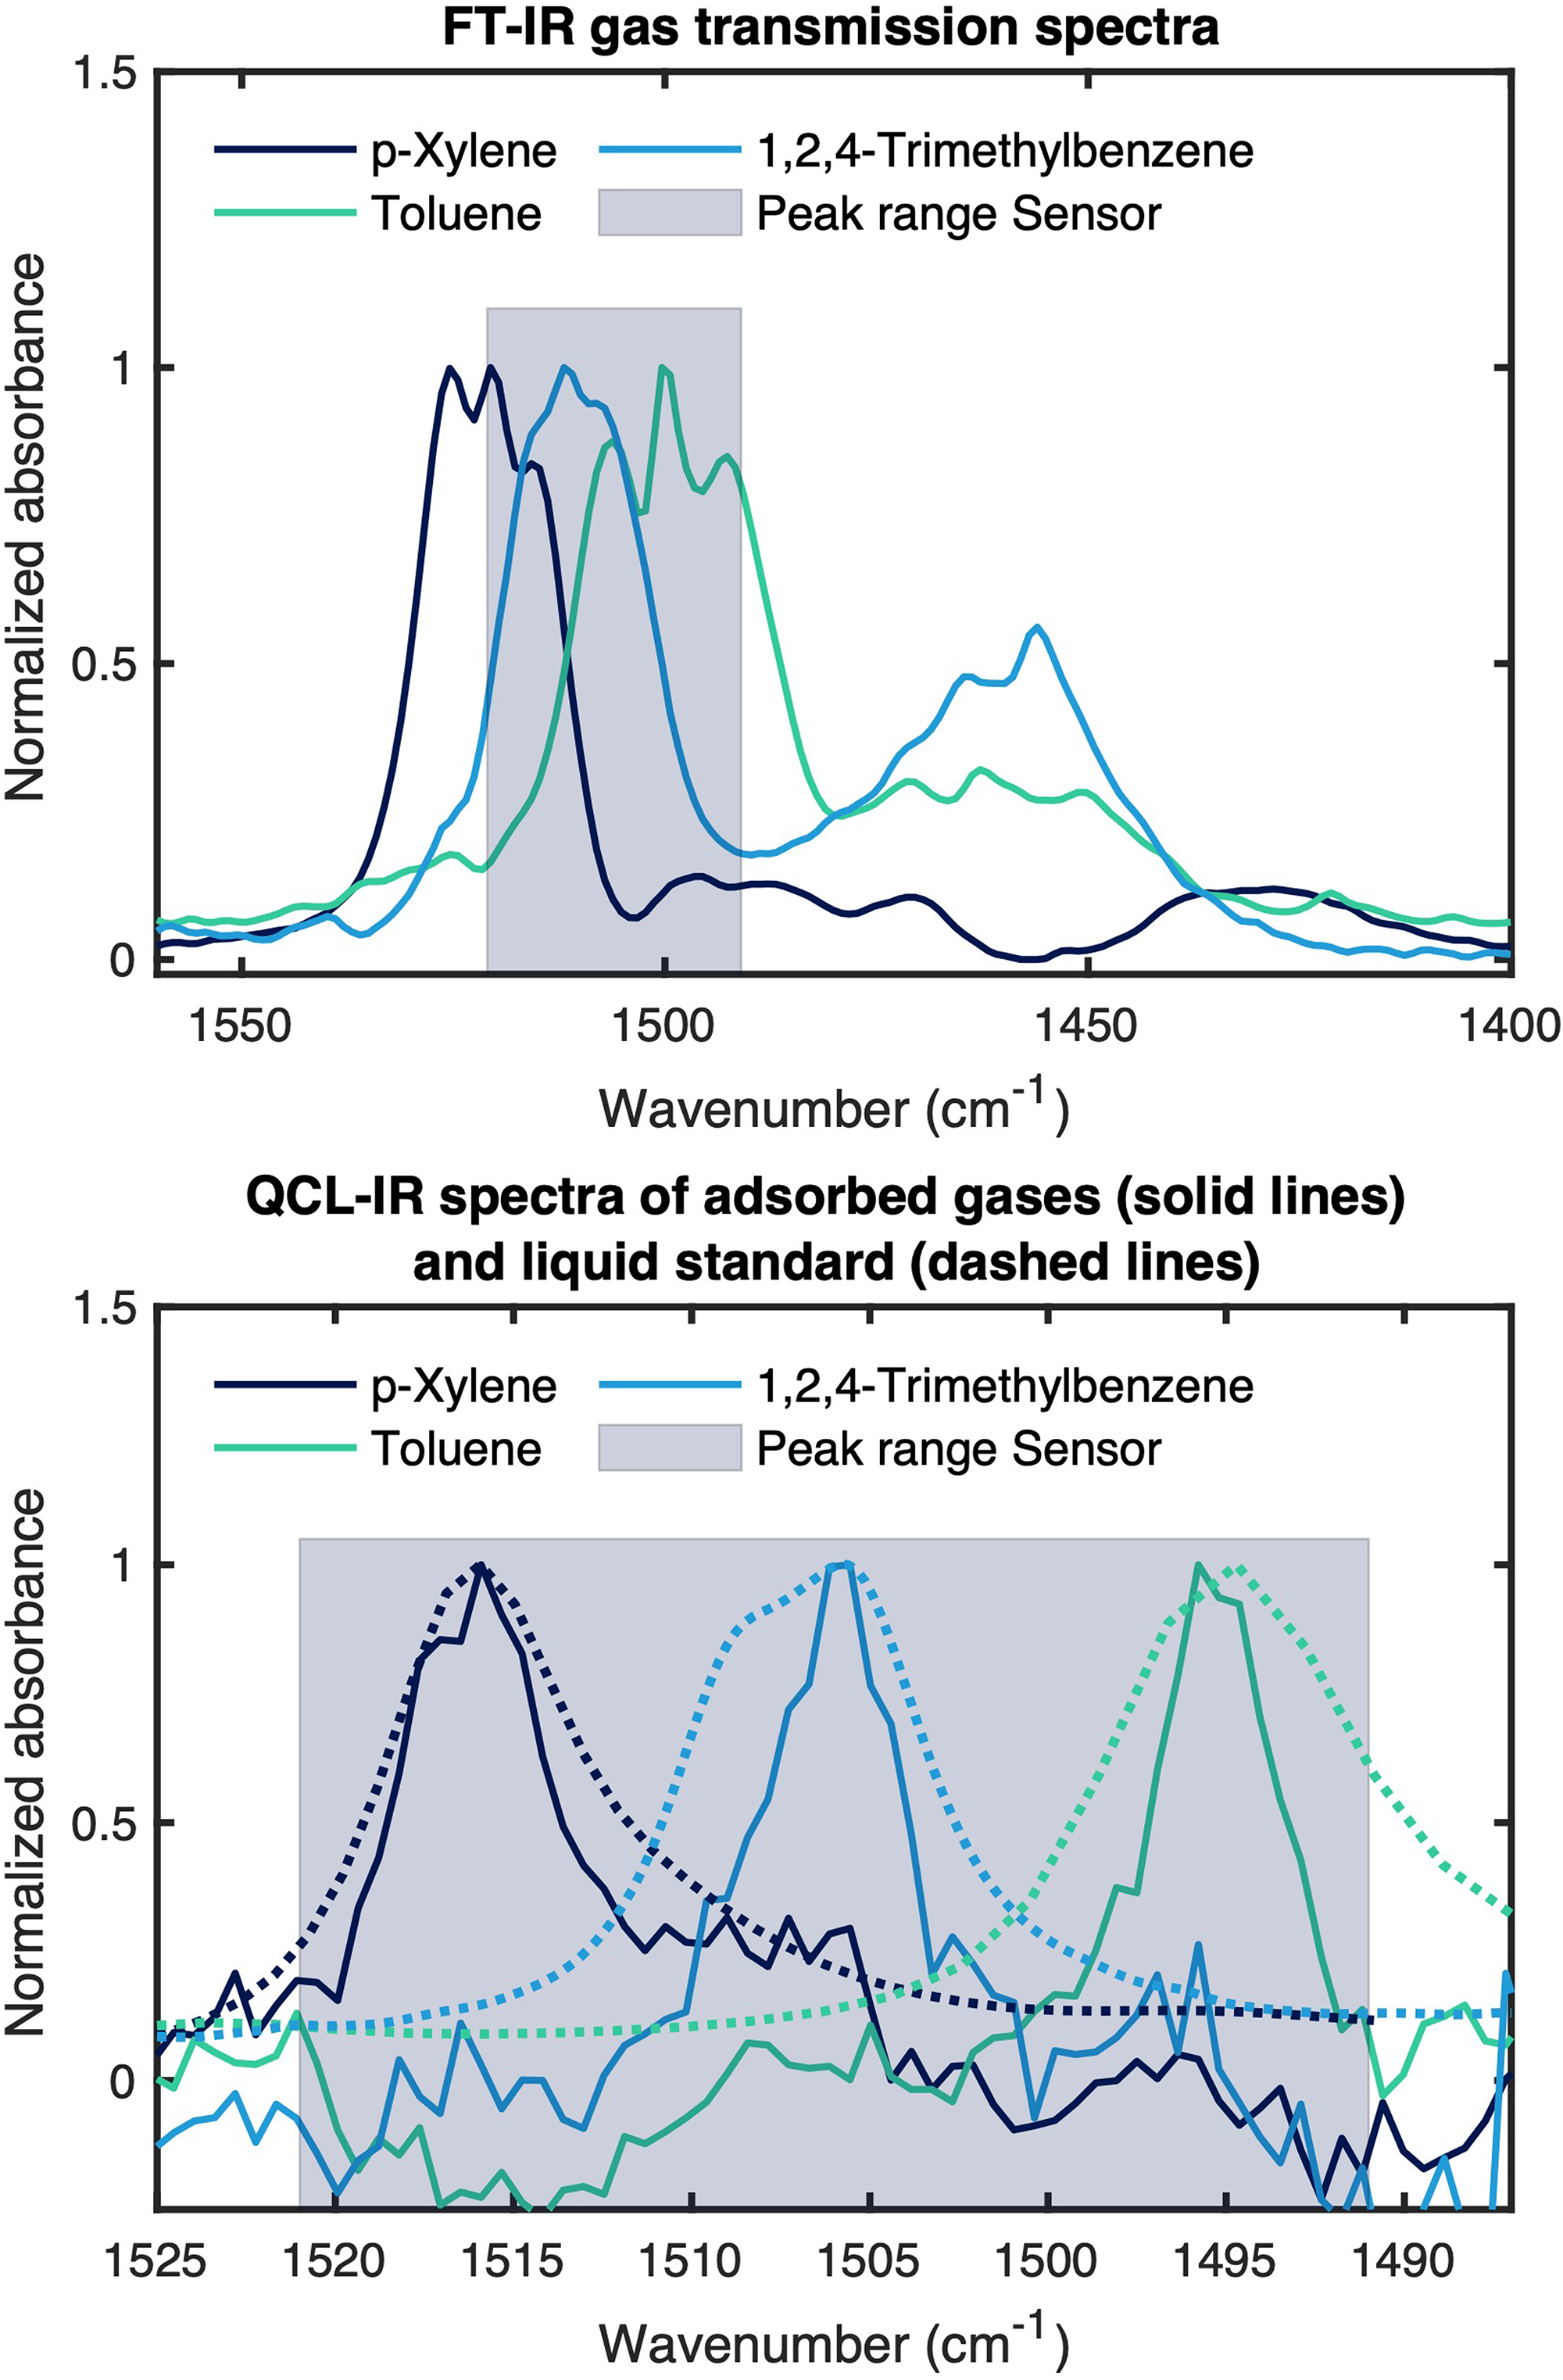
(Top panel) Normalized FT-IR transmission spectra of gaseous p-xylene (dark blue), toluene (turquoise), and 1,2,4-trimethylbenzene (light blue). (Bottom panel) Normalized QCL-IR spectra of adsorbed p-xylene (87 ppmv, 1517 cm−1, dark blue), toluene (263 ppmv, 1497 cm−1, turquoise), and 1,2,4-trimethylbenzene (57 ppmv, 1507 cm−1, light blue) in the spectral region of their respective skeletal ring vibrations, dashed line spectra refer to the liquid standards measured for each respective VOC. The peak range of the sensor is featured as a gray box for scale in top and bottom, respectively.
The sensor response was derived from band areas as function of application time (Figure 4) to determine the optimal measurement time. The time needed to reach equilibrium (with the t90% taken as metric, where 90% of the enrichment has been reached) was 12 min, and the regeneration time (with the t10% taken as metric, where the signal has been fallen to 10% of the full enrichment) was 60 min. This slow enrichment as compared to literature can be explained by the applied multiple coatings and a larger sensor area. Both result in a much greater pore volume in which the analytes can undergo diffusion in addition to a simple adsorption process (Figure 4, bottom) while not being covered by the single propagating waveguide. To ensure reasonable sensor response times, we chose an enrichment time of 3 min (shown as light blue in Figure 4, bottom) as a compromise between speed and performance.
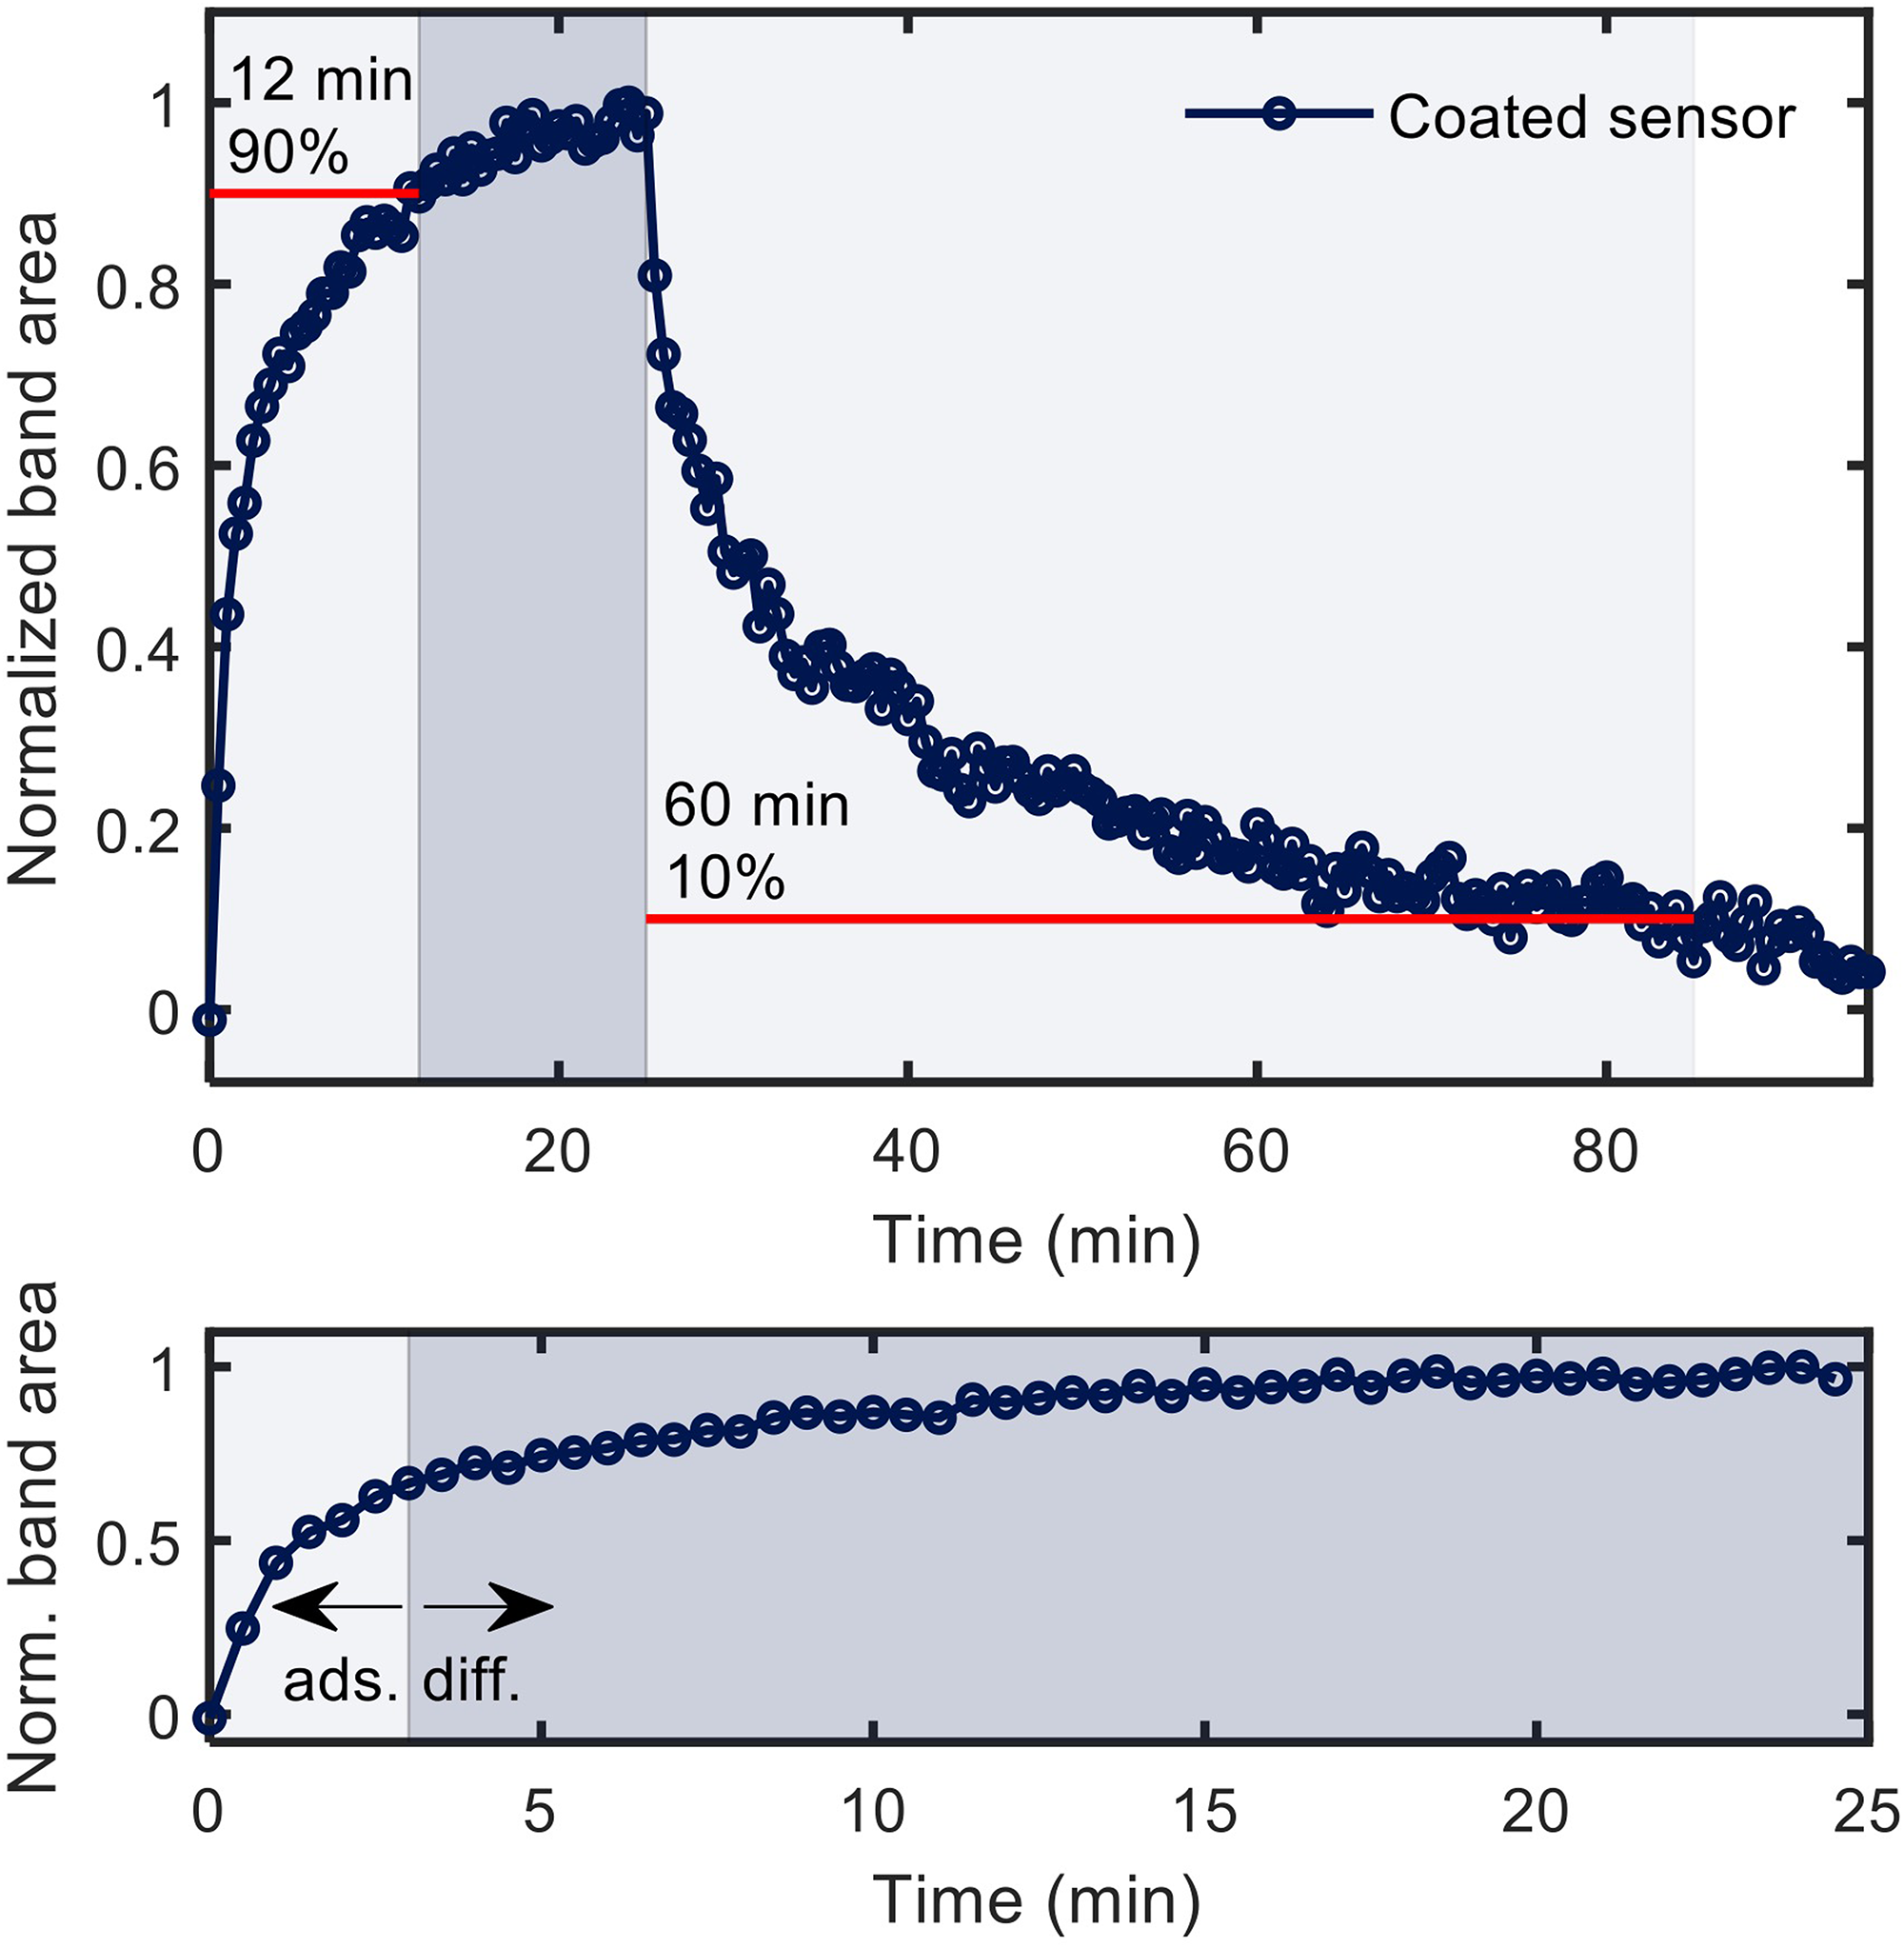
Sensor response during enrichment and regeneration for the enrichment of 198 ppmv 1,2,4-trimethylbenzene (top panel), zoom into the initial enrichment, which is dominated by adsorption at the beginning and dominated by diffusion after 3 min (bottom panel).
The resulting QCL-IR spectra were fed into the NNLS algorithm for deconvolution. The resulting pure component spectra were then integrated and plotted against the respective VOC concentration (Figure 5). The nonlinear response was attributed to the prevailing adsorption mechanism, which is controlled by van der Waals interactions between the hydrophobic surface functionalization and the target analytes (as well as between the analytes themselves). We used the Freundlich adsorption model (Eq. 3) to describe the system with the signal

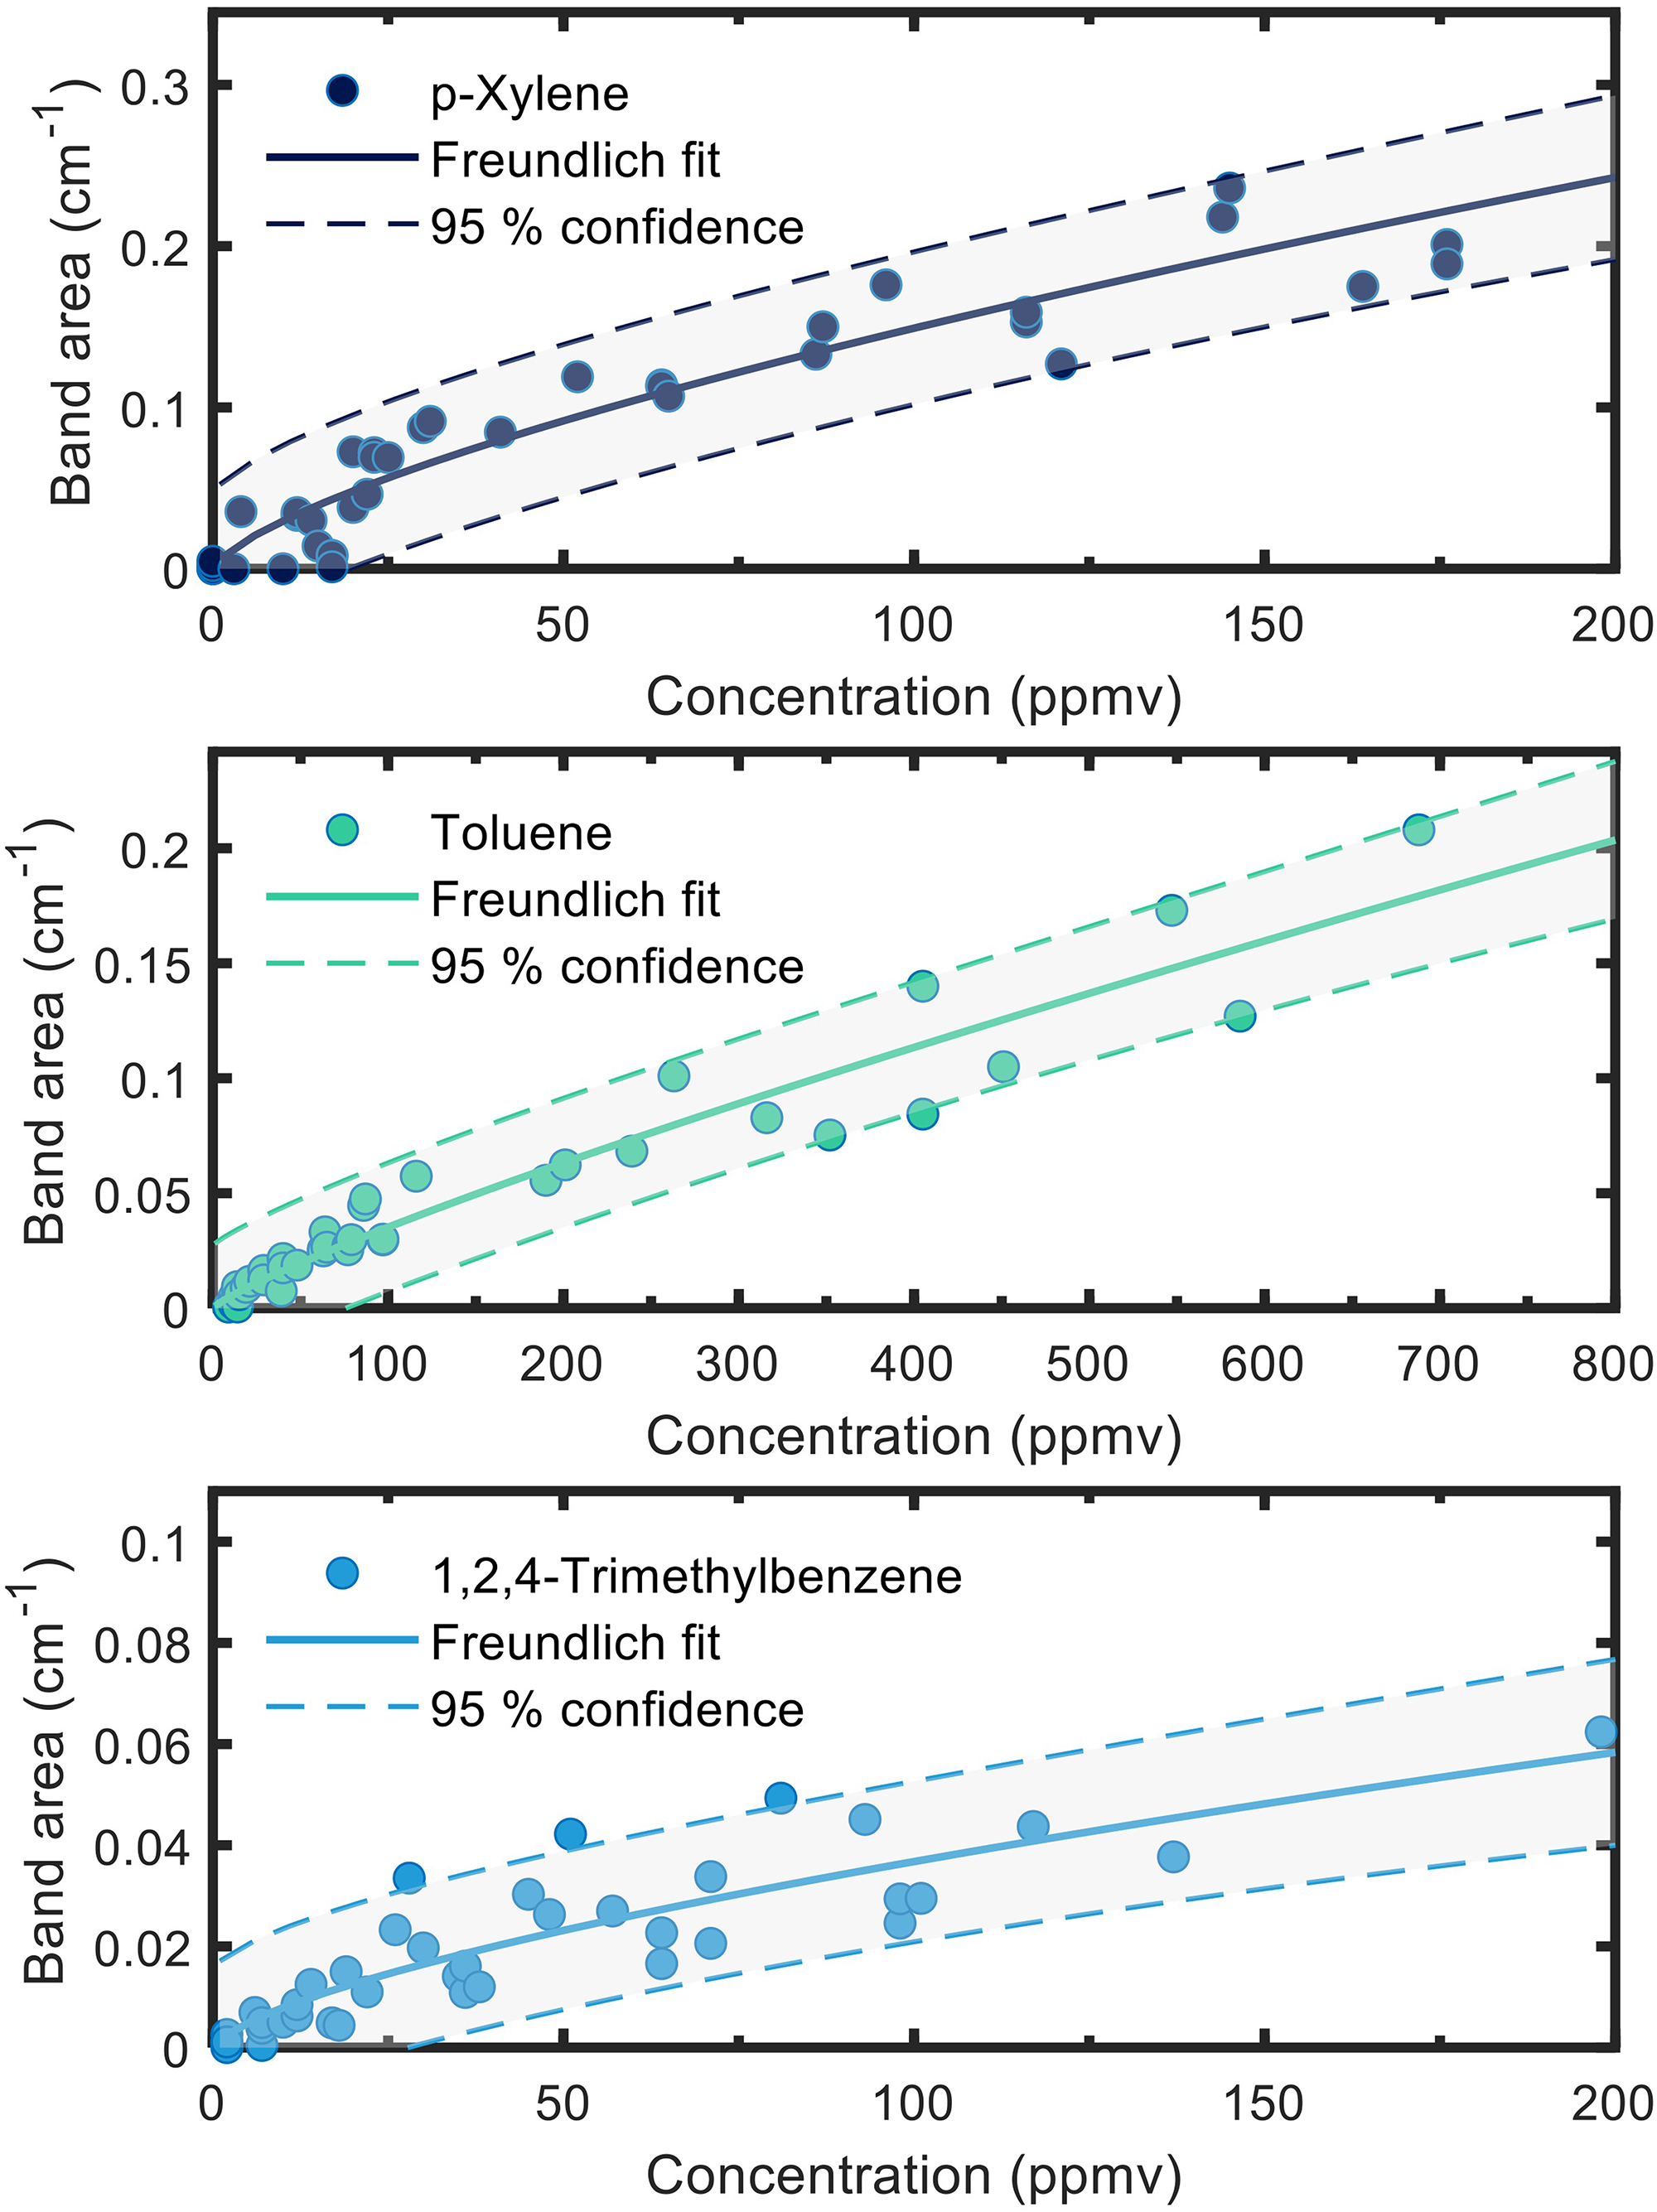
Sensor calibration for three respective VOCs. Fitting was performed using the Freundlich adsorption isotherms (solid lines) with 95% confidence of the fit marked (dashed lines).
In Table I, the performance parameters for FT-IR spectroscopy (4 cm pathlength) and the sensor are compared, at the concentration of the respective LODs (marked in gray), as well as 5 ppmv, 10 ppmv, 25 ppmv, and 50 ppmv. We approximated (Eq. 4) the LODs as the concentration at which the signal equates to three times the noise
Performance parameters for FT-IR spectroscopy and the sensor for each respective VOC, with the LOD (marked in gray) for p-xylene being 0.1 ppmv, for toluene being 2.1 ppmv, while the LOD for 1,2,4-trimethylbenzene was determined to be 0.9 ppmv.
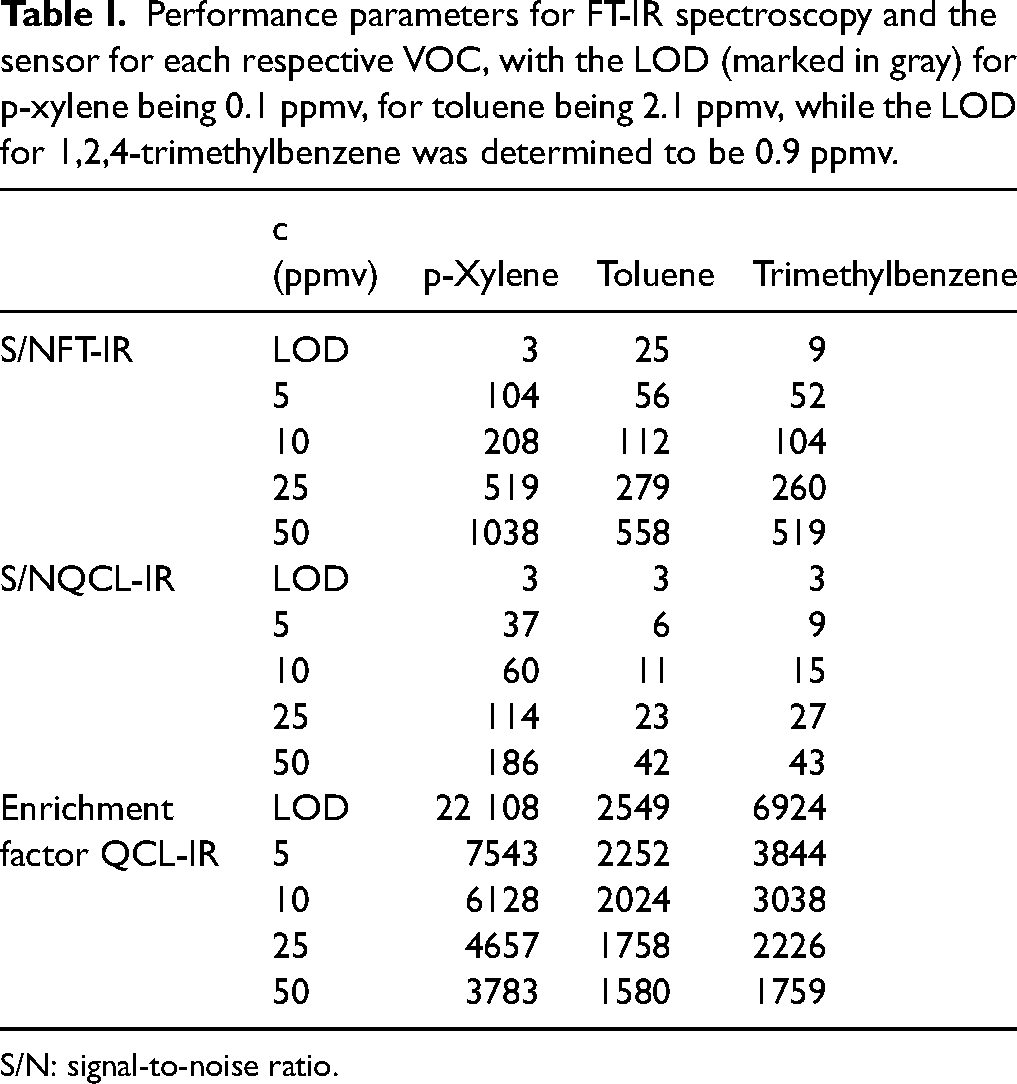
S/N: signal-to-noise ratio.
In comparison to the high-end FT-IR spectrometer used for calibration of the gas phase with a 4 cm pathlength, the mesoporous coating combined with the waveguide platform can perform at the same order of magnitude as the FT-IR concerning its S/N ratio. Specifically, for p-xylene at a concentration of 5 ppmv, the S/N is 37 for the sensing platform, while the S/N of the FT-IR is 104. This shows the high potential of our integrated approach, considering the noise being 42 times higher for the sensor while also having an active pathlength 460 times smaller than the FT-IR spectrometer. The still successful monitoring can be attributed to the high enrichment factor of 7500 for p-xylene at this concentration (5 ppmv). It is further important to note that these values were recorded under dry conditions. In real-world scenarios, water vapor bands would strongly interfere during gas phase transmission measurements in this spectral region with the VOC bands and add significant noise levels:


Evaluation of Different Chemometric Models
In order to decide which algorithm to use for the deconvolution of the acquired multianalyte QCL-IR spectra, we evaluated MCR-ALS and NNLS in respect to the real-time applicability. The parameters used to showcase the differences between the two algorithms were speed (measured in time of execution of the respective algorithms), stability (measured in the ability to react to additional components), and accuracy (measured in the respective root mean errors of the spectral fit and the prediction as well as the R2 of the predictive fit). In Figure 6, deconvoluted spectra of a VOC mixture derived with NNLS and corresponding residues are shown, demonstrating a good fit quality. Additional details describing the deconvolution of the spectra are given in the Supplemental Material.
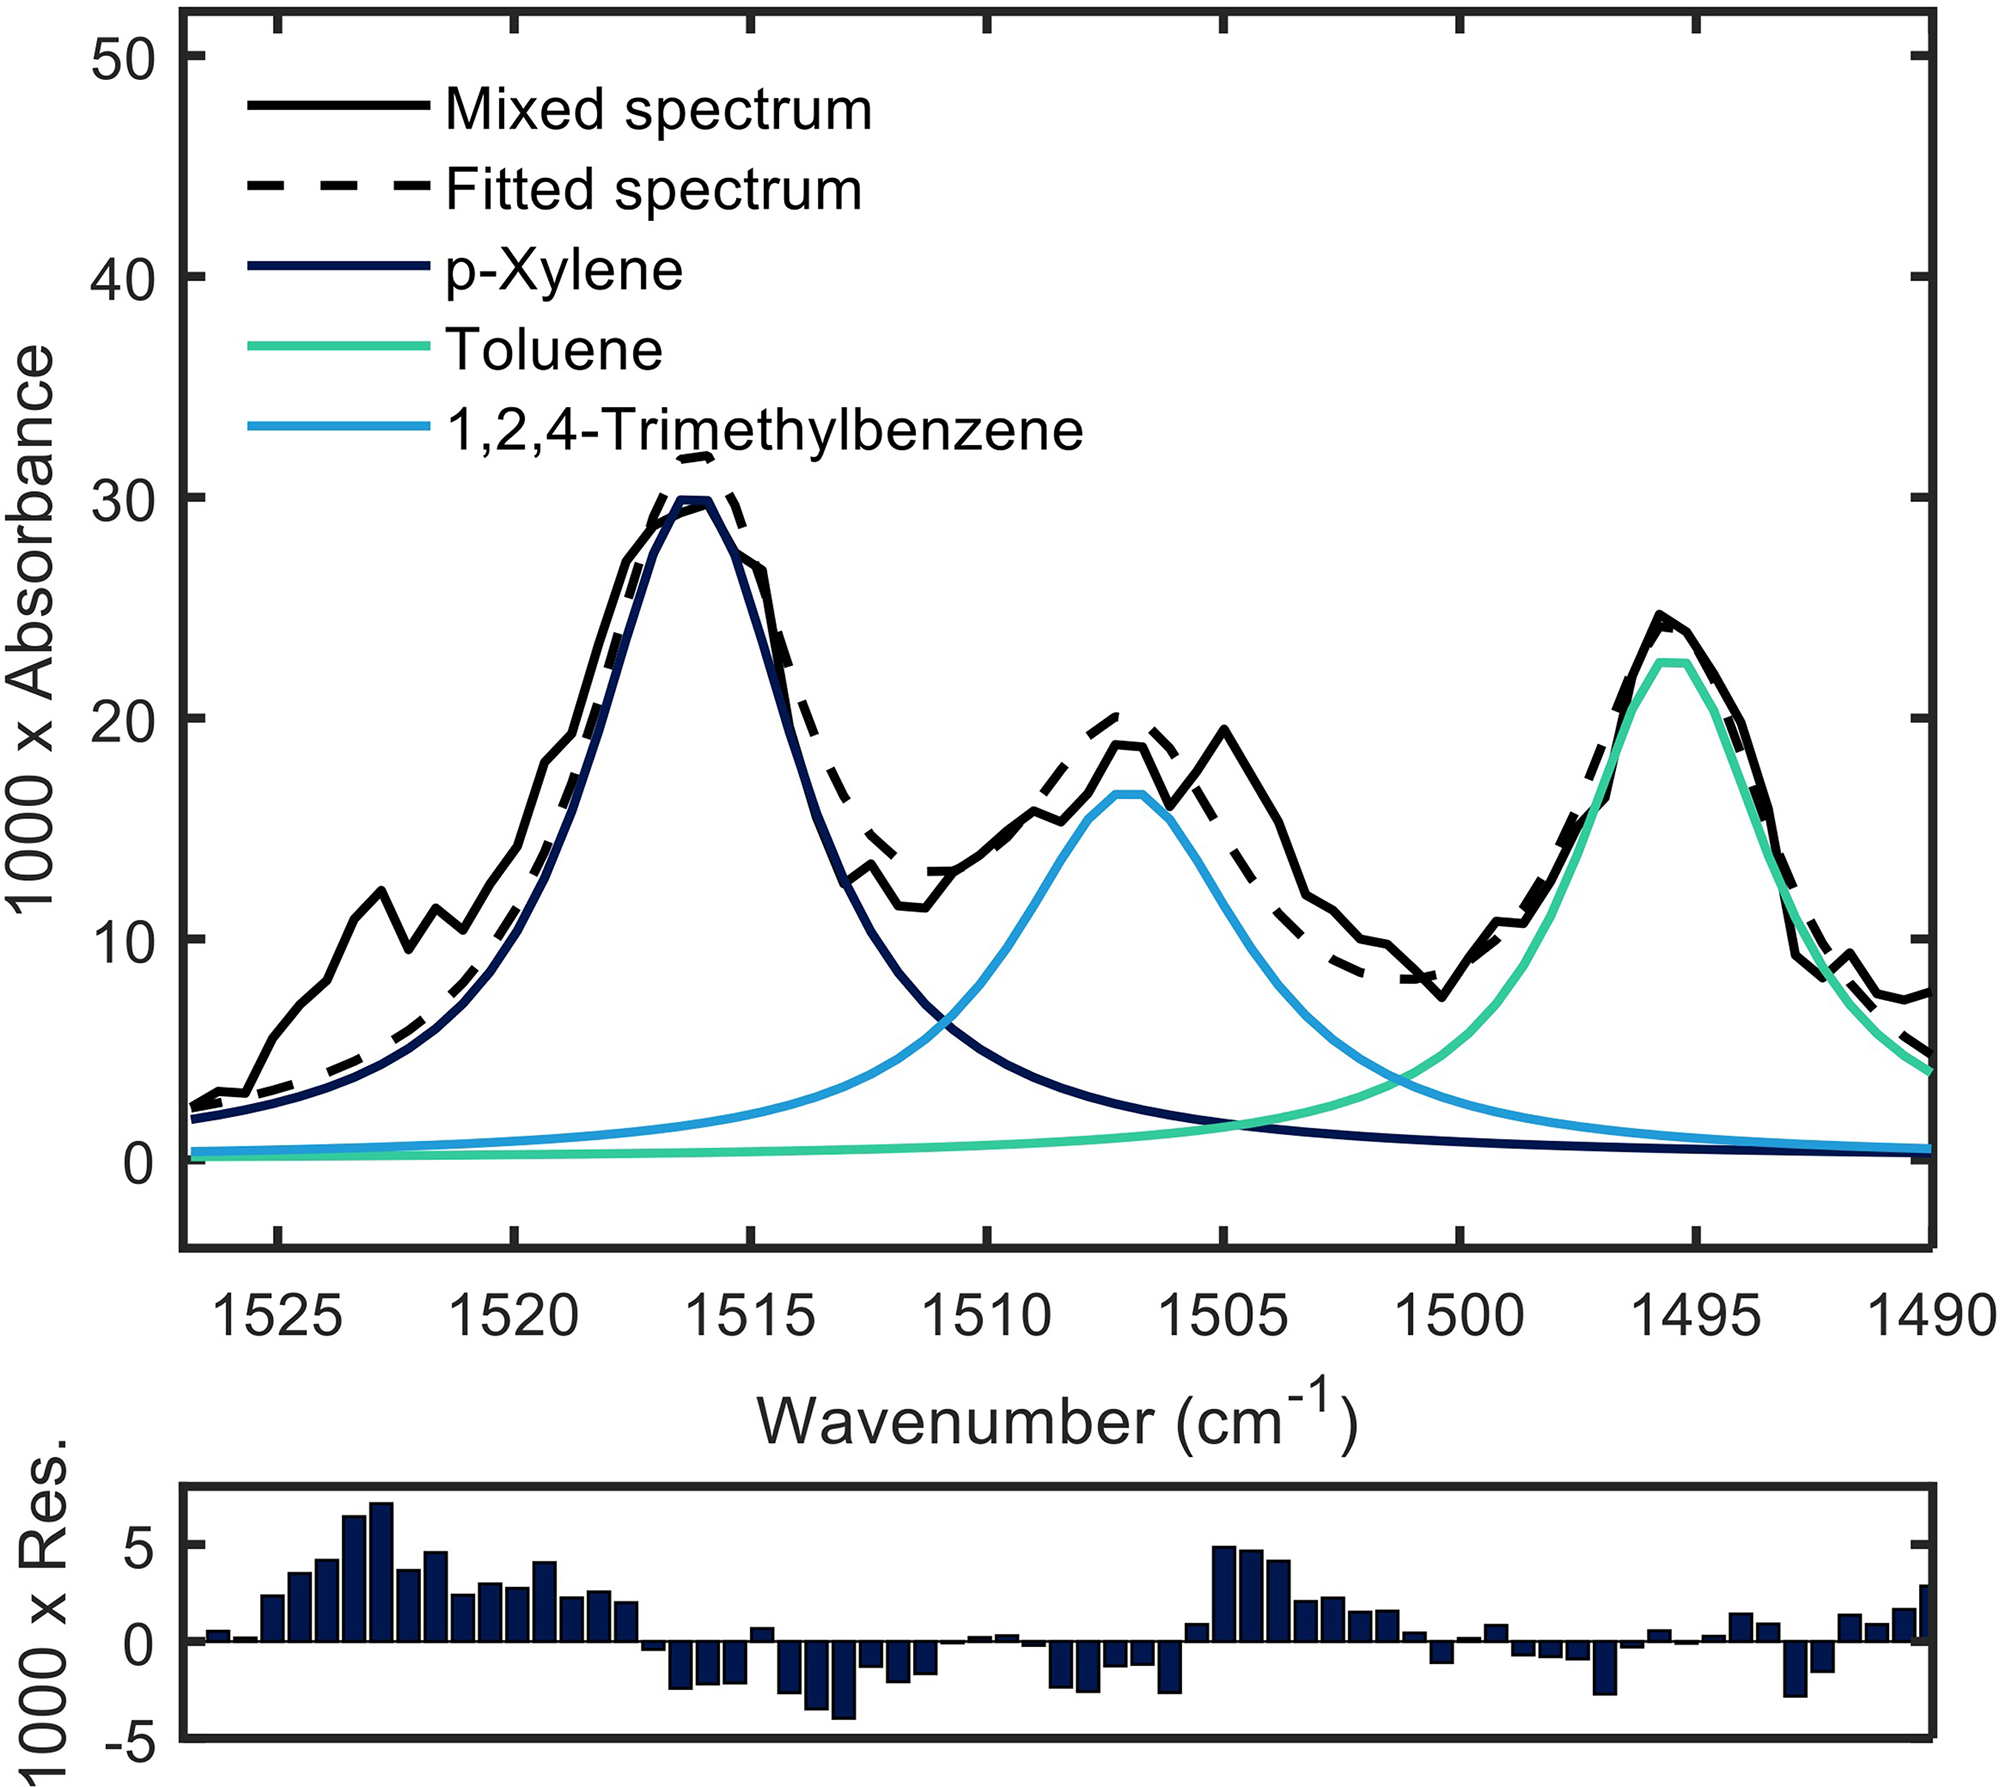
VOC spectra of a mixture of 164 ppmv p-xylene, 405 ppmv toluene, and 93 ppmv 1,2,4-trimethylbenzene acquired with the QCL based VOC sensor fitted by three Lorentzian curves (top panel). Sum spectrum of the three fits in dashed line. Residual plot of the fit (bottom panel).
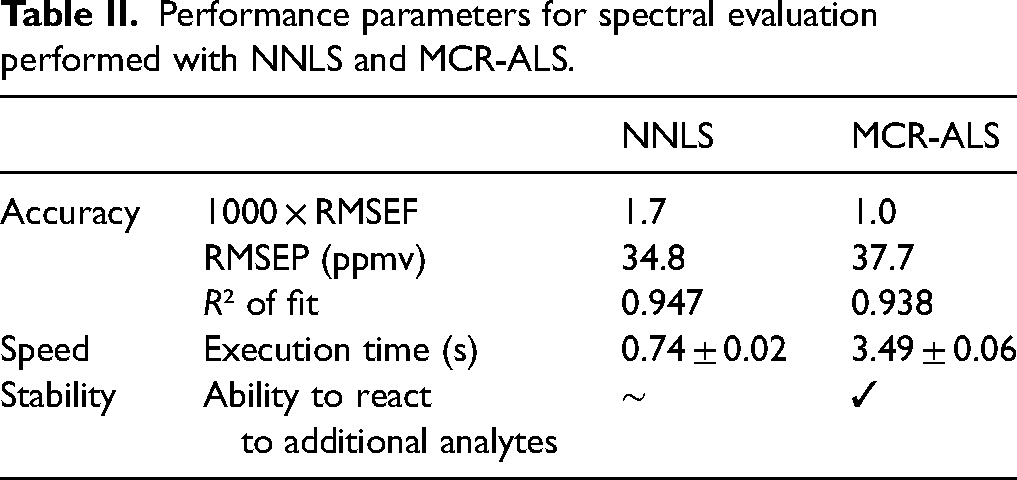
Table II compares performance parameters for the two chosen methods. The simpler NNLS algorithm is significantly faster than MCR-ALS, requiring only a fifth of the execution time. Both methods are faster than spectral acquisition (15 s/spectrum). However, the NNLS algorithm lacks versatility when faced with additional analytes, unlike MCR-ALS, which can quickly detect and react to new analytes. Multivariate curve resolution alternate least square provides better spectral fits with lower RMS errors of the fit due to iterative improvement, while NNLS shows slightly better RMS errors of the prediction and R2, possibly indicating overfitting with MCR-ALS. Similar indications of overfitting with the MCR-ALS algorithm can be seen when comparing the predictive fits of the MCR-ALS model with the NNLS model, as shown in Figure 7. In this figure, the slopes for the NNLS are all very close to k = 1, whereas for the predictive fits for the MCR-ALS model, the slopes deviate significantly from the k = 1 optimum, indicating overfitting. Therefore, we chose NNLS for sensor calibration as the added features of the more powerful MCR-ALS algorithm were not considered necessary for the calibration.
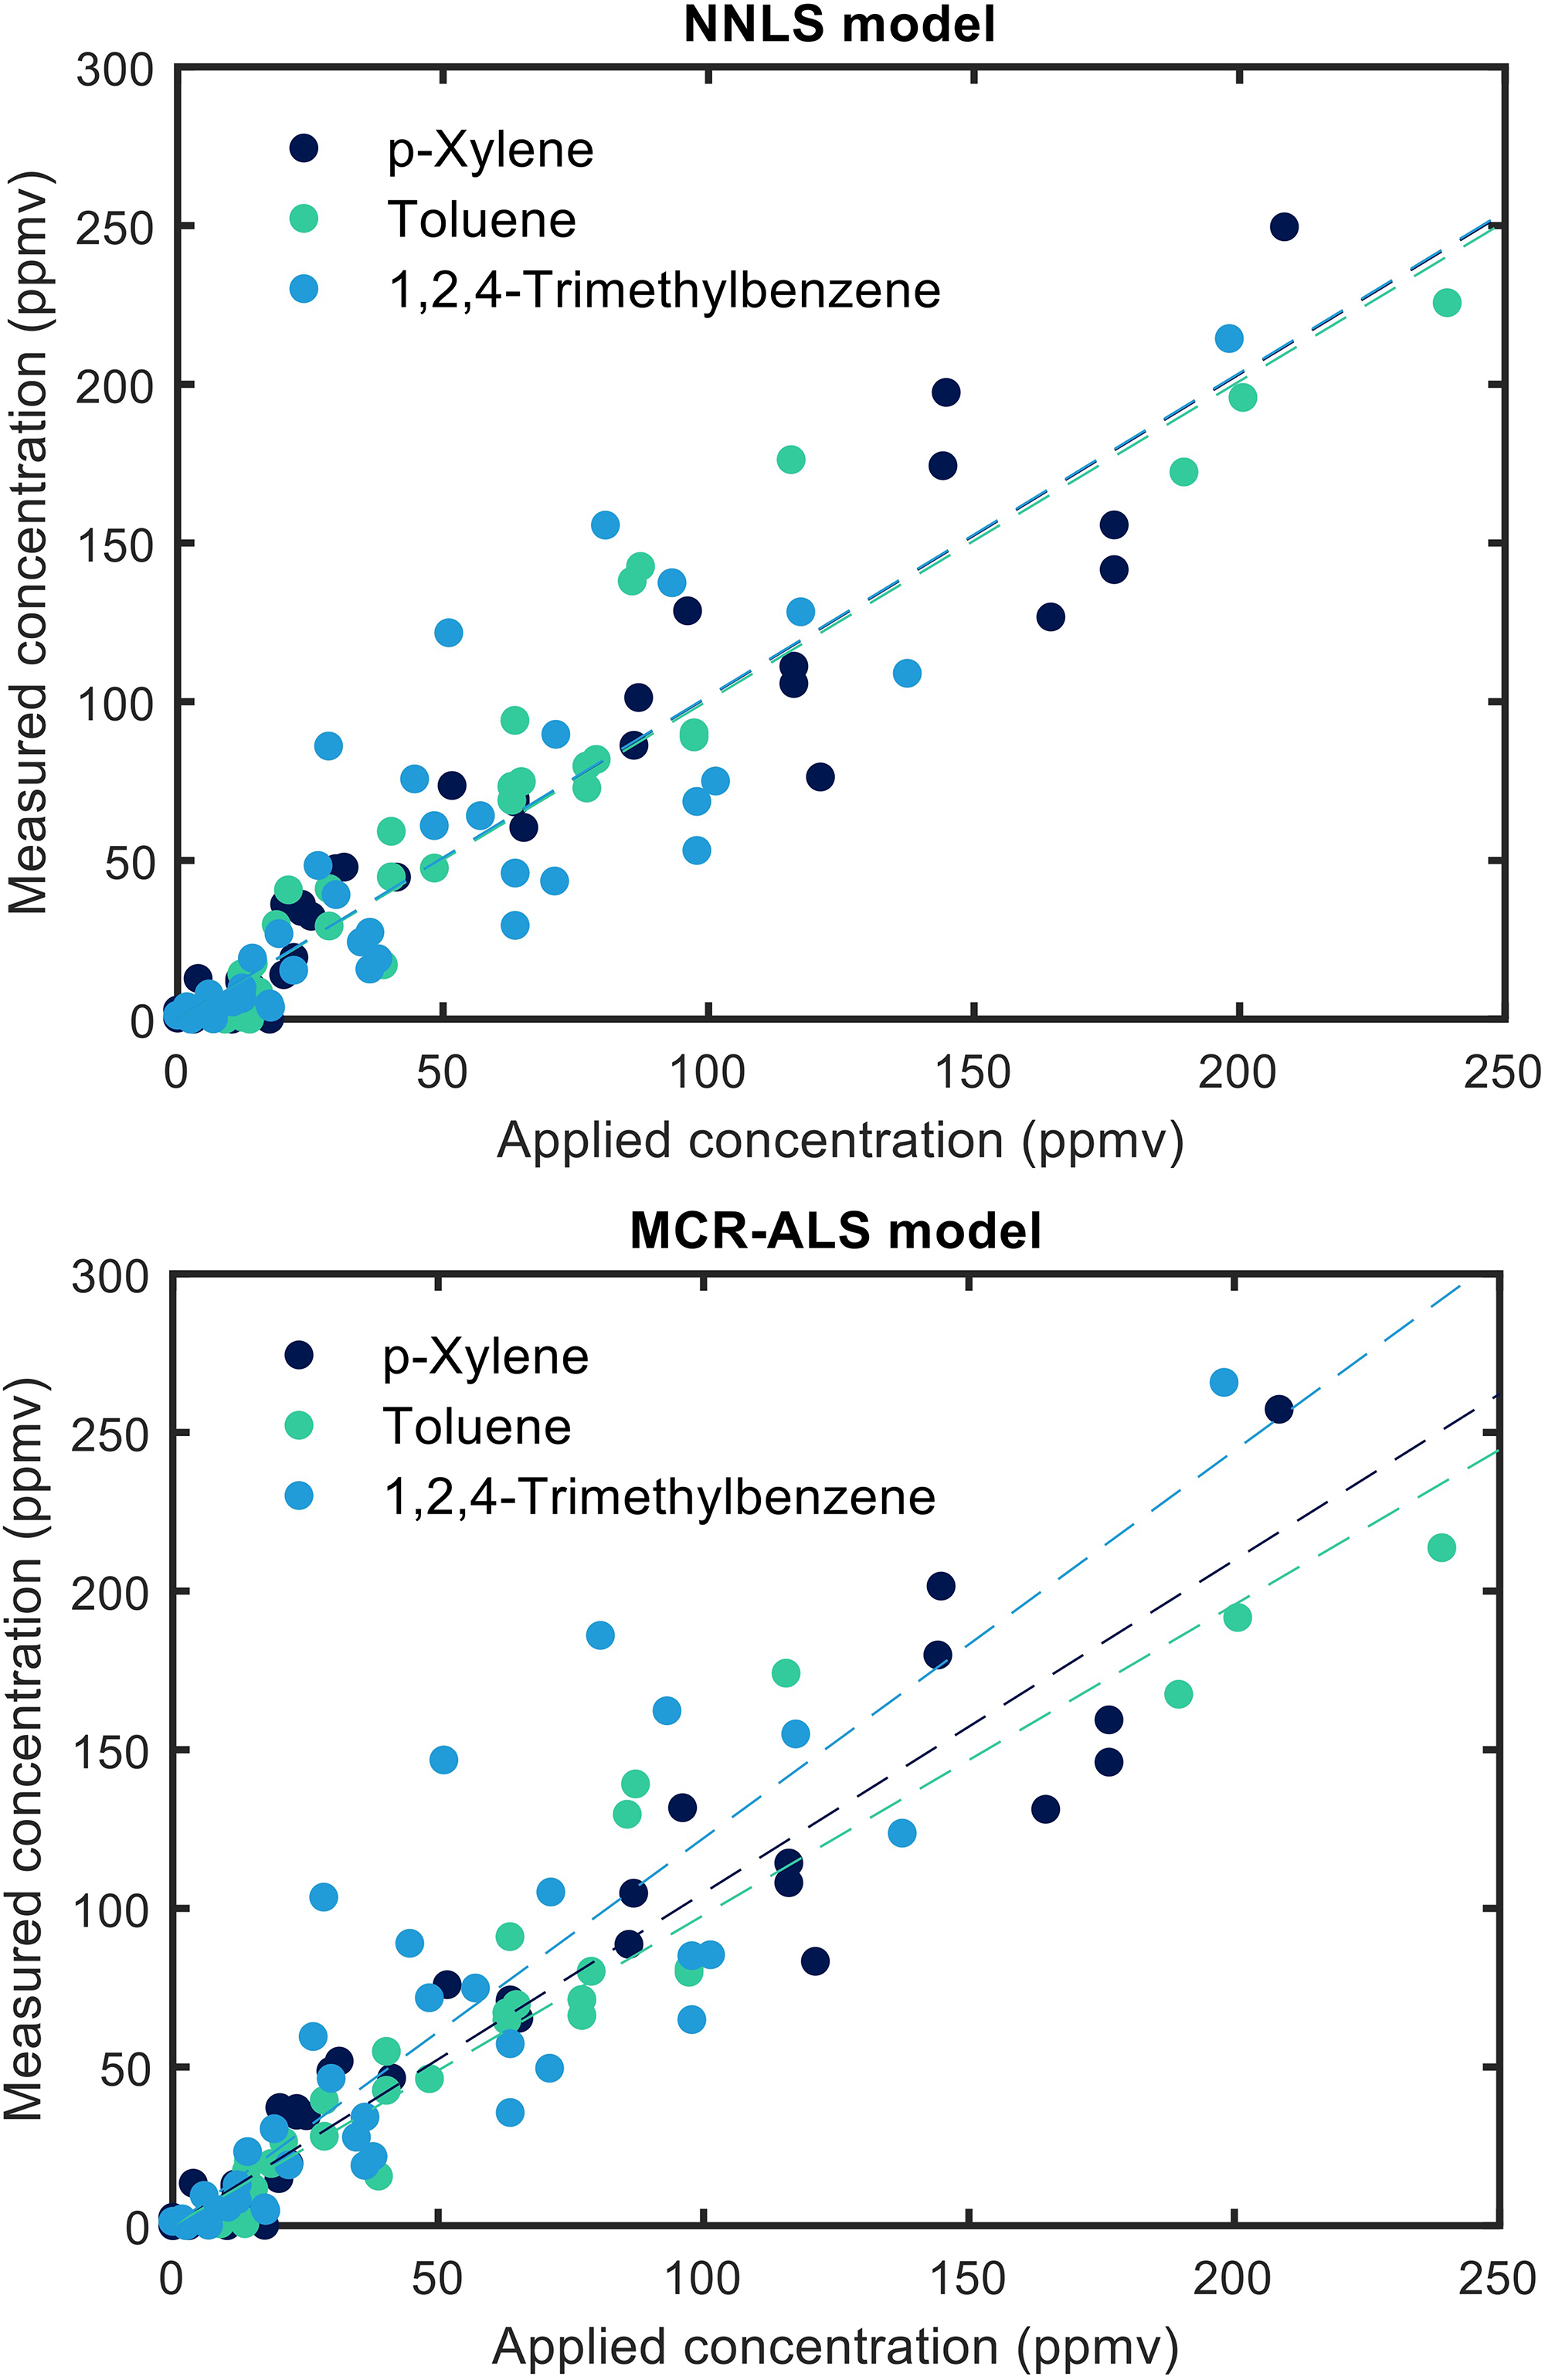
Predictive fit for the NNLS (top panel) and MCR-ALS (bottom panel) models.
Performance parameters for spectral evaluation performed with NNLS and MCR-ALS.
Use-Case Simulation
To simulate the response and stability of our sensor, we applied a gas mixture with variable concentrations of all three VOCs to the sensor over a time period of 66 min at a total flow rate of 500 mL min−1. The results of this use case simulation and a comparison of the results generated by the sensing platform and spectra acquired in standard transmission are shown in Figure 8.
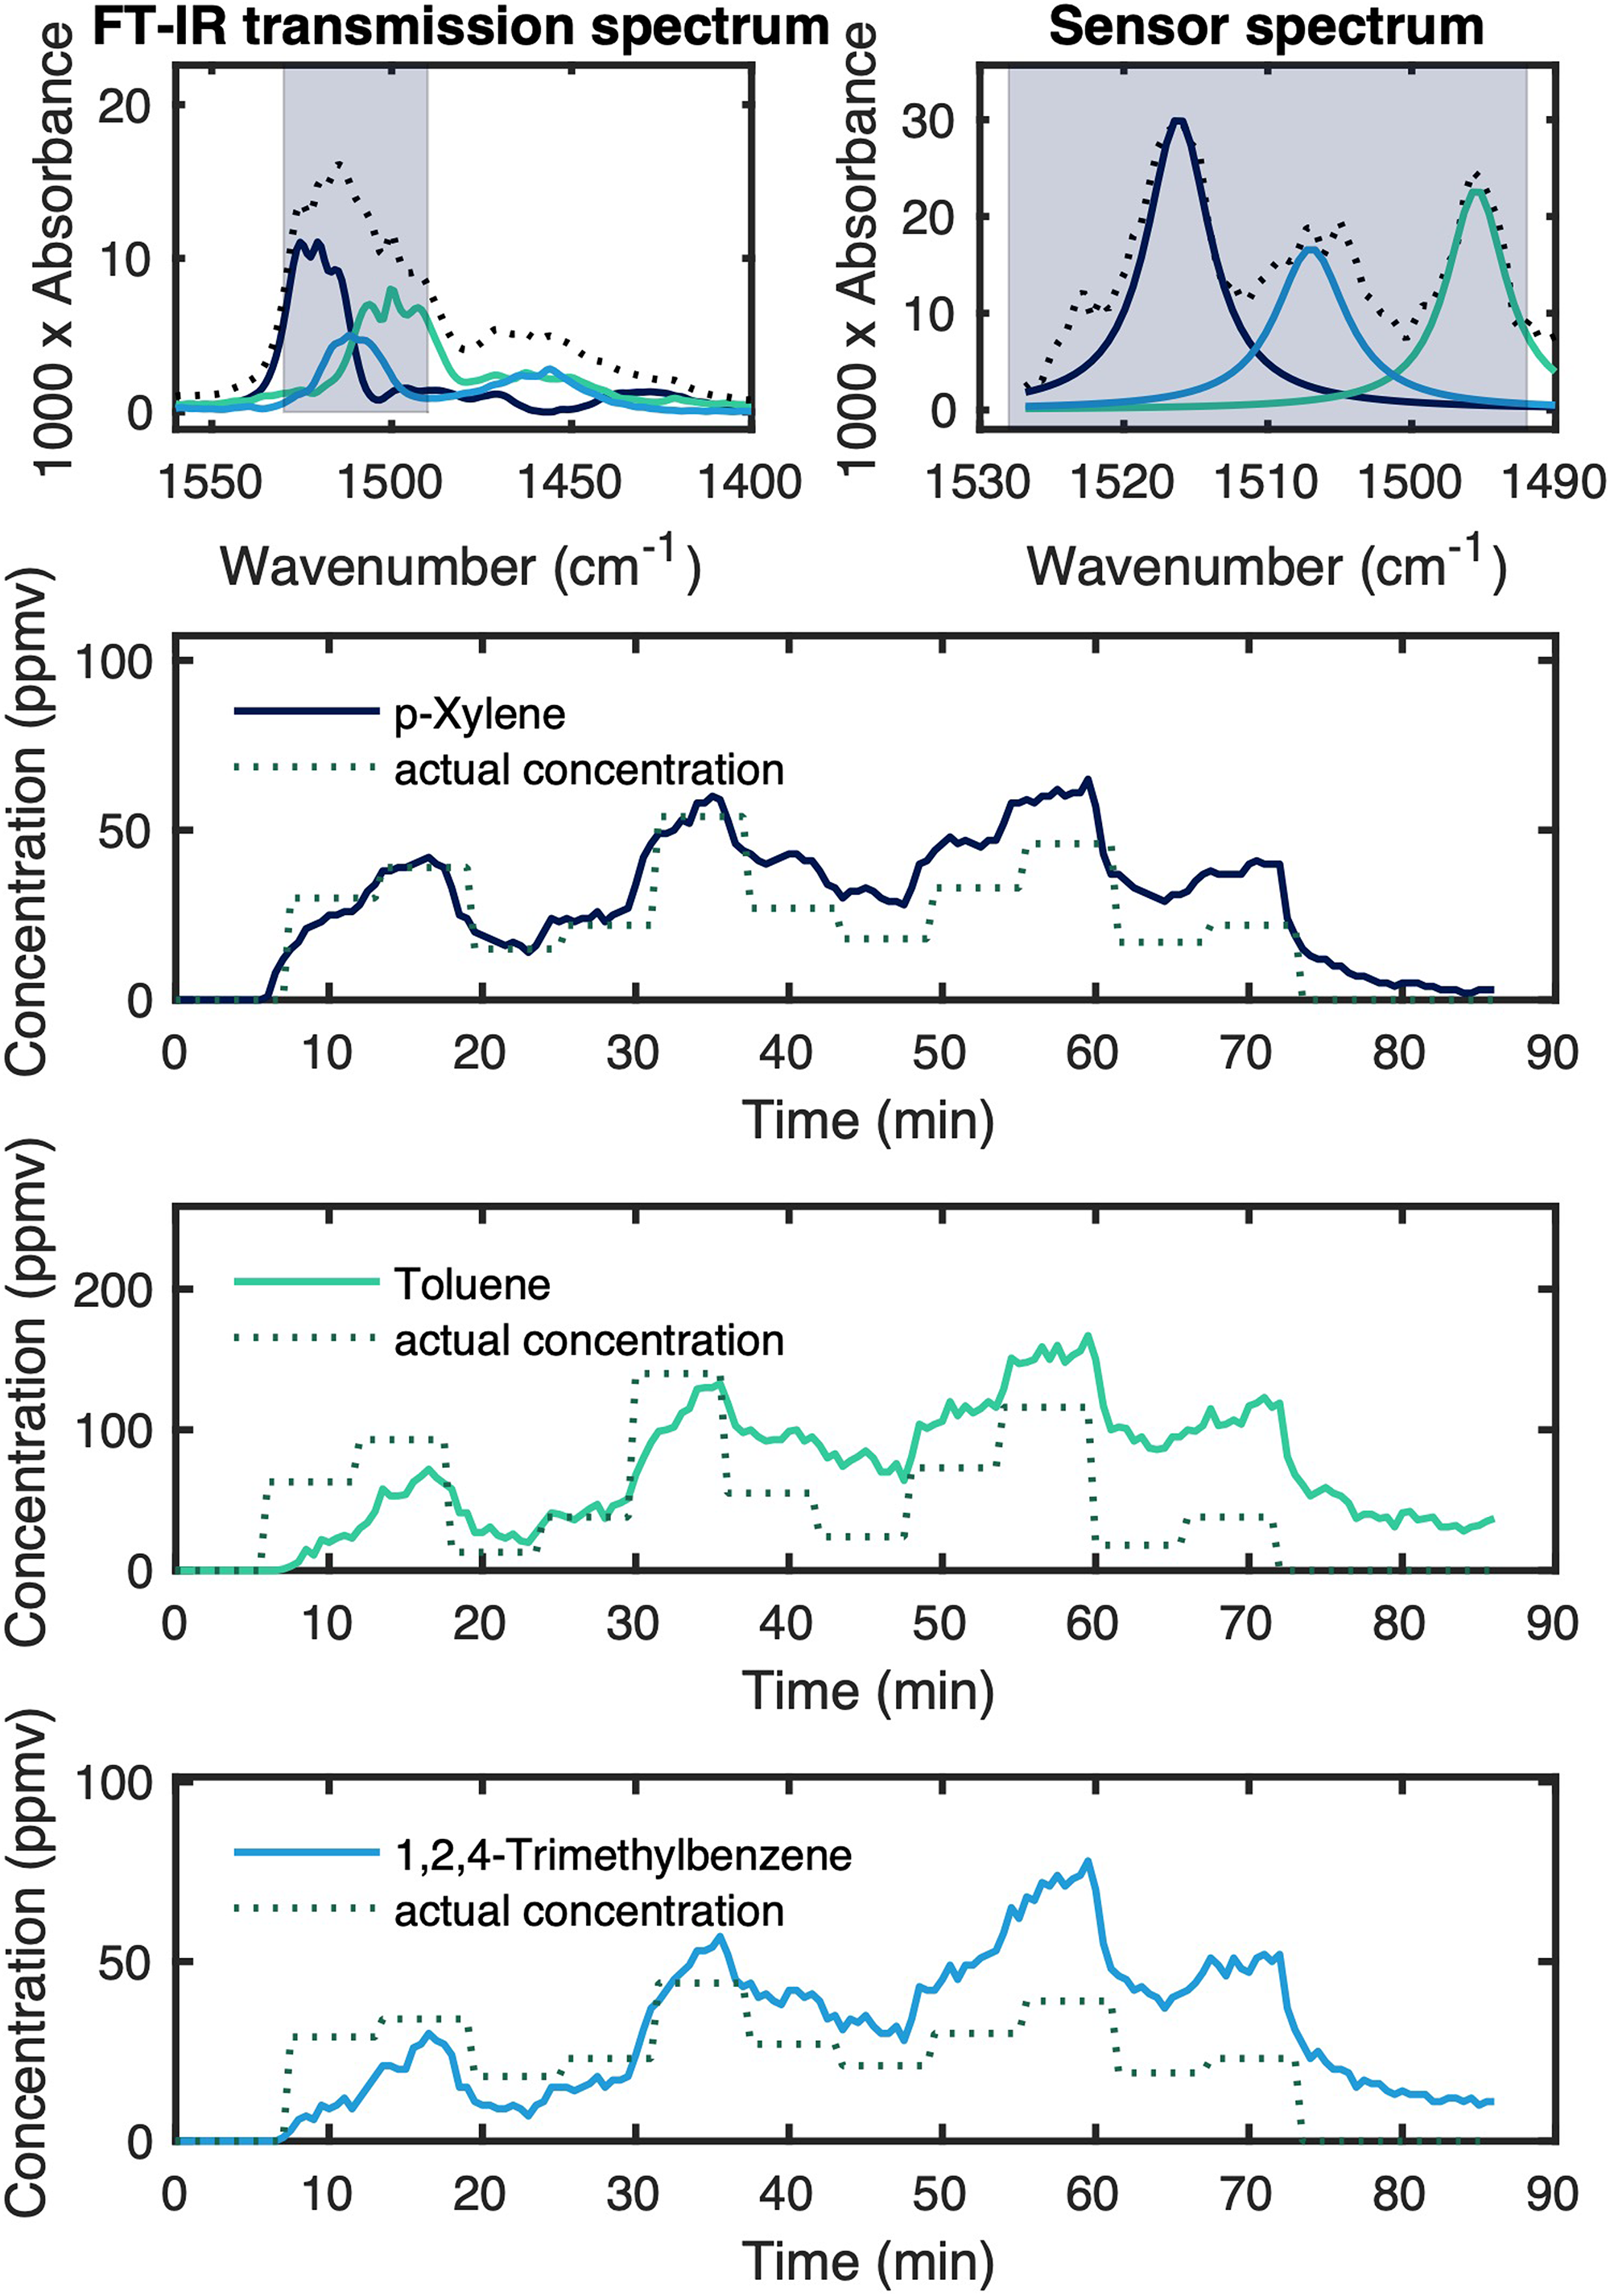
VOC spectra of the mixture used for the use case simulation in an FT-IR transmission setup (top left) and acquired with the QCL-based VOC sensor (top right). Spectral region used for the chemometric evaluation marked in blue. Results of the use case simulation for each respective VOC (bottom).
The capabilities and limitations of the sensing concept become apparent when looking at the sensor response shown in Figure 8: On the one hand, the response of the sensor is quick and accurate, and stable results can be gathered during the first 30 min. Further, the overlap of the spectra is reduced due to the absorption bands created by adsorbed gases being more similar to their liquid counterparts. On the other hand, a drift is noticeable when conducting longer measurements. This is probably due to extended diffusion in the thick, porous layers, which combined with longer exposure times than in the calibration experiments lead to a slow increase in signal over the course of the measurement. Regardless of this, the quick response of our platform to changing concentrations shows promise for the use of at-line contaminant sensing in process analytical technology environments.
Conclusion
In this work, we presented a highly sensitive QCL-IR-based multigas sensor, utilizing a Ge-on-Si optical waveguide sensing platform, grating couplers, and monolithically integrated microlenses. We successfully deposited a functionalized mesoporous silica coating on the waveguide chip, increasing the sensitivity by up to 22 000 times. The full measurement setup has a footprint of 29 × 23 × 11 cm³ and delivers results in 3 min. We demonstrated the sensing capabilities of the presented system by analyzing three different aromatic VOCs (toluene, p-xylene, 1,2,4-trimethylbenzene) and their respective mixtures, achieving sub-ppmv levels of detection and stability to water vapor traces. We explored deconvolution of the overlapping VOC spectra and subsequent quantification of the respective pure component peak areas using different chemometric methods including NNLS and MCR-ALS. Lastly, we performed a use-case simulation of the sensor, with the sensor reacting rapidly to changing concentrations of the three VOCs. In this experiment, the capabilities of the presented technique were demonstrated in a more realistic scenario, with long-term stability of the sensor signal still not optimal due to diffusion in the sensing layer covering the whole chip. To improve on that, our future work will focus on patterning the mesoporous layer, improving the response time and long-term stability of the sensor. Furthermore, next-generation waveguide designs with even lower propagation losses or other schemes based on dispersion spectroscopy that has shown high potential in transmission configuration 33 can be combined with our approach, leading to even higher sensitivities comparable to established techniques.
Supplemental Material
sj-docx-1-asp-10.1177_00037028241300554 - Supplemental material for Integrated Optics Waveguides and Mesoporous Oxides for the Monitoring of Volatile Organic Compound Traces in the Mid-Infrared
Supplemental material, sj-docx-1-asp-10.1177_00037028241300554 for Integrated Optics Waveguides and Mesoporous Oxides for the Monitoring of Volatile Organic Compound Traces in the Mid-Infrared by Felix Frank, Bettina Baumgartner, Mattias Verstuyft, Nuria Teigell Beneitez, Jeroen Missinne, Dries Van Thourhout, Gunther Roelkens and Bernhard Lendl in Applied Spectroscopy
Footnotes
Acknowledgments
This work is partly funded by the ACTPHAST4R project, which has received funding from the European Union's Horizon 2020 research and innovation program under grant agreement No. 825051. This project is an initiative of the Photonics Public Private Partnership. X-ray diffraction was performed at the interfaculty X-ray center of TU Wien. The authors acknowledge TU Wien Bibliothek for financial support through its Open Access Funding Programme.
Declaration of Conflicting Interests
The author(s) declared no potential conflicts of interest with respect to the research, authorship, and/or publication of this article.
Funding
The author(s) disclosed receipt of the following financial support for the research, authorship, and/or publication of this article: This work was supported by the H2020 LEIT Information and Communication Technologies, (grant number 825051).
Supplemental Material
All supplemental material mentioned in the text is available in the online version of the journal.
References
Supplementary Material
Please find the following supplemental material available below.
For Open Access articles published under a Creative Commons License, all supplemental material carries the same license as the article it is associated with.
For non-Open Access articles published, all supplemental material carries a non-exclusive license, and permission requests for re-use of supplemental material or any part of supplemental material shall be sent directly to the copyright owner as specified in the copyright notice associated with the article.