
Abstract
Attenuated total reflection (ATR) spectroscopy in infrared is a standard tool used in most analytical labs, as it allows a rapid chemical analysis with virtually no sample preparation. However, when the sample contains materials with a high refractive index, special care must be taken as the resulting data may be severely biased. This article reports a theoretical approach to correcting distorted ATR spectra. Starting from Snell's law, Lorenz model and Fresnel's equations are combined to obtain the complex relationship between optical constants. With calculating the real and imaginary parts, that is,
This is a visual representation of the abstract.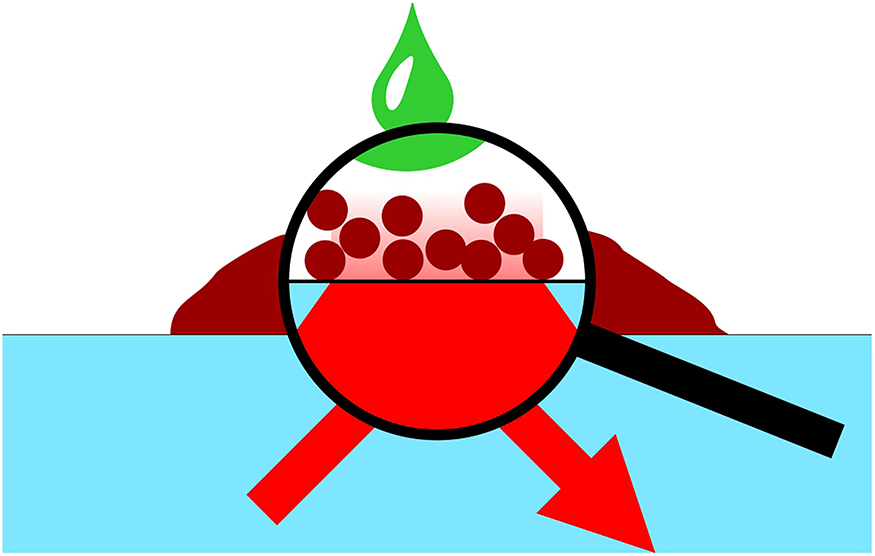
Keywords
Introduction
Attenuated total reflection (ATR) techniques are widely used in spectroscopy due to their experimental simplicity and non-destructive nature.1–7 In ATR, radiation is propagating in a material with high refractive index, often referred to as the internal reflection element (IRE), and undergoes total internal reflection at the IRE surface. This surface is in contact with the sample such that the evanescent field 8 of the radiation can interact with the sample. In ATR absorption methods, internally reflected radiation carries information about the absorption spectrum of the sample.
The most widely used range for the ATR technique is the mid-infrared spectral range 9 (i.e., from ∼4000 to ∼200 cm–1). The aim is usually to either carry out a structural analysis from assigning the peaks to vibrational modes or to perform quantitative measurements (e.g., as a means of process analytical technology). However, there are a number of issues arising from complex, chemically, and physically inhomogeneous samples and extracting reliable information from their spectra. This is particularly true for strongly absorbing samples and media with a high refractive index, such as carbon black,10,11 coal, 12 graphite, graphene, rubber,13,14 metal,15–17 metal oxide, 18 etc. 19 When such samples are analyzed, the ATR spectrum is always affected by significant distortions.20–23 As those distortions can originate from a multitude of physical and chemical phenomena, it is vitally important to understand the underlying mechanisms and to develop methods for their correction. Most of these issues are related to the fact that the refractive index is so high that the critical angle is higher than the one used in the ATR accessory; hence, the total internal reflection is affected.
In the present work, we focus on the analysis of mixtures of particles mixed with a solvent as suggested for the recently developed solvent infrared spectroscopy approach, which can be used to study the surface chemistry of nanomaterials. 24 Such systems are particularly interesting as they seem to be simple at first glance because the IRE–solvent interface appears to be dominating the evanescent field. However, we will show that the reality is more complicated. For this purpose, a theoretical framework based on Snell's law and the Kramers–Kronig (KK) relationship25,26 has been developed. From this framework, a method for correcting distortions in experimental spectra is proposed. Simulations and experimental data are presented to illustrate the phenomena. We note that the model itself is of general nature and can be used to treat classical cases of samples as well.
Experimental
Materials and Methods
Two different carbonaceous materials were used: (i) Carbon black powder from Aladdin Reagent Database Inc., and (ii) activated carbon pellets that are commonly used for air purification and solvent recovery (CarboTech C40/4 Extra). Toluene was purchased from Sigma-Aldrich, Inc. All materials were used as received without further purification.
Experimental Measurements
Infrared measurements were conducted on an Agilent Cary 630 Fourier transform infrared (FT-IR) spectrometer (Agilent Technologies Inc., USA) equipped with a diamond ATR sampling accessory (single reflection at 45°). The full range accessible with the instrument (i.e., 650–4000 cm−1) was recorded with a nominal resolution of 2 cm−1. A total of 32 scans were averaged to achieve an optimal signal-to-noise ratio. The measurements were carried out at ambient temperature (T ≈ 295 K) and pressure (p ≈ 1013 mbar).
Each measurement protocol entailed an initial deposition of the solid sample onto the crystal and applied pressure with the instrument's metal stamp to ensure full contact between the solid sample and the IRE. Subsequently, toluene was added.
Theoretical Considerations
Snell's Law and Attenuated Total Reflection Spectroscopy
As aforesaid, in ATR, the sample is in contact with a high refractive index material in which radiation undergoes total internal reflection. For clarity and to define a suitable starting point for further theoretical considerations, we briefly introduce the physical basics that describe this situation.
When light propagates from one transparent medium into another, Snell's law applies at the interface:
27


Most commercially available ATR units are operated at an angle of incidence of 45° or 60°, and the typical materials are diamond, germanium, and zinc selenide. Table I gives an overview of the resulting critical refractive indices using the IRE refractive index at 10 µm (= 1000 cm–1).
Refractive index and critical sample refractive indices for common IRE materials for common angles of incidence. Note that only two digits are given as this precision translates to what can approximately be achieved in adjusting the angle in an experiment.
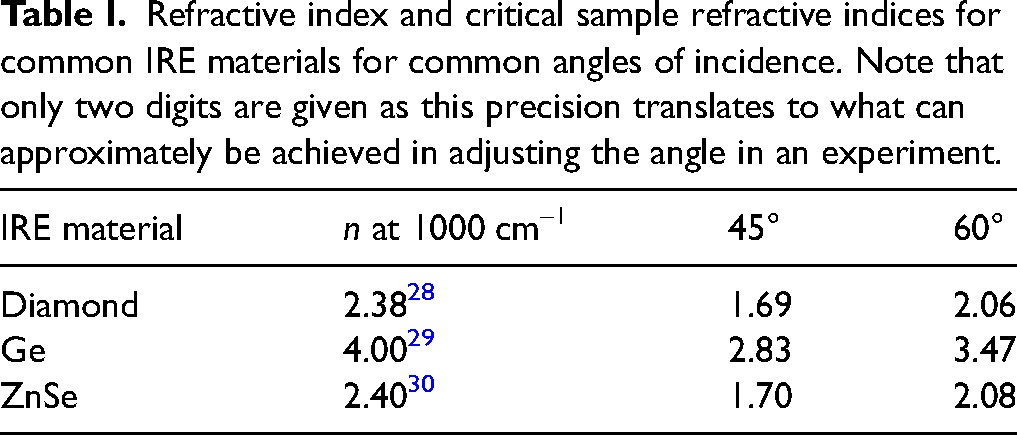
For most inorganic and organic substances, the refractive index is well below 1.7. Even if the refractive index is higher than the critical value in some parts of the spectrum (e.g., due to absorption signatures), the resulting ATR data will be informative, but spectral interpretation will be complicated by band shape changes and peak position shifts. If the refractive index rises above the critical value in a narrow range around a spectral signature, the ATR technique is still useable. However, some substances exhibit a high refractive index and strong absorption transitions in the entire spectral range of interest. For instance, when carbonaceous materials and related products, such as rubber, are to be analyzed, even IRE materials with a high refractive index like Ge are not completely satisfying. When such materials are analyzed by ATR spectroscopy, there will be peak shifts, complicated baselines, and complex and abnormally shaped peaks. These phenomena can lead to misinterpretation (e.g., when the peak shifts are attributed to molecular interactions).
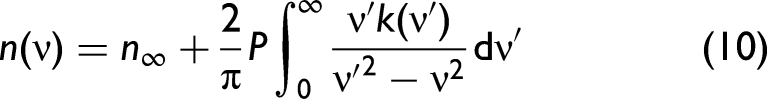
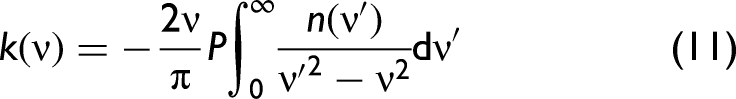
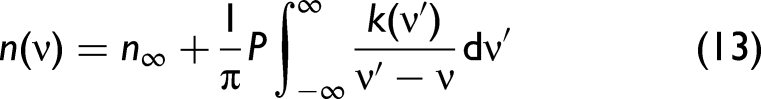
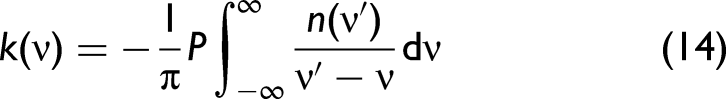
Kramers–Kronig Relationship
In order to develop a better understanding, we need to consider the complex refractive index, 
The relationship between 


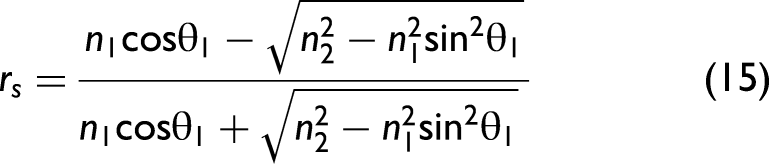
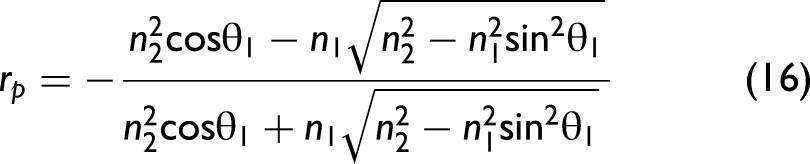
Fresnel's Equations
In order to take polarization effects into account, the Fresnel equations need to be considered in the model. Their derivation from Maxwell's equations can be found in any optics textbook. The final set of equations is given as follows:
38
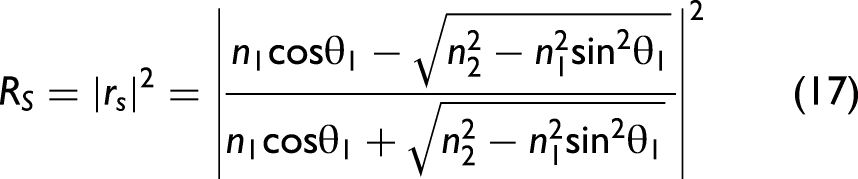
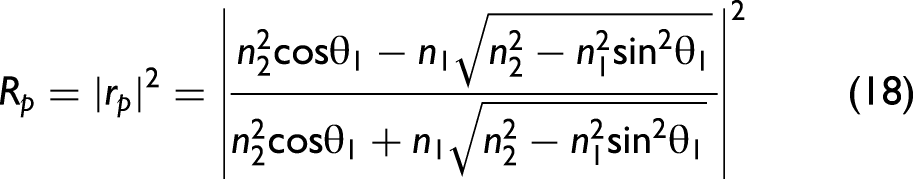

Note that Eq. 19 provides an approximately calculated value when the incident light is naturally polarized (unpolarized). In general, light is not naturally polarized in an ATR accessory since optical elements like mirrors change the polarization state in dependence of the wavenumber. It is possible to take the polarization state into account for correcting ATR spectra, but, in this work, we assume that the light is approximately naturally polarized. In particular, for ATR accessories employing multiple reflections, this approximation may no longer be appropriate, and our formalism would need to be extended.40,41
Simulation Approach
Obtaining n(ν) and k(ν) from Absorption or Reflection
In this section, we present the stepwise calculation procedure. Please refer to Figure S2 (Supplemental Material) for a basic flowchart. For illustration purposes, we consider a mixture of carbon and toluene in order to show results based on real data.
First, the values for 
where d is the path length. The path length as such does not exist in ATR, but an effective path length can be determined from the penetration depth dp. The amplitude of the evanescent wave decays to 1/e of its maximum value at a distance dp from the interface. This distance is on the order of the wavelength of light and given by
This parameter can be converted to an effective path length deff, which is the path length that would lead to the same absorption in a transmission experiment. The latter assumes low absorption, the same assumption deff is derived from. deff depends on dp and the polarization state of light.42,43 In order to focus on the relevant math here, we simplify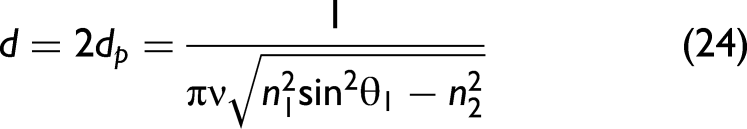
and obtain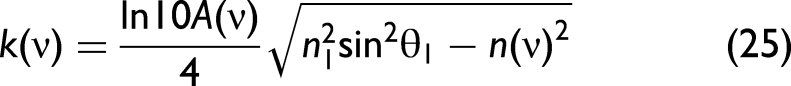
Furthermore, Step 1: 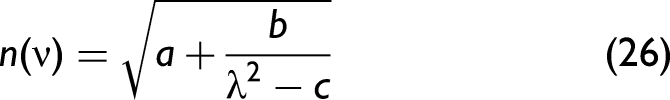
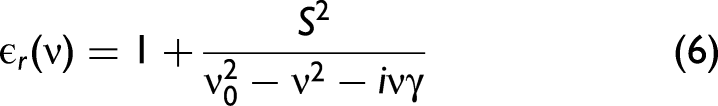
where a, b, and c are constant numbers that are derived from fitting the equation to experimental data. Note that the n(ν) in Eq. 26 is measured at non-absorbing frequencies. Please find a detailed explanation in the supporting information (Figure S3, Supplemental Material). It derives from Eq. 6 under the assumption of zero damping (i.e., without absorption). At this point, n(ν) is only used to calculate
Step 2: Replace n by

in which, Step 3: The obtained Step 4: Get the complex refractive index Step 5: Treat Step 6: Calculate the new 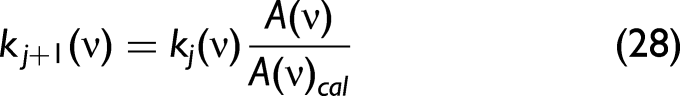
Repeat Steps 3–5 until Then, stop the calculation to obtain n(ν) and k(ν).
In the low-wavenumber range, there may exist a non-convergence using the abovementioned approach. This is attributed to strong absorption features and the real part of the refractive index 
Finally, the two pieces of data are spliced to get the complete data set. The measured
As the refractive index of carbon is larger than the critical refractive index, the corresponding complex refractive index cannot be calculated in this way. Therefore,
Figure 1 shows the
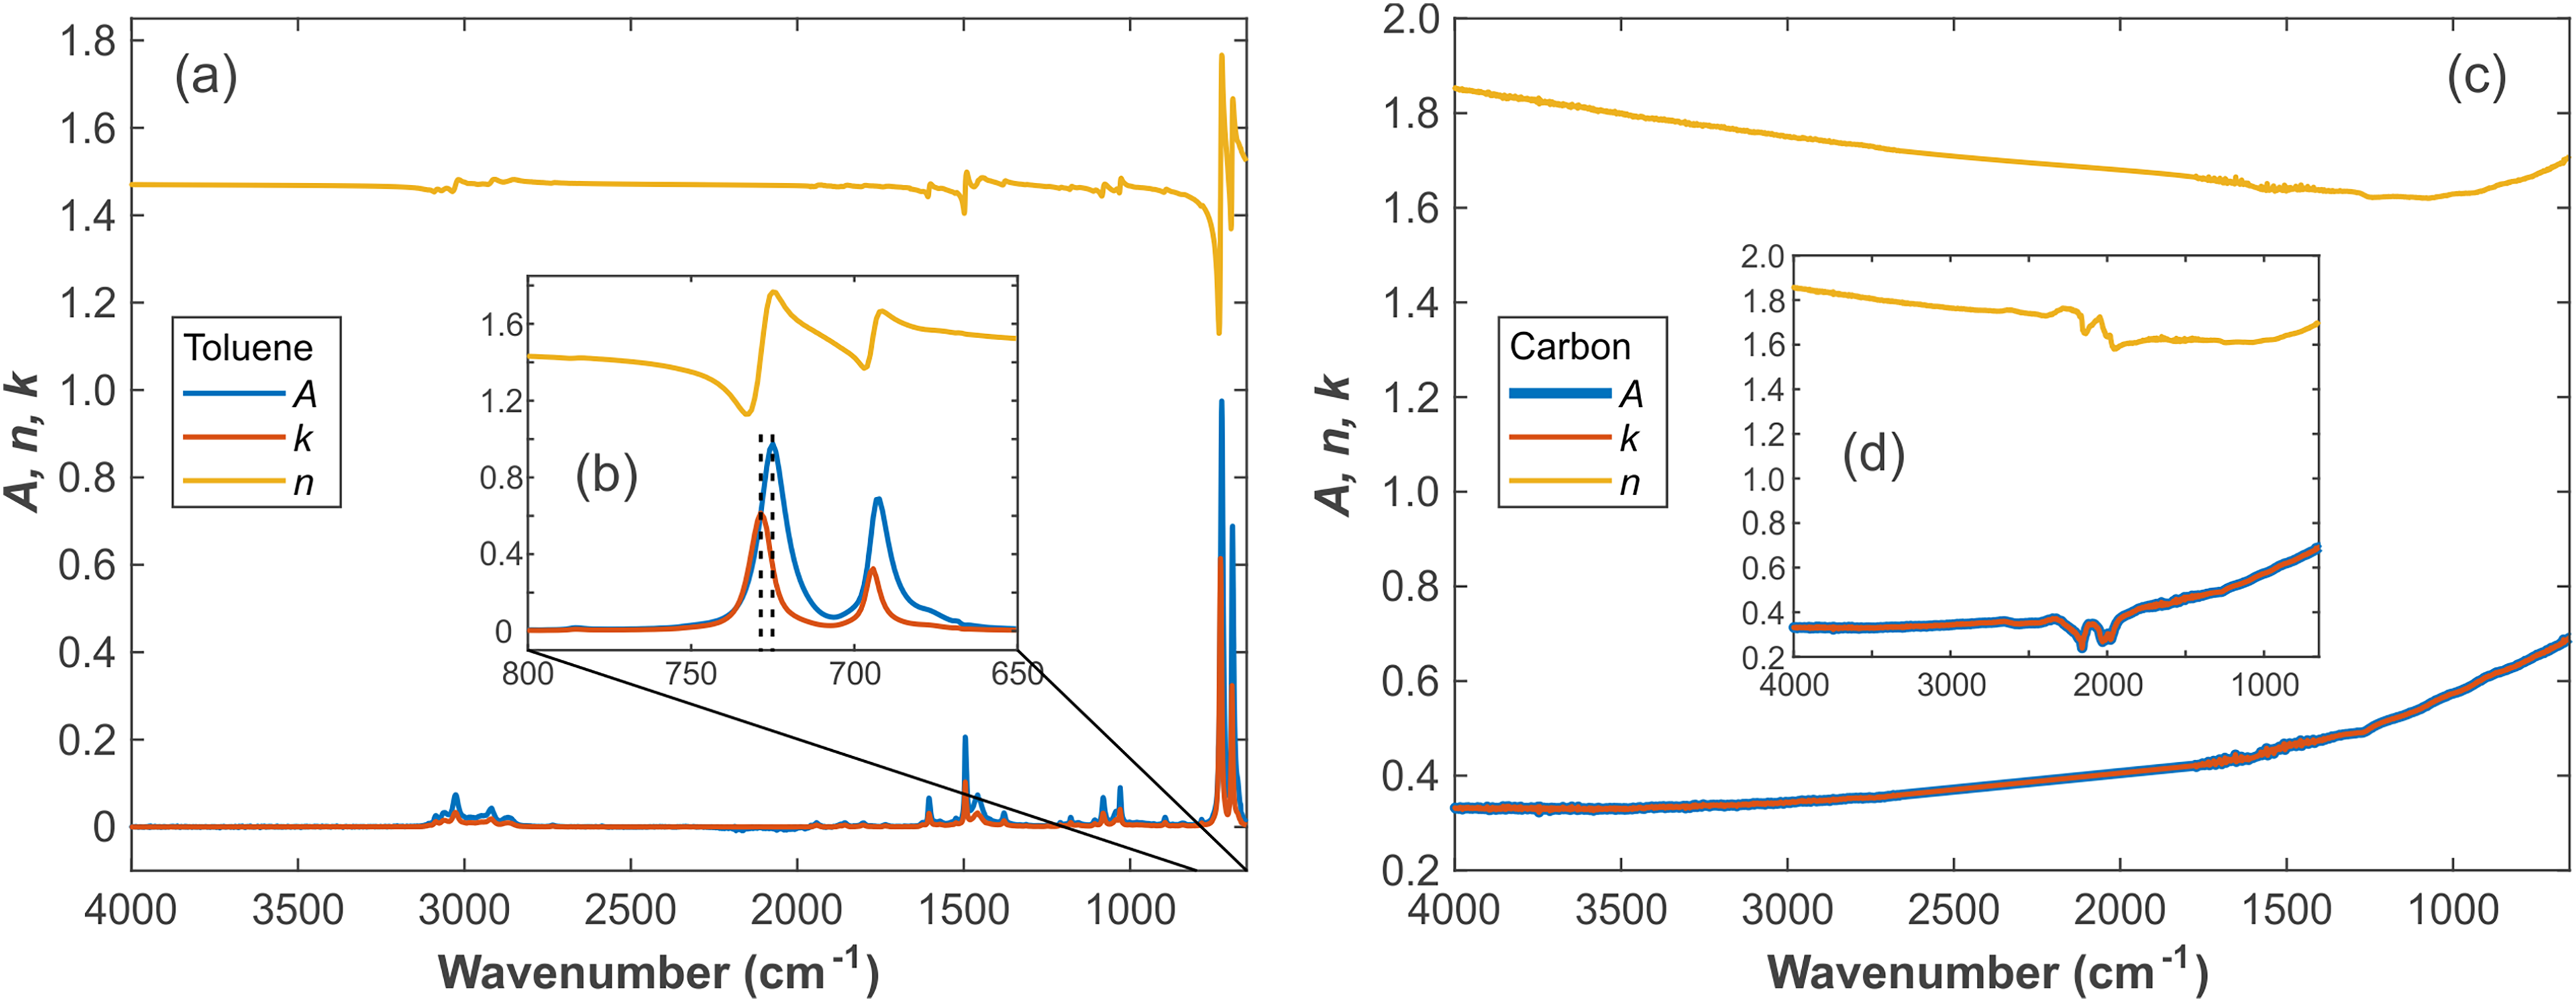
Spectra of pure toluene and carbon. (a) Overview
The signatures around 1800–2200 cm–1 in Figure 1d are caused by two-phonon absorptions of the IRE material diamond.49,50 This absorption feature is of great significance for determining whether the distortion of the spectrum is caused from optical reasons, that is, the non-attenuated total reflection caused by the excessive refractive index of the sample. Strictly speaking, the refractive index of diamond should be treated as a complex number, but then we would have to switch to a more complex optical model that treats the ATR crystal as an incoherent layer. However, since most samples have no absorption in this wavenumber region, and diamond does not exhibit absorption signatures elsewhere in the considered spectral range, we treat diamond as a non-absorbing medium here. This assumption helps to keep the complexity of the calculation relatively small. When simulating or correcting the spectrum, this part can be directly replaced with a straight line or corresponding curve to reduce the simulation error.
Solid/Liquid Mixture Infrared Absorption Spectrum Model
The 


Liquid mixing does not necessarily follow the same trends as solid–liquid mixing. Eq. 34, which was developed to describe the characteristics of solid–liquid mixtures, might not be applicable to liquid-only mixtures. Solid–liquid mixing often involves complex interactions due to the disparate physical states and properties of the components, such as differences in refractive index, light scattering, and absorption behavior. These factors contribute to spectral distortions unique to solid–liquid mixtures. If x would be the mole or volume fraction, Eq. 35 should be (approximately) valid, but since Eq. 34 much better describes the experimental findings, x cannot be identified with one or the other. Since carbon black is insoluble in water and other solvents, this may be the reason that Eq. 34 is favorable over Eq. 35.
In the model, the complex refractive index comprises


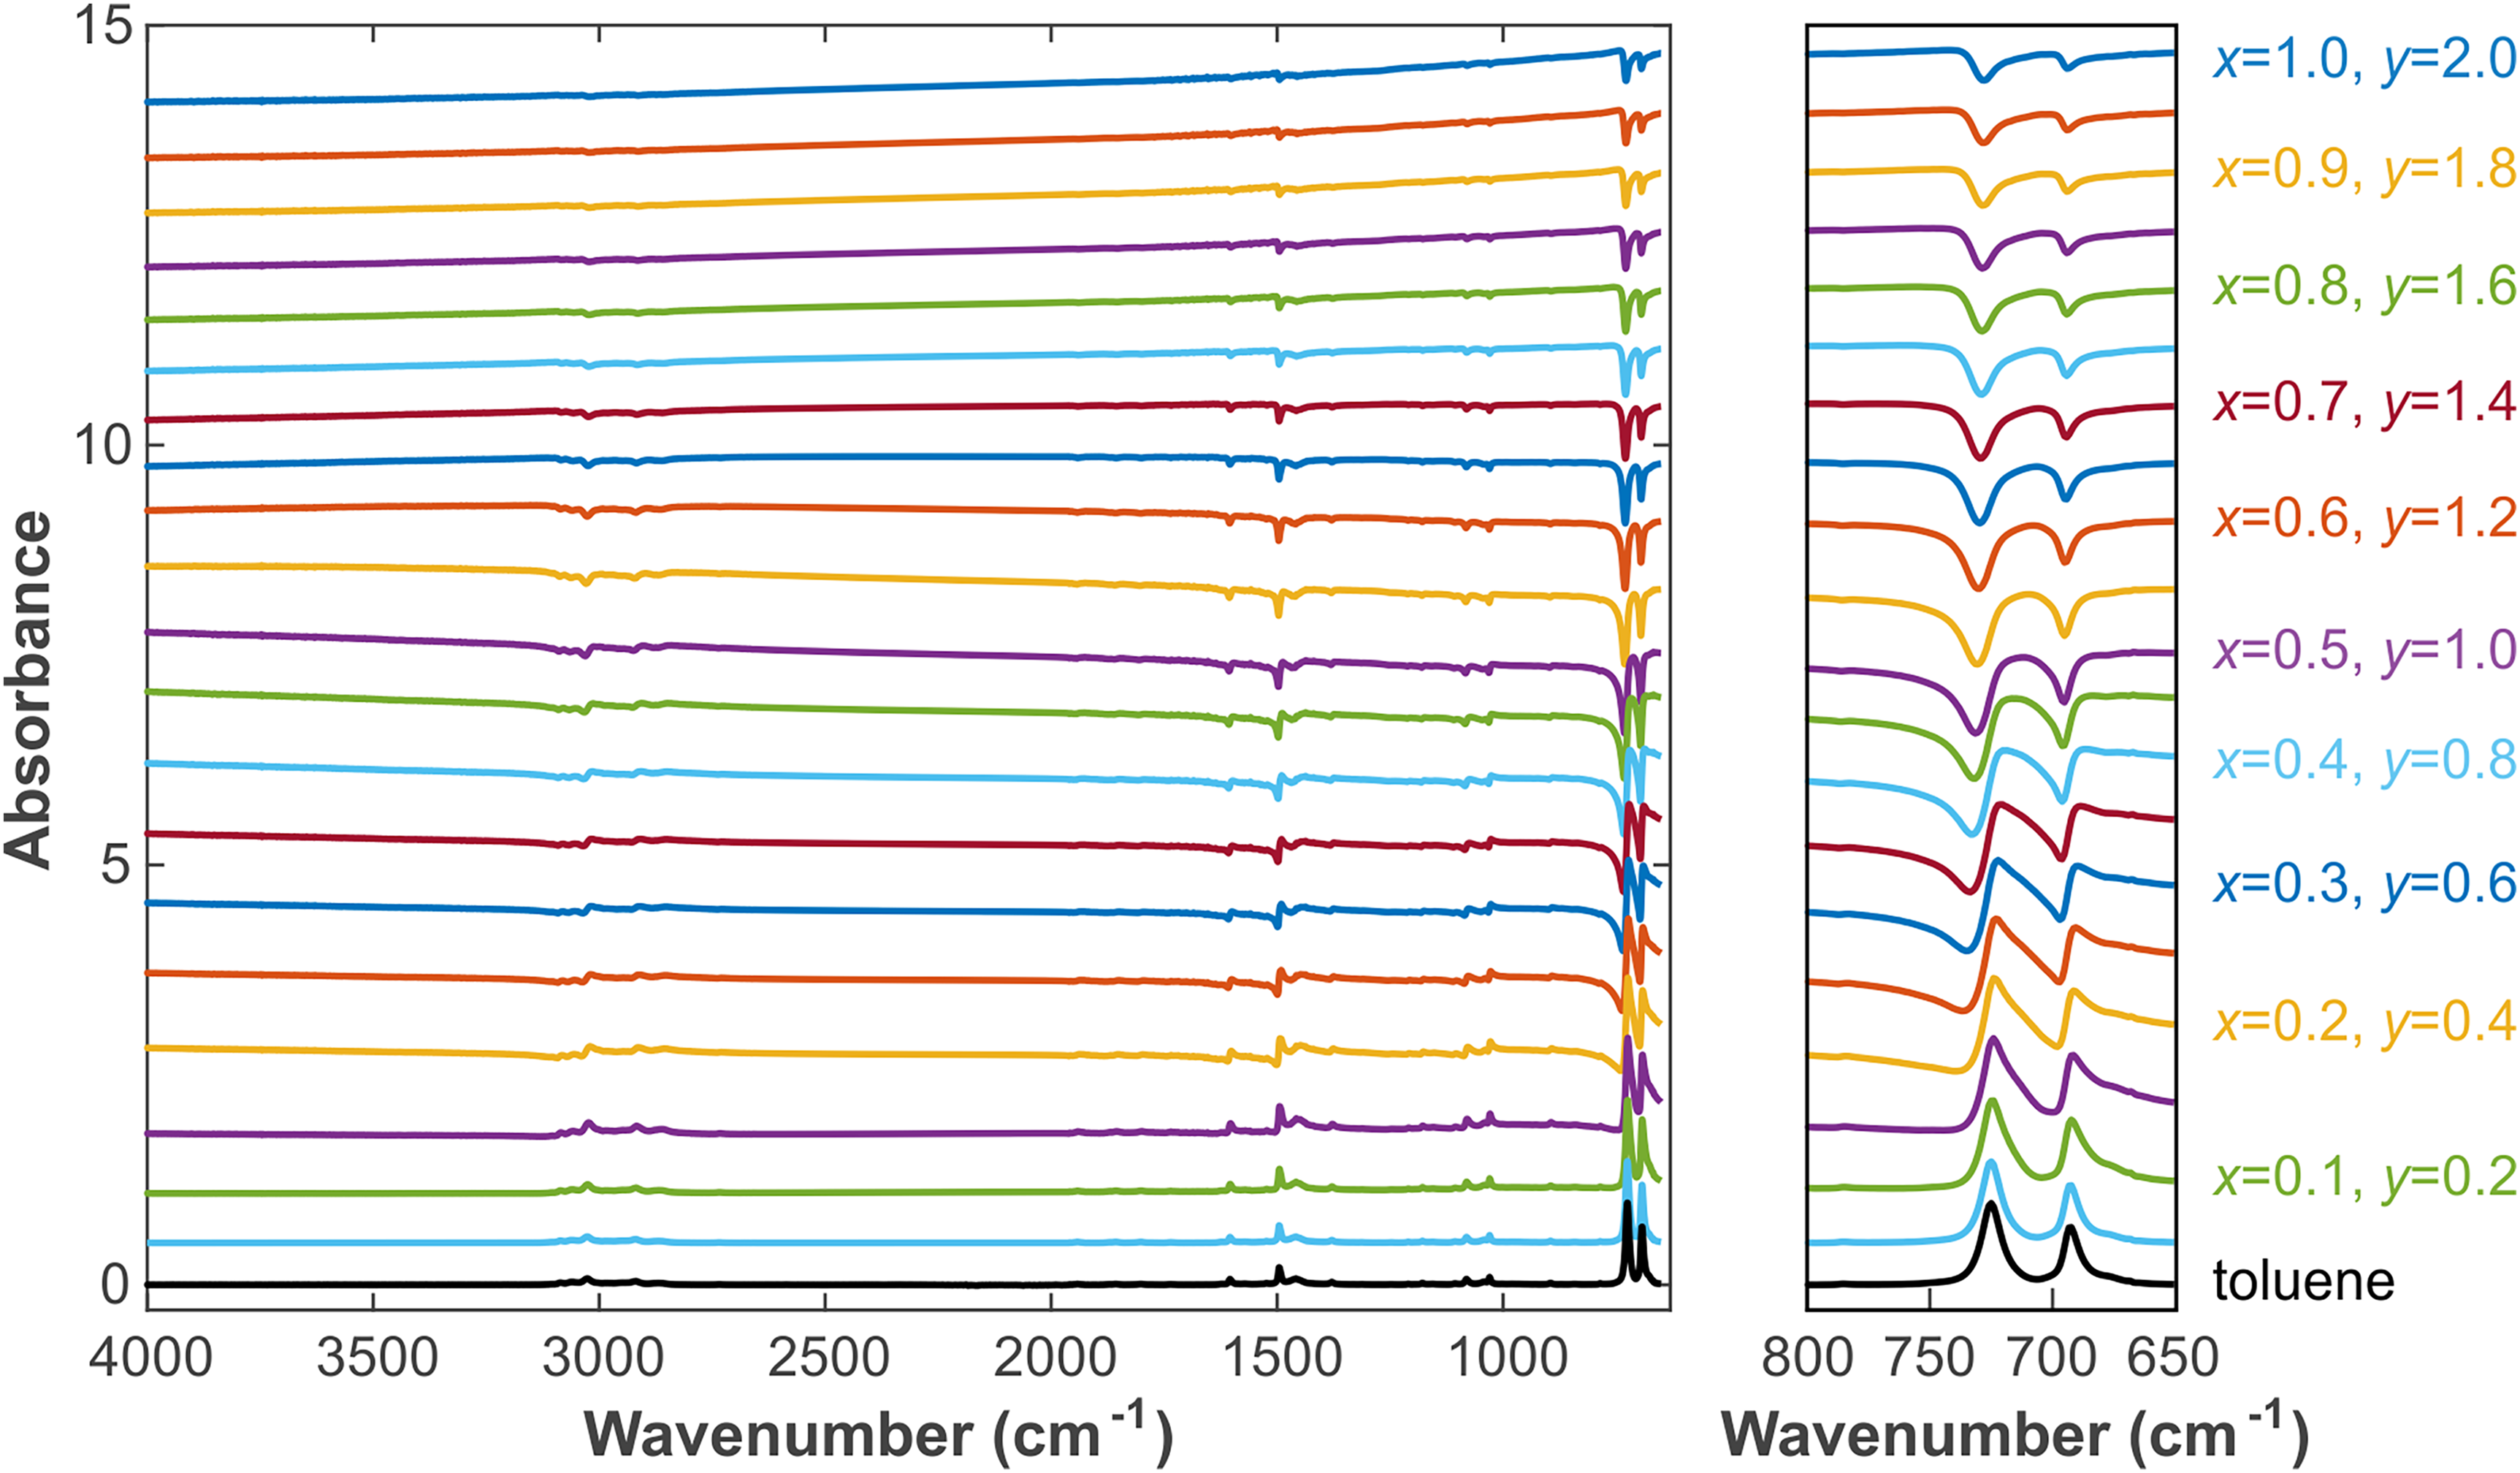
Simulated absorbance spectrum with varying x and y using Eq. 34 in combination with Fresnel's equations. The initial toluene spectrum is displayed at the bottom. The parameters x and y are increased in steps of 0.05 and 0.1, respectively. The left panel shows the overall spectrum, and the right panel shows the enlarged region 650–800 cm–1. Spectra are displayed with offset for clarity.
Figure 2 shows that with increasing x, that is, when the refractive index of the mixture sample gradually rises, the summit first redshifts, and a concave part appears on the left side of the peak (the concave part is difficult to observe in the beginning, so many researchers treat the spectrum as “normal” and regard the redshifted peak as the result of intermolecular interactions). This is caused by the superposition of
Please note that in mixtures with a high refractive index and non-selective absorption, it is different from the selective absorption peak of a transparent medium. After the central symmetry, the peak of the recessed part will be more obvious. The peak from here began to change from center symmetry to the negative peak. Until the original positive peak completely disappeared, the negative peak appeared. The entire absorption spectrum will be overall inverted and show a blueshift. This phenomenon can be verified from the mixed graph of pure carbon black and toluene shown in Figure 3. With increasing y, the baseline starts to tilt. In the low wavenumber regime, the baseline starts to rise, which is caused by the absorbance of carbon black, see Figures 1b and 4. However, when it reaches a certain level, the low wavenumber baseline starts to drop again, while the high wavenumber baseline slowly rises until it finally becomes the inverted, blueshifted peak of the original liquid absorption peak. Of course, the increases of x1, x2, and y are almost synchronized, which shows that x1, x2, and y are not independent variables.
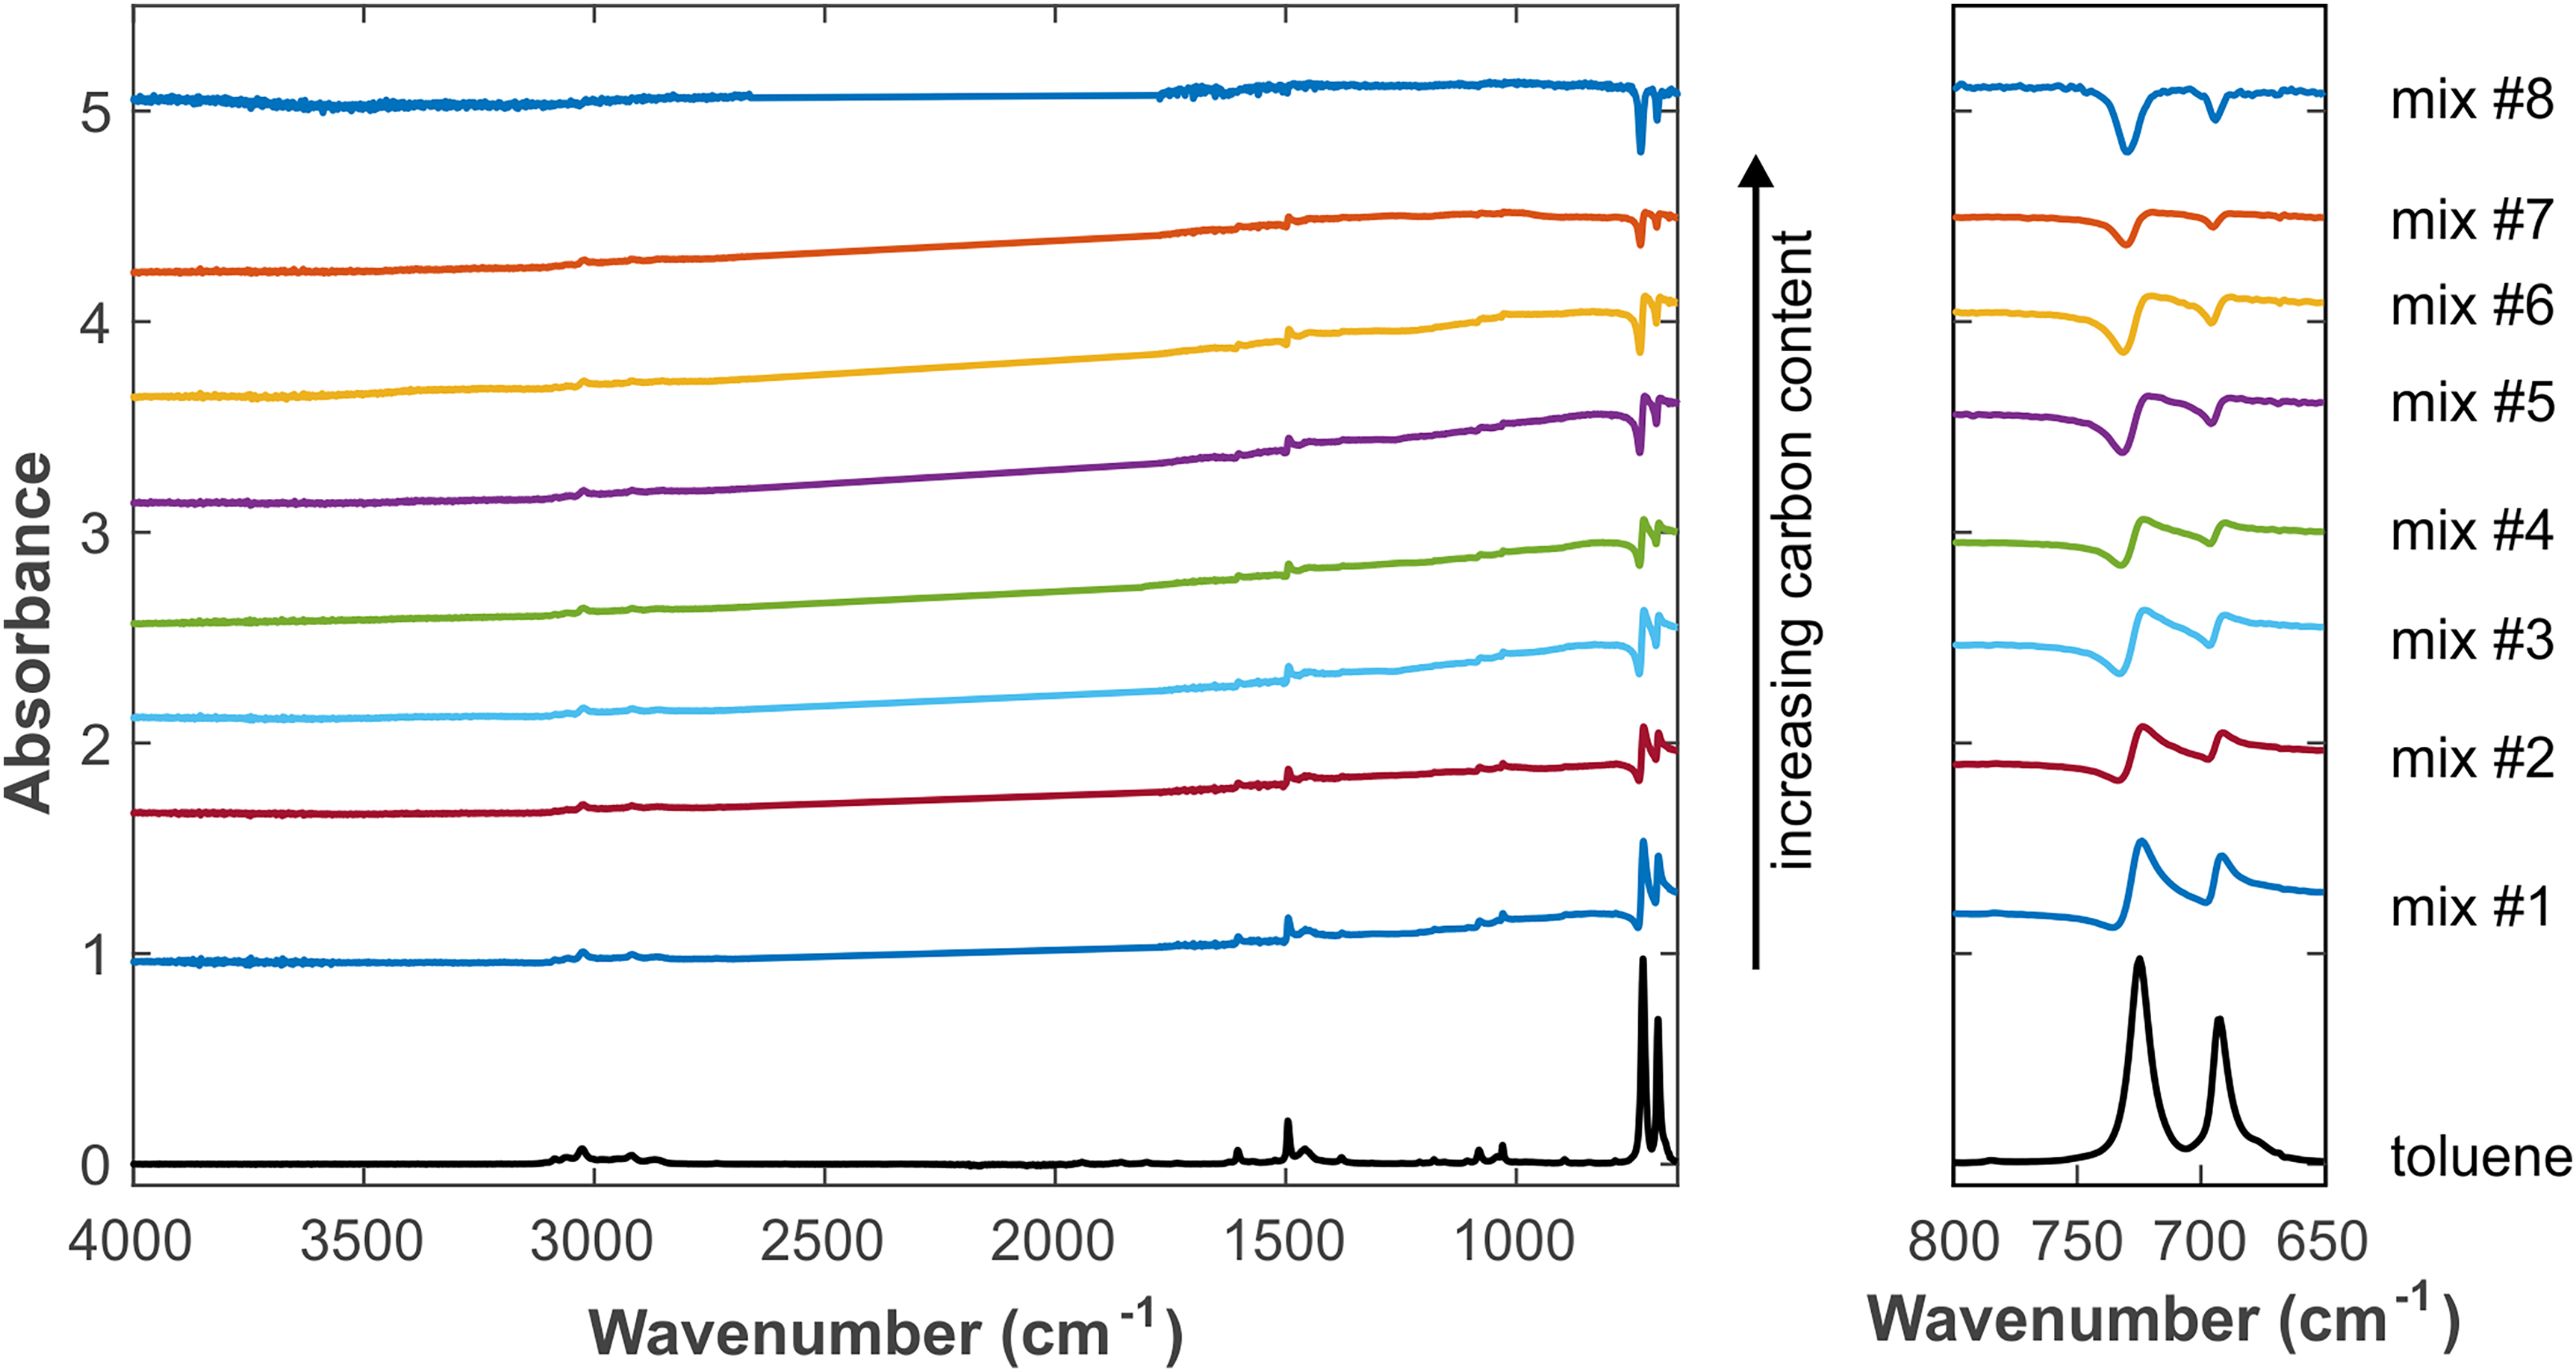
Experimental spectra of different mixtures containing carbon black and toluene. The spectrum of pure toluene is displayed at the bottom. The left panel shows the overall spectra, and the right panel displays the enlarged region 650–800 cm–1. Spectra are displayed with offset for clarity.
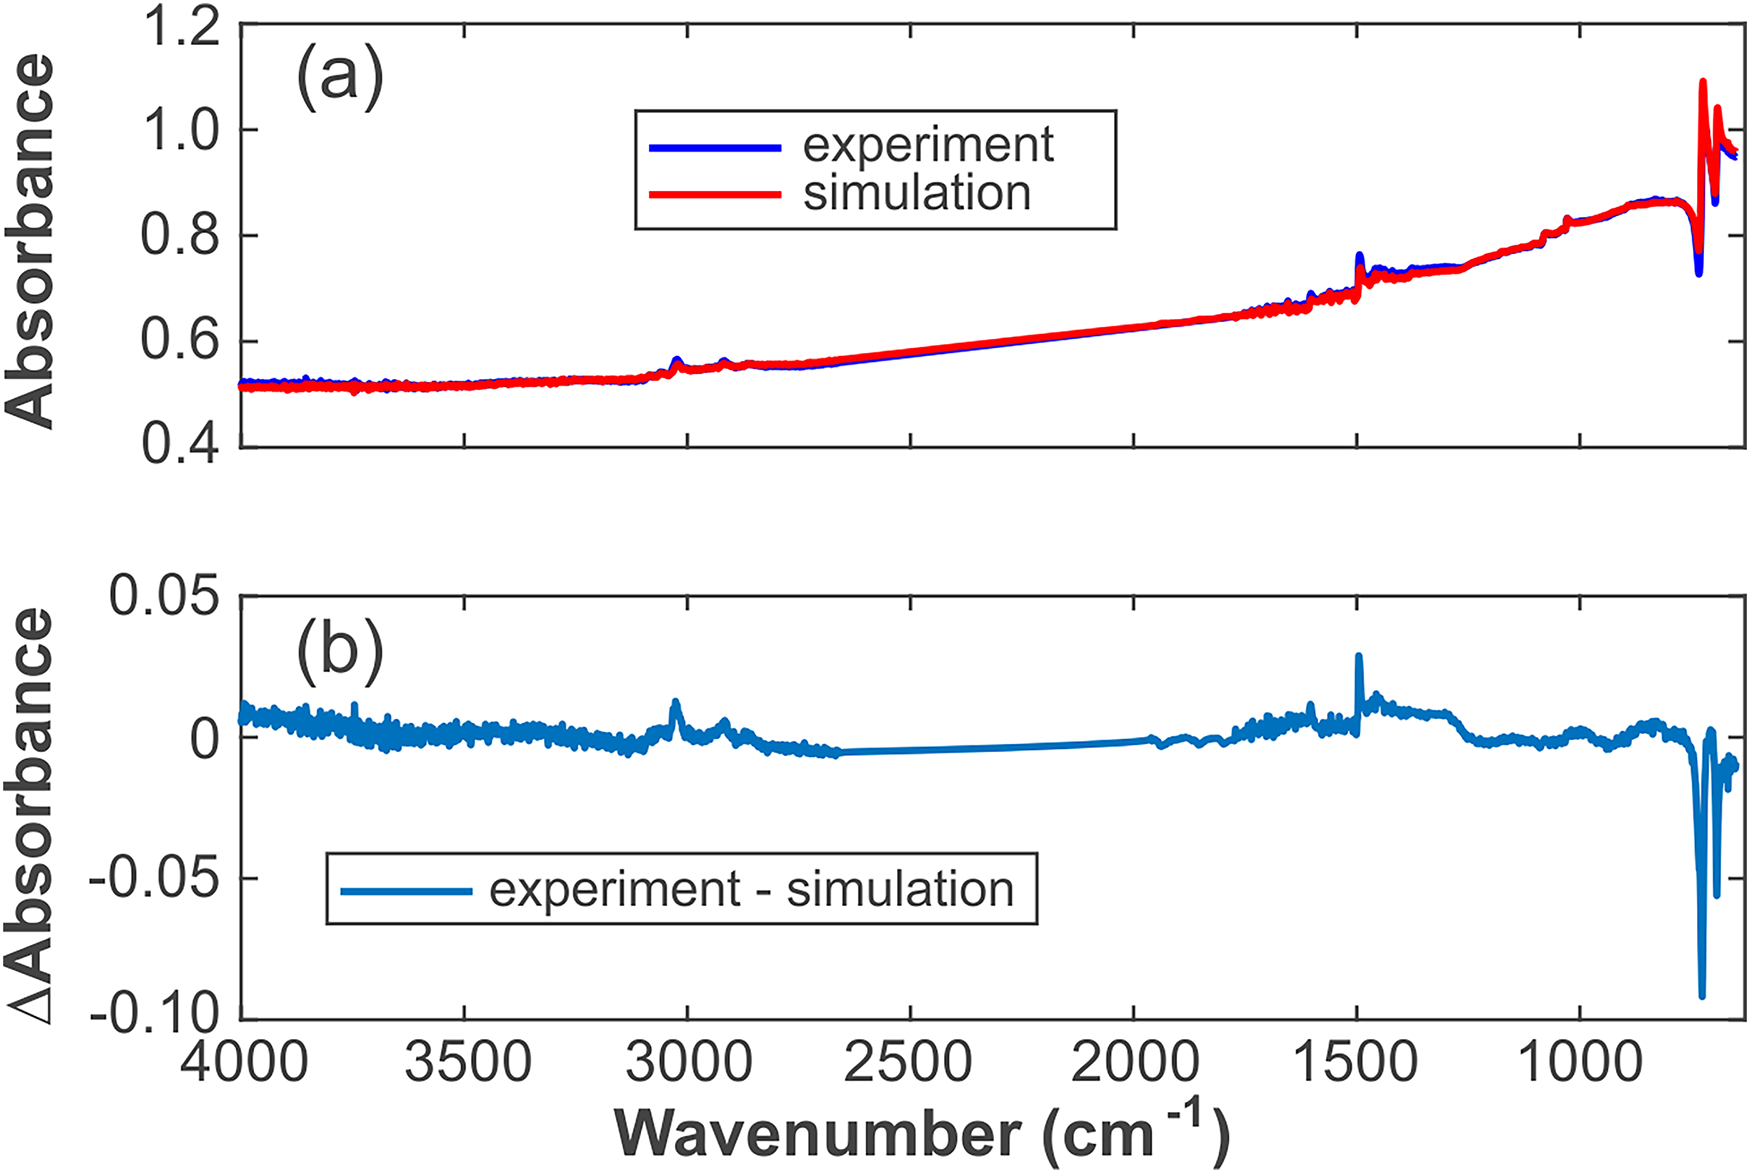
(a) Experimental and simulated spectra of the sample mix no. 3 and (b) their difference spectrum.
To summarize the above, when light is refracted by the optically dense medium into the optically thin medium, the distortion of the spectrum caused by the real part
When the mixture contains a substance with non-selective absorption, and the refractive index of the sample is high enough, the infrared peaks of the sample can be observed anything from a positive to negative appearance and from redshift to blueshift. This is particularly the case when the mixture contains carbonaceous substances such as carbon black, graphite, or graphene. These substances do not provide distinct absorption peaks in the infrared, so such peaks can be observed only when other organic substances are admixed. Unfortunately, carbon itself can cause the distortion of the baseline; the baseline will rise sharply at low wavenumbers, and because of its high reflectivity, the normal infrared spectrum is almost invisible when the content is higher than 20%. This is even true for Ge-ATR (i.e., under the condition that the refractive index is smaller than the critical refractive index of Ge).
Comparison of Theory and Experiment
In order to qualitatively test and validate the theoretical model and results presented above, a series of experiments with mixtures of carbon black and toluene were carried out. The exact composition at the IRE–sample interface is difficult to determine, but the experimental procedures were such that a clear variation of the carbon content at the IRE interface could be achieved, which is sufficient for our comparison. Figure 3 shows the spectra obtained with different proportions of carbon black and toluene. The development of the experimental spectra with increasing carbon content agrees well with the theoretical trends revealed in Figure 2. This demonstrates that the model includes all relevant effects.
The calculation and fitting method of the spectrum are a nonlinear fit to determine the parameters x1, x2, y, and α. The data of the mix no. 3 sample (see Figure 3) are shown in Figure 4, with the removed diamond absorption peaks between 1775 and 2661 cm–1. The data and variance are provided in Table S1 (Supplemental Material).
The difference spectrum in Figure 4b shows small deviations from zero, which may be caused by the following: (i)
Conclusion
The present work aims at better understanding the ATR spectra of complex mixtures (i.e., mixtures of organic or inorganic liquids with solids exhibiting a high refractive index). The ATR spectra of such mixtures are subject to severe distortions that can lead to misinterpretation of the data. We explored the reasons for the change of the spectrum near the critical angle and theoretically simulated the shape change and displacement of absorption peaks. The theoretical results were confirmed in experiments using toluene and carbon black as a model system. Moreover, the mixing law of
Supplemental Material
sj-docx-1-asp-10.1177_00037028241297179 - Supplemental material for Theoretical Calculation and Simulation of Peak Distortion of Absorption Spectra of Complex Mixtures
Supplemental material, sj-docx-1-asp-10.1177_00037028241297179 for Theoretical Calculation and Simulation of Peak Distortion of Absorption Spectra of Complex Mixtures by Rui Cheng, Thomas G. Mayerhöfer and Johannes Kiefer in Applied Spectroscopy
Footnotes
Acknowledgments
Rui Cheng gratefully acknowledges the Chinese Scholarship Council (CSC) for financial support. J. Kiefer acknowledges support by the Deutsche Forschungsgemeinschaft through grant KI1396/8-1.
Declaration of Conflicting Interests
The authors declared no potential conflicts of interest with respect to the research, authorship, and/or publication of this article.
Funding
The authors disclosed receipt of the following financial support for the research, authorship, and/or publication of this article: This work was supported by the Deutsche Forschungsgemeinschaft, Chinese Scholarship Council (grant number KI1396/8-1, personal stipend).
Supplemental Material
All supplemental material mentioned in the text is available in the online version of the journal.
References
Supplementary Material
Please find the following supplemental material available below.
For Open Access articles published under a Creative Commons License, all supplemental material carries the same license as the article it is associated with.
For non-Open Access articles published, all supplemental material carries a non-exclusive license, and permission requests for re-use of supplemental material or any part of supplemental material shall be sent directly to the copyright owner as specified in the copyright notice associated with the article.