
Abstract
The almost-two-centuries history of spectrochemical analysis has generated a body of literature so vast that it has become nearly intractable for experts, much less for those wishing to enter the field. Authoritative, focused reviews help to address this problem but become so granular that the overall directions of the field are lost. This broader perspective can be provided partially by general overviews but then the thinking, experimental details, theoretical underpinnings, and instrumental innovations of the original work must be sacrificed. In the present compilation, this dilemma is overcome by assembling the most impactful publications in the area of analytical atomic spectrometry. Each entry was proposed by at least one current expert in the field and supported by a narrative that justifies its inclusion. The entries were then assembled into a coherent sequence and returned to contributors for a round-robin review. A total of 48 scientists participated in this endeavor, contributing a combined list of 1055 individual articles spanning 17 sub-disciplines of spectrochemical analysis into what the current community views as “key” publications. Of these cited articles, 60 received nominations from four or more scientists, establishing them as the most indispensable reading materials. The outcome of this collaborative effort is intended to serve as a valuable resource not only for current practitioners in atomic spectroscopy but also for present and future students who represent coming generations of analytical atomic spectroscopists.
This is a visual representation of the abstract.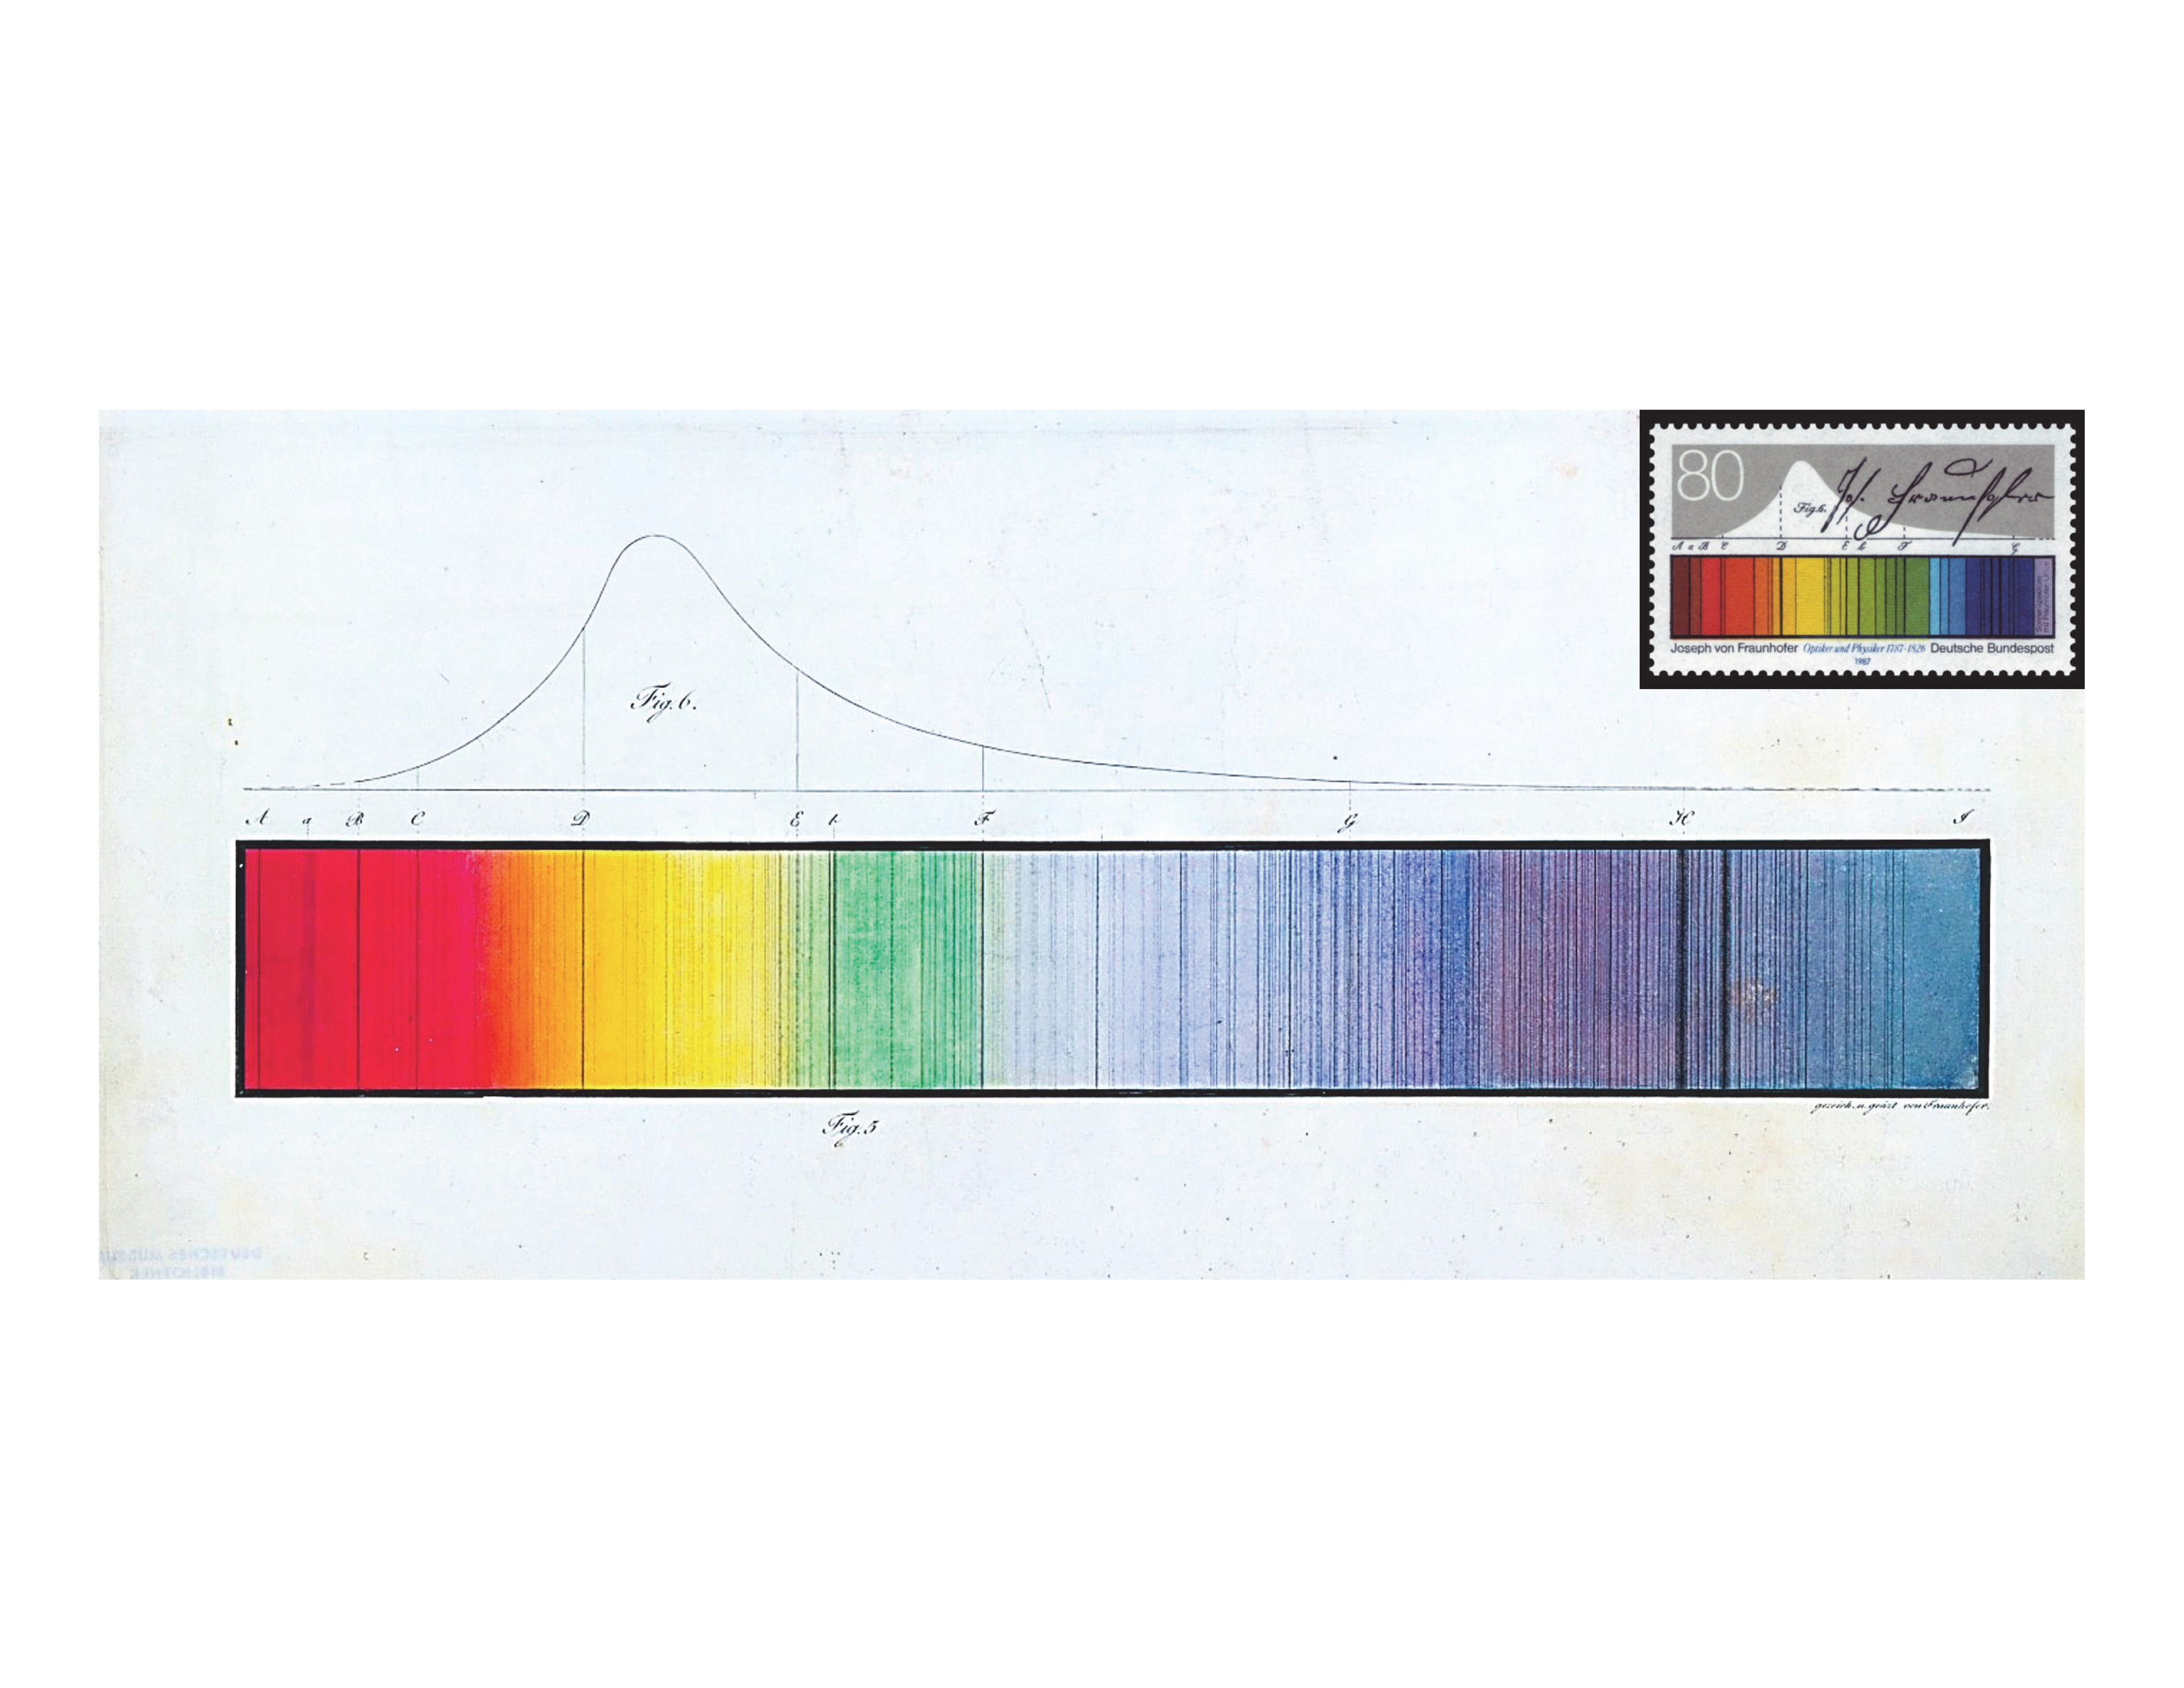
Introduction
What we call “science” is based on our cumulative understanding of the natural world. Over the centuries, this understanding, we are taught to believe, has been sharpened to reflect more accurately the state of nature. Along the way, a tremendous body of knowledge, mostly in the form of sayings and writings, has been assembled to form the underpinnings of science, so much in fact that virtually no one can now master it all. Even in narrower areas of science, analytical atomic spectrometry in the present situation, few can claim knowledge of all basic information, so summaries or reviews have been prepared to help.
Regrettably, the temptation to summarize and, later, to rely on summaries rather than the original findings misses the details, the reasoning, and the methods of the original workers. Indeed, it appears that many compilations of cited literature now rely on recent reviews rather than the primary literature or the authors of that literature.
Ideally, one should consult the original scientists and their co-workers, or hear their oral presentations. Of course, that might be impossible, in which case their writings and recordings should be examined. It is to this end that this compilation is directed.
Clearly, citing all literature in a modern area of science is impractical; it is similarly unrealistic for a younger scientist to master all earlier work in a selected area while at the same time maintaining currency in ongoing publications. This long-standing limitation was acknowledged by Heinrich Kaiser, founder and director (1952–1975) of the Institut für Spektrochemie und Angewandte Spektroskopie (Institute of Spectrochemistry and Applied Spectroscopy) in Germany. At the First International Conclave on Unsolved Problems in Spectrochemical Analysis in 1967, Kaiser asserted, “The main problem in spectrochemical analysis… is a problem of generations. … things which have been known for decades or half a century have been entirely forgotten or not taken up by the young people. … Apparently there is a lack of basic information, and the reason for this lack of basic information is that nobody is able to read the whole literature.” 1
It therefore seems sensible to compile a listing that includes only the most critical, impactful, and far-reaching publications in a field. In addition, to make such a compilation meaningful, the key “learning” or “teaching” point of each entry should be provided, to assist the student or reader in assessing the relevance of the entry to a particular activity or research area. The benefit of such a focused approach is widely recognized; in his Introduction to the highly successful book Endurance, which chronicled the doomed attempt of Ernest Shackleton to cross Antarctica on foot, Nathaniel Philbrick asserted, “A great and enduring book isn't comprehensive; it is highly, even ruthlessly, selective, zeroing in on the most evocative and illustrative moments while dispensing with the clutter that might prevent the high points from resonating to maximum effect.” 2
To our knowledge, this is the first such science compilation to have been assembled. To be sure, lists or summaries of landmark publications in other areas have appeared. For example, in 2003, the Royal Society of Chemistry reprinted a collection of milestone papers in the field of Physical Chemistry over the previous 100 years; 3 each paper was accompanied by a brief commentary that placed the publication in context and provided an indication of its importance and impact. In addition, the Journal of Chemical Education has published a series of papers, each of which was written by an author who was involved in a key development in Chemistry, and delivered from a personal perspective. 4 In the general area of analytical chemistry and chemical instrumentation, selected articles that originally appeared in Analytical Chemistry and Chemical and Engineering News were assembled and reprinted in two volumes of Modern Classics in Analytical Chemistry5,6 edited by Alvin Beilby and published by the American Chemical Society in 1970 and 1976.
In disciplines related to analytical atomic spectrometry (e.g., atomic physics, plasma spectroscopy, etc.), collections of key papers have been published; for example, 17 landmark papers on physical atomic spectroscopy were reprinted in the book Atomic Spectra 7 by William Hindmarsh in 1967, and 30 classic papers on physical processes and spectroscopy of plasmas were collected in Selected Papers on Physical Processes in Ionized Plasmas 8 by Donald Menzel in 1962. More recently (2016), 32 masterpieces on the topics of thermodynamics, atoms, and quanta were reproduced in A Student's Guide Through the Great Physics Texts, Volume IV: Heat, Atoms and Quanta 9 by Kerry Kuehn, which was intended to serve as undergraduate lecture notes in physics. However, neither these nor others have attempted a comprehensive overview of a focused body of literature endorsed by a group of experts and accompanied by a discussion of the importance of each entry.
In the present case, the expert contributors were selected from editorial boards of prominent journals in the field of analytical atomic spectrometry, award recipients, and invited lecturers at important international conferences; they were chosen to cover major areas of research and to provide a broad geographical distribution. The target audience includes students, practitioners, scholars, and experts in analytical atomic spectrometry and its application areas. However, several topics have been specifically and intentionally omitted, especially applications of atomic methods. We feel that applications cover such a broad and individually specialized range that they (in fact, perhaps each of them) deserve their own similar coverage. Instead, we focus here on fundamentals and instrumentation development in atomic spectrometry. Moreover, to produce a work of tractable length, we have arbitrarily limited coverage mainly to truly atomic methods, in which atoms are separated one from the other and can thereby be simply probed by readily accessible optical methods or mass spectrometry (MS). This decision necessarily eliminates such important methods as X-ray fluorescence spectrometry, neutron activation analysis, and ion-beam techniques such as secondary-ion MS. Other methods were omitted somewhat arbitrarily and include spark-source MS and thermal ionization MS; they appear to have their own following and individually large bodies of literature. Again, we hope that other scientists might find the example here useful and prepare similar coverages of these other focus areas.
Methodology
Expert contributors were invited from among those whose primary achievements have been in the areas of fundamental and instrumental analytical atomic spectrometry. Each was asked to provide a list of between 12 and 48 landmark papers of their own choice, and each nominated paper was to be accompanied by a brief narrative that underscores the key learning or teaching points of the entry. Topics were completely flexible and might be theory, historical development, fundamental studies and characterization, instrumentation, spectrochemical techniques or tricks, common but often overlooked mistakes and experimental precautions, philosophy in spectrochemical analysis, and any other relevant topics. Although papers representing breakthroughs or paradigm shifts would naturally be included, also welcome were citations of work that revealed new insights, clever methods, and ingenious instrument designs. Where appropriate, personal anecdotes were offered and accepted.
In a few cases, the original literature was in a language other than English. In such situations and wherever possible, both the original paper and a translation are cited.
These contributions were then compiled according to topic and focus, and narratives from the respective contributors were woven together to provide what we hope is a comprehensive discussion of the key point(s) of each entry. Because of expected overlap among narratives from multiple authors, some narratives were combined or abbreviated, with every effort made to capture the tone and meaning of each contributor's comments. In cases where the significance of an entry was not clear, the original contributors were contacted to expand or clarify the submitted narrative or to justify the submission; this conventional journal review process served to hone the compilation to include only truly landmark papers. This draft compilation was then submitted to all contributing authors who served as a final review body; again, important comments resulted in an improved final version.
Because a large number of authors contributed to the final collection, their names have been listed alphabetically in the author list. An indication of the magnitude of each author's effort can be gauged by reading the final compilation.
Overview of Compilation
Organization of the compilation should be apparent from a glance at the Table of Contents. Historical papers are covered first, followed by work involving fundamental concepts and analytical figures of merit. A section on data handling and processing then precedes basic studies on spectrophysics and plasma physics. Publications describing optical and spectrometric tricks are next, combined with those on novel spectroscopic instrumentation. Several subsequent sections deal with specific methods: arc and high-voltage spark spectroscopy, flame and furnace atomic absorption, inductively coupled plasma emission and MS, glow discharge (GD) spectrometry, microwave-induced plasmas (MIPs), laser-based measurements (including atomic fluorescence, laser-enhanced ionization, laser-induced breakdown methods, and laser microprobe MS), and optical isotope analysis. A separate section is included on sample-introduction methods and studies, covering nebulizers, electrothermal vaporizers, chemical and plasma-assisted vapor generation, laser ablation (LA), and others. The coverage closes with a special section on viewpoints, perspectives, and philosophical discussions and another on reminiscences and tributes to prominent figures in analytical atomic spectrometry.
A list of abbreviations can be found in the Glossary. In the original literature, different terms are sometimes used interchangeably to refer to the same concept. For instance, “limit of quantitation (LOQ)” and “limit of quantification”, as well as “inductively coupled plasma–atomic emission spectrometry” and “inductively coupled plasma–optical emission spectrometry”, are commonly encountered. Initially, we retained the terminologies used in the narratives provided by our respondents, showcasing the diversity of language employed by researchers in the field and reflecting the broader literature. This approach not only demonstrated the disparity in scientific vocabulary but also underscored the absence of complete consensus, even in seemingly basic notions such as terminology.
However, during the internal peer-review phase of this project, we received feedback suggesting that inconsistent terminologies or abbreviations used by different contributors to describe the same concept could lead to confusion. Given that the primary purpose of this compilation is educational, our priority shifted toward minimizing confusion and enhancing overall coherence. Consequently, we made the decision to standardize the terms and abbreviations.
In cases where multiple terms referred to the same concept, we generally adopted the term that appeared most frequently in the titles of our list of key papers. Accordingly, “limit of quantitation” and “inductively coupled plasma–atomic emission spectrometry” were selected for the aforementioned examples. In a specific scenario where both “laser-excited atomic fluorescence spectrometry” and “laser-induced fluorescence” were used, we opted for the latter due to its brevity and broader applicability.
It is also pertinent to address our use of hyphens (-) and “en dashes” (–) in abbreviations. To clarify, an “en dash” is employed to denote the conjunction of different components or techniques used in tandem, as exemplified by “inductively coupled plasma mass spectrometry (ICP–MS)”, where the atomization and ionization source, ICP, is used in tandem with a mass spectrometer. An “en dash” is also utilized to combine names of multiple inventors, such as “Saha–Boltzmann plot”. Conversely, a hyphen signifies a modifier, such as in “time-of-flight mass spectrometry (TOF-MS)”. Consequently, it is possible for both the “en dash” and hyphen to appear within an abbreviation. Furthermore, we opted to position the modifier as closely as feasible to the subject. Thus, it is “ICP–TOF-MS”, not “TOF-ICP–MS”. The foregoing protocol applies, of course, to the narrative portion of this compilation and not to the cited literature; for the latter, the original wording is retained.
Readers should note that, in all sections, not all cited references are key papers but only those that are listed in the sub-section headers; the remaining papers are considered supplementary and contain additional information or support the points raised in the narratives of the key papers. Supplementary citations can be found in the complete bibliography at the end of the compilation.
In the final compilation, a total of 1055 articles were included that were suggested by 48 researchers as key publications. It is natural to analyze the temporal distribution of when these articles appeared (see Figure 1). Overall, it appears that the field of analytical atomic spectrometry experienced a slow rise until ca. 1950, after which there was a rapid acceleration, a peak between 1980 and 2000, and then a precipitous decline. Lest this decline be of concern, it is reasonable to assume that contributors were reluctant to nominate publications that appeared in recent years, since the impact of those later papers cannot yet be accurately gauged. This reasoning is supported by the observation that the final compilation displays a consensus among contributors for “key” papers that have several decades of history, whereas there is a general lack of consensus on topics that are rather new or still under vigorous development.
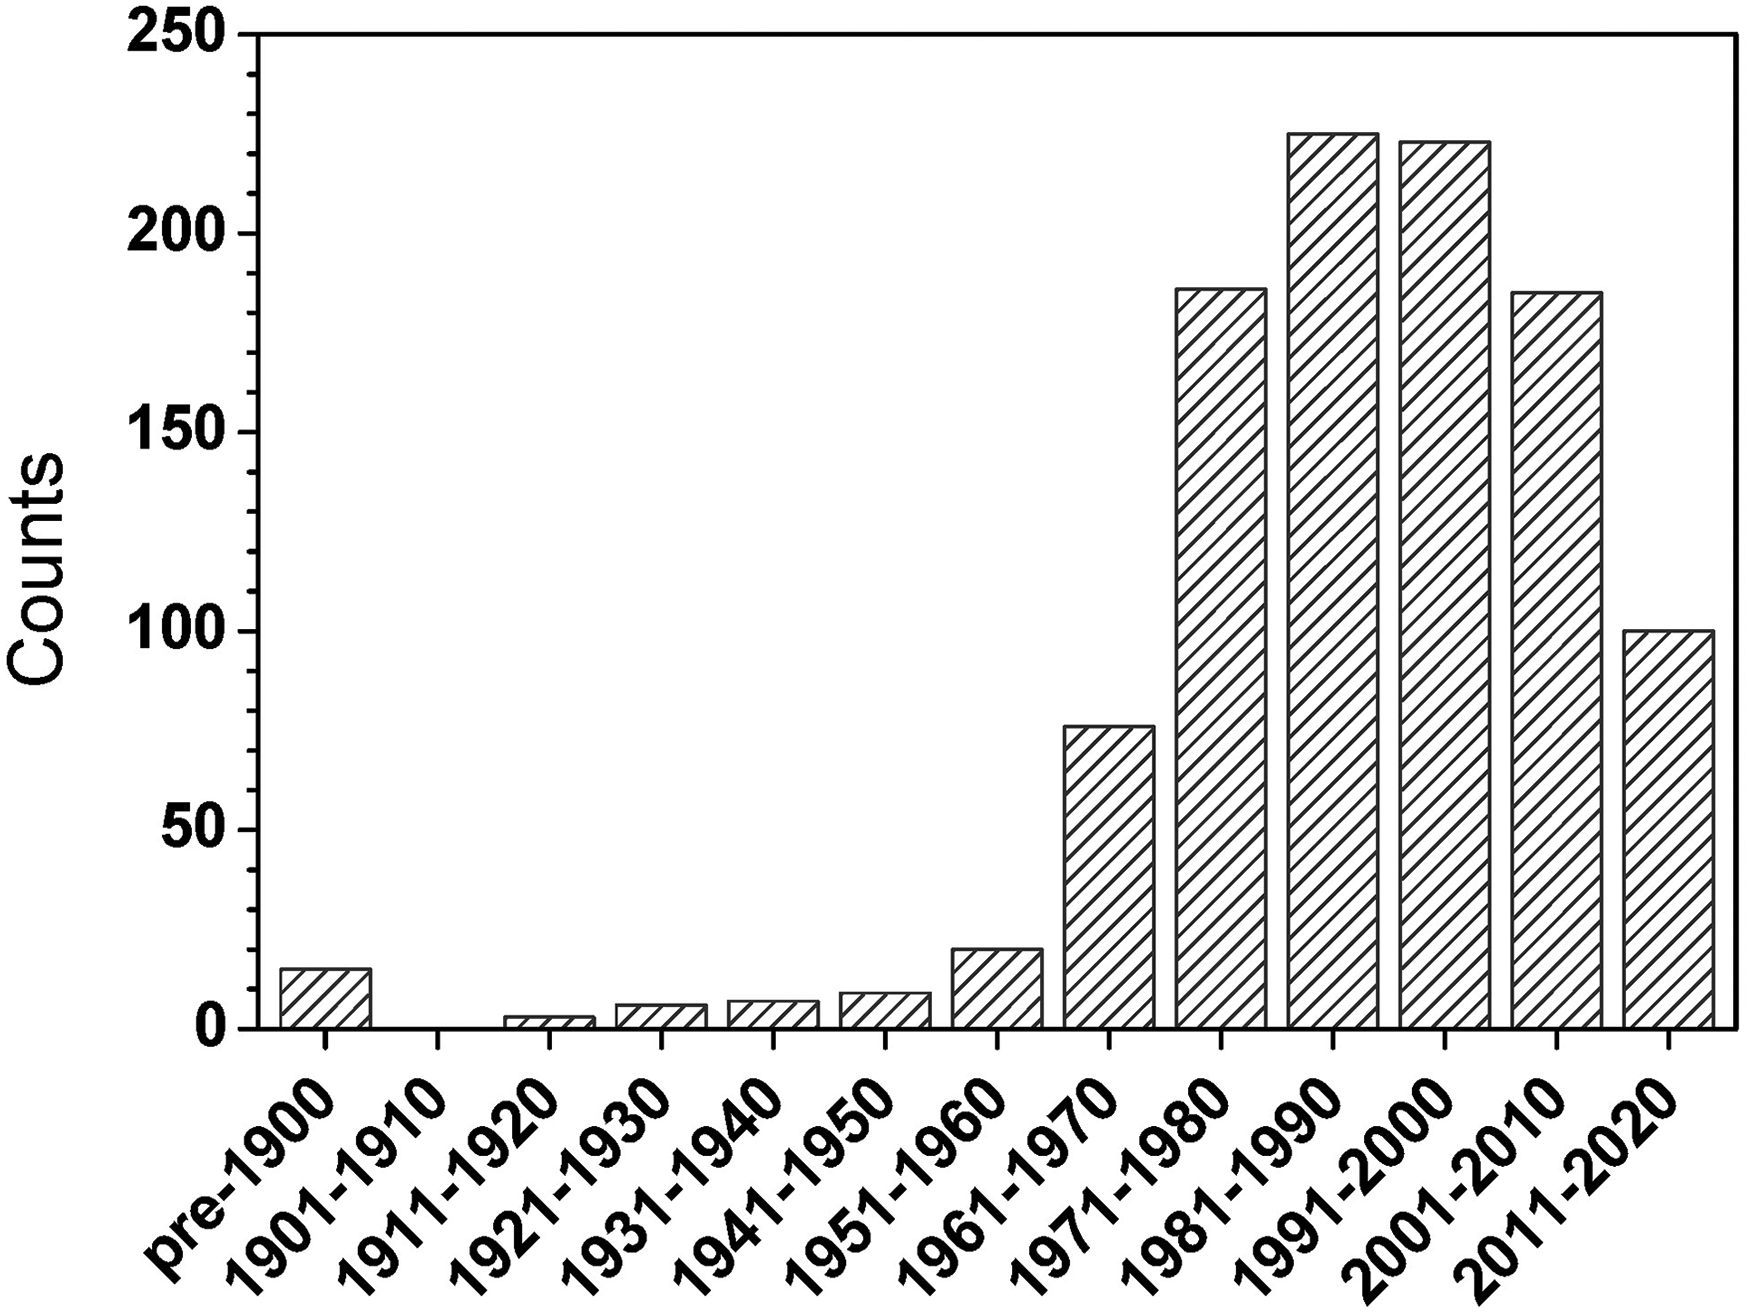
Histogram of the publication years of all cited key articles.
Still, relatively few cited key papers have publication dates before 1950. This finding might mean that the most important work in atomic spectrometry occurred after 1950, but it might also mean that some respondents are regrettably not particularly knowledgeable about critical events that shaped the foundation of their scientific field, underscoring the value of the current compilation. The problem has long been apparent. William Meggers, Chief (1920–1958) of the spectroscopy section of the US National Bureau of Standards (NBS) and often known as the Dean of American Spectroscopists, once commented, “It appears that the applied spectroscopists (excluding astrophysicists) have scarcely taken any notice of the great advances in knowledge concerning the origin and interpretation of atomic spectra which the fundamental spectroscopists brought forth in the period of decline of spectrochemical analysis, 1885 to 1925.” 10 Likewise, to paraphrase Nobel-Prize recipient Sydney Brenner, “[Some young scientists] divide history into two epochs: the past 2 years and everything else before that, where Archimedes, Newton, Darwin, Mendel…inhabit a time-compressed universe as uneasy contemporaries.”
In Figure 1, the number of key articles rises rapidly with year of publication between 1951 and 1990. Indeed, between 1951 and 1980, the number of articles more than doubles each decade. The number of key articles then holds relatively steady for the three decades between 1981 and 2010. There are several reasons for this behavior. The tremendous boom in citations in the decades of the 1960s and 1970s is no doubt due to the explosive growth in fundamental work and instrument development that took place in the field of atomic absorption following the seminal publication by Alan Walsh in 1955 and boosted by the introduction of viable inductively coupled plasma−atomic emission spectrometry (ICP–AES) by Velmer Fassel and Stan Greenfield in 1964–1965, by the invention of the Grimm GD in 1968 and by the dramatic rise in enthusiasm for atomic fluorescence, propelled by Jim Winefordner, Kees Alkemade, and others. Similarly, the publication peak from 1981 to 1990 is to a large degree attributable to the same sort of developments that occurred in inductively coupled plasma MS (ICP–MS) after the historic publication by Sam Houk and Velmer Fassel in 1980. As mentioned earlier, the modest decline in landmark publication rate after this latter peak is likely the result of under-reporting of recent work and an upsurge in enthusiasm in the rediscovery of laser-induced breakdown spectroscopy (LIBS). These explanations are consistent with a similar plot of the most cited (defined as receiving four or more independent citations) key papers over this same period (see Figure 2).
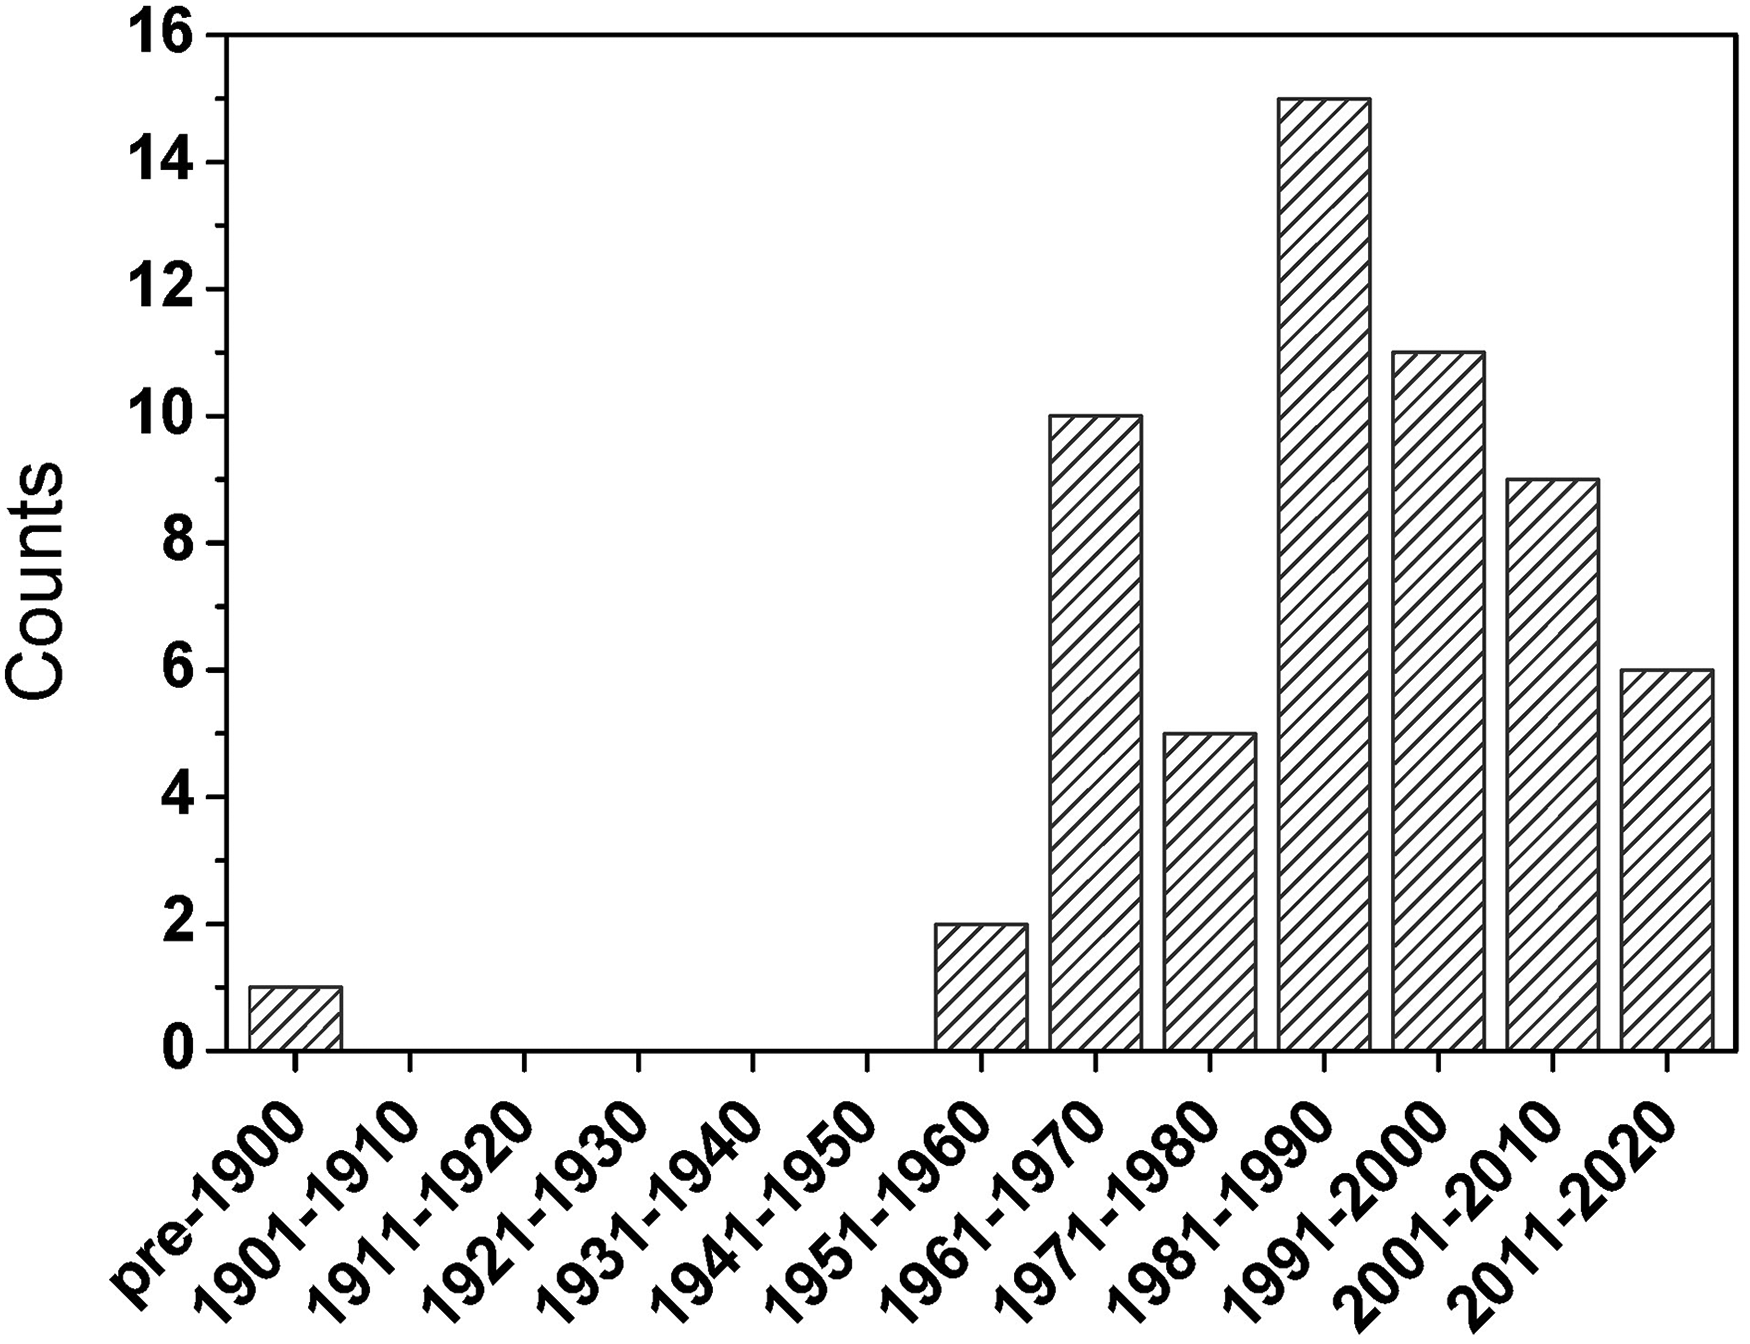
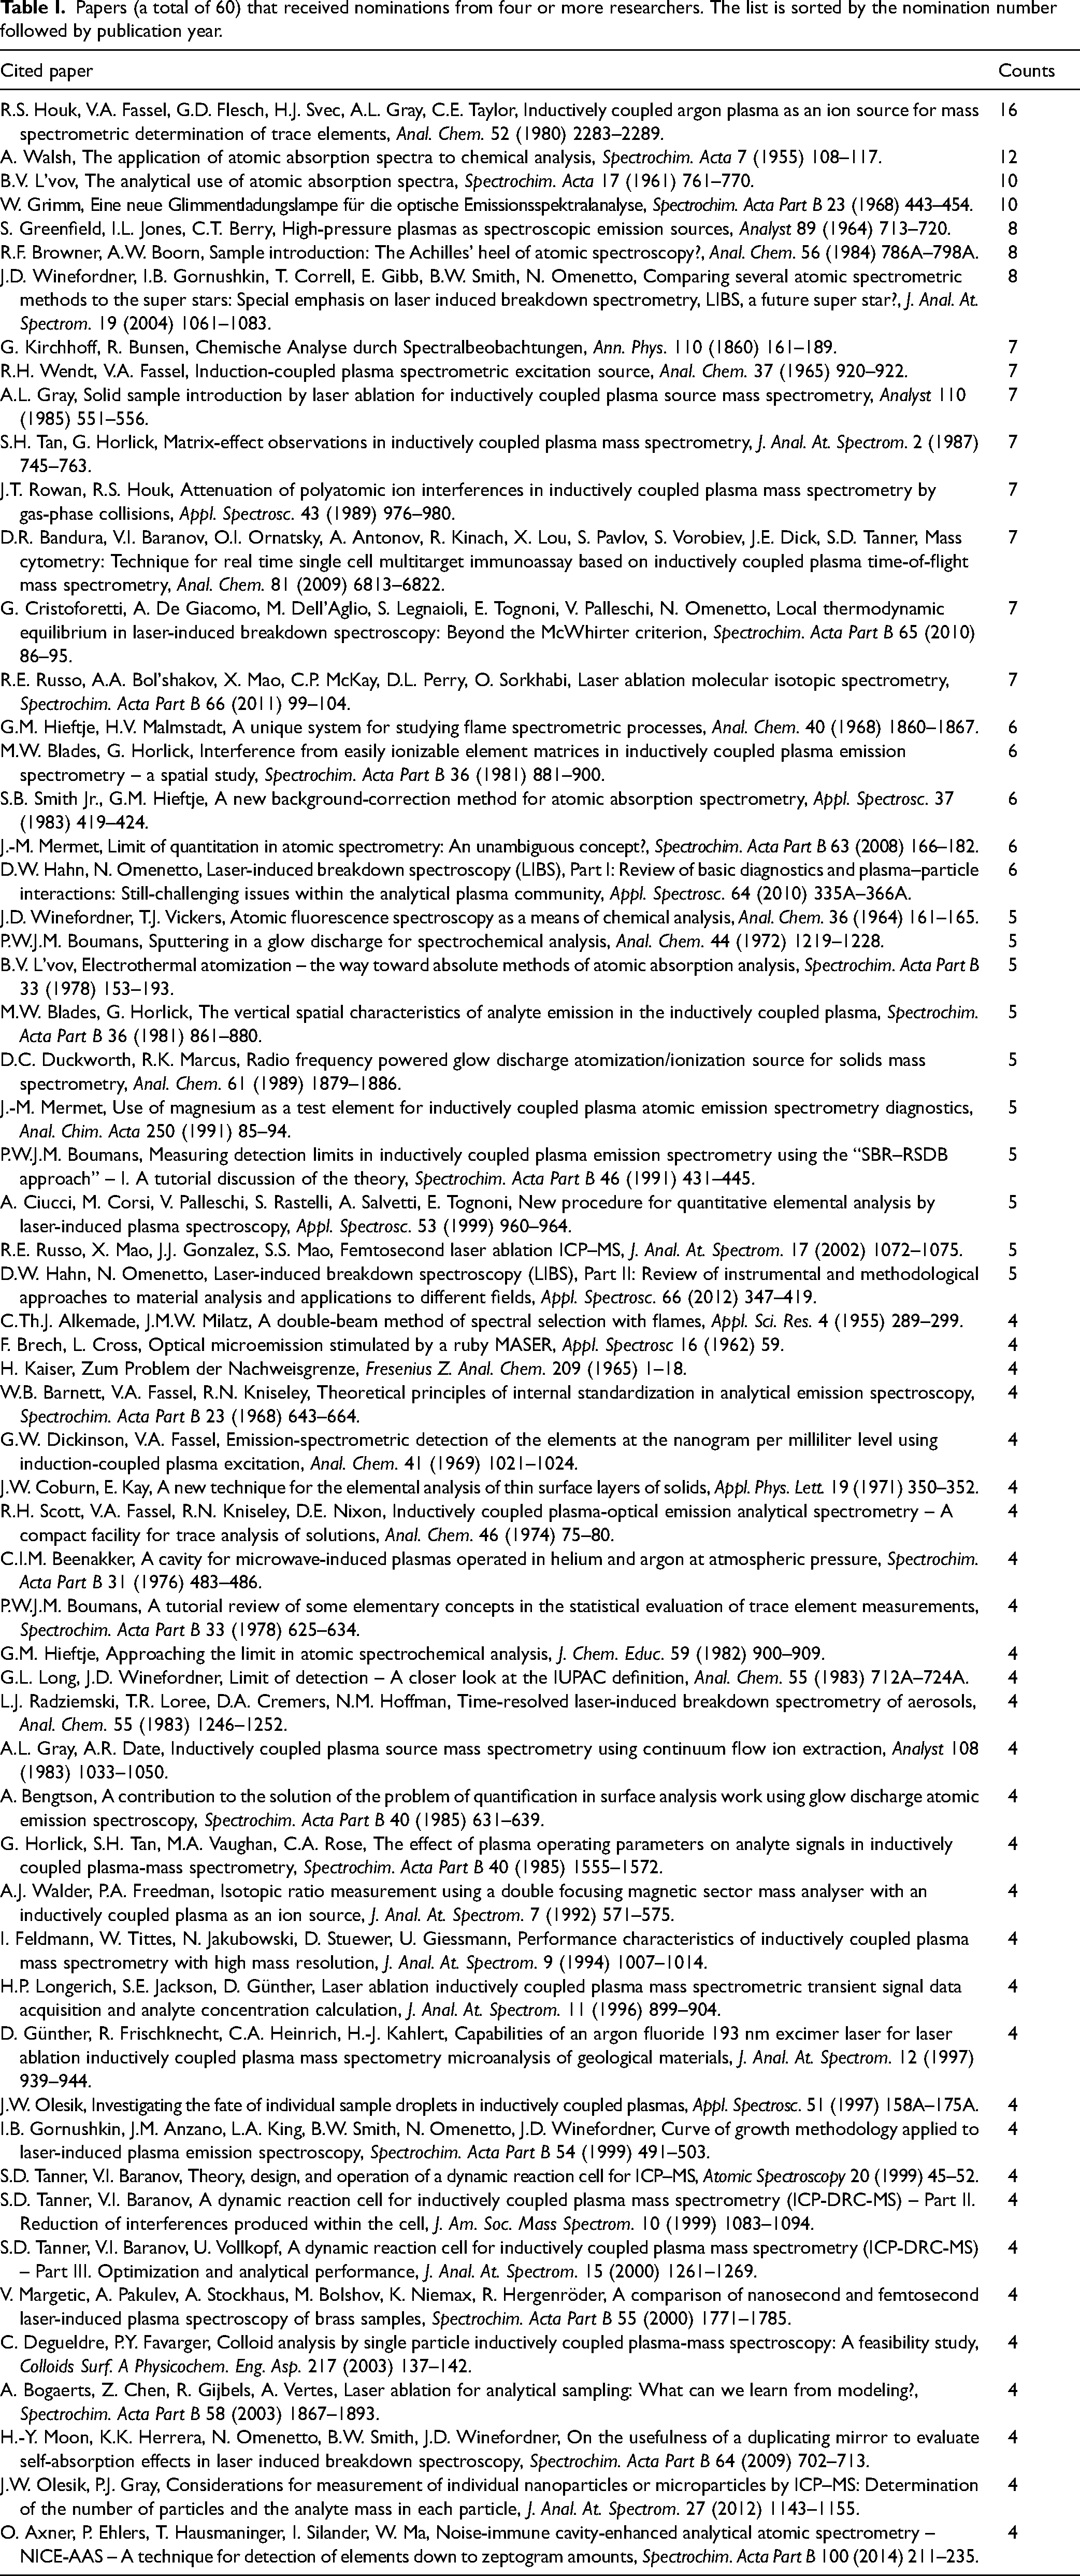
Histogram of the publication year of key articles that received nominations from four or more individual scientists. Overall, the general shape of the distribution resembles that of the total number of cited key papers (see Figure 1). However, this more focused distribution simplifies correlation with specific events (see text for details). The specific papers that make up this most-significant collection are listed in Table I. Interestingly, the only publication in this list before 1951 is the classic one in 1860 by Kirchhoff and Bunsen describing the successful use of flame-emission spectrometry for quantitative metal analysis.
Papers (a total of 60) that received nominations from four or more researchers. The list is sorted by the nomination number followed by publication year.
The histogram in Figure 3 is similar to that of Figure 2, but the data are recast in the form of percentages (fraction of cited key papers that received four or more nominations), which underscore the importance of truly classic papers (i.e., classic papers remain classic). Clearer in Figure 3 is the lasting impact of the path-breaking (pre-1900) work by Kirchhoff and Bunsen and the flurry of publications spawned by the introduction of atomic absorption spectrometry (AAS), inductively coupled plasma, and the Grimm-type GD for direct solids analysis in the period from 1951 to 1970. This plot also more clearly displays the tendency for active researchers in the field to regard recent developments (e.g., in LIBS) as being equal in importance to most that came before.
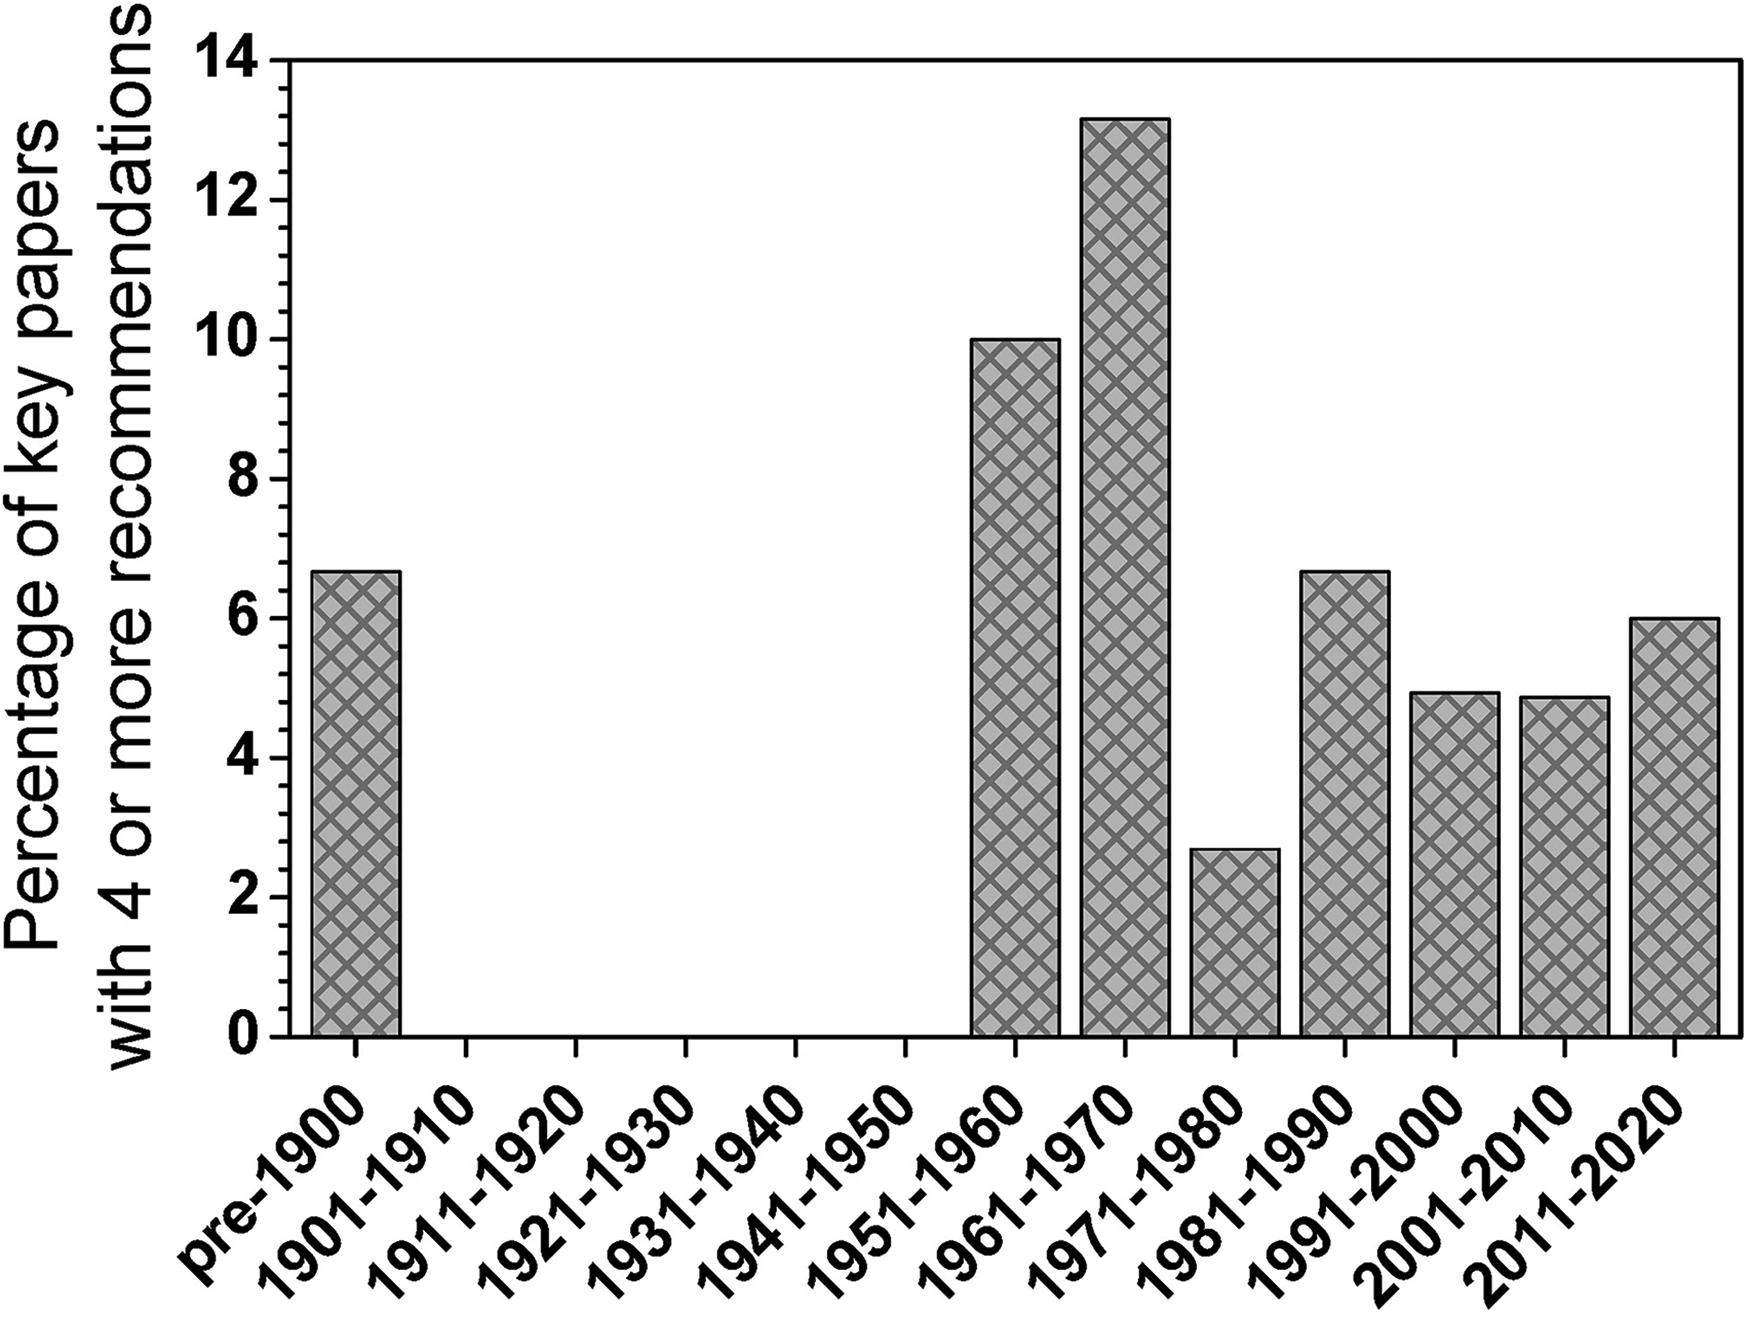
Histogram showing the percentage of nominated papers that were cited by four or more nominators. The data for this plot were the same as those used for Figure 2, but are recast as a percentage rather than an absolute number. This display reveals more clearly that truly landmark publications are widely recognized. In particular, the Kirchhoff–Bunsen paper before 1900 is recognized as establishing the foundations of analytical atomic spectrometry, while those from 1951 to 1970 reveal the ongoing impact of developments in atomic absorption, ICP, and the Grimm-type glow discharge.
Another useful bit of information that can be derived from the final compilation is the literature source of the key papers. As shown in Figure 4, key papers have been published in a broad range of journals, from the most focused (i.e., Spectrochimica Acta Part B and Journal of Analytical Atomic Spectrometry) to those emphasizing spectroscopy (i.e., Applied Spectroscopy, Journal of the Optical Society of America, and Applied Optics), analytical chemistry (i.e., Analytical Chemistry, Fresenius’ Journal of Analytical Chemistry, Analyst, and Analytica Chimica Acta) and MS (Journal of the American Society for Mass Spectrometry). The heaviest concentration, however, has been in those journals emphasizing atomic spectrometry and analytical chemistry. Overall, the message for scientists who specialize in analytical atomic spectrometry is that they can stay relatively current in the most important literature by perusing the tables of contents of only a half dozen or so journals.
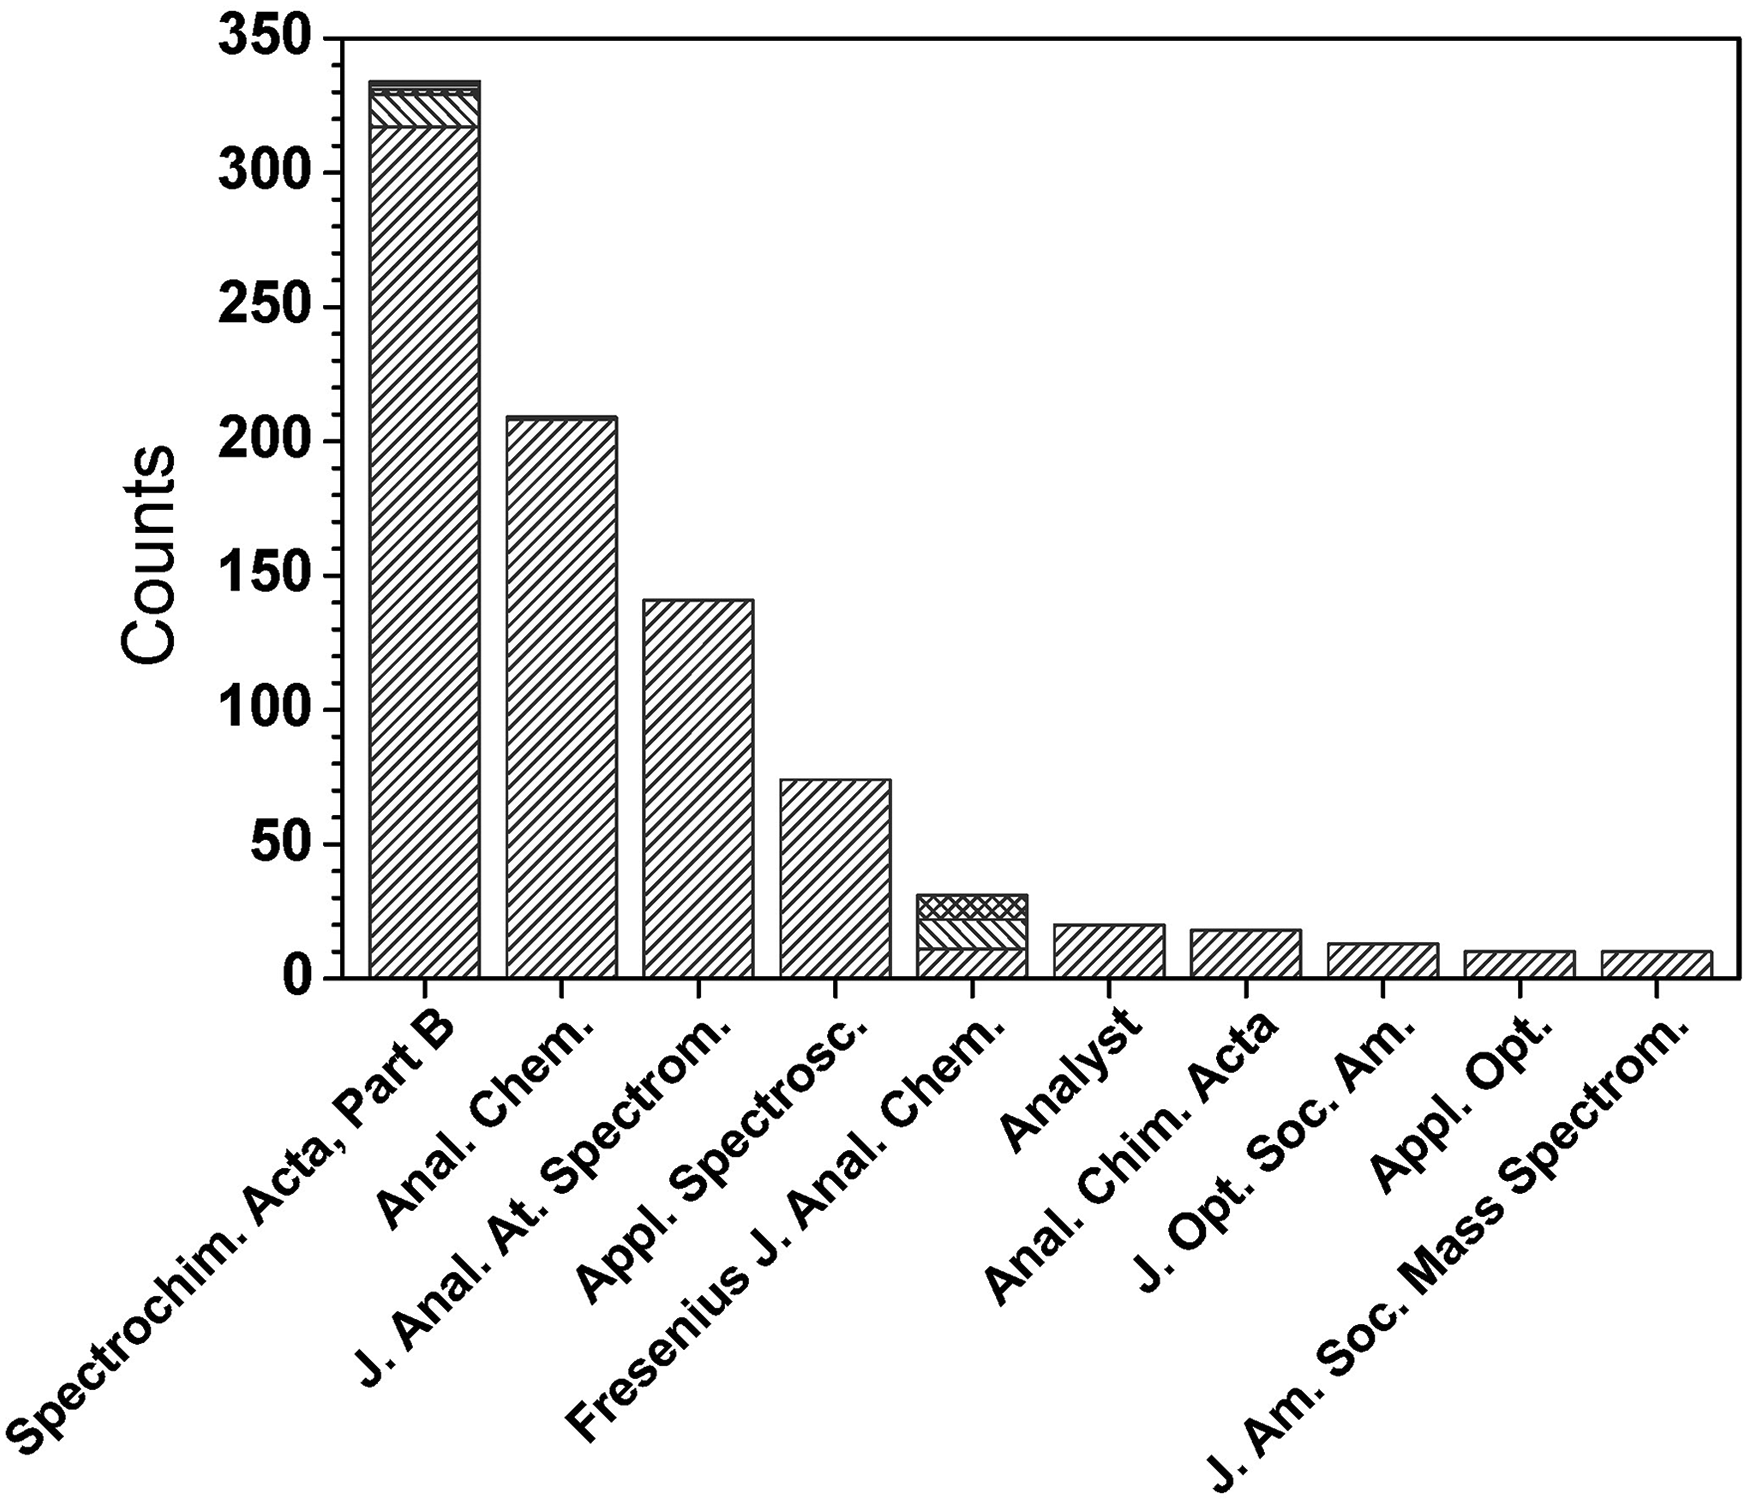
Histogram showing the distribution of the top 10 journals in which cited key papers were published. For journals that were merged with others or had a name change in their publication history, all are counted under a single name. In this case, the name with the highest count is displayed in the figure. For Spectrochim. Acta, Part B, its predecessors Spectrochim. Acta (with 12 counts), Spectrochim. Acta, Part A (split from Spectrochim. Acta, two counts), Spectrochim. Acta Rev. (two counts), and Prog. Anal. At. Spectrosc. (one count) are included. For Anal. Chem., its predecessor Ind. Eng. Chem., Anal. Ed. (one count) is included. For Fresenius’ J. Anal. Chem., its predecessor Fresenius’ Zeitschrift für Analytische Chemie (11 counts) and successor Analytical and Bioanalytical Chemistry (nine counts) are combined. Overall, 71.8% of all cited key papers were published in one of the four top journals.
Additional insight can be gleaned by examining the distribution of key papers among the subjects or sub-sections of this compilation (see Figure 5). The pie chart in Figure 5a suggests that sample introduction is viewed as the area with the highest degree of innovation (i.e., the greatest number of key publications). However, the pie chart in Figure 5b shows that there is greater agreement on outstanding papers (those cited by at least four respondents) on the subject of ICP–MS (10 papers); ICP–AES, LIBS, and sample introduction have seven papers each. Of course, one must be cautious about over-interpretation of Figure 5b, which could be compromised by the statistics of small numbers.
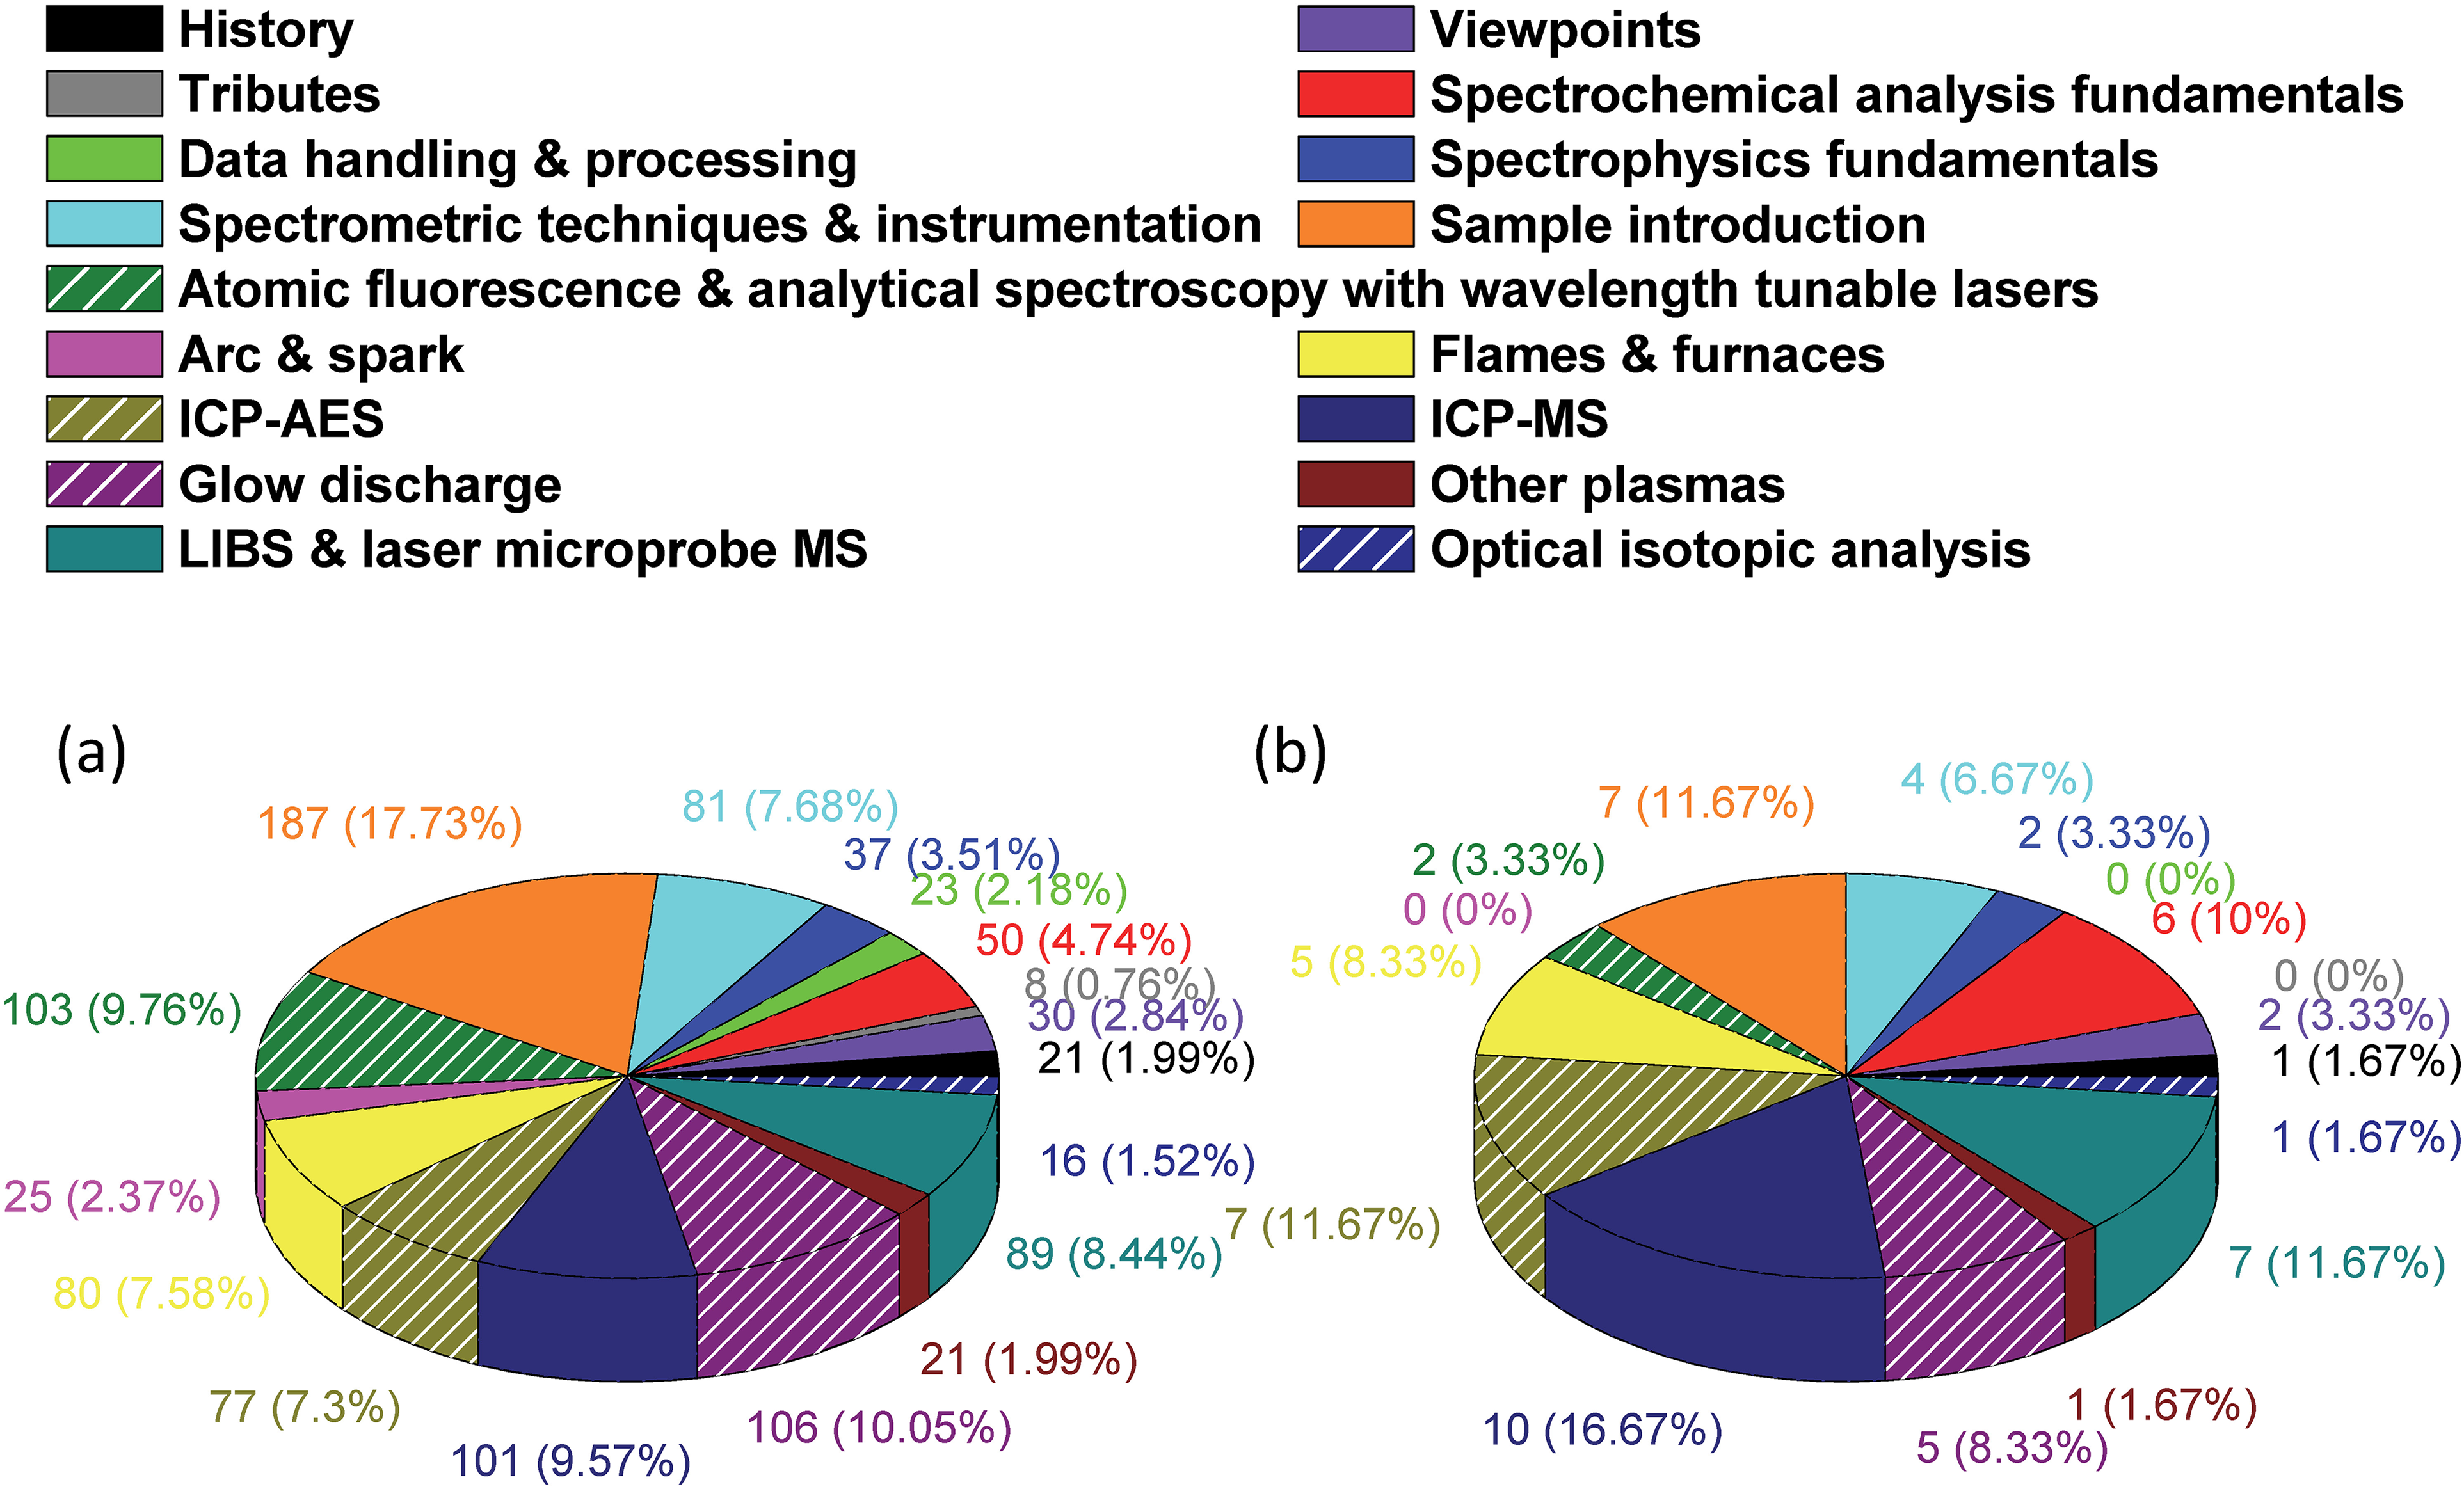
Pie chart showing the distribution of (a) all the cited key papers, and (b) papers that were cited by four or more nominators among the 17 topics covered in this compilation.
It is reassuring to witness the balance among cited key papers that represent alternative methods of spectrochemical analysis. Figure 5a shows that GDs (106 citations), tunable-laser-based atomic fluorescence spectrometry (AFS) and AAS (103 citations), ICP–MS (101 citations), LIBS (89 citations), flames and furnaces (mainly AAS, with 80 citations), and ICP–AES (77 citations) all have enjoyed strong and widely recognized development. Only progress in arc and spark spectroscopy appears relatively unrecognized, with merely 25 citations. One can only assume that this small number is due to the likelihood that these widely used, highly successful workhorse methods no longer have the attention of many modern researchers, who are perhaps not aware of the exceptional innovations that led to the success of these methods.
The time of appearance of these key papers, sorted according to subject, provides further detail. Figure 6a displays a sorting according to the spectrometric method, while Figure 6b includes key papers involving other, more generic topics.
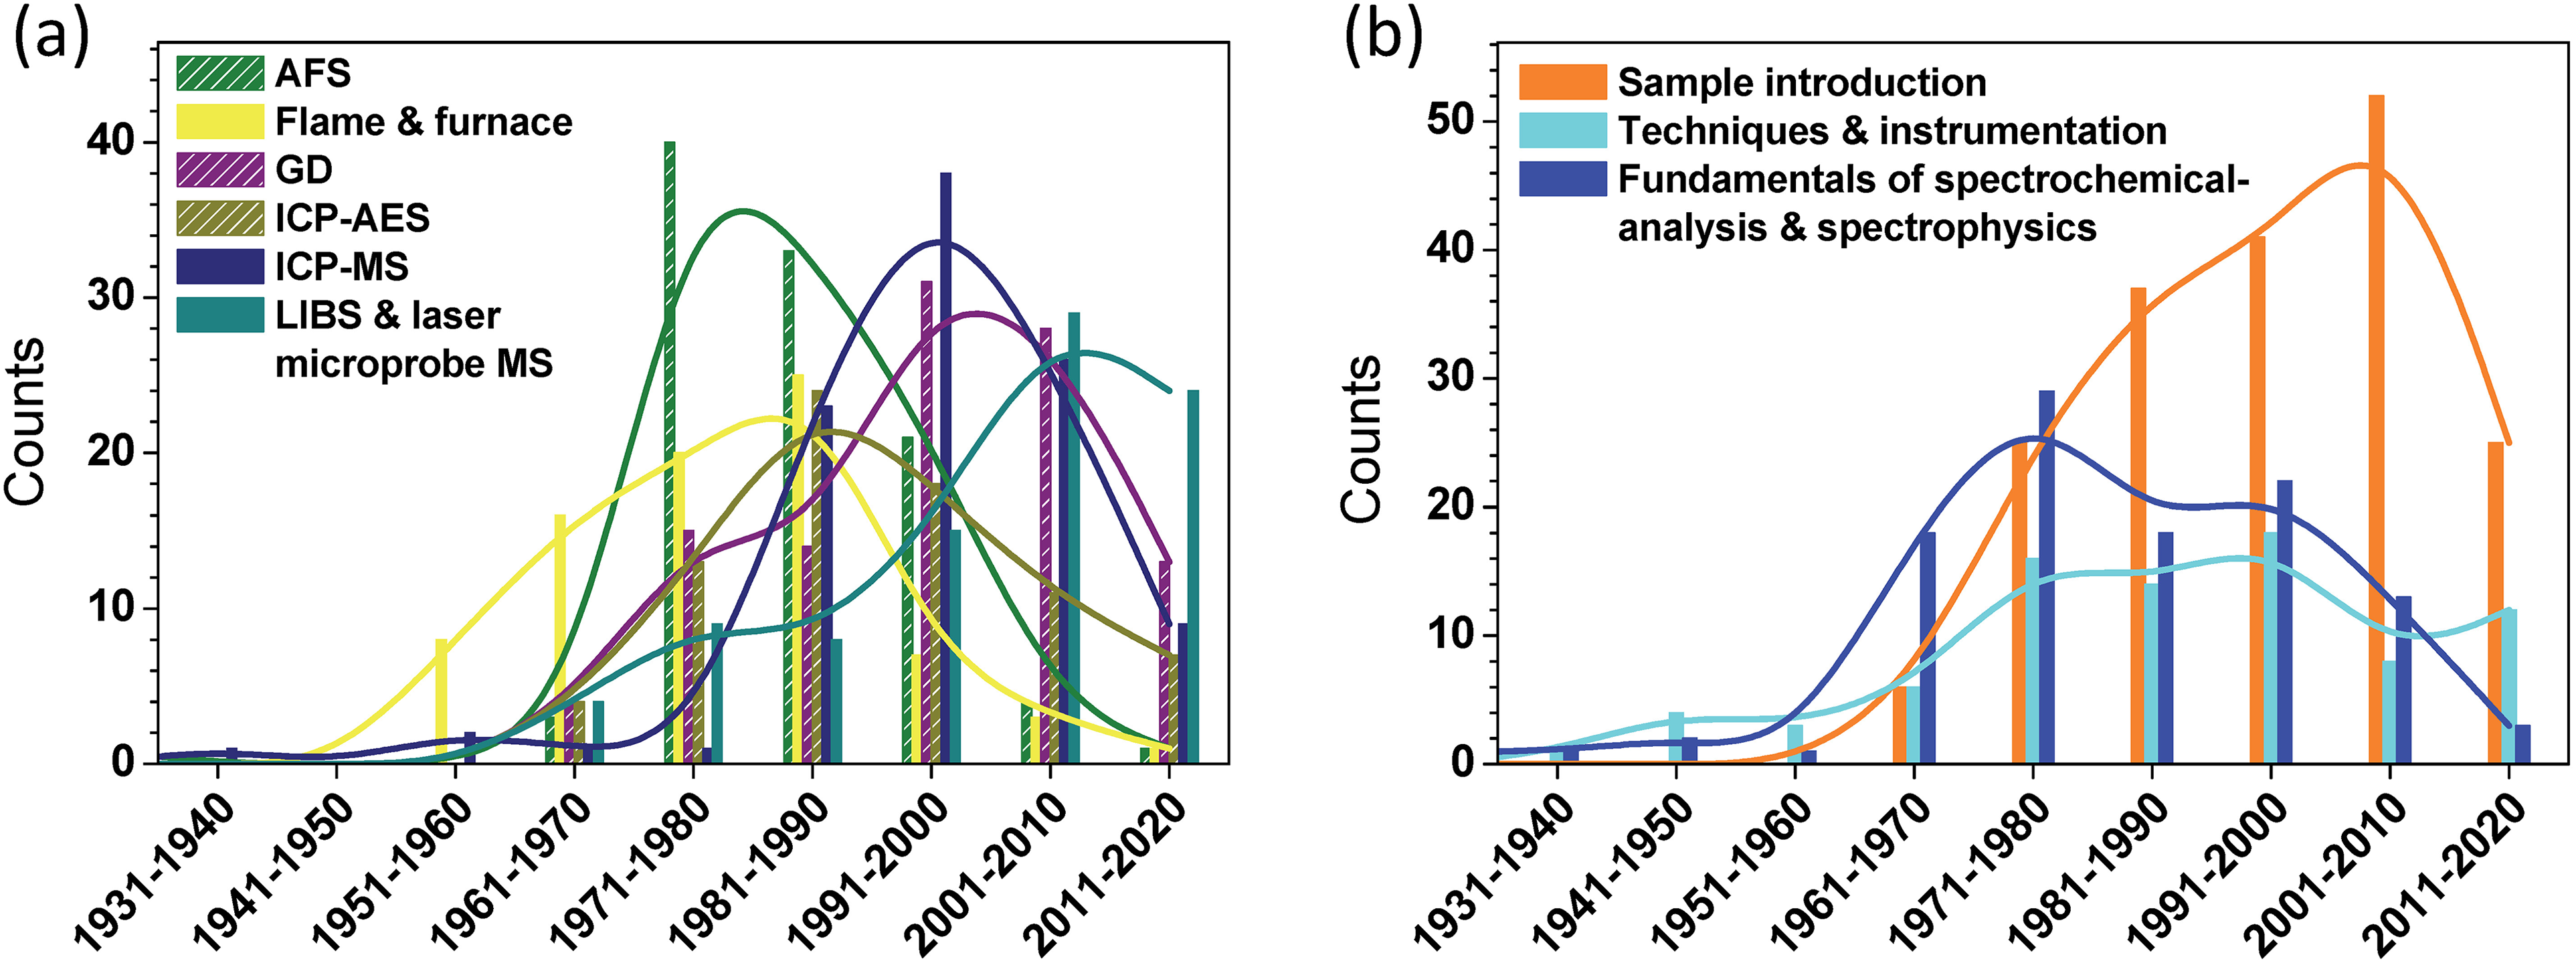
Histogram of the publication years of key articles on (a) the top six most-cited spectrochemical analysis techniques (i.e., atomic fluorescence spectrometry, flame and furnace, glow discharge, ICP–AES, ICP–MS, and LIBS), and (b) generic topics related to spectrochemical analysis (i.e., sample introduction, general spectrometric techniques and instrumentation, and fundamental theory). The lines show the smoothed trend of the distributions by means of a basis-spline function.
Particularly striking in Figure 6a is the dramatic but relatively brief impact of atomic fluorescence. From 1970 to 1990, it dominated the number of papers having lasting effects. That dominance waned during the 1990s, and all but disappeared thereafter. No doubt the rise in prominence of other methods had a strong influence on this trend, but the always-promised but never-delivered existence of low-cost, narrow-band, rapidly tunable monochromatic lasers was also responsible.
Somewhat similar behavior is apparent for most other atomic techniques, including AAS, ICP–AES, and ICP–MS. Clearly, these now-mature methods, despite being very widely used, did not enjoy the degree of innovation in recent years as they once did. Only GDs and LIBS appear to have escaped this pattern. Glows, perhaps the most versatile analytical sources, have retained their impact perhaps because of the many forms they can take, especially when operated at atmospheric pressure, one of the clear recent literature trends. Having been rediscovered relatively recently, LIBS is still riding a wave of newly recognized, characterized, and exploited features.
Prominent in Figure 6b is the climb in numbers of key papers that deal with sample-introduction methods and fundamental discoveries, a trend that lasted until the most recent full decade. As was mentioned earlier, the decline during this last period is likely due to under-reporting of recent publications because of the uncertainty of their lasting impact. The long-term (ca. 1940–2010) monotonic rise in key papers in this area is attributable to an ongoing series of: (1) new discoveries and inventions, such as LA, vapor generation, and novel solution nebulization, (2) improved characterization and understanding of processes involved in each of these techniques, and (3) application demands, including solid sampling, microscale and nanoscale measurements, elemental mapping, and chemical speciation.
In contrast, the number of key papers that describe fundamental work has remained rather steady from 1961 to 2010, whereas those involving novel techniques and instrumental innovation have not changed greatly over the period from 1971 to 2010. This stability in both of these highly important areas bodes well for the continuing health of spectrochemical analysis and is a particularly welcome finding of this study.
– George Chan – Gary Hieftje – Nicoló Omenetto
Colored-light composition of daylight spectrum – Newton, 11 Philos. Trans. Royal Soc., 6 (1671) 3075–3087
As noted by Elisabetta Tognoni, “The above letter 11 is considered as the original historical description of how the observation of the daylight spectrum obtained by means of a prism led Newton to understand the different response of various colors to refraction, introducing for the first time the concept of dispersion. From a didactical point of view, the letter 11 is interesting in that it reveals the reasoning behind the statement of a new finding: several possible interpretations of the unexpectedly observed phenomenon are proposed, discussed and rejected, until an additional experiment (the experimentum crucis, based on two subsequent refractive steps) was eventually able to clear any doubt. Additionally, there are also plenty of curious notes inside this letter. 11 For example, Newton describes his initial suspicion that light rays may behave like a tennis ball when struck with an oblique racquet (then he demonstrates that it was not the case). Later, after having realized that wavelength dispersion will intrinsically limit the quality of glass telescopes, he proposes a brilliant solution to the problem: the reflecting telescope, now called a Newtonian telescope. A final note: the letter mentions the ‘plague’ that forced Newton from the college in Cambridge (academic activities were suspended around 1666): this sounds to us topical, considering ongoing concerns about pandemics. While I had the occasion to read this letter 11 for the first time a few years ago, I believe readings like this one would be beneficial for scientific classes, similarly to the way texts by Homer, Julius Caesar, Shakespeare or other giants of the past are proposed in the context of literary disciplines.”
Fraunhofer dark lines – Fraunhofer, 12 Denkschriften der Königlichen Akademie der Wissenschaften zu München für die Jahre 1814 und 1815, 5 (1817) 193–226
Paul Farnsworth recommended this article and noted, “One could get carried away with historical papers, but I include this one 12 primarily for a single figure, which I consider to be the most elegant illustration that I have encountered in the scientific literature. Figure 11 in the paper 12 is an incredibly detailed drawing of the solar spectrum. The monochrome figure is poorly reproduced in the Google ebook reproduction of the journal, but a full color version can be found in a document published by the Fraunhofer Society. 13 ” The original German paper was reprinted in Annalen der Physik 14 in 1817. The figure is reproduced here (Figure 7).
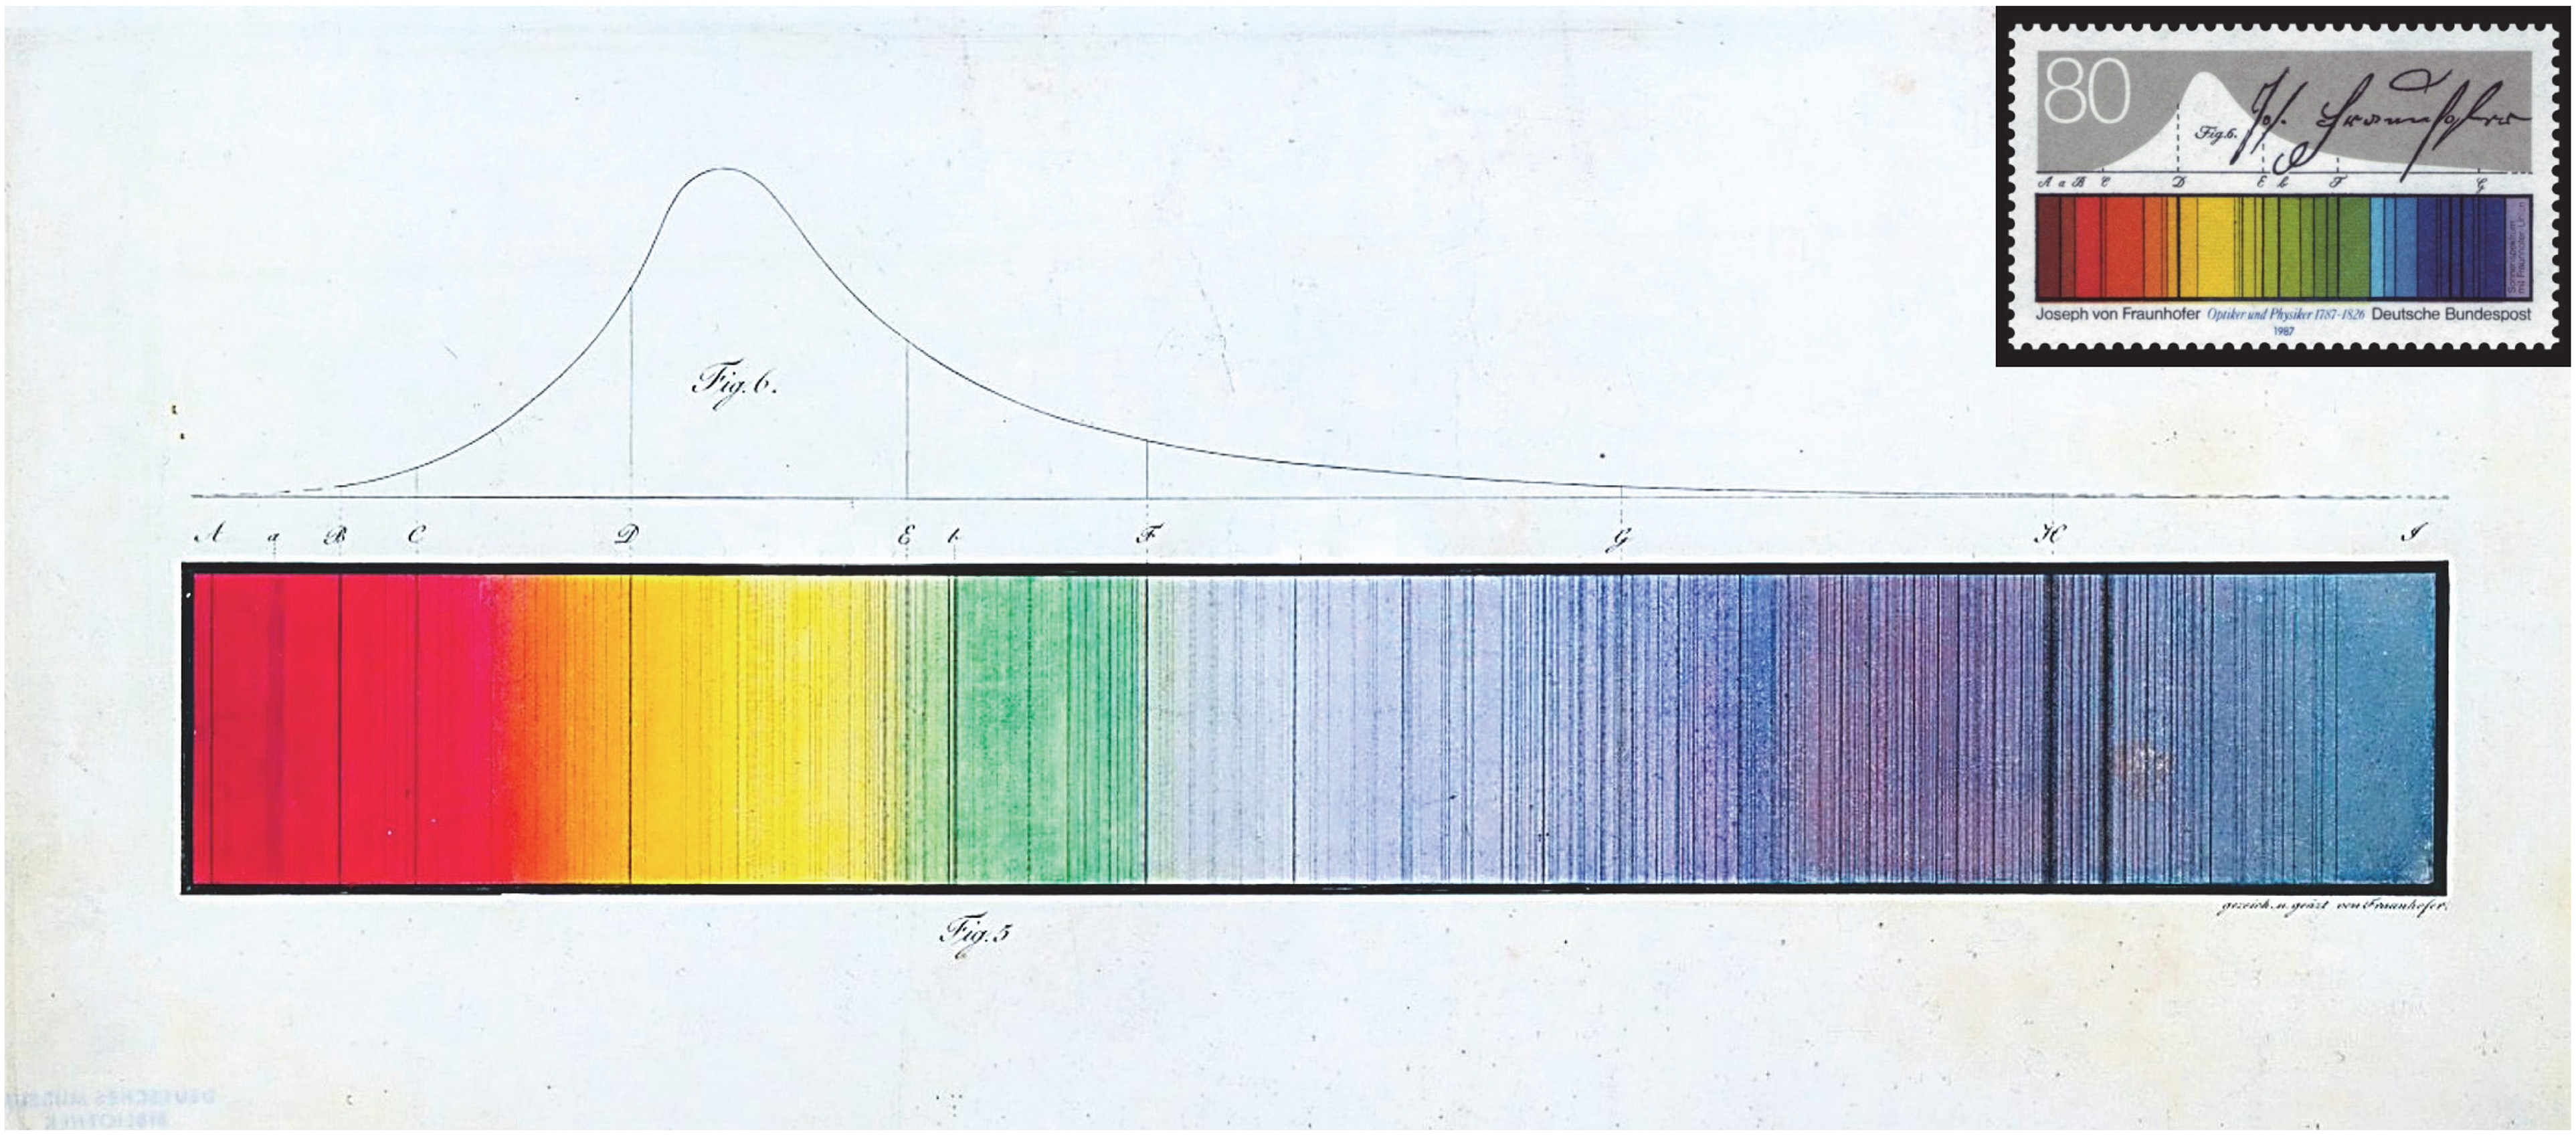
Spectrum of sunlight drawn and colored by Fraunhofer with dark lines named after him (reprinted with permission from Deutsches Museum Munich, Germany). The spectrum appears on the postal stamp issued in 1987 by Deutsche Bundespost to commemorate the 200th anniversary of Fraunhofer's birthday (reprinted with permission from Bundesministerium der Finanzen, Berlin, Germany, and the heirs of Professor Ernst Kößlinger, Munich, Germany, who designed the stamp. For copyright reasons, permission must be obtained to use the image. Please address all questions regarding the use of the postal stamp image to LB5@bmf.bund.de).
Benjamin Smith shared Farnsworth's views and added, “Published in two parts,15,16 this is the most accessible and the first English translation of Fraunhofer's seminal work on spectroscopy which he first published in the Denkschriften der Königlichen Akademie der Wissenschaften zu München für die Jahre 1814 und 1815, published in 1817. 12 A skilled glassmaker, Fraunhofer was in need of a method by which to measure the refractive index at specific points in the spectrum so that he could produce optimal glasses for achromatic lenses. He tried various filters and light sources without much success and then examined the solar spectrum with a spectroscope of his own design, the first such instrument. He recorded a total of 574 dark lines which he proved to be fixed within the solar spectrum. He chose 7 of them as reference points, Fraunhofer lines B–H, and used them to measure the dispersion of many different glasses and liquids. His data for water, recorded to seven significant figures, shows a systematic error of only a few hundred parts-per-million relative to the best modern data. He studied the spectra of Venus and Sirius and observed that Venus was identical to the sun while Sirius was very different. He observed that the spectrum of an electric spark was also uniquely different from that of the sun. He devised a method for estimating the intensity by eye using a split image eyepiece and a reference flame. This work, along with that of Kirchhoff and Bunsen in 1860, constitute the two most important spectroscopic contributions of the 19th century.”
Recommended by Michael Webb, who stated, “In a pair of papers,17,18 Talbot proposed the use of atomic emission spectra for qualitative analysis. In the first article, 17 after discussing the link between spectra and the substances being burned, Talbot conjectures ‘a glance at the prismatic spectrum of a flame may show it to contain substances, which it would otherwise require laborious chemical analysis to detect.’ In the second, 18 he notes that ‘… it is difficult to distinguish the lithia red from the strontian red by the unassisted eye. But the prism displays between them the most marked distinction … Hence I hesitate not to say that optical analysis can distinguish the minutest portions of these two substances from each other with as much certainty, if not more, than any other known method.’ In these quotes, Talbot highlights the strength of atomic emission for rapid qualitative analysis, a strength that is still a key to the popularity of modern atomic emission methods.”
Arne Bengtson recommended a meeting abstract by Wheatstone 19 and noted, “In this short abstract, Charles Wheatstone announced for the first time that different metals produced different spectral lines (colors) in an electric spark. There is not much detail in the abstract, no wavelength measurements, but his discovery was indeed an important milestone in the development of analytical spectroscopy. In 1861, many years after the original 1835 meeting, Wheatstone published a full paper 20 with a table of the relative positions of the metallic spectral lines. Rather curious is that the wavelength scale was still described in terms of color rather than units of length.”
On the colors of natural bodies – Brewster, 21 Trans. R. Soc. Edinburgh, 12 (1834) 538–545
Comments from Benjamin Smith on this article are: “David Brewster published during the 1820s and 1830s a dozen important papers on optical and spectroscopic phenomena. This one 21 is exceptional because it includes the very first published molecular absorption spectrum and reminds us that all spectroscopic observations until the late 19th century were visual and richly colorful. The accompanying hand colored plate, ‘shewing the spectrum produced by the green juices of plants’, clearly shows the five expected absorption bands caused by a mixture of chlorophyll a and b, extracted from various plant leaves. Brewster used the sun as a source and includes about 22 Fraunhofer lines as reference points. Although Brewster did not understand the molecular origin of the bands that he observed, it was clear to him that they accounted for the green coloration of the plants since they absorbed most of the solar spectrum except for the green.”
Proposition on absorption and emission are reverse processes of each other – Ångström, 22 K. V. Akad. Handl., 40 (1852) 333–360
As noted by Arne Bengtson, “In this first paper by Ångström on optical spectroscopy, 22 he pointed out that the electric spark yields two superposed spectra, one from the metal of the electrode and the other from the gas in which it passes. He also observed that an incandescent gas emits luminous rays of the same wavelengths as those it can absorb. These findings were another major milestone in the development of analytical spectroscopy. Later, Ångström developed spectrometers capable of determining optical wavelengths with very high precision. 23 His original paper 22 from 1852 was later translated and published in both German 24 and English. 25 ”
The landmark concept of characteristic lines – (a) Kirchhoff and Bunsen, 26 Ann. Phys., 110 (1860) 161–189; (b) Kirchhoff and Bunsen, 27 Ann. Phys., 189 (1861) 337–381
The landmark paper by Kirchhoff and Bunsen 26 published in 1860 (English translation28,29 is available) is well known and was recommended by many scientists, including George Chan, Gary Hieftje, Vassili Karanassios, John Olesik, Ulrich Panne, Benjamin Smith, and Michael Webb.
The impact of this work, 26 as concisely summarized by Ulrich Panne, is that it “describes the origin of spectrochemical analysis and remains a classic of experimental rigor and scientific observation.” Vassili Karanassios noted, “To my knowledge, this paper 26 provides the first description of the identification (based on optical emission spectral lines) of several elements by flame spectroscopy.” John Olesik added, “First reported observation of elemental optical emission and optical absorption spectra from a laboratory source (flame). 26 ”
Michael Webb's comments are “While Talbot17,18 foresaw the potential of atomic emission, Kirchhoff and Bunsen 26 were largely responsible for demonstrating its practicality. Aside from the instrumental description, in which students should note the use of a Bunsen burner, there are two keys to observe. First, this paper 26 establishes that the wavelengths of atomic emission lines are determined only by the metal's identity, and not by the counter-ion's identity or the type of flame used. Second, the paper 26 describes the qualitative analysis of a variety of samples to determine which alkali and alkaline earth metals they contain.”
George Chan elaborated, “The Kirchhoff–Bunsen paper 26 originally published in Annalen der Physik in 1860 is a classic. Reading this original classic reveals many other fascinating fine details of work by Kirchhoff and Bunsen.26,28 First, it sets a good example in demonstrating the importance of dedication in sometimes tedious experimental procedures. For example, the potassium and lithium salts used in the experiments were reported to undergo recrystallization of six to eight times and fourteen times, respectively. Second, the flame test used nowadays is essentially in the same form as described by Kirchhoff and Bunsen, and the advantage of using a chloride salt was already documented in this classic paper.26,28 Third, it provides an outstanding example in experiment design and validation. One example is that the characteristic line concept deduced in flame spectra is cross-validated with electric-spark spectra. Another example is switching between absorption (sunlight as radiation source) and emission, confirming the characteristic line concept between the two observation modes. Fourth, sub-nanogram detection was already reported to be feasible (e.g., for Na, Li, and Ca).26,28 Fifth, very detailed and lots of interesting observations were described. For example, a more intense spectrum at higher temperature and observations of spectral multiplets were reported. Sixth, several other spectrochemical techniques developed at a later time can indeed be traced back to this classic paper. For example, this paper demonstrated probably the first example of provenance determinations based on elemental analysis (Li from micas from different sources); temperature programming for volatilization to increase selectivity of spectrochemical analysis (with Na and Ca as examples); resistive heating of a thick platinum wire as light source to confirm Na absorption (i.e., the forerunner of continuum source atomic absorption!); and sodium vapor in a heated test tube as an absorption cell (i.e., prototype of cold-vapor atomic absorption). The original Kirchhoff–Bunsen paper26,28 offers many more insights than just a paper of historical importance.”
Benjamin Smith expanded the discussion and recommended both the original article 26 published in 1860 and the follow-up work 27 published in 1861, and shared detailed comments: “Shortly after Kirchhoff published his analysis of the solar spectrum and correct interpretation of the origins of the Fraunhofer lines, 12 he and Bunsen collaborated on a project to use spectroscopy for chemical analysis. Although the idea that flame colors and spectral lines were indicative of certain chemical species had been suggested as early as 1752 by Melvill and discussed by Alter, Brewster, Miller, Masson, Talbot, Swan and others, these two seminal papers26,27 in 1860 and 1861 express for the first time the full concept of detecting trace elements using emission spectroscopy. They established all at once the entire field of spectrochemical analysis. One sentence in the opening paragraph says it all: ‘Upon the occurrence of these lines of light an entirely new method of qualitative chemical analysis can be based – a method which greatly enlarges the scope of chemical reactions, and points to the solution of problems hitherto unapproachable.’ 28 Using highly purified salts, they demonstrate conclusively that the observed bright lines observed in the spectrum of a flame are characteristic of specific elements. They used six different flames and noted that line intensity increased with flame temperature and that in a particular flame, more volatile salts produced brighter lines. They compared the spectra produced by electric sparks between pure metal electrodes with those given by the respective salts in flames and found that they were identical except that the spark spectra contained additional lines, which we now know were due to ions, unknown at the time. They discuss detailed studies of six elements in turn, sodium, lithium, potassium, strontium, calcium, and barium. They estimate visual limits of detection, for example, ‘6/10 000 000 of a milligram in weight of chloride of calcium can be detected with certainty,’ i.e., 600 picogram. In the second paper, 27 translated in two parts,30,31 they extend the study to search for new elements and report their discovery of rubidium in part one and cesium in part two. There is a beautiful colored plate which shows the solar spectrum, with reference Fraunhofer lines A–H, and the spectra of K, Na, Li, Sr, Ca and Ba. It is certainly one of the most important scientific graphics of the 19th century.”
Gary Hieftje summed up the impact of these path-breaking papers26,27: “No student, advocate, or practitioner of analytical atomic spectrometry, or perhaps even of analytical science, can be considered a professional until he or she has studied and digested these seminal contributions, either in their original language or as translations.28,30,31”
Quantitative spark spectrochemical analysis – Lockyer and Roberts, 32 Philos. Trans. Royal Soc., 164 (1874) 495–499
As noted by Benjamin Smith, “This paper 32 presents the very first attempt at quantitative spark spectroscopy and remarkably includes most of the critical considerations necessary to the technique: standard preparation and homogeneity, estimation of line intensity, limits of detection and plotted calibration curves. Lockyer, the founding editor of the journal Nature and an ambitious and enthusiastic spectroscopist collaborated with Roberts, a chemist at the Royal Mint, to explore the possibility of analyzing the composition of coinage metals using spark emission spectroscopy. Remarkably, they claim an accuracy of 0.01% and a sample consumption of only 100 μg in a study of gold–copper alloys.”
Transmission and absorption characteristics of atomic emission from “colored” flames – Gouy, 33 J. Phys. Theor. Appl., 9 (1880) 19–27
Nicoló Omenetto and James Winefordner jointly recommended this classic paper 33 and explained, “The first detailed observations of the transmission and absorption characteristics of atomic emission from ‘colored’ flames. The author 33 describes an absorption-emission experiment using a dual prism spectroscope, a spectral lamp and a flame: two unique features of the apparatus were the use of a plane mirror and a ‘colored’ flame (fed with metal solutions), which could be surrounded by another identical non-colored flame (without metal) in order to assure homogeneous and uniform emission. The optical setup was arranged so that one half of the plane mirror was covered by parallel rays from the lamp and the second half was covered by parallel rays from the flame. Elemental line emission with two identical flames was performed: first one flame alone and second the two flames together, with emission from one flame passing through the other flame.
“The flame used by Gouy long preceded the popular ‘Alkemade burner’34,35 (see Section 10.1.1 of this compilation), used for fundamental flame studies at the University of Florida (Winefordner), at the Joint Research Center of Ispra in Italy (Omenetto) and at the University of Illinois, where it was transported by Howard Malmstadt after his sabbatical visit to Alkemade's laboratory, and used by Gary Hieftje in his fundamental work on desolvation and vaporization studies of single droplets introduced into an air–acetylene flame. As Hieftje reports, his work would not have succeeded without the use of such a burner. With two flames, of course, the chances of flashback increased more than linearly, especially in Gainesville. This problem was later investigated and brought under control at Indiana University by Gary Hieftje, who had custom tops fabricated for the burner and with which flashback could be studied. It was found that sufficiently small exit orifices could prevent flashback of both air–acetylene and nitrous oxide–acetylene flames. 36 ”
Nicoló Omenetto continued the discussion with an anecdote and recounted, “In the early eighties, Omenetto had the pleasure of receiving in the spectroscopy laboratory of the Analytical Division of the Joint Research Center (Ispra) the visit of Wolfgang Demtröder, a highly respected German physicist and professor at the University of Kaiserslautern, author of the classic book Laser Spectroscopy – Basic Concepts and Instrumentation. Demtröder was very interested in the fluorescence studies performed in flames at that time, and especially in the operation of the Alkemade burner with the oxygen–argon–hydrogen flame. Transported by juvenile enthusiasm, Omenetto arranged the gas flow rates, gave him a box of matches and pronounced the usual ‘be my guest’ invitation. Without any hesitation, Demtröder struck a match and lit the central flame first, and then the surrounding flame by simply flipping-on the toggle valve of the external flow. Finally, he saw that only the central flame became yellow by aspirating a sodium solution. Drinking the classic glass of water could not have been easier. Whether Omenetto gained any reputation from that experiment is not known – certainly, and more appropriately, the Alkemade burner did.”
Concave grating and the Rowland circle – Rowland, 37 Philos. Mag., 16 (1883) 197–210
Arne Bengtson remarked, “This paper 37 describes a spectrometer design using a concave, focusing grating as the only optical component. To this day, this is one of the most common types of optical spectrometers for spectrochemical analysis.”
On the constitution of atoms and molecules – Bohr, 38 Philos. Mag., 26 (1913) 1–25
Arne Bengtson recommended this paper 38 with an annotation, “This is the first paper 38 where atomic spectra were theoretically calculated based on quantum theory, thus providing a fundamental understanding of why different elements emit light at discrete, characteristic wavelengths. This was a breakthrough not only for the development of quantum mechanics and thereby a milestone in theoretical physics, but also for the further development of analytical spectroscopy.”
Quantum mechanics of radiation – Einstein, 39 Phys. Z., 18 (1917) 121–128
Arne Bengtson commented, “The reason I want to include this paper 39 is that it is the first where the existence of stimulated emission of radiation was postulated, on theoretical grounds. The paper 39 is therefore a precursor of the development of lasers, which have become extremely important tools for spectrochemical analysis at a much later date.”
A positive ray spectrograph – Aston, 40 Philos. Mag., 38 (1919) 707–714
As noted by Vassili Karanassios, “This paper 40 provides the first published description of a fully functioning mass spectrometer consisting of an entrance slit, an exit slit, and an ion source of (so-called) positive ‘rays’. In addition to Francis William Aston (Nobel Prize in Chemistry in 1922 for his discovery of isotopes, using his mass spectrograph), others also worked on the operation of a mass spectrograph, including John Joseph Thomson (Nobel Prize in Physics, 1901, credited with the discovery of the electron) and Arthur Jeffrey Dempster (a Canadian-American physicist, known for his discovery of 235U).”
Alexander Scheeline added, “This inaugural paper 40 on mass spectrometry is astonishingly thorough. Modern mass spectrometers come in a wide variety of geometries, sizes, and mass-sorting modalities. The very first MS instrument is a double-focusing spectrograph, similar to later Mattauch–Herzog instruments. 41 Aston understood how ion kinetic energy would blur magnetic separation spectra and compensated for energy variation at the dawn of the technology. He recognized the influence of residual gas in the ion path, the importance of ion collimation, and the influence of ion lens aberrations.”
Lundegårdh spray chamber and laminar-flow burner – (a) Lundegårdh, 42 Die quantitative Spektralanalyse der Elemente und ihre Anwendung auf biologische, agrikulturchemische und mineralogische Aufgaben, Verlag von Gustav Fischer (1929); (b) Lundegårdh, 43 Die quantitative Spektralanalyse der Elemente Zweiter Teil: Methodische Verbesserungen und praktische Anleitung für die Ausführung von Analysen in den Gebieten der Biologie, Medizin, Agrikulturchemie und des Bergbaus, Verlag von Gustav Fischer (1934)
As Gary Hieftje indicated, “By training and activity, Lundegårdh was an ecologist and a plant physiologist, and had need of a method for determining concentrations of cations (especially the alkali metals) in solution. Amazingly, the apparatus he designed and employed for elemental analysis is nearly identical to that used today for flame emission spectrometry. It included a pneumatic nebulizer, spray chamber, and laminar-flow air–acetylene flame.42,43 Spectra were recorded with a quartz-prism spectrograph on a photographic plate. Concentrations of selected elements in unknown samples were determined by comparing darkening of the photoplate spectral lines with those of standard solutions. Many later workers appeared to copy the ‘air–acetylene’ method of Lundegårdh, some improved on it, and a commercial version appeared.”
Development of laser – (a) Schawlow and Townes, 44 Phys. Rev., 112 (1958) 1940–1949; (b) Maiman, 45 Nature, 187 (1960) 493–494
The importance of the laser in modern-day spectrochemical analysis is inestimable. Detlef Günther commented, “The development of the ruby laser principle 45 opened up an entire new world in analytical chemistry. The intense laser radiation (LASER is derived from light amplification by stimulated emission of radiation) allowed to excite and ablate matter – leading to a wide variety of new techniques, including laser induced breakdown spectroscopy (LIBS), laser microprobe mass analyzer, matrix-assisted laser desorption/ionization, laser ablation (LA)–ICP–AES/–MS and many more and very diverse applications. The development of the ruby laser was based on previous work by Townes and Schawlow who demonstrated microwave amplification by stimulated emission of radiation (MASER), 46 which was predicted by Einstein in 1917 in his theoretical paper ‘Quantentheorie der Strahlung’ (On the Quantum Theory of Radiation). 39 One of the impressive aspects of the laser development is the fast transfer into instruments and applications.”
Arne Bengtson added, “In this paper, 44 it is shown from theoretical considerations that an ‘Optical MASER’, i.e., a LASER, can be realized. After Einstein's 1917 paper, 39 this is the next milestone in the development of lasers. It was to a large extent for this work 44 Schawlow was awarded the 1981 Nobel Prize in Physics for his contribution to the development of laser spectroscopy.”
History on the development of fundamentals, instrumentation, and methods for atomic absorption, emission, and fluorescence as analytical techniques – (a) Greenfield, McGeachin, and Smith, 47 Talanta, 23 (1976) 1–14; (b) Greenfield, Hieftje, Omenetto, Scheeline, and Slavin, 48 Anal. Chim. Acta, 180 (1986) 69–98
These two review articles47,48 were recommended by George Chan, who opined, “The review article 47 on the inductively coupled plasma (ICP) is likely of mostly historical interest by now. Stanley Greenfield, one of the original developers of the analytical ICP, wrote this review 47 and gave a concise account of the development of ICP as an analytical plasma source from its conceptualization in the early 1960s till 1975. The early development of the ICP is interesting to read and the review uncovered many original ideas and trials, for example: a two-tube torch, water-cooled injector, low-pressure ICP, ICP for atomic absorption spectrometry (AAS), and investigations into the effect of generator types (i.e., free running versus crystal controlled) and frequency of radiofrequency (RF) power-supply. This paper 47 described the trajectory of the early-day development into a more common standard configuration of the ICP that we use nowadays.
“The second article 48 was co-written by five seasoned researchers with a focus on instrumentation development, fundamental studies, and a future view of analytical atomic spectroscopy, specifically on atomic absorption with flame and furnace, emission with spark and ICP, and atomic fluorescence from 1960 to 1985 – the period of time when these techniques were undergoing much rapid and transformative progress. As mentioned in the article, 48 only one technique – emission spectroscopy – was generally utilized prior to 1960. It is rare to see a viewpoint article jointly crafted by so many independent pillars. To me, the most interesting part of this review 48 is on reading the anecdotes and seeing how other scientists think and approach a practical scientific problem. In Slavin's words, ‘Many individual workers have pooled their skills using the medium of the scientific press to bring about the very successful products that are now becoming commercially available.’ 48 Another learning point is that one should keep a toward-the-ideal attitude in instrumentation development (as well as in research) and should not settle for a non-optimal system. The discussion on the historical development that a flame atomizer was once employed as an accessory for a ultraviolet (UV)-visible spectrophotometer and that the electrothermal furnace was once sold as an accessory for flame-atomic absorption instruments are two convincing examples showing ‘the futility of grafting one technique onto another.’ 48 In this paper, 48 at least two authors pointed out the current (as of 1986) status of a lack of complete understanding of the fundamental mechanisms. As commented by Greenfield, ‘The present position would appear to be that even after 25 years of experiment and debate, certainty of the exact nature of excitation mechanisms (in the ICP) is not yet with us.’ 48 Ultimately, such an understanding is needed for advancement because it would be difficult to imagine further instrumentation development or its optimization to the fullest possible extent without a thoughtful fundamental understanding of the operating mechanisms. Thirty-nine years have passed since 1986; although there is no doubt that we have improved our fundamental understanding of the different analytical spectrometric sources, in my view the understanding is still far from complete and more effort should be invested.”
Gary Hieftje added, “The occasion was the retirement of Alison Macdonald, who had served as editor of Analytica Chimica Acta for a period of 25 years. The new editor of that journal, Harry Pardue of Purdue University, wished to put together a special issue to commemorate the occasion and invited people active in several key analytical disciplines. The goal was to provide an indication of how each field had developed during the period of Alison's editorship. It was also an auspicious time in the field of spectrochemical analysis; both flame and furnace atomic absorption were very widely used for routine analysis, but the high-voltage spark was still dominant in the metals industry, fostered in part by (then) recent innovations in the design of controlled, unidirectional spark sources. ICP emission was challenging both spark spectroscopy and atomic absorption, and atomic fluorescence offered astonishing detection limits, even to the single-atom level. At that time, ICP–MS had not yet reached the stage of being competitive with these other methods. Pardue asked me if I would be willing to organize a paper on these topics, co-authored by the very top folks in the several areas. The choices were easy and the invitees gracious in their accepting. Walter Slavin of Perkin–Elmer was not only highly respected in the field of AAS but also responsible for a number of key innovations in atomic absorption that were already embodied in commercial instrumentation. He also possessed excellent perspective in that field, having long worked together with Alan Walsh, credited with ‘inventing’ atomic absorption as an analytical method and with Boris L’vov, one of the main players in the development of carbon furnaces for AAS. Stan Greenfield, responsible for many of the most important innovations in tailoring the inductively coupled plasma for analytical measurements, was a natural to cover the field of ICP–AES. Nico Omenetto had long been active in the characterization and application of atomic fluorescence and enjoyed an extended and fruitful collaboration with Jim Winefordner, who initiated the use of atomic fluorescence spectrometry (AFS) for analytical measurements. Alex Scheeline was not only active himself in the design and use of stabilized spark sources for emission spectrometry, but also received his doctorate from John Walters of the University of Wisconsin, who more than any other was responsible for the modern spark source and its capability. These top people provided a snapshot of the current state-of-the-art of these various atomic methods and offered perspective that can be appreciated only by a reading of the original paper. 48 ”
Fundamental Concepts and Analytical Figures of Merit Relevant to Spectrochemical Analysis (e.g., Limits of Detection, Calibration, Internal Standardization, and Standard Additions)
Limits of detection (LODs) and quantitation
Concept of limit of detection (LOD) in chemical analysis – (a) Kaiser, 49 Spectrochim. Acta, 3 (1947) 40–67; (b) Kaiser, 50 Fresenius Z. Anal. Chem., 209 (1965) 1–18; (c) Kaiser, 51 Fresenius Z. Anal. Chem., 216 (1966) 80–94; (d) Currie, 52 Anal. Chem., 40 (1968) 586–593; (e) Kaiser, 53 Anal. Chem., 42 (1970) 24A–41A; (f) Kaiser, 54 Anal. Chem., 42 (1970) 26A–59A; (g) Kaiser, 55 Pure Appl. Chem., 34 (1973) 35–61; (h) Kaiser, 56 Spectrochim. Acta Part B, 33 (1978) 551–576; (i) Currie, 57 Anal. Chim. Acta, 391 (1999) 127–134
As explained by Ulrich Panne, “Kaiser derived from insights into the sensitivity of spark analysis the concept of detection limits. 49 This article 56 is a summary to the seminal work of Kaiser on detection limits of analytical methods derived from spark analysis; Kaiser mentioned also Shannon's information content as possible criteria for a method. The paper by Currie 57 provides a good starting metrology point into the statistics of figures of merit of analytical methods relating early concepts from spectrochemical analysis with modern insights into the chemical measurement process.”
James Winefordner and Nicoló Omenetto jointly commented that “Heinrich Kaiser should be given credit for the initial discussion of the limit of detection (LOD). He is responsible for the present day importance of a statistical definition of the LOD. The above papers50,51,55,58 should be read by all analytical scientists. The paper published in Pure Appl. Chem. 55 provides an excellent review and is a must-read for the initial statistical concepts for the LOD and its importance when considering trace analysis. Lloyd Currie was the force behind using a statistical definition of LOD in the United States. This publication 52 is the landmark paper that can be considered the start of the detection limit theory in analytical chemistry (although the subtitle was given as application to radiochemistry). The paper 52 discusses the statistics associated with the concepts of detection and determination of the observable signal and its associated random fluctuations. Currie states clearly that if one is willing to tolerate a 50% error in wrongly identifying a false signal or in missing a true signal (false positive and false negative), the conclusion will be wrong 50% of the time, and therefore the experiment could be performed equally well by flipping a coin.”
Nicoló Omenetto further recounted, “I remember a lively discussion following Winefordner's lecture on signal-to-noise ratio (S/N) at the Colloquium Spectroscopicum Internationale XVII in Florence (Italy) in 1973, when Kaiser stood up insisting on the need to consider the complete analytical procedure when discussing the LOD and associated concepts applying statistical analysis of the analytical data. The debate following the talk was certainly a major incentive for the subsequent interest and analysis of the Winefordner group in these matters, which resulted in numerous key publications. Indeed, it is worth noting that the S/N treatment discussed in the classic 1988 book Spectrochemical Analysis by Ingle and Crouch 59 came from the multiple papers published by the Winefordner group. This book 59 has been the only one used for several decades by faculty teaching a graduate course in Spectrochemical Methods of Analysis at the University of Florida.”
George Chan remarked, “Kaiser introduced the concept of LOD,49–51 which is important not only for analytical atomic spectrometry, but in all branches of the analytical sciences. Not only detection limit, but the concept of limit of quantitation (LOQ), which commonly refers to 10% fluctuation of the determined analyte concentration/content, was also covered in Kaiser's 1947 paper. 49 All three references were published in German and an English translation is available for the latter two papers50,51 as a monograph. 58 The basic concept, statistical argument, and the importance of LOD are very clearly explained in the 1965 paper.50,58 In the 1966 paper,51,58 the discussion was further extended to Type I (i.e., false positive – that is concluding the presence of the analyte which is in fact absent) and Type II (i.e., false negative – that is unable to conclude the presence of the analyte which is indeed present) errors, and the guarantee limit. That is, what is the upper limit of the analyte concentration that we can confidently infer, should the determined analyte concentration be lower than the detection limit? The paper51,58 also contained a discussion on limit of guarantee of purity extended to inhomogeneous samples. Finally, Kaiser51,58 also discussed the situation in which the concept of LOD should not be applied.”
Igor Gornushkin also noted, “Kaiser's paper 50 shows that even such a common definition of a LOD as ‘analytical signal’ = 3 × ‘analytical noise’ needs foregoing considerations. He introduces a concept of ‘limit of guarantee for purity’ and shows that this limit is always higher than the LOD. It is a useful and conceptual paper for those who do quantitative spectroscopy.”
Nicolas Bings shared a different pair of papers53,54 and noted, “The content of these two manuscripts by Kaiser53,54 is based on a lecture given by him in 1969 at the 22nd Annual Summer Symposium on Analytical Chemistry. Here, Kaiser defines in detail the term ‘limit of detection’ and other important figures of merit. The derivation and explanation of his resulting concept is the basis for today's quantitative analytical chemistry. The reader, however, must engage in material that is not that easy to read, but is rewarded by fully comprehensive information on the subject of quantification in elemental analysis.”
Inter-relationship between limit of detection and spectral resolution in emission spectrometry – (a) Laqua, Hagenah, and Waechter, 60 Fresenius Z. Anal. Chem., 225 (1967) 142–174; (b) Boumans and Vrakking, 61 Spectrochim. Acta Part B, 42 (1987) 819–840
The first paper 60 is recommended by Igor Gornushkin and José Broekaert. As is concisely summarized by Gornushkin, “Laqua 60 further develops the basic concepts for quantitative spectroscopy in relation to characteristics of a spectrometer.” José Broekaert further noted, “The paper 60 quantitatively relates the detection limits in optical emission spectrometry to the properties of the spectral equipment. The relationship between the detection limits and the properties of spectral equipment in terms of achievable resolution especially for the case of photographic radiation measurements in optical atomic spectrometry are discussed.”
The second paper 61 on detection limits including selectivity as a criterion for line selection in trace analysis was suggested by Kenneth Marcus and Zhanxia Zhang. Zhanxia Zhang noted, “Boumans had published a series of papers concerning fundamental evaluation of the specific analytical responses. The concept of ‘the true detection limit’ is well defined in this work, 61 stating that it can be used as a quantitative criterion for the selection of analytical lines in ICP–AES, and that it can conveniently be used in the software system for line selection.”
Kenneth Marcus added, “Beyond writing the book, Theory of Spectrochemical Excitation, devoted primarily to arc/spark spectroscopies, Boumans made substantial contributions as to how one fundamentally evaluates the analytical utility of spectrochemical sources and specific analytical responses. 61 All too often, limits of detection are treated as a standalone, single-purpose figure of merit. Indeed, there is a wealth of fundamental and practical information which can be gleaned from them, depending on the approach used in their determination. Beyond the excitation characteristics (brightness) of the spectrochemical source, aspects of spectral interferents (line, band, or continua), signal temporal stability (analyte and background), and the individual components of the detection system all contribute to limits of detection. The concepts and principles outlined here 61 have relevance in practically all modalities of measurement science.”
Tutorials on elementary concepts and statistical evaluation of limit of detection – (a) Hubaux and Vos, 62 Anal. Chem., 42 (1970) 849–855; (b) Boumans, 63 Spectrochim. Acta Part B, 33 (1978) 625–634; (c) Long and Winefordner, 64 Anal. Chem., 55 (1983) 712A–724A
The article by Hubaux and Vos 62 was recommended by José Broekaert, who stated, “The paper 62 relates the power of detection to the blank and background signals and their fluctuations in a unique way. The fluctuations of the background or the blank are characterized by the error of the first kind (α), whereas the fluctuations of the analytical signals for the standard samples with low concentrations are characterized by the error of the second kind (β). Both errors may be different as the fluctuations may differ both in the type of their distribution as well as in their magnitude. The detection limit is defined as the concentration for which the signal differs with a probability related to both errors (1 − α − β) from the mean for the background or blank signal. Formulae and examples for this approach are presented in this paper. 62 ”
The paper by Boumans 63 on elementary concepts in the statistical evaluation of trace element measurements was recommended by several scientists, including Nicolas Bings, George Chan, Igor Gornushkin, and Michael Webb. As noted by Michael Webb, “Although there are many papers discussing detection limits and related concepts, this paper 63 finds a balance between rigor and readability. It clearly discusses the multiple purposes of a detection limit, relates these to statistics in a digestible graphical form, and advises on what figure of merit matters in what circumstance. This paper 63 is targeted to detection of trace elements, but it is also valid across analytical chemistry.”
Igor Gornushkin shared a similar view and noted, “Boumans 63 provides an overview of all the concepts used for statistical evaluation of results of trace element analysis. This 63 and two other papers50,60 above are the three pillars on which quantitative spectral analysis holds.”
Nicolas Bings stated, “Another important presentation 63 of the concepts of limit of detection, limit of identification, and limit of determination from an elementary, statistical point of view. I especially like Boumans’ statement on his expectation on the acceptance of the ‘new’ concept: ‘…psychological barriers remain to be removed before these concepts can be fully implemented in analytical chemistry.’ I wonder if we have finally managed.”
George Chan added, “This article 63 is an informative and easy-to-follow tutorial covering the definition and physical meaning of different easy-to-confuse terminologies, like limit of detection, limit of identification, limit of determination, and their variants depending on the different ‘schools’. Boumans 63 also discussed the different use of terminologies by Kaiser and Currie as well as the Type I and Type II errors (or called a posteriori and a priori cases).”
The paper by Long and Winefordner 64 on detection limits from the viewpoint of the International Union of Pure and Applied Chemistry (IUPAC) definition was recommended by Nicolas Bings, David Hahn, Nicoló Omenetto, and Vincenzo Palleschi. As summarized by David Hahn, “This classic paper 64 takes a careful look at the limit of detection, providing broad insight as to its origins, definition and usage, statistical meaning, propagation of error, and limitations in the context of analytical chemistry methods.”
Nicolas Bings added, “The statistical meaning of LOD in a format consistent with the IUPAC definition is presented. 64 It is a simple and general discussion for methods on calculating limits of detection for analysts who do not have a rigorous knowledge of statistics. It is not a comprehensive review of the various methods of calculating LODs.”
Nicoló Omenetto opined, “A clear, easy to read report, 64 which was not meant to be a comprehensive review of the various methods used to calculate the LOD, but rather a discussion of the various approaches attached to the meaning of the words ‘statistically different from the blank’ that appear in the IUPAC definition of the LOD. The style used is purposely tutorial because the article is geared to the analyst who does not have a rigorous knowledge of statistics. The authors 64 advocate the use of the propagation of errors approach, do not recommend the graphical approach, and suggest that the value of k should not be less than 3.”
Vincenzo Palleschi expanded the discussion and noted, “Another concept, strictly related to the building of calibration curves, is the LOD. This parameter is fundamental in spectrochemical analysis, being one of the figures of merit of the analytical technique used. In some cases, the LOD of a given substance can be obtained as 3σ/b, where b is the slope of the calibration curve and σ is the standard deviation of a suitable blank signal obtained from at least 10 independent measurements. However, it is important to keep in mind that the 3σ/b formula is a way of representing the fact that b × LOD is the minimum signal that can be distinguished from zero with a 3σ confidence limit. The σ of the blank, thus, must include all the other sources of uncertainty (such as the uncertainty on the intercept of the calibration curve). This is well explained in this paper. 64 The difference between LOD and limit of quantitation (LOQ) is also important; in the calculation of the LOD of a substance, the minimum concentration tested in the calibration curve should be close to the LOQ for the same substance.”
Comments and precautions on sensitivity and limit of detection – (a) de Galan, 65 Spectrosc. Lett., 3 (1970) 123–127; (b) Skogerboe and Grant, 66 Spectrosc. Lett., 3 (1970) 215–220; (c) Ingle, 67 J. Chem. Educ., 51 (1974) 100–105; (d) Stevenson and Winefordner, 68 Appl. Spectrosc., 45 (1991) 1217–1224; (e) Stevenson and Winefordner, 69 Appl. Spectrosc., 46 (1992) 407–419; (f) Stevenson and Winefordner, 70 Appl. Spectrosc., 46 (1992) 715–724
Nicolas Bings recommended these three articles65–67 and commented, “With this manuscript, 65 de Galan intends to ‘restore the damage’ which was formerly caused by ‘several other authors’ using misleading or false definitions of the terms sensitivity and detection limit. ‘Probably the papers on this issue by […] and certainly some misleading statements would have been left unwritten, if these authors had taken the elementary precaution of consulting the pertinent literature or an appropriate textbook.’ This is a remarkable manuscript for both reasons, the style of writing (de Galan presents an extraordinary portion of self-confidence) and the scientific content. It shows an interesting way to dispute, using the ‘analog’ platform of a scientific journal. This could be of interest for anyone working in analytical spectrometry. In the Skogerboe–Grant paper, 66 attention is – again – drawn to a very practical definition of sensitivity. This paper 66 attempts to clarify some pertinent related points and a remarkable response was given to the thoughts of de Galan 65 : Skogerboe and Grant ‘agree with the general discussion concerning the definitions of the terms sensitivity and detection limit made by de Galan’, but they ‘must strongly suggest that to define sensitivity as the slope of the analytical curve is not entirely practical’. In their opinion, de Galan ‘has failed to consult the pertinent literature’. The tutorial by Ingle 67 is another thorough discussion of the definitions of the terms LOD and sensitivity. It focuses on ‘indicating the basis from which the different definitions are derived and the types of information provided by the various definitions of sensitivity and limit of detection’. The explanations are given with special reference to spectrometric applications.”
The article on the variability of estimated detection limits 68 was suggested by Igor Gornushkin who noted, “A systematic study of the analytical figures of merit, LOD in particular, was continued by Stevenson and Winefordner. 68 Their paper is instructive in that even seemingly well-established characteristics (like LOD) should be treated with care and related to a particular experimental technique. The paper is very useful as it shows a scientific way of comparison of different techniques based on a single estimator like LOD.”
Nicoló Omenetto recommended this three-part article68–70 and remarked, “This very well conceived and presented series of papers68–70 applies the known theoretical considerations on the use of the laser resonance ionization and fluorescence methodologies to detect single species (atoms and molecules). The merit of the series lies in the use of computer simulations to demonstrate the role played by factors such as detection efficiency, mean background and signal fluxes, and interaction time of the atoms with the laser in the probed volume. The authors68–70 correctly argue that theory and simulations are only as good as the model upon which they are based, which then questions the validity of the various assumptions (Poisson statistics, for example, as well as space charge effects and metastable traps) made in the model.”
The approach of signal-to-background ratio–relative standard deviation of the background (SBR–RSDB) for evaluation of limit of detection – (a) Boumans, McKenna, and Bosveld, 71 Spectrochim. Acta Part B, 36 (1981) 1031–1058; (b) Boumans, 72 Spectrochim. Acta Part B, 45 (1990) 799–813; (c) Boumans, 73 Spectrochim. Acta Part B, 46 (1991) 431–445; (d) Boumans, Ivaldi, and Slavin, 74 Spectrochim. Acta Part B, 46 (1991) 641–665
The joint narrative provided by Nicoló Omenetto and James Winefordner reads: “Paul Boumans has devoted a large part of his scientific interest to an in-depth, lucid and tutorial theoretical discussion of the concepts underlying the measurement of signals, their noise characteristics and the practical experimental ways of improving the resulting signal-to-noise ratio (S/N) in ICP emission spectrometry. The above papers71,73 are excellent tutorial material. In the first paper, 71 a comparison between experiment and theory revealed that shot and flicker noises in the background are the limiting factors, and that the best results were obtained by maximizing the signal-to-background ratio (SBR) using a fairly high spectral resolution. In the second paper, 73 Boumans derives a simple, self-explanatory way to link together the SBR and the relative standard deviation of the background (RSDB) into the International Union of Pure and Applied Chemistry (IUPAC) definition of LOD. This clarifies that the LOD strictly depends upon the noise in the background rather than on the background level, but also that, for a given noise in the background, the LOD improves with an increase in the SBR.”
Kenneth Marcus suggested a different article 72 and remarked, “Introduced here is the more widely applied of the ‘Boumans Equations’, calculating limits of detection based on the signal-to-background ratio and relative standard deviation of the background (SBR–RSDB) characteristics. 72 This method is an incredibly effective means to determine what concentrations can be practically determined, without the need to generate comprehensive calibration functions.”
In addition to the comments from James Winefordner and Nicoló Omenetto presented above, the article by Boumans published in 1991 73 was also recommended by George Chan, WingTat Chan, and Gary Hieftje.
George Chan opined, “Based on Kaiser's classic paper on LOD – the ‘Dortmund School’ as Boumans referred to it – Boumans discussed in this tutorial the SBR–RSDB approach for the evaluation of LOD. 73 In the most common method, LOD is evaluated based on signal-to-noise ratio (S/N) and Boumans 73 showed the equivalence of the two LOD mathematical expressions based on S/N and SBR–RSDB. The advantage of the SBR–RSDB approach is the breakdown of LOD into SBR and RSDB components, in which SBR can be further broken down into spectrometer bandwidth and physical linewidth of the emission line, and RSDB into contributions from flicker, shot and detector noise. The mathematical relationships between these factors were also given. 73 ”
WingTat Chan recommended this pair of papers73,74 and shared detailed comments which read: “The first article 73 discusses the SBR–RSDB approach for the evaluation of detection limits. Boumans opined, in a related article, 75 that ‘detection limits based on the mere measurement of a few net signals and standard deviation of the background easily degrade to incidental figures without merit,’ which is quite true, especially for the cases of small background, e.g., ICP–MS. Boumans argued that the SBR–RSDB method provides more insight into instrumental performance: Separate measurement and reporting of RSDB and SBR permits examination of the internal consistency of detection limits of an instrument and facilitates examination of the sources of limiting (inferior) performance of the instrument. Normalization of the signal xA and the standard deviation σB to the background signal xB also allows comparisons of the performance of different systems. The article 73 discusses the SBR and RSDB functions in detail. Contributions of flicker noise, shot noise, and detector noise to RSDB are succinctly elaborated and the significance of the noises in different scenarios is discussed. The second article 74 further discusses the concepts given in the first paper based on experimental data of LOD, background-equivalent concentration (BEC), RSDB, xA, xB, and σB of four different ICP–AES spectrometers under five different operating conditions and instrumental setups. The effects of applied potential to the photomultiplier tube (PMT), spectral bandwidth of the spectrometers, and types of nebulizers on RSDB are discussed. Guidelines for analytical chemists to judge the performance of analytical instruments based on RSDB are also provided.”
Gary Hieftje opined, “The Boumans SBR–RSDB approach73,74 was initially heralded as a conceptual breakthrough in calculation of detection limits. However, as Paul Boumans himself indicated, the concepts embodied in his approach could readily be derived from earlier treatments, including those of Kaiser, Winefordner, and others. The main benefit of the Boumans method is that it involved the measurement of two ratios – that is, relative values (signal-to-background ratio, SBR, and relative standard deviation of the background, RSDB) and therefore required no photometric calibration, verified instrument stability, or reference to a standard.”
Discussion on absolute (i.e., mass-based) and relative (i.e., concentration-based) limits of detection – (a) Winefordner and Stevenson, 76 Spectrochim. Acta Part B, 48 (1993) 757–767; (b) Omenetto, Petrucci, Cavalli, and Winefordner, 77 Fresenius J. Anal. Chem., 355 (1996) 878–882
As explained by Kenneth Marcus, “The evolving ability to sample exceedingly small sample volumes using graphite furnace or laser ablation atomization introduced the necessity to discuss detection limits regarding the absolute mass of material sample versus the more conventional approaches applied to sampling bulk liquids or metals. While of less relevance then, but surely much more so now, the introduction of samples following a chromatographic separation creates the same sorts of metrics to be considered. These papers76,77 describe the conflicting aspects of assessing the lower limits of determination and place them into perspective relative to one another.”
Limit of quantitation (LOQ) in atomic spectrometry – (a) Poussel and Mermet, 78 Spectrochim. Acta Part B, 51 (1996) 75–85; (b) Carré, Excoffier, and Mermet, 79 Spectrochim. Acta Part B, 52 (1997) 2043–2049; (c) Mermet, 80 Spectrochim. Acta Part B, 63 (2008) 166–182
James Winefordner and Nicoló Omenetto jointly commented, “These three papers78–80 are a must read for all interested in the theory and application of statistical concepts to practical analytical work. Jean-Michel Mermet has dedicated much effort in discussing the fundamental, instrumental and experimental way of approaching the definitions in the above titles. In presenting the basic concepts, he stresses lucidly the importance of correlation between different types of noise and their effect on figures of merit (e.g., LOD, LOQ, background-equivalent concentration (BEC), measurement repeatability, just to cite a few). In our opinion, Mermet had the unique advantage of merging together a deep understanding of the theory of signal-to-background, signal-to-noise ratios, and the limiting type of noise present in plasma emission measurement (not only ICP but also laser-induced plasmas) with his vast instrumental laboratory experience and technological development of analytical spectroscopy with plasma sources, spectrometers and photon detectors. We both finally note that the discussion on the above concepts was amply extended and critically evaluated by Edward Voigtman in a series of papers cited in this compilation.81–86”
Nicoló Omenetto further recounted, “I acknowledge the enlightening correspondence with Jean Michel, focused on an attempt to clarify the semantics of the definition of the detection limit as the concentration derived from ‘a net signal equivalent to 3 times the standard deviation of the background noise’. Mermet made clear that background in itself does not mean noise, but is a signal, therefore having both a magnitude and a noise (a fluctuation). He then concluded that one could make it clearer by saying ‘…3 times the standard deviation of the background signal fluctuations’.”
In addition to the comments from James Winefordner and Nicoló Omenetto indicated above, the tutorial-style paper on clarifying the ambiguity of LOQ 80 was recommended by several other scientists, including Annemie Bogaerts, George Chan, Igor Gornushkin, and Jin Yu. Annemie Bogaerts concisely summarized the importance of this work 80 as it contains a “discussion of the general concept of the LOQ in analytical spectroscopy.” Igor Gornushkin noted, “Mermet 80 puts into doubt a concept of LOQ in spectrochemical analysis. He shows that the determination of LOQs and LODs are highly challenging and therefore the reported values should be carefully validated.”
George Chan shared this view and added, “This informative, authoritative, and easy-to-follow tutorial 80 covers concepts, different statistics, limitations and complexity of various approaches on LOQ for analytical atomic spectrometry. Recipe formulas were reviewed and discussed, and arguments were presented on the need of testing measurement data and experimental precautions (e.g., checking data for a Gaussian distribution, the influence of number of measurement replicates, outliers, ICP–MS digitization) before blindly applying the 10σ formula. 80 In my view, similar precautions are equally applicable to LOD evaluation. Alternative approaches for LOQ evaluations, for example, based on relative standard deviation (RSD) of net signal, prediction band and uncertainty calibration, were also discussed.”
Jin Yu commented, “This paper 80 discusses LOQ with several descriptions and definitions; examples taken from atomic spectrometry with various techniques such as ICP–AES, ICP–MS and LIBS are used for illustration. The merit of this paper is also to discuss an ensemble of concepts that provide the basic elements to define LOQ, such as accuracy and trueness, precision (instrumental repeatability and inter-laboratory reproducibility), and uncertainty. Such a paper 80 is essential and constitutes the common basis for a quantitative analysis technique such as LIBS.”
In-depth Monte Carlo simulation on limits of detection and decision – (a) Voigtman, 81 Spectrochim. Acta Part B, 63 (2008) 115–128; (b) Voigtman, 82 Spectrochim. Acta Part B, 63 (2008) 129–141; (c) Voigtman, 83 Spectrochim. Acta Part B, 63 (2008) 142–153; (d) Voigtman, 84 Spectrochim. Acta Part B, 63 (2008) 154–165
James Winefordner and Nicoló Omenetto jointly remarked, “In this series of four back-to-back published articles,81–84 Voigtman considers the three quantities of fundamental importance in detection limits, namely the population standard deviation of the blank, the true slope of the response curve, and the true intercept of the response curve: since each is either known or unknown, this makes for eight cases. The articles document an in-depth study on limits of detection and decision with Monte Carlo simulation. Part I outlines the background and theoretical basis of his study, and his Monte Carlo model. Millions of independent calibration data-sets were simulated, with a conclusion that detection limits calculated from a prediction interval-based calibration curve are negatively biased, in both domains of net analytical response and chemical content/concentration. 81 That the detection limits in the response domain follow a modified non-central t distribution for the case of a simple univariate chemical system having homoscedastic (constant random noise variance), Gaussian measurement noise was reported in Part II. 82 The case of heteroscedastic noise and weighted least-squares processing of calibration curve data were considered in Part III. 83 In Part IV, 84 Voigtman discussed the impact and consequence of his findings in Parts I to III to the commonly used formula for LOD calculation based on k times the noise divided by the slope of the response curve as well as the RSDB–BEC (relative standard deviation of background–background-equivalent concentration) approach. A follow-up work was published in 2011 in three parts.85–87 A laboratory-constructed laser-excited filter fluorimeter designed to exhibit linearly homoscedastic, additive Gaussian noise was described and millions of experimental linear calibration curves were obtained and compared with the results of their simulation model. 87 The experimental system was further modified so that its noise became linearly dependent with analyte concentration and the comparison was then extended to the heteroscedastic regime.85,86
“We strongly feel that Ed Voigtman is the world's leading expert on the LOD–S/N theory. We may also say that his writing can be considered less tutorial than that used by the other prominent scientists cited in this field: in the end, however, we feel that the time spent in becoming familiar with the concepts and procedures discussed in the above papers81–87 will be rewarding.”
James Winefordner further recalled, “Ed joined my research group in 1979, right after obtaining a PhD in physical chemistry at the University of Florida. Apart from his excellent background in physical methods of analysis, electronic instrumentation, and laser spectroscopy, Ed soon became interested in the concept of signal-to-noise ratio and limit of detection, an interest that continued after being appointed as professor at the University of Massachusetts, culminating in his book entitled Limits of Detection in Chemical Analysis. 88 ”
Calibration and related concepts
Evaluation and comparison of analytical methods – Kaiser and Specker, 89 Fresenius Z. Anal. Chem., 149 (1956) 46–66
José Broekaert remarked, “The paper 89 describes the terms to be used in the evaluation of spectrochemical procedures. Figures of merit such as standard deviations reflecting the attainable precision and detection limits reflecting the power of detection and their relation to sensitivity are discussed.”
Ulrich Panne shared a similar view and noted, “Kaiser derived from insights into the sensitivity of spark analysis the concept of detection limits 49 and an approach to compare analytical methods. 89 While both papers49,89 are interesting from a historical view, they were written in German; for a global audience, only two papers were selected.”
Calibration with exponential dilution – Hartmann and Dimick, 90 J. Gas Chromatogr., 4 (1966) 163–167
As noted by Nicolas Bings, “The paper from Hartmann 90 is one of the early and detailed reports on the principle and the application of exponential dilution (flask) calibration, which was first introduced by Lovelock. 91 The calibration method was used for the analysis of permanent gases.”
Quality of calibration – (a) Mermet, 92 Spectrochim. Acta Part B, 49 (1994) 1313–1324; (b) Mermet, 93 Spectrochim. Acta Part B, 65 (2010) 509–523
Although this paper 92 focuses on inductively coupled plasma emission spectrometry, similar arguments apply to all analytical spectrochemical methods. As commented by John Olesik, “The key point to note in this article 92 is that every ICP–AES user should be aware of factors affecting concentration uncertainty, which is much larger than is indicated from just the precision of measurements. Unfortunately, commercial ICP–AES only reports the precision, not the concentration uncertainty.”
Jin Yu shared a different paper 93 on this topic, also written by Mermet, and noted, “This review paper 93 discusses the calibration procedure in atomic spectrometry, in particular, with illustrative examples from ICP–AES and LIBS. The focus is the criteria providing the performance assessment of a calibration model. The usually used determination coefficient, r2, is compared with the uncertainty due to the regression. Weighting and choice of the curvature of a calibration plot are then discussed as possible approaches to improve the quality of a calibration curve.”
Multivariate calibration and machine intelligence – (a) Isenhour and Jurs, 94 Anal. Chem., 43 (1971) 20A–35A; (b) Geladi and Kowalski, 95 Anal. Chim. Acta, 185 (1986) 1–17; (c) Wold, Esbensen, and Geladi, 96 Chemom. Intell. Lab. Syst., 2 (1987) 37–52; (d) Bro, 97 Anal. Chim. Acta, 500 (2003) 185–194
As explained by Ulrich Panne, “Science is moving into the age of ‘data driven’ science where a single measurement becomes cheap and analytical sciences generate a wealth of small and large, heterogeneous data sets. Chemometrics or data science in chemistry had a strong focus on spectroscopy since the origins of the field in the 1970s. Many spectrochemical methods are information rich by nature. Modern instrumentation and automation allow making use of the information which has been already there in the beginning, e.g., see wealth of spectral information from photographic plate detection in the 1920s. For spectrochemical analysis especially, multivariate calibration became a sine-qua-non, while exploratory data analysis is needed in many applications where multimodal data are fused. Note that my selection in this topic94–97 provides only an entry point to a methodologically fast evolving field. The article by Isenhour and Jurs 94 is a seminal paper on the promise of machine learning and artificial intelligence in analytical chemistry. The article by Geladi and Kowalski 95 is one of the most referred tutorials for partial least squares regression in which it provides a solid and readable introduction into multivariate calibration. This paper by Bro 97 contains a general and more up-to-date appetizer to recognize, explore and use the multivariate nature of data. Principal component analysis 96 is a fundamental method for multivariate analysis and a core idea extended into many of today's algorithms to handle large data sets.”
IUPAC guidelines for calibration and data interpretation – (a) Danzer and Currie, 98 Pure Appl. Chem., 70 (1998) 993–1014; (b) IUPAC, 99 Spectrochim. Acta Part B, 33 (1978) 241–245
Vincenzo Palleschi recommended the two publications98,99 and offered the following observations: “In the last decade, the use of multivariate analysis has become a common approach for linking the plasma spectral emission to the samples’ composition. For instance, spectrochemical analysis of the optical emission of laser-induced plasmas (i.e., as in laser-induced breakdown spectroscopy, LIBS) is made complex by the transient nature of the plasmas and the possible interplay between the plasma and the laser radiation, which might result in strong matrix effects, non-linear relations between analyte concentration and optical signal, and other adverse effects that might reduce the possible application of analytical techniques based on laser-ablation/optical emission of the samples.
“Without questioning the importance and usefulness of these calibration methods, an essential bibliography on the analytical exploitation of the optical emission should start with a reference to the IUPAC guidelines 98 for spectrochemical analysis using univariate calibration curves. This other guideline 99 deals with the nomenclature and symbols related to data interpretation common to all fields of spectrochemical analysis. As an example, the LIBS technique is often applied in the analysis of solid samples and, in some cases, the availability of suitable standards for building a calibration curve might be problematic, making the optimization of the calibration procedures an important issue. When building a calibration curve, one must consider that the uncertainty in the composition of the reference samples might not be negligible with respect to the uncertainty on the LIBS signals. Moreover, the detectors used in LIBS analysis give a response proportional to the number of photons emitted at a given wavelength; the signal statistics are typically non-Gaussian and the standard deviation of the measurements varies with the intensity of the signal (non-homoscedasticity). All these effects must be considered in determining the best fit function and the limits of confidence of the calibration curve parameters. The least-squares method, which is commonly used for the calculation of the slope and intercept of the best fitting linear calibration curve, should be substituted by a symmetric minimum-χ2 algorithm, accounting for the uncertainty in both the independent and dependent variables.
“Finally, the correct determination of the calibration curve parameters and their uncertainties is not only essential for the trueness of the analytical results, but also for the estimation of the LOD of the analyte. In some cases, the uncertainty in the intercept of the calibration curve could be comparable to, if not larger than, the standard deviation of the signal on the blank. This would necessarily imply a reconsideration of the IUPAC ‘3σ/b’ rule for LOD, because both the standard deviation of the signal and the uncertainty of the intercept of the calibration curve contribute to the ‘σ’ in the IUPAC formula. 64 ”
Internal standardization
Origin of the internal standardization method – Gerlach, 100 Z. Anorg. Allgem. Chem., 142 (1925) 383–398
John Olesik noted, “This paper 100 contains the first reported use of an internal standard to improve precision and accuracy.” Ulrich Panne added, “This paper 100 defines for the first time a signal-to-noise approach to quantitative spectrochemical analysis and discriminates qualitative and quantitative analysis in a modern way.” Alexander Scheeline commented, “Gerlach 100 introduced the internal standard method to atomic emission spectroscopy, a principal means for suppressing sample uptake variance. The first place this is described in English is a translation 101 of a monograph by him and Schweitzer published in 1930. 102 ”
Theoretical principles of internal standardization in analytical emission spectrometry – (a) Barnett, Fassel, and Kniseley, 103 Spectrochim. Acta Part B, 23 (1968) 643–664; (b) Barnett, Fassel, and Kniseley, 104 Spectrochim. Acta Part B, 25 (1970) 139–161
This pair of articles103,104 on the selection of internal standards in analytical emission spectrometry is classic; the paper published in 1968 103 was recommended by José Broekaert, George Chan, WingTat Chan, and Elisabetta Tognoni.
José Broekaert's comments are: “The choice of elements that are useful as internal standards in view of the element and line properties for atomic emission spectrometry especially with an ICP are discussed. 103 The theoretical basis for the selection of internal standard elements and lines in optical emission spectrometry is described with reference to elemental ionization energies, line excitation energies, line oscillator strengths, and others.”
Likewise, Elisabetta Tognoni noted, “This article 103 is about the selection of the best internal standard (element and spectral line) for each analytical line to be used in quantitative analysis. The description of the plasma model is also very interesting to introduce to students.”
George Chan added, “This is a classic paper 103 discussing criteria for the selection of internal standards in analytical emission spectrometry. A total of nine criteria was listed and examined, in a theoretical approach, on a variety of changes in excitation source conditions on the efficacy of internal standardization. This paper 103 also helps to envision and understand the inter-relationships between the fundamental characteristics of the emission source, shift of emission line intensities, and physical characteristics of the element and the particular emission line.”
WingTat Chan expanded the discussion and noted, “The first article 103 discusses the effect of excitation energy, ionization energy, partition function, and electron number density on analytical line pair intensity ratios. The study 103 shows that simple matching of excitation and ionization energies is not sufficient for internal standard selection. The principles are further elaborated in the second article. 104 Spatial distribution of analyte in the ICP is identified as an important factor in internal standardization.”
Standard additions
Approach to and limitations of standard additions – (a) Bader, 105 J. Chem. Educ., 57 (1980) 703–706; (b) Welz, 106 Fresenius Z. Anal. Chem., 325 (1986) 95–101
Nicolas Bings, who recommended the article by Bader, 105 noted, “This paper 105 contains a thorough discussion of different types of standard addition methods, including isotope dilution analysis. Each of the presented methods is briefly explained and the corresponding mathematical equations for calculating the sample concentrations are given as well as their mathematical derivations. Very helpful!”
George Chan, who suggested the other article, 106 remarked, “Welz 106 listed several limitations of the standard addition technique which are often overlooked. One precaution that Welz 106 highlighted is that standard addition is effective only for multiplicative but not additive (e.g., spectral, contamination) interference, and the type of interference that is present should always be checked. Although the focus and examples given were on atomic absorption spectrometry, the arguments are valid for virtually all analytical techniques whenever standard addition is utilized.”
Estimating and optimizing precision in standard additions – (a) Larsen, Hartmann, and Wagner, 107 Anal. Chem., 45 (1973) 1511–1513; (b) Ratzlaff, 108 Anal. Chem., 51 (1979) 232–235
Nicolas Bings recommended the paper by Larsen et al., 107 and remarked, “In this paper, 107 the expected uncertainty in the case of standard addition calibration applying linear regression is discussed. The developed model is tested on the basis of two types of measured data: blank-corrected as well as non-corrected values. The authors 107 convincingly demonstrate that the developed model is applicable to both populations.”
George Chan recommended the article by Ratzlaff 108 and commented, “Whilst the principle and operation of standard addition are covered in many standard textbooks, the limitation, validity of domain (i.e., correct use and not abuse), and its effect on measurement precision, which all are of crucial practical importance, are seldom covered in much depth in textbooks but are discussed in these two papers.106,108 Ratzlaff 108 discussed the effect of standard addition on measurement precision and argued that the amount of ‘spike’ added to the sample should not be less than the original analyte concentration in the sample. This is a fine point that could be overlooked easily in standard addition. The concept of standard subtraction was also mentioned, 108 although it is seldom used in spectrochemical analysis.”
Data Handling, Processing, and Noise-Reduction Techniques in Spectrochemical Analysis
Signal-to-noise: overview and methods for noise reduction
Tutorial discussion of noise and signal-to-noise ratios in analytical spectrometry – (a) Alkemade, Snelleman, Boutilier, Pollard, Winefordner, Chester, and Omenetto, 109 Spectrochim. Acta Part B, 33 (1978) 383–399; (b) Boutilier, Pollard, Winefordner, Chester, and Omenetto, 110 Spectrochim. Acta Part B, 33 (1978) 401–416; (c) Alkemade, Snelleman, Boutilier, and Winefordner, 111 Spectrochim. Acta Part B, 35 (1980) 261–270
Nicoló Omenetto and James Winefordner jointly commented, “In our opinion, the entire analytical community has greatly benefitted from the fact that Kees Alkemade had a personal interest in ‘physical fluctuations phenomena’, which was one of his research programs at the University of Utrecht in The Netherlands. Such interest triggered the opportunity of closely collaborating with him on this and related physico-analytical topics. The first paper, 109 as well as the next two papers,110,111 represent some of the first detailed attempts of relating the LOD concept to the signal-to-noise ratio (S/N). The sources of noise for both additive and multiplicative noise, which affect shot and flicker noises at the LOD in both emission and luminescence methods, are discussed in a rigorous theoretical manner.”
James Winefordner further recounted, “I remember that in the late 1970s and early 1980s, IUPAC chose an LOD Committee whose members were Kees Alkemade, Heinrich Kaiser, Bourdon Scribner, Velmer Fassel and me to come up with an LOD IUPAC brochure. This was fun but a little intimidating for me, the youngest member of the Committee, to be with these giants of analytical spectrometry.”
As noted by Zhanxia Zhang, “In this two-part tutorial,109,110 the sources of noise, the mathematical representation of noise, and the major types of noises in emission and luminescence ratios of paired readings are discussed using the relation between the auto-correlation function and the spectral noise power in Part I 109 whereas general signal-to-noise expressions for emission and luminescence spectrometric systems are given in Part II. 110 Tables summarizing the expressions for signal-to-noise in the various cases and their comparisons are very useful.”
Peak integration versus peak detection – Voigtman, 112 Appl. Spectrosc., 45 (1991) 237–241
According to Igor Gornushkin, “Many analytical methods require using integrated signals, for example over a spectral or temporal signal profile. The paper by Voigtman 112 establishes the very useful rules for such an integration considering different types of signals and aiming at maximizing signal-to-noise ratio.”
Counting statistics
Noise in photoemission current – Fried, 113 Appl. Opt., 4 (1965) 79–80
George Chan commented, “This concise article 113 is important in understanding the factors that need to be considered in estimating the Poisson/shot-noise limit of a measured signal. It is common knowledge that shot noise is the square root of the number of primary photoelectrons or ions registered by the detector element and that a conversion factor is almost always required to account for the detector gain (i.e., to transform reported signal counts in analog-to-digital units, ADU, back to the fundamental number of photons or ions hitting the detector; see Sperline et al. 114 in this compilation). However, it sometimes can be very confusing why factors like ADU conversion are needed while some other factors like detector efficiency (e.g., quantum efficiency) or collection efficiency (e.g., solid angle for photon collection or skimmer efficiency for ions) need not be considered in the estimation of a shot-noise limit. For instance, I vividly recall a spirited discussion with three other labmates on a hypothetical situation. For a source emitting one million photons or ions but with the experimental apparatus able to collect and measure only one thousand of them, why is the Poisson noise based on the one-thousand collected primary particles but not the one-million particles emitted by the source (i.e., the shot-noise fluctuation of the source!). This paper 113 explicitly addresses the above query. Simply stated, quantum (or collection) efficiency is a random process and can be represented by a binomial distribution. The convolution of a Poisson and a binomial process is simply another Poisson distribution with a mean value equal to the product of the random hit-or-miss efficiency (e.g., quantum or collection) and the average number of incident primary particles hitting the detector. In marked contrast, the ADU conversion is not a random but a systematic process. There is no stochastic component in ADU conversion, and thus the gain of the amplifier circuitry after registration of the fundamental events needs to be corrected for estimation of the Poisson limit.”
Correlation
Correlation methods in chemical data measurement – Horlick and Hieftje, 115 in Contemporary Topics in Analytical and Clinical Chemistry Volume 3, Plenum Press (1978)
Paul Farnsworth remarked, “I believe that a modern analytical chemist should be equally comfortable working with signals in either the time domain or the frequency domain and should have a working mastery of the mathematical procedures that move between the domains. The book chapter by Horlick and Hieftje 115 is a readable and understandable introduction to the non-mathematician of correlation techniques and, by mathematical necessity, Fourier transforms. It provides a solid basis for the facility with signals that I consider to be essential. The concepts presented in the chapter aid in the understanding of line shapes from both conventional and Fourier transform spectrometers. They are essential in any discussion of modern infrared spectrophotometers, nuclear magnetic resonance (NMR) spectrometers, and mass spectrometers. They are critical for the understanding of signal processing instrumentation, both analog and digital. Although this chapter 115 is not the only attempt to cover correlation techniques and Fourier transforms for the analytical community, I found it to be the most accessible. My reading of the chapter directly influenced several experiments in my lab, one of which 116 is included in this compilation.”
Improved performance through signal correlation of internal standards – (a) Belchamber and Horlick, 117 Spectrochim. Acta Part B, 37 (1982) 1037–1046; (b) Myers and Tracy, 118 Spectrochim. Acta Part B, 38 (1983) 1227–1253; (c) Mermet and Ivaldi, 119 J. Anal. At. Spectrom., 8 (1993) 795–801
As discussed by George Chan, “These two papers,117,118 submitted by two independent groups at nearly the same time, documented some very early studies to investigate the importance of temporal signal correlation in improving the quality of analysis. Specifically, both groups117,118 studied signal correlation in internal standardization in ICP–AES with the use of two optical spectrometers for simultaneous measurements, which is essential for a good correlation. Belchamber and Horlick 117 studied correlation coefficients, obtained from the cross-correlation function at delay time τ = 0, for different combinations of emission lines from analyte and internal standard as well as Ar I lines. As negative analyte-signal correlations were found with Ar I lines, the team proposed the use of a multiplication function (instead of the common division) for internal standardization with Ar I lines. Myers and Tracy 118 showed that good noise correlation can be found only in cases with strong signals in both the analyte and the reference channels such that shot noise can be ignored. With signal correlation, measurement repeatability for ICP–AES was shown to improve to better than 0.1% RSD.”
José-Luis Todolí recommended the article by Mermet and Ivaldi 119 on this topic and explained, “The time correlation of the signals found for the analyte and an efficient internal standard 119 is a key point to increase the precision and the accuracy when internal standardization is used. The level of the shot noise is investigated and an artificial signal has been proposed as internal standard. This signal corresponds to a linear combination of signals from various elements dominated by flicker noise. It has been observed that the artificial signal improves the precision of the determinations over the scandium signal.”
Time correlation on background correction and improvement in limit of detection – (a) Chausseau, Poussel, and Mermet, 120 Spectrochim. Acta Part B, 55 (2000) 1315–1324; (b) Mermet, 121 Can. J. Anal. Sci. Spectrosc., 49 (2004) 414–422
This pair of articles120,121 was recommended by George Chan, who noted, “These two papers120,121 discussed the potential of using time correlation of background emission to improve limits of detection, with ICP–AES as an example. The approach is applicable to other atomic emission sources. The papers120,121 discussed in a straightforward and easy-to-understand way how background fluctuations can be reduced if time correlation in background emission is present and how the resultant LOD as well as LOQ can be improved. The results showed that correlation in the ICP background is present only for strong background wavelengths (e.g., visible) in which background fluctuations are dominated by flicker noise whereas for weak background wavelength regions (e.g., UV), the correlation is rather poor because the noise is shot-noise limited. The effect of signal integration time is one crucial factor and the flow chart presented in Figure 5 of the 2004 article 121 is useful and handy to understand the operation in different situations.”
Signal correlation in isotope ratio measurement: a special case of uncertainty propagation – Meija and Mester, 122 Spectrochim. Acta Part B, 62 (2007) 1278–1284
As noted by George Chan, “This paper, 122 in a simple and easy-to-digest approach, demonstrates how correlations in isotopic signals in mass spectrometry affect the propagation of random uncertainties in isotope-ratio measurements. Three different mass spectrometers – quadrupole, time-of-flight, and multi-collector – respectively representing sequential, quasi-simultaneous, and truly simultaneous instruments were used as examples. These three spectrometers exhibited vastly diverse signal correlation coefficients and hence the uncertainties in determined isotope ratios. 122 Another very critical but often overlooked point in uncertainty propagation in isotope ratio measurements, namely the fact that the abundance/content of one isotope and the other are anti-correlated because the sum of all isotopic fractions need to be at unity, was also discussed in the article. 122 Error propagation in isotope ratio measurement is a special case.”
George Chan continued, “From the foregoing discussion, it appears that quadrupole-based ICP–MS would not be able to compete with multi-collector instrument for isotopic analysis. Perhaps another important point to note is that analytical chemistry is a fit-for-purpose discipline and it is seldom the case that there is only a single constraint or criterion. A good example here is a triple-quadrupole mass spectrometer; although still sequential in nature, it offers improved abundance sensitivity and hence provides better measurement of isotope ratios at very low signal levels. For a quadrupole mass analyzer, abundance sensitivity is typically in the range of 10−6 to 10−7, 123 and for two quadrupole mass selectors used in tandem (referred to as MS–MS mode), the abundance sensitivity is generally lower than 10−10,123,124 which is better than that offered by ICP–multi-collector MS (typically 10−8). Accordingly, an ICP–triple-quadrupole MS is capable of measuring isotope ratios at levels of 10−9 and below, for example as in 236U/238U.124,125”
Time- and frequency-domain treatment of analytical data
Fourier transform (FT) approaches to spectroscopy – Horlick, 126 Anal. Chem., 43 (1971) 61A–66A
As commented by Stanley Crouch, “This paper 126 discusses the principles of Fourier transformation and the fast Fourier transform. Applications of the FT approach to analytical spectroscopy methods are discussed.” Alexander Scheeline added, “While Fourier methods had become common in infrared spectroscopy, electrochemistry, and NMR in the 1960s, such methods were not common in visible or ultraviolet analytical spectrometry prior to Horlick's work. This paper 126 hinted at what was to come.”
Linkage between time and frequency domain to improve data quality – (a) Hieftje, 127 Anal. Chem., 44 (1972) 81A–88A; (b) Hieftje, 128 Anal. Chem., 44 (1972) 69A–78A; (c) Horlick, 129 Anal. Chem., 44 (1972) 943–947
As noted by Michael Webb, “These three papers127–129 deal with improving the quality of data. A common thread is the link between time-domain and frequency-domain information, and the reader would do well to observe how similar principles can be applied to digital and analog applications. Although it applies across much of analytical chemistry, it is important background for an analytical atomic spectroscopist.”
Nicolas Bings added, “Excellent discussion on the fact that a consideration of a number of simple techniques which enables better signal collection can result in improved analytical performance of the method. Possible trade-offs between integration time, sensitivity, and resolution are explained in this two-part tutorial.127,128”
Data fitting and smoothing
Least-squares regression – (a) Wentworth, 130 J. Chem. Educ., 42 (1965) 96–103; (b) Wentworth, 131 J. Chem. Educ., 42 (1965) 162–167; (c) York, 132 Can. J. Phys., 44 (1966) 1079–1086; (d) Irvin and Quickenden, 133 J. Chem. Educ., 60 (1983) 711–712
Comments from Nicolas Bings on this cluster of articles are: “Wentworth 130 presents the theory for general least squares fitting to nonlinear equations and discusses pitfalls and advantages of using a computer to solve the mathematical equations. In the second part of this paper, 131 this model is applied to examples from physical chemistry, such as the determination of the rate constant and the order of reaction in the case of the decomposition of acetaldehyde. In my view, they are interesting papers describing a general approach to curve fitting by the method of least squares with the aid of a computer. However, it should be noted that these manuscripts130,131 are somewhat difficult to read due to the extensive mathematical derivations.”
Bings continued, “The way of performing least-squares fitting in the case in which both the x and y coordinates have substantial uncertainty is treated in these two very readable articles.132,133 Whenever measurements are made, it is indeed not always true that a straight line fitted to experimental data by the method of least squares results in y-values containing all the error in each data pair. In many cases the error of the x-values has to be considered, too. York 132 outlines that otherwise fitted slopes can deviate significantly from the correct values. However, in the field of applied sciences, the literature rarely provides practical advice on how to correctly handle least squares calculations in such cases. To my knowledge, Irvin 133 first outlined under which circumstances conventional linear least squares treatment can still be used. More interestingly, he suggested a routine for linear least squares treatments in cases when significant errors exist not only in the y- but also in the x-values.”
Savitzky–Golay smoothing filters – Savitzky and Golay, 134 Anal. Chem., 36 (1964) 1627–1639
As remarked by WingTat Chan, “The article 134 introduces two techniques of numerical processing of experimental data, namely, differentiation and filtering of noise, which was timely for the scientific community at the dawn of the computer age. The filtering technique is the famous Savitzky–Golay smoothing. The article explains the principles and provides sets of integers for rapid least-squares calculation of curve fitting and differentiation of experimental data. Two subroutines written in FORTRAN, which was then the prevailing computer language for data processing, are given to show the implementation of the methods. Examples of the application of the numerical methods to the processing of spectroscopic data are given. The authors also put forward an approach of combining repeated measurements (averaging) and least-squares curve fitting (smoothing) to efficiently improve signal-to-noise ratios.” Readers of the original Savitzky–Golay paper 134 should be aware of two commentary articles,135,136 in particular the one by Steinier et al., 135 who pointed out some numerical errors in the original paper.
Signal-to-noise enhancement by polynomial smoothing – Enke and Nieman, 137 Anal. Chem., 48 (1976) 705A–712A
Nicolas Bings commented, “This manuscript 137 addresses noise and the complexity it adds to the measurement step. As an alternative to conventional techniques to limit the noise level, numerical methods are presented to ‘massage’ the data for additional noise reduction. The authors attempt to clarify the capabilities and limitations of the least-squares polynomial smoothing process and to aid in the selection of the optimum smoothing parameters.”
Interpolation of sampled spectral signals by means of the Fourier transform – Horlick and Yuen, 138 Anal. Chem., 48 (1976) 1643–1644
George Chan noted, “This paper 138 describes a very useful method of signal interpolation, namely zero-filling in the Fourier domain. The ability to obtain a smooth, interpolated signal from a limited number of measurement data points (e.g., a spectral peak measured with a discrete array detector like a charge-coupled device, CCD) is very important for some applications in spectrochemical analysis, and zero-filling can interpolate the measured spectral profile and increase the number of data points for smoothing purposes. 138 ”
Fundamentals of Spectrophysics and Plasma Physics
Absorption and self-absorption of spectral lines
Here and in later sections, the term “curve(s) of growth” is used frequently. For those unfamiliar with this important concept, a curve of growth can be viewed as being akin to a “calibration” or “analytical” curve, basically a plot of signal on the vertical axis and concentration on the horizontal. However, a curve of growth is expressed in fundamental terms, with the signal axis, be it emission, absorption, fluorescence, or whatever, given in basic units and constants and the horizontal axis expressed in absolute atom concentration. Further, a log–log plot is employed. Clearly, generating an experimental curve of growth requires a full instrument calibration; the benefit is that it can be compared with theoretical expectations.
Duplicating curve and duplicating mirror to evaluate self-absorption effects – (a) Gouy, 139 C. R. Hebd. Seances Acad. Sci., 83 (1876) 269–272; (b) Gouy, 140 C. R. Hebd. Seances Acad. Sci., 88 (1879) 418–421; (c) Moon, Herrera, Omenetto, Smith, and Winefordner, 141 Spectrochim. Acta Part B, 64 (2009) 702–713
The above publications by Gouy,139,140 written in French, are suggested by Nicoló Omenetto, who pointed out that “They were endorsed by physicists and analytical spectroscopists as being basic, seminal papers dealing with a theoretical discussion and experimental work describing the characterization of flames as atomic and molecular emission sources of radiation, in particular the spectrometric determination of absolute metal concentrations in such flames (the so-called colored flames).
“Particular attention was paid to the so-called duplication curves,139,140 strictly related to curves of growth, in which doubling the total number density of the atoms had the same effect as doubling the oscillator strength of the transition or the thickness of the flame: as Gouy first reported as early as 1876 139 and with more details in his 1879 work, 140 the duplication factor could be measured by placing an identical flame behind the original flame, or, in his own words ‘by measuring the increase in intensity of the chosen line when the thickness of the homogeneous emitting layer was doubled’. 139 Because of experimental problems in duplicating the homogeneity of the second flame, Gouy suggested the use of a ‘duplicating mirror’ placed behind the original flame at a position in which emission from the same part of the flame could be observed both directly and after reflection from the mirror.139,140 As Gouy pointed out, when the above scheme was implemented, the reflected rays will encounter the flame in the same region where such rays were emitted. The characterization of self-absorption139,140 in flames and other plasma emission sources later benefitted considerably from the use of such a mirror arrangement. 141 ”
Elisabetta Tognoni noted, “Although this article 141 is not the first paper on its topic, it is extremely clear and therefore useful.” Vincenzo Palleschi agreed and added, “To quantify and compensate for self-absorption in LIBS analysis, the above paper 141 suggests the use of an old but effective method, used for characterizing the emission of flames, which uses a mirror to duplicate the optical path of the light in the plasma. The comparison between single and double pass signal allows the precise determination of the self-absorption of each emission line in the LIBS spectrum.”
Nicoló Omenetto and James Winefordner continued the discussion and jointly elaborated, “This work 141 is the first example of practical application to detection and correction of self-absorption effects in laser-induced plasmas with a spherical mirror following the protocol described by Konjević. 142 The usefulness of the correction was demonstrated by the improved linearity of the Saha–Boltzmann plots and especially of the calibration curves for neutral and ionic lines of Mg. The authors 141 argued that the procedure could also detect the presence of potential spectral interferences. Overall, several drawbacks were also clearly pointed out. For example, only ‘line-of-sight averaged’ measurements are obtained, plasma expansion sets a limit to the duplication of the original plasma volume and measurements are taken sequentially, thus interrogating essentially different plasmas. It is worth noting that the original idea of using a mirror dates back to the work of Gouy in 1876 139 and the use of the so-called ‘duplication curves’.139,140 Another example of Gouy's work is listed in Section 4.8 of this compilation.”
Influence of the ratio of spectral-line profile and line width of the emission source to those of the absorption line on optical absorption – Zemansky, 143 Phys. Rev., 36 (1930) 219–238
As remarked by George Chan, “This paper by Zemansky 143 – co-author of the classic book Resonance Radiation and Excited Atoms 144 – is one in a series of works by Zemansky on theoretical and experimental aspects of absorption of spectral-line radiation. This particular paper is chosen here because it deals with two situations that are particularly common in absorption work. Specifically, it discusses optical absorption as functions of (a) the ratio of emission-to-absorption line widths, and (b) the ratio of Lorentzian-to-Gaussian widths of the absorption line. The first scenario, which is covered in most textbooks on instrumental analysis or analytical chemistry in a qualitative way, is the well-known fact that for atomic absorption measurements, the line width of the emission source should be narrower than that of the absorption profile, or else both measurement sensitivity and linearity suffer. This paper 143 discusses the problem quantitatively and derives mathematical expressions in integral as well as in series-expansion forms. Table I and Figures 2 and 3 therein 143 clearly present the negative influence on fractional absorption value when the line width of the emission source (ΔνE, expressed in frequency) becomes large with respect to that of the absorption line (ΔνA). The equation is useful when one wants to determine the line width of the emission source through the absorption curve-of-growth. An example is provided in the paper and another example can be found in the discussion of optical isotopic analysis with atomic absorption spectrometry 145 in Section 17.4 of the present paper. The second scenario is related to the change in absorption coefficient when collisional (i.e., Lorentzian) broadening is superimposed on Doppler broadening. Although collisional and Doppler broadenings are specifically referred to in the paper, 143 the situation can in fact be generalized to the ratio of Lorentzian-to-Gaussian widths (more commonly referred to as the damping parameter). A mathematical expression is given and Table IV of the paper 143 reveals the dramatic decrease in absorption coefficient at the line center as the Lorentzian component gradually increases. Other situations (e.g., absorption at the edge of a line, absorption with overlapping components) and important aspects of line absorption can be found in the classic Mitchell and Zemansky book. 144
“The term resonance radiation perhaps needs a bit of discussion; it refers to re-emission of absorbed radiation without a change in wavelength. The Hg resonance lamp used in this work 143 was popular then. It is a very clever way of obtaining narrow Hg emission lines from cold Hg vapor. In principle, the narrow line width is achieved through fluorescence. The lamp, in essence, is a Hg-atomic vapor fluorescence cell with excitation from a hot source (e.g., Hg arc). The cold Hg vapor in the cell absorbs the light from the spectrally broader excitation source and re-emits a narrower line. The width of this re-emitted Hg line is governed by the environment (e.g., temperature and pressure) inside the cell. Through collection of the re-emitted light at an angle, typically 45° or 90°, with respect to the excitation source, a narrow line can be obtained.”
Self-absorption of spectrum lines – Cowan and Dieke, 146 Rev. Mod. Phys., 20 (1948) 418–455
As commented by Benjamin Smith, “This paper 146 is the seminal 20th century reference on self-absorption and its relevance to analytical spectrochemistry. The authors point out in their introduction that only two previous papers have treated the subject theoretically and these were brief and considered extreme cases. Cowan and Dieke provide in this paper 146 a complete general theoretical discussion of self-absorption backed up with original quantitative experimental results as well as comprehensive results from the literature. The paper includes a good discussion of line broadening and emphasizes the importance of self-absorption to the shape of the analytical calibration curve.”
Nicoló Omenetto and James Winefordner jointly remarked, “This paper 146 is the classic paper presenting in detail a theoretical treatment of self-absorption, self-reversal and associated line profiles – not to be missed by those interested in the physical aspects and detailed theoretical derivation of the basic formulas describing the relationship between a signal and the number density of emitting/absorbing atoms. The paper, published in 1948 and based on the PhD dissertation of R.D. Cowan at John Hopkins University in 1945, refers to literature published in the 1920s and also to the classic flame experiments of Gouy. 33 In the previous literature, however, the theoretical side of the problem, in particular the onset of self-reversal, was not tackled. The reason was that the emission sources considered were homogeneous, and in this case, self-reversal could not have occurred. Indeed, uniformly excited sources are easily recognizable in that a high degree of self-absorption does not result in reversal but only in flat-topped, apparently broadened spectral lines. The article 146 paved the way to a rich literature on the subject in astrophysics and spectroscopy journals.”
Beer's Law and the optimal transmittance in absorption measurements – Hughes, 147 Appl. Opt., 2 (1963) 937–945
As explained by WingTat Chan, “It has been well known since the 1930s that the optimum analytical precision of absorption measurements is obtained at transmittance of 1/e or 36.8%. The author 147 expands the discussion to include various measurement methods, such as double-beam measurement with solvent as reference, double-beam measurement with a standard solution as reference (the transmittance ratio method), and single-beam measurement. The influence of the source, background, noise, and counting time on the precision of a transmittance measurement was discussed in detail. 147 The optimum transmittance is derived for a range of scenarios and is given in a table. The ten assumptions of Beer's law measurement are also discussed, which is rarely treated in such detail in analytical chemistry textbooks. Figure 2 therein 147 is a classic and can be found in standard analytical chemistry textbooks.”
Gary Hieftje commented, “Truly a classic paper 147 that clarifies a formerly misunderstood assertion – that the optimal transmittance in absorption measurements lies at 36.8% T. This value is the result of assuming a constant reading error in transmittance (e.g., from a meter or strip-chart recorder reading). When a logarithmic detector or algorithm is employed, or in many other modern situations, the assumption is no longer valid.”
Alexander Scheeline added, “After the work of Ingle and Crouch, most easily accessed either in Spectrochemical Analysis 59 or Rothman, Crouch, and Ingle, 148 this paper 147 becomes an example of how an old, incomplete approach can have counterproductive long-term influence. There is no need to focus on 36.8% T in a world where readout granularity is seldom what limits precision. Greater focus on sample-cell positioning, dark noise, and lamp flicker would better serve the modern practitioner.”
Beer's Law with transient absorption cells and sources – Piepmeier and de Galan, 149 Spectrochim. Acta Part B, 31 (1976) 163–177
Nicoló Omenetto and James Winefordner jointly summarized the key point of the article by Piepmeier and de Galan 149 as “A scientific authoritative presentation of the behavior of analytical absorption curves and Beer's law to be expected when transient, rather than stationary, effects are considered. It therefore fills a very important gap which will be appreciated by all those involved in the interpretation of the shapes of absorption curves of growth that are obtained. It is important that the authors include in their treatment the temporal response of the detector, in addition to pulsed source spectral and time-resolved profiles and pulsed atomizers (e.g., graphite furnaces), thus providing a complete overview of the signal detection expected in each of the nine cases treated. The merit of this paper 149 goes well beyond the strict mathematical accuracy of the derivation of the interplay between the different components of the analytical chain (sources, atoms reservoirs, detectors), making this article highly recommended reading.”
Relationship between integrated radiance, self-absorption factor, and optical depth – Omenetto, Winefordner, and Alkemade, 150 Spectrochim. Acta Part B, 30 (1975) 335–341
James Winefordner suggested this article 150 and explained its importance as “A very basic, simple derivation of the theoretical dependence of the integrated radiance of an atomic transition (thermal emission and fluorescence) as a function of the total number density of emitting atoms in flames and plasmas and the (unitless) parameters self-absorption factor and optical depth. The analytical relation between thermally emitted radiation and number density is treated exhaustively in the recent literature, in particular describing the ‘curves of growth’ in laser-induced breakdown spectroscopy. Most literature calls the self-absorption parameter ‘self-absorption coefficient’ (which should strictly have units of reciprocal length!).
“The important message is that the above-cited paper 150 clearly stresses the biunivocal (one-to-one) correspondence between the term (−1) appearing in the denominator of the Planck radiation law and the net absorption coefficient, given by the difference in the population of both levels involved, meaning that stimulated emission is exactly taken into account.
“This can be verified by deriving the general expression for the spectral radiance of the outgoing radiation along the observation direction and taking into account an exponential attenuation of the atomic radiation due to the net effect of self-absorption and stimulated emission. In view of the negligible population of the excited state in comparison with the lower energy state in most practical cases, neglecting stimulated emission is justified, with the consequence that the term (−1) in the Planck expression can be neglected. In this case, the spectral radiance is given by the Wien law. As a result, theoretical consistency demands the Planck expression to be replaced by the Wien expression to describe the blackbody radiation limit.”
Clarification and interpretation of the Friedjung–Muratorio self-absorption curve method – Kastner, 151 Astron. Astrophys., 351 (1999) 1016–1020
Nicoló Omenetto recommended this article 151 to emphasize the strict analogy between the spectroscopic basis of astrophysical research and that underlying the analytical description of the so-called curves of growth of atomic/ionic emission of species excited in atmospheric-pressure flames and plasmas. Nicoló Omenetto stated, “A cursory inspection of the titles of the key papers collected in Section 7 validates the above statement. Terms like self-absorption curve and escape probability factors of spectral lines emitted by species of astrophysical interest have similar significance as the terms used in the curves of growth literature. The self-absorption curve acronym was used by Friedjung and Muratorio in their original paper. 152 More specifically, in the above paper, 152 the authors define self-absorption curve as ‘the observational plots of a quantity related to the line flux emitted in a transition versus the optical thickness of that transition’. The self-absorption curve is then a kind of curve of growth applied to emission lines.
“In his paper, Kastner 151 addresses specifically the self-absorption effect present in optically thick sources by introducing the term photon escape probability. Using his words, in the case of an optically thick source, the mathematical expression used for an optically thin uniform source must be multiplied by an appropriate monodirectional photon escape probability term, defined as the ratio of the photon flux emerging from the optically thick source to the flux that would emerge if the source were optically thin. Another example pertinent to self-absorption and worth mentioning involves the definition of the duplication factor curve which has been used to characterize self-absorption in the curve of growth methodology. The definition recalls the use of a mirror (see Gouy's works cited in Section 7.1.1) suitably placed behind a homogeneous flame source and the significance of the results given by measurement of the signals obtained with and without the mirror.
“A final important consideration was emphasized by Kastner, 151 who pointed out that many of the lines or multiplet components studied have profiles which cannot be simply described by pure Doppler profiles, but rather by the convolution of Doppler and Lorentz profiles (namely by their Voigt profiles). The consequence is that their resulting escape probabilities and therefore their self-absorption curves will be slightly different. Kastner has therefore suggested that, because of this complexity, the method of self-absorption curve might profitably be applied to more well-defined laboratory emission sources, and to spectra which can be more accurately measured than astronomical spectra: the case of very precise measurement of Fe II lines emitted by a glow-discharge source was an example cited. 153
“As a final comment, as stated by Kastner, 151 his paper was triggered by the following comment made by one of the proposers (Friedjung) of the original method, who stated that: ‘…unfortunately, such method had not been sufficiently studied by colleagues.’”
Use of self-reversed line for temperature measurement – Gornushkin, Omenetto, Smith, and Winefordner, 154 Appl. Spectrosc., 58 (2004) 1023–1031
As remarked by James Winefordner, “This paper 154 is one of the few that takes advantage of, rather than correcting, the presence of self-reversal in some Ba II lines to calculate the maximum temperature in the center of the non-uniform light source. The theory behind the method was described before in the literature by Bartels155,156 in 1949 in the description of an inhomogeneous, optically thick plasma. The paper 154 merits reading for the description of the clever modification of the spectrometer realized by Gornushkin, which consisted in using the zero order of the first grating as the incident beam of a second grating added at a pre-determined position in such a way that both spatially separated diffracted images would be recorded on the camera. The arrangement allowed the simultaneous observation of a series of dual-wavelength plasma images at different delay times along the entire persistence of the transient laser-induced plasma.”
Cavity enhanced plasma self-absorption spectroscopy – Walsh, Zhao, and Linnartz, 157 Appl. Phys. Lett., 101 (2012) 091111
Nicoló Omenetto explained the importance of this work 157 as “an appealing idea for plasma self-absorption diagnostics: having the plasma under investigation located in an optically stable cavity consisting of two high-reflectivity mirrors. The mirrors trap the light in the cavity and enhance the self-absorption (and self-reversal) features because of the multiple passes (104 to 105) through the plasma. The effect is similar to what is realized in laser cavity-ringdown absorption spectroscopy but without the use of an external emission source. Light leaking out of the cavity provides emission and absorption features simultaneously. The authors 157 state that the approach combines ‘sensitivity and simplicity’ and show proof-of-principle results obtained with a supersonically expanding hydrocarbon plasma. Applications to atomic emission/absorption experiments are still lacking, however.”
Curve of growth fundamentals
Theory and shape of analytical curves – (a) Hooymayers, 158 Spectrochim. Acta Part B, 23 (1968) 567–578; (b) Zeegers and Winefordner, 159 Anal. Chem., 40 (1968) 26A–47A
The article by Hooymayers 158 was jointly recommended by Nicoló Omenetto and James Winefordner, who commented, “This paper 158 can be considered as the first detailed theoretical discussion of the shape of atomic fluorescence curves of growth valid for both line and broad continuum spectral sources of excitation. It is based on the thesis work of the author performed at the University of Utrecht (1966). The mathematical treatment includes essential fluorescence parameters like self-absorption and quantum (power) fluorescence yields, and atomic absorption which include both Doppler (temperature) and collisional broadening effects. The atom reservoir is a flame, but its general use can be extended to other stationary atomic vapor cells. It is interesting to find that the atom concentration is derived using the Van Trigt ‘combinatory method’, which is actually a combination of the ‘duplication method’ and the ‘curve-of-growth’ method. The article 158 cannot be missed by anyone interested in atomic fluorescence as an analytical technique.”
Nicoló Omenetto summarized the key point of the article by Zeegers and Winefordner 159 as “a classical tutorial presentation of the shapes of analytical curves obtained for flame atomic reservoirs using the physical processes of emission, absorption and fluorescence. The limiting cases of low and high optical density are given for all analytical methods, reflecting previous theoretical conclusions. Taking for granted that the shape of the curves of growth is the predominant factor in dictating the shape of the analytical curves, the authors point out that there are a number of factors that cause analytical curves to deviate from the shapes predicted by the theory. A noteworthy feature of this article 159 is the examination of the response of the total number density of emitting, absorbing and fluorescing species to changes in the vaporization dynamics, aspiration and nebulization efficiencies, dissociation and ionization equilibria, and even lateral diffusion of analyte atoms and compounds, keeping in mind that these changes are affected by the concentration of the solution aspirated into the flame.”
Plasma diagnostics with emission and fluorescence curve of growth – Omenetto, Nikdel, Bradshaw, Epstein, Reeves, and Winefordner, 160 Anal. Chem., 51 (1979) 1521–1525
Nicoló Omenetto and James Winefordner recommended this article 160 and discussed, “This paper 160 proposes for the first time another way of investigating self-absorption and self-reversal effects in emission sources. The theoretical knowledge needed is the basic limiting behavior of the slopes of the emission and fluorescence curves of growth for spectrally narrow (‘line’) and spectrally broad (‘continuum’) excitation sources. In the cases described in the paper, 160 the excitation source is an ICP and the fluorescence cell is a flame. Solutions of different elements, and at different concentrations, can be aspirated into either source. An ICP emission curve of growth is obtained by measuring the emission signal for various solution concentrations in the ICP, a fluorescence curve of growth is obtained when the concentration in the flame is varied and that in the ICP is fixed, and finally an excitation curve of growth is obtained when the concentration in the flame is fixed and that in the ICP is varied. Comparison of the shapes for all different cases allows not only characterization of the onset and severity of self-absorption effects, but also the unequivocal onset of self-reversal, which changes the zero slope of the excitation curve to a negative slope. As a side observation of the above experiments, the authors 160 noted that the fluorescence detection limits obtained with ICP-excited flame fluorescence were similar to or within an order of magnitude of those obtained by conventional excitation of fluorescence with an electrodeless discharge lamp. They therefore concluded that the ICP was a very useful, versatile excitation source that could be used in selected, specific applications of analytical atomic fluorescence experiments: this was demonstrated in a subsequent publication. 161 ”
Temporal characterization of plasmas with curve-of-growth method – (a) Aguilera and Aragón, 162 Spectrochim. Acta Part B, 63 (2008) 784–792; (b) Aguilera and Aragón, 163 Spectrochim. Acta Part B, 63 (2008) 793–799
This pair of articles162,163 was jointly recommended by Nicoló Omenetto and James Winefordner, who summarized, “These two authors,162,163 working in the Department of Physics of the University of Navarra in Pamplona (Spain), have to be credited for several seminal contributions to the diagnostic aspects of laser-induced plasmas. Their critical insight and interpretation of the two most often reported plasma parameters, i.e., temperature and electron number density, both time-averaged and time-resolved, have advanced the understanding of the behavior of other related parameters; for example: plasma morphology, self-absorption of atom and ion emission lines, and their dependence upon experimental parameters, e.g., laser energy and focusing characteristics. The above papers162,163 have set a clear example of how analytical data (curves of growth) can benefit from a sound theoretical understanding of the relations between the plasma parameters and the spectral data emitted from both atoms and ions.”
Local thermodynamic equilibrium (LTE)
Validity of LTE in plasma spectroscopy – (a) Griem, 164 Phys. Rev., 131 (1963) 1170–1176; (b) McWhirter, 165 Spectral intensities, in Plasma Diagnostic Techniques, Academic Press (1965)
Alessandro De Giacomo expressed that “Among many papers published during the 1960s that were devoted to the criteria for assuming LTE in plasmas, this paper by Griem, 164 for the first time includes, with a detailed investigation of the criterion based on electron number density, the effect of time-dependent electron temperature in transient plasmas.”
Jin Yu shared an additional view and commented, “In this reference, 165 the famous McWhirter criterion for LTE is given and discussed. Such criterion sets the lower limit on the electron number density of a plasma for its LTE state being considered. This criterion is often used in LIBS for the establishment of the LTE state in a laser-induced plasma.”
George Chan noted, “Griem, 164 McWhirter 165 and several others (for example, see references166–168) proposed criteria for the minimum electron number density necessary to attain the LTE condition. These criteria have slightly different numerical values but all are based on the electron number density that is needed for the rate of electron-collision processes to dominate over radiative ones, in particular over radiative emission. Because different elements have unique radiative emission characteristics (i.e., energy levels), the minimum electron number density is thus a function of the element and the ionization state (the system) under consideration (e.g., Cu I and Cu II would have different minimal electron number density requirements). As such, most of these criteria contain a ΔE term as an input parameter based on the energy levels of the system.
“A common point of confusion is what ΔE value should be used; other areas of confusion are discussed in Section 7.3.3. First, the rates of collisional processes drop rapidly as the energy gap increases. In other words, the larger the energy gap between two adjacent levels, the more difficult it is for these two levels to attain a collision-dominated condition. Second, the deviation from LTE is through radiative emission. Accordingly, one should refer only to dipole-allowed transitions. Third, unless specified as partial-LTE, one customarily refers to LTE as a state applicable to all energy levels of the system (i.e., all the energy levels from the ground state to its ionization limit). In fact, a typical reason why one needs to test if the LTE assumption holds for a plasma is that one would like to extend a measured plasma parameter that is based only on a small set of energy levels (e.g., excitation temperature) to the whole system. To elaborate, in the absence of LTE, the excitation temperature inferred by the ratio of two emission lines is applicable only to the two upper energy levels under measurement. Only if LTE exists can the excitation temperature be extended to the whole system. Therefore, it immediately follows that the ΔE value to be used in the criterion should not be the largest ΔE value among the experimentally measured lines, but should be the largest ΔE between two adjacent levels (i.e., closest in energy) that are connected by dipole-allowed transitions in the whole system. In many cases, because the gaps between adjacent levels become smaller climbing the energy-level ladder, the two levels for ΔE will likely be the lowest-energy resonance transition of the system.”
Nicoló Omenetto elaborated, “The McWhirter formula 165 derived from his semi-classical treatment for the cross section requires that the electron number density be greater than 1.6 × 10¹² (T)1/2 (ΔEnm)3 for LTE to prevail. Note that in this version of the McWhirter formula, T is expressed in K and (ΔEnm) in eV.
“Among the above terms, (ΔEnm) requires some elaboration. In particular, in order to assure that the plasma is in LTE, the above expression must hold for the largest ΔEnm gap between adjacent levels. If so, and if the couple of adjacent levels m, n and n, p are in thermal equilibrium, the same holds for the non-adjacent m, p levels (see Section 7.3.3 below). In a separate paper, 169 a useful table of ΔE values is provided that should be inserted in the McWhirter criterion for seven metals and seven non-metals.
“Another important caveat is that the criterion was derived for and should be applied only to homogeneous and stationary (i.e., time-invariant) plasmas: if such conditions are not satisfied, the criterion becomes a necessary but not sufficient condition to insure LTE. What this implies is that, if the criterion is not satisfied, LTE surely does not exist, while if it is satisfied, LTE might exist but no positive assertion can be made, and additional tests should be performed. More discussion on this and other points of the McWhirter criterion can be found in Section 7.3.3. However, I would like to make a final comment and repeat the last sentence in the abstract of paper 169 that ‘the mere use of the McWhirter criterion to assess the existence of LTE in laser-induced plasmas should be discontinued.’”
Overview of various equilibria in plasmas and their classifications – (a) van der Mullen, 170 Spectrochim. Acta Part B, 44 (1989) 1067–1080; (b) van der Mullen, 171 Spectrochim. Acta Part B, 45 (1990) 1–13; (c) van der Mullen and Schram, 172 Spectrochim. Acta Part B, 45 (1990) 233–247; (d) van der Mullen, 173 Phys. Rep., 191 (1990) 109–220
As noted by Igor Gornushkin, “van der Mullen 170 addressed processes in ICP occurring on the elementary level in the most tutorial manner. This work is excellent for understanding why or why not local thermodynamic equilibrium (LTE) can be reached in ICPs.” Elisabetta Tognoni shared a similar view.
Jin Yu opined, “The purpose of the paper 171 was to study the effect of departures from the thermodynamic equilibrium of the atomic state distribution function in plasmas. A particular case corresponds to the LTE considered as the first stage of equilibrium departure, in which the atomic state distribution function can still be given by the Saha–Boltzmann relation. In more detail, LTE is defined as the stage of thermodynamic equilibrium departure in which the Planck equilibrium is no longer valid but all other balances (i.e., Maxwell balance, Boltzmann balance, and Saha balance) are locally in equilibrium. In such a stage, moderate gradients of density and temperature can be allowed and the plasma parameters have to be considered and determined locally.”
The importance of the tutorial articles published in Spectrochimica Acta Part B170–172 was elaborated by George Chan: “This set of three tutorial reviews170–172 discusses the fundamentals of the atomic state distribution function and the various types of thermodynamic equilibrium in plasmas in general. Although the example given therein was the ICP, the treatment and argument are generally applicable to other types of analytical plasmas. The tutorial is very suitable for teaching and self-learning as it was written in an easy-to-digest tone without excessive mathematical equations (but supplied whenever needed). The tutorial170–172 is particularly good in clarifying ambiguities and misconceptions, distinguishing reality from fiction concerning LTE, reiterating conditions and requirements for different equilibria, and explaining the important but subtle differences between some similarly worded, easy-to-confuse terminologies. Examples are the differences between ‘balance’ versus ‘equilibrium’, ‘elementary level – a process balance’ versus ‘macroscopic level – a reaction balance’, and ‘detailed balance’ versus ‘microscopic reversibility’. The tutorial170–172 also offers a detailed and easy-to-understand explanation of how material transport affects equilibrium levels and drives LTE away. A very important point highlighted in the tutorial is that a criterion based solely on electron number density being higher than a critical value (e.g., the Griem criterion or the like) is only a necessary, but not a sufficient, condition to guarantee the existence of LTE.”
The paper published in Physics Report 173 is an extensive review on this topic. Comments from Alessandro De Giacomo are: “This review paper 173 is a work that all scientists who deal with plasmas should read, because it gives a modern classification of plasmas, based on thermodynamic and kinetics considerations. While traditionally plasmas have been grouped into two categories, namely ‘cold plasmas’ and ‘thermal plasmas’, this paper clearly shows the inadequacy of this classification and disseminates a new (at that time) and complete classification of plasmas based on progressive deviations from thermal equilibrium.”
LTE beyond the McWhirter criterion – Cristoforetti, De Giacomo, Dell'Aglio, Legnaioli, Tognoni, Palleschi, and Omenetto, 169 Spectrochim. Acta Part B, 65 (2010) 86–95
Although the focus of the discussion of this paper 169 is on LTE requirements beyond the McWhirter criterion specifically for laser-induced plasmas, the argument is fundamental and applies to other plasmas. Accordingly, several scientists, including Annemie Bogaerts, Alessandro De Giacomo, Igor Gornushkin, David Hahn, Vincenzo Palleschi, Elisabetta Tognoni, and Jin Yu recommended this work.
The importance of this paper, 169 as concisely summarized by Annemie Bogaerts, is that it contains a “critical discussion on the statements commonly made in literature on the existence of LTE in laser-induced plasmas.” David Hahn commented, “This important paper 169 carefully examines the assumptions of LTE in laser-induced plasmas in the context of the often used Boltzmann and Saha equations, succinctly summarizing the necessary but not sufficient conditions to ensure LTE.” Elisabetta Tognoni added, “In this paper, 169 the conditions required for LTE fulfillment are discussed in particular for LIBS, so that specific issues such as the transient nature or the spatial inhomogeneity of the laser-induced plasma emerge with evidence.”
Vincenzo Palleschi explained, “A check of the LTE approximation in plasmas is usually done by assessing the validity of the McWhirter criterion, which gives the lower limit for the electron number density that allows neglecting energy losses due to radiation, in the time needed for the other processes to reach equilibrium. However, fulfillment of the McWhirter criterion is sufficient only for homogeneous and stationary plasmas (while LIBS plasmas are non-stationary and inhomogeneous). The additional criteria for justifying the use (and avoiding the misuse) of the above criterion applied to LIBS plasmas are discussed in the paper. 169 ” Igor Gornushkin shared a similar view.
Jin Yu indicated, “The considerations in the paper 169 provide supplementary conditions necessary to ensure an LTE state for laser-induced plasma. Corresponding theoretical relations are proposed, to a first approximation, to complete the application of the McWhirter criterion. Experimental examples are used to illustrate the use of these complementary relations for a better assessment of LTE in a LIBS experiment.”
Alessandro De Giacomo elaborated, “This article 169 establishes the three main criteria for establishing the LTE condition in laser induced plasmas and clarifies that special attention should be given to the deviations from equilibrium of the ionization balances and to diffusion effects inside the plasma. The latter issue, generally neglected by analytical spectroscopists, requires that the diffusion length of the species in the plasma, during a time period of the order of the relaxation time of the equilibrium, is shorter than the variation length of temperature and electron number density in the plasma.”
Spectral-line broadening, shifting, and plasma diagnostics
Line broadening and radiative recombination background interferences – (a) Larson and Fassel, 174 Appl. Spectrosc., 33 (1979) 592–599; (b) Mermet and Trassy, 175 Spectrochim. Acta Part B, 36 (1981) 269–292
This pair of articles174,175 on line broadening commonly found in spectrochemical sources, with ICP as an example, was recommended by George Chan, who opined, “The paper by Larson and Fassel 174 demonstrated many classic examples in experimental spectroscopy and fundamental spectrophysics. First, it showed the important contribution of Lorentzian line wings to background; for example, the very strong emission from Ca II or Sr II from a high concentration of Ca and Sr in a sample, respectively, give line wings that can extend to 10 nm from the line center (even when a double monochromator was employed) with an ICP source. Second, it provided a textbook example of background from ion-electron recombination in a plasma; the sharp increase in background around 210 nm (see Figure 9 in the paper 174 ), when a sample of high Al concentration was present, matched very well with the ionization potential of Al. Third, another classic example for serial limit of principal quantum number merging into the continuum was depicted in Figure 7 of the paper 174 with Mg emission from an ICP. Fourth, a spectrum showing a satellite band due to inter-molecular interaction was given as an example (see Figure 6 of the paper 174 ). In addition, an experimental procedure was offered to measure stray light level as well as instrumental profile for an optical spectrometer.
“The paper by Mermet and Trassy 175 showed different types of spectral interference in the ICP with examples and characteristics. Physical pictures and mechanisms of different line broadening processes were covered, and simple formulas with working examples for the quantification or estimation of different types of line broadening (i.e., natural, Doppler, various collisional, and Stark) were given and compared. 175 Although Doppler broadening was shown to be predominant if assessed by the magnitude of line width (in full width at half maximum), spectral width is not everything in comparing line broadening because the line profile is equally if not more important in the far wings due to the Lorentzian contribution.”
Spectroscopic diagnostics of low temperature plasmas – (a) Cooper, 176 Rep. Prog. Phys., 29 (1966) 35–130; (b) Wiese, 177 Spectrochim. Acta Part B, 46 (1991) 831–841
George Chan, who recommended the paper by Cooper, 176 stated, “This 96-page tutorial review 176 discusses 17 topics on general plasma spectroscopy in an overall abridged way. The discussion on the definition of various temperatures, and methods for measurement of temperatures and electron number density carry comparatively more weight and are noticeably longer than other topics. Other topics covered in this review 176 include: collision-radiative model versus coronal approximation in plasma description; partition function and lowering of ionization potentials; dielectronic recombination, which is an important process in plasma spectroscopy and modeling; different line-broadening mechanisms; and radiative transfer. It serves as very good introductory reading material because the discussion of a topic starts with the basics and in a concise fashion, but offers sufficient detail. Equations are provided, so the paper also serves well as a handy reference. Another strength of this tutorial review 176 is that it contains a rather extensive collection of references (a total of 279 articles are cited). Many of the cited articles are from the original literature, and are sometimes difficult to track down (e.g., original work from Bates, Biberman, Darwin H.W., Griem, Holtsmark, Lindholm, Lorentz, McWhirter, to name a few). Another asset of this article 176 is that the discussion contains not only so-called measurement recipes, but more importantly, precautions, domain of validity, technical difficulties and areas of attention.”
As noted by Elisabetta Tognoni, “The article by Wiese 177 focuses on the two most frequently used diagnostic techniques for low temperature plasmas, based on the Boltzmann plot and on the Stark broadening measurement, respectively. Both techniques require the use of reference spectroscopic data: the key point of the paper 177 is stating that only the availability of good reference data enables one to obtain accurate results. It is mentioned that the reliability of atomic transition probability values is often the critical issue in the calculation of plasma excitation temperature, especially for heavy elements. Similarly, when hydrogen lines are not available, the use of Stark width values of spectral lines of heavier elements may limit the accuracy of electron number density determination. The reliability of reference spectroscopic data in tabulations is expressed in terms of accuracy or uncertainty. As recalled in this paper, 177 the evaluation of data reliability is the result of critical reviews of available theoretical calculations and experimental measurements of the same data, carried out by different groups and often with different approaches. It is a collective effort that may take years, decades, just for the spectral data of a few lines at a time. Nowadays, we are sometimes pushed to quickly arrange successful experiments in order to keep up with publishing expectations. For example, we just want to characterize the plasma obtained with some given experimental setting, and quickly pick the spectral data we need from a trusted source. We often ignore the work and time spent by other researchers in obtaining those fundamental spectral data. We should be aware that good data are rarely obtained without spending the necessary time.”
Elisabetta Tognoni continued, “As noted above, the choice of a reliable dataset of lines is crucial for calculating plasma electronic excitation temperature by means of a Boltzmann plot. This choice depends on many variables: the elements composing the target, their relative concentration, the irradiation regime, the target environment, the technical characteristics and time settings of the detection system, just to name a few. Researchers typically develop their customized, case-specific solution to this problem. A systematic approach termed iterative Boltzmann plot 178 deals with Fe I and Fe II lines observed in spectra of steel samples obtained using low ablation energy, but it can be adapted to other elements, especially transition metals, and other experimental settings. It aims to improve precision of results, working with wide-band spectra. In brief, the approach consists of using data from trusted databases to calculate the expected relative intensity of as many lines as possible and then to apply reasonably simple criteria to discard weak and overlapped lines. Then, further refinement of the dataset is based on the agreement between expected and experimentally observed relative intensities: data points with the highest residua from the Boltzmann plot regression line are iteratively discarded and the regression recalculated, until a preset value of the coefficient of determination is obtained. I believe that this procedure can be a good didactical example of practical operation with a large amount of spectral data.”
Electron number density measurement with the Hβ line – (a) Wiese, Kelleher, and Paquette, 179 Phys. Rev. A, 6 (1972) 1132–1153; (b) Starn, Sesi, Horner, and Hieftje, 180 Spectrochim. Acta Part B, 50 (1995) 1147–1158
According to Alexander Scheeline, “Early work on Stark line shapes showed anomalies with experimental data. The National Bureau of Standards (NBS; later National Institute of Standards and Technology, NIST) atomic physics group worked to improve experimental and theoretical understanding of hydrogen atomic emission line shapes as perturbed by thermal electron clouds. While the group published a number of papers, this is the one 179 that I was most aware of when trying to figure out how to deal with free electron properties. The Wiese et al. paper 179 is nearly contemporary with Vidal, Cooper, and Smith's tables 181 of peak splitting and line width for the hydrogen alpha (656.46 nm) and hydrogen beta (486.1 nm) lines, which were widely used in the atomic spectrometry community to measure electron number density until Thomson scattering became the method of choice. Perhaps the paper by Vidal, Cooper, and Smith 181 is not key because it's only a tabulation of factors provided by earlier theory, but its ubiquity, despite not employing Wiese et al.'s insights, is noteworthy.”
As explained by Carsten Engelhard, “Starn et al. 180 reported a program written in the National Instruments graphical language, LabVIEW, that can be used to determine the electron number density, which is an important parameter in plasma diagnostics, from Stark broadening measurements of the hydrogen-beta line. The program calculates electron number density by fitting the experimentally determined to the theoretical hydrogen-beta profile. While the LabVIEW version might be outdated, the paper contains information that is still useful today and might serve as a template to develop code with current software. Note that there is an online section of Spectrochimica Acta Part B termed Spectrochimica Acta Electronica, which contains this and other interesting electronic supplementary material on plasma spectrochemistry fundamentals.”
Plasma broadening and shifting of non-hydrogenic spectral lines – Konjević, 142 Phys. Rep., 316 (1999) 339–401
This review 142 was recommended by Elisabetta Tognoni, Nicoló Omenetto and James Winefordner. The comment from Elisabetta Tognoni is: “Although the main focus is on Stark broadening, the first part of this tutorial 142 also overviews the other line broadening mechanisms, as well as self-absorption, for its effect on the line profile.”
Nicoló Omenetto and James Winefordner expand the discussion and jointly remarked, “This paper 142 reports a most authoritative, lucid, detailed discussion of self-absorption as a cause of broadening. Although self-absorption is not explicitly mentioned in the title, focused on an overview of the status of the experimental studies of Stark widths and shifts of non-hydrogenic neutral atom and ion spectral lines, it is discussed among the other causes for broadening. The author 142 stresses that it is very difficult to judge the amount of self-absorption from the observed Stark shapes and that sometimes publications reporting the conclusion that, because of the good adherence of Stark broadened lines to dispersion shapes, self-absorption was absent may have been inaccurate. Most useful from the experimental point of view is the presentation of different methods to check, and correct if necessary, the presence of self-absorption, for example: (i) observing the behavior of the intensity ratio, and of the line widths, of selected lines in a multiplet as a function of the number density of the emitters; (ii) changing the observed plasma length in axially homogeneous sources; and doubling the optical path length with a concave mirror placed behind the plasma. This last approach has been used in the case of laser-induced plasmas. 141 ”
Atomic lifetime measurement with laser ablation and selective excitation spectroscopy – Measures, Drewell, and Kwong, 182 Phys. Rev. A, 16 (1977) 1093–1097
As commented jointly by Nicoló Omenetto and James Winefordner, “This paper 182 is the first report that outlines the advantage of using pulsed laser ablation as an atom-ion source and tunable dye lasers to selectively excite the atomic/ionic fluorescence of selected atoms in the resulting vapor plume. The pulsed nature of the experiment (Q-switched ruby laser for ablation of Cr, nitrogen laser-pumped dye-laser for fluorescence excitation, monochromator to isolate the fluorescence wavelength, PMT and digital oscilloscope) allows the observation of a complete temporal evolution of the signal characteristics. The evolution of the decay time values of the resonance transition of Cr at 425.44 nm clearly shows quenching effects (short lifetime), self-absorption effects (lengthened lifetime) and finally radiative lifetime (inverse of spontaneous transition probability).”
Spectral background and interference
Line wings as a major contribution to the background in line-rich spectra – Boumans and Vrakking, 183 Spectrochim. Acta Part B, 39 (1984) 1291–1305
George Chan commented, “This is a classic paper 183 as it conclusively showed that the quasi-continuum background in an ICP (possibly extendable to other strong, line-rich emission sources) can be attributed to superposition of the wings of strong emission lines from line-rich elements in a sample matrix. With a Co–Ni matrix mixture, the additive nature of overlapping line wings was shown to account for the elevated background continuum. The contribution of line-rich elements to an elevated pseudo-continuum and its potential degradation of LOD should be noted. Boumans and Vrakking commented that ‘If the background contributed by line wings in the spectral region of interest exceeds that of the pure solvent by a factor of, say, 5, the relative detection limits of analytes having their most prominent lines in that spectral region cannot be improved by increasing the sample concentration in the plasma by raising the solute concentration in the solution or using a nebulizer, such as an ultrasonic nebulizer, that produces a larger sample flow to the plasma.’ 183 ”
Overview of spectral interference and background correction – (a) Boumans, 184 Fresenius Z. Anal. Chem., 324 (1986) 397–425; (b) Boumans and Vrakking, 185 J. Anal. At. Spectrom., 2 (1987) 513–525
This pair of articles184,185 on general overview of spectral interference and background correction in spectrochemical analysis was recommended by George Chan, who commented, “In the first tutorial, 184 various topics (including several basic ones) on spectral interferences, background correction, and characteristics of spectroscopic apparatus were reviewed in a concise package; thus, it is very suitable to serve as an introduction and overview to the general topic of spectral interference. The distinct differences between additive and multiplicative interference were discussed. Each of the four major types of spectral interference, namely, continua, stray light, line wings, and line or band overlap were covered with demonstrated examples. Background correction in different cases was illustrated with a comment ‘Background correction is one of the most difficult and ticklish problems of emission spectroscopy.’ 184 The second tutorial, 185 without much overlap with the first one, 184 provided a more in-depth, yet concise, summary on the breakdown of LODs, and assessment and comparison of LODs from different researchers or apparatus. The inter-relationships among effective line width, physical line width, practical bandwidth and LOD were evaluated. Breakdown and comparisons of LODs from different researchers through noise (RSDB) factor, source (SBR) factor, and apparatus bandwidth factor were illustrated. 185 The appendix 185 contains handy and useful formulas to convert SBR at different spectrometer bandwidths, which in turn allows the conversion or estimation of LOD for any arbitrary detection bandwidth. The important point to be noted is that physical line width is an important factor in the conversion.”
Abel inversion: Transformation of laterally measured to radially resolved spatial profile
The Nestor and Olsen algorithm for symmetric emission source – Nestor and Olsen, 186 SIAM Rev., 2 (1960) 200–207
As noted by Jin Yu, “In this classic paper, 186 a numerical method (the Nestor–Olsen method) is presented for computation of the inverted Abel integral equation. Such calculation is needed when space-resolved emissivity (emission intensity per unit of volume) is deduced from a spectral emission image of a plasma with axial symmetry and assumed to be free of self-absorption. The principal advantages of the Nestor–Olsen method are the simplicity of programming and speed of calculation. In a more recent article, 187 Abel inversion has been used to deduce the radial distributions of characteristic parameters of a plasma with the Fernandez–Palop smoothing technique. 187 Such pretreatment significantly reduces distortions in the experimental profiles and shows good performance even for data with a low signal-to-noise. The paper 187 compares three algorithms for the implementation of Abel inversion, including the discretization method, the Hankel–Fourier method and the Nestor–Olsen method. The results show a better performance for the Hankel–Fourier algorithm.”
Abel inversion with non-axisymmetric plasma – (a) Yasutomo, Miyata, Himeno, Enoto, and Ozawa, 188 IEEE Trans. Plasma Sci., 9 (1981) 18–21; (b) Blades, 189 Appl. Spectrosc., 37 (1983) 371–375
Michael Blades commented, “In 1981, I was a starting assistant professor at the University of British Columbia. For my PhD thesis work, I had used a photodiode array in an imaging mode to collect lateral spatial profiles from an ICP.190,191 These lateral profiles could be transformed into radial profiles using a well-known mathematical transform called an ‘Abel inversion’. Prior to applying the Abel inversion, it was routine for researchers to average the two sides of the image to produce a single radial image plotted from the center out. However, it was obvious that this averaging procedure masked what could be important and useful asymmetry information inherent in the raw data. I found a paper one day while I was page-turning a volume of IEEE Transactions on Plasma Science 188 that demonstrated an asymmetric Abel inversion on synthetic test data. I adapted the methodology described in this paper 188 and applied it for the first time on lateral profiles from an ICP. I noted in the conclusions, ‘There are no doubt many instances in which a change in excitation conditions may lead to very subtle changes in the observed spatial emission profiles. These subtle changes may be totally obscured by the averaging procedure that has previously been used.’ 189 The asymmetric approach became a staple in my lab and was used by many graduate students in their PhD work.”
Spectrometric Tricks, Techniques, and Novel Instrumentation
Techniques for optical imaging
High-fidelity imaging of laboratory spectroscopic sources – (a) Goldstein and Walters, 192 Spectrochim. Acta Part B, 31 (1976) 201–220; (b) Goldstein and Walters, 193 Spectrochim. Acta Part B, 31 (1976) 295–316
This two-part review documenting considerations needed for high-fidelity imaging of laboratory spectroscopic sources was recommended by Alexander Scheeline, who noted, “These two papers192,193 are the definitive explanations of coma and astigmatism in optical spectrometers, and provide means using only on-axis parabolic mirrors to give high spatial-resolution images. In summary: use mirrors instead of lenses to avoid chromatic aberration, use parabolas instead of spherical optics to avoid spherical aberration, and use orthogonal Z pairs of mirrors to compensate for astigmatism and coma.”
High spatial resolution Schlieren photography – Hosch and Walters, 194 Appl. Opt., 16 (1977) 473–482
Annotations from Alexander Scheeline on this article are: “Visualizing gas and vaporized sample dynamics in plasma discharges can be performed, in part, using emission spectroscopy. But how can non-emitting species and boundaries with surrounding, cold gas be visualized? Schlieren photography using a pulsed laser light source to allow stroboscopic measurement works well. While Schlieren measurements were made at least as early as 1864, time resolution of such bright, transient discharges as atmospheric-pressure sparks awaited the availability of lasers. Hosch and Walters 194 built a Schlieren camera for such discharges and reported initial images in this paper. Most subsequent publications from Walters's lab included Schlieren pictures to clarify and amplify what was obtainable from emission alone.”
Optical spectrometric techniques and tricks
Light filling in a spectrograph – Nielsen, 195 J. Opt. Soc. Am., 20 (1930) 701–718
Nicoló Omenetto and James Winefordner recommended this article 195 and jointly commented, “This paper 195 should be most carefully read by everyone interested in learning how radiation from either a point source or an extended source of radiation can be most efficiently transferred through the optical system and the spectrometer into the detector, with and without the use of condensing optics. As clearly stated, the author does not consider diffraction effects, and the results are obtained by geometrical considerations only. The procedure is straightforward, but it takes patience and extensive algebra.”
Practical considerations to collect photons – (a) Wright, 196 Feasibility study of in-situ source monitoring of particulate composition by Raman or fluorescence scatter (Report EPA-R2-73-219), (1973); (b) Omenetto and Human, 197 Spectrochim. Acta Part B, 39 (1984) 1333–1343
Nicoló Omenetto suggested the report by Wright 196 whereas James Winefordner expanded the selection and included the article by Omenetto and Human. 197 Their joint remarks are: “These two papers196,197 should be read together. The first report 196 discusses the collection of Raman photons, while the second 197 applies such procedure to the collection of fluorescence photons. Both papers196,197 aim at deriving an expression for the signal in terms of those practical experimental, (operator selected) parameters of the setup used (e.g., collection optics diameter, focal lengths, separation distances, spectrometer slit width and height) that are related to the fundamental transfer parameters (e.g., solid angles, f-numbers, spectral dispersion and resolution of the spectrometer, image rotation). The final outcome is an expression relating the photons detected per emitting atom: should one know the sample-to-atom conversion efficiency, an absolute calibration sensitivity of the overall atomization–excitation–detection chain would be obtained.”
Absolute radiation intensities in the vacuum-ultraviolet region – Hinnov and Hofmann, 198 J. Opt. Soc. Am., 53 (1963) 1259–1265
Jointly recommended by Nicoló Omenetto and James Winefordner, this article 198 provides a “useful source of information of the various approaches used for absolute measurement of radiation, focusing on the intensity ratio of two optically thin spectral lines originating from a common upper level. While vacuum UV calibration is most important for those involved in plasma physics and spectroscopy of ionized gases, the theoretical basis of the calibration procedure described in this paper 198 is relevant for the analytical UV-visible regions of the spectrum as well. Interestingly, the possibility of calibrating an instrument in-situ, where the source to be studied is used as a radiation standard, is described.”
Branching ratios for spectrometer response calibration – (a) Adams and Whaling, 199 J. Opt. Soc. Am., 71 (1981) 1036–1038; (b) Oda and Usui, 200 Jpn. J. Appl. Phys., 20 (1981) L351–L354; (c) Whaling, Carle, and Pitt, 201 J. Quant. Spectrosc. Radiat. Transf., 50 (1993) 7–18; (d) Doidge, 202 Spectrochim. Acta Part B, 54 (1999) 2167–2182
These two articles199,201 are jointly recommended by Nicoló Omenetto and James Winefordner, who commented, “The two papers199,201 are very informative early papers on the use of branching ratios and their significance. They are considered together, as the second is a revised, updated and expanded version of the first, with additional data for Fe, He I and two NO vibrational sequences. The relative calibration response of a spectrometer is usually performed with a standard radiance W lamp (see, for example, a paper by Yubero et al. 203 ). The branching ratio method is an alternative approach requiring the measurement of the ratio between two lines of known transition probabilities originating from the same upper level. Using an Fe hollow-cathode discharge in Ar and in Ar–He, and the one-meter Fourier transform spectrometer at Kitt Peak National Observatory, the authors report branching ratios for 433 emission lines of Ar I and Ar II, originating from a total of 80 levels. The paper contains a clear warning: taking the ratio of peak amplitudes, instead of line integrated areas using Voigt profile fitting, is not a reliable measure of the branching ratios.”
Nicoló Omenetto and James Winefordner further expand the discussion on branching ratios and referred to this article 202 by Doidge, and jointly remarked, “This is a reference paper 202 for those involved in ICP diagnostic and analytical work. The (radiative) branching ratio method dispenses with the use of calibrated sources but seems to have received no attention from users of analytical plasmas. The reader will then find an exhaustive discussion of important theoretical and experimental considerations related to the calibration of the spectral response of a commercial ICP emission spectrometer from the low ultraviolet to near infrared. This paper 202 being dedicated to Alan Walsh, the author argues that better branching ratios lead to better absorption oscillator strength values, which lead to a closer advance to the goal of absolute analysis by atomic absorption. Note that the author published an erratum 204 to report a more accurate symbol for the spectral sensitivity factor S(λ). The erratum is irrelevant to the essence of the paper.”
Nicoló Omenetto also recommended the article by Oda and Usui 200 on application of a dye-laser-induced fluorescence technique to absolute calibration of a vacuum monochromator with the comment, “A rather unique way of improving the atomic branching ratio method to calibrate the response of a vacuum UV spectrometer, based on the simultaneous laser-induced signal enhancement of the H-alpha and depression of the L-alpha line intensities superimposed on the plasma emission signals observed in the absence of laser excitation. The scheme works only under optically saturated conditions and the resulting simple relations between the population number densities of the levels involved. In principle, the same approach can be applied to other similar schemes in atmospheric-pressure plasmas: however, collisional level mixing will complicate the derivation of the population ratio, even under saturated conditions. Overall, the approach is clever and worth being kept in mind by those working with laser plasma spectroscopy.”
Determination of non-metallic elements through molecular bands – (a) Fuwa, 205 Nippon Kagaku Zasshi, 72 (1951) 986–988; (b) Fuwa, 206 Nippon Kagaku Zasshi, 75 (1954) 1257–1259
As explained by George Chan, “Recent advances in the development of continuum source atomic absorption and the popularity of laser induced breakdown spectroscopy make the determination of non-metals (e.g., halogens, sulfur, phosphorus, carbon) through their diatomic molecular spectra (e.g., CaF, InCl, CS, PO) popular again. The spectrometric trick to use band spectra for spectrochemical analysis of non-metals, through diatomic molecule formation in a reactive environment (e.g., electric arc and flame) has a long history. For example, in these two pioneering publications by Fuwa,205,206 quantitative determination of fluorine was achieved through emission of a CaF band in a carbon arc. One should also note that, perhaps with the exception of the alkali elements, the characteristic colors of many elements in a flame test are actually from molecular emission.”
Photon counting for spectrophotometry – (a) Franklin, Horlick, and Malmstadt, 207 Anal. Chem., 41 (1969) 2–10; (b) Malmstadt, Franklin, and Horlick, 208 Anal. Chem., 44 (1972) 63A–76A; (c) Ingle and Crouch, 209 Anal. Chem., 44 (1972) 785–794
WingTat Chan recommended the first article 207 in this cluster and remarked, “The article 207 is a tutorial on the principles and experimental setup of photon counting for spectrochemical measurement. The basic and practical characteristics of a relatively simple and inexpensive PMT-based photon-counting system are presented (some basic circuits are also included). Individual components of the photon counting apparatus are discussed in detail, e.g., the gain, frequency response, pulse height distribution, dark current, and applied voltage of the PMT detector. The advantages of photon counting are discussed: direct digital processing of spectral information, reduced dark current, improved S/N, sensitivity to low light levels, accurate signal integration, improved precision, elimination of reading error, and better spectral resolution. The improved precision of absorbance measurement by photon counting due to elimination of reading errors was demonstrated.”
Stanley Crouch recommended the remaining two articles208,209 and noted, “These two papers208,209 discuss the technique of photon counting as applied to spectrochemical methods. The advantages and disadvantages are discussed 208 and the photon counting method is compared to analog (direct current, DC) processing of signals.” 209 Nicolas Bings added, “A comparison of S/N for spectrometric measurements using photon counting and direct current techniques is given. 209 The authors show that the first approach provides significantly higher S/N under equivalent conditions if measurements are shot-noise limited. They also discuss (a) practical implications for analytical spectrometric methods, and (b) criteria for choosing the detection technique providing the highest S/N.”
Practical considerations to collect and calculate noise amplitude spectra – Sesi, Borer, Starn, and Hieftje, 210 J. Chem. Educ., 75 (1998) 788–792
As commented by George Chan, “With the advance in data acquisition in the digital domain through an analog-to-digital conversion device and convenient computer data-processing programs for calculation of a Fourier transform, it is tempting just to present the digitized measurement data to a Fourier transform algorithm to obtain a noise spectrum. This paper 210 provides a very clear tutorial and recipe on the correct way and precautions on obtaining noise amplitude spectra. The tutorial 210 covered the reasoning for a must-use low-pass filter for signal acquisition, proper choice of cut-off frequency with consideration of edge sharpness of the cut-off to avoid aliasing, data pre-treatment like apodization, proper way of multi-measurement averaging (advantage in averaging in the frequency domain), noise-amplitude calibration and presentation.”
Optical spectrometers and detectors
Use of photomultiplier tubes for direct intensity measurements of spectral lines – Dieke and Crosswhite, 211 J. Opt. Soc. Am., 35 (1945) 471–480
Arne Bengtson recommended this article 211 and commented, “This paper 211 is a milestone in the development of spectrochemical analysis in industrial applications. By using photoelectric detection, analysis could be both very fast and automated. Today, thousands of optical spectrometers based on these principles provide automated, rapid analysis in metallurgical and other industries 24/7. Modern process control would not be possible without such instruments.”
Direct readers for spectrochemical analysis – Saunderson, Caldecourt, and Peterson, 212 J. Opt. Soc. Am., 35 (1945) 681–697
According to Alexander Scheeline, “Prior to the introduction of direct readers (polychromators with an array of slits and photomultipliers for detection), all atomic emission work was done either with single channel, scanning monochromators or photographic plates. Direct readers were developed during World War II, and this paper 212 is the first report of the instrument type. From 1945 until CCDs became common, direct readers were the primary instrument for quality control in the steel, aluminum, and brass industries across the globe, in competition with X-ray fluorescence which is inherently multichannel.”
Design and characteristics of Czerny–Turner spectrometer – Wünsch, Wennemer, and McLaren, 213 Spectrochim. Acta Part B, 46 (1991) 1517–1531
According to George Chan, “This is a concise and useful tutorial review covering the theory, design, characterization and practical considerations on the use of a Czerny–Turner spectrometer. 213 It demystifies many important concepts in the Czerny–Turner spectrometer, for example: what would happen if the entrance and exit slits are interchanged (i.e., light enters through the ‘exit’); why the exit slit should be set to slightly wider than the entrance slit; the change of reciprocal linear dispersion and horizontal magnification of slit during wavelength scanning and the resultant effect on spectral resolution; and major practical factors which contribute to spectral resolution. The paper 213 also discussed and clarified two common misconceptions: that dispersion of a Czerny–Turner grating is independent of wavelength, and spectral resolution is linearly proportional to grating groove density and diffraction order.”
Production and design of echelle gratings and spectrographs – (a) Harrison, 214 J. Opt. Soc. Am., 39 (1949) 522–528; (b) Harrison, Archer, and Camus, 215 J. Opt. Soc. Am., 42 (1952) 706–712
Ulrich Panne recommended this article by Harrison 214 and concisely summarized its importance as “the advent of echelle systems provided a new way into high spectral resolution.” As elaborated by Stefan Florek, “The importance of Harrison's paper 214 published in 1949 is remarkable. Harrison must be considered as the father of the successful story of the echelle diffraction grating over many decades now. Already in this first publication 214 in 1949, he described the basic properties of the new grating type and a corresponding concept for an echelle spectrograph; and he also described the production of high-precision echelle gratings by shaping on a ruling machine with a cutting tool under interferometric control. The technique is state of the art up to now. Harrison could not have known that 20 years later significantly cheaper replicas could be produced by copying techniques, leading to a wide availability of echelle gratings.”
WingTat Chan expanded the selection, included the second paper 215 and commented, “The basic principles and construction of echelle grating spectrometers are discussed in these two papers.214,215 The first article 214 discussed the production of echelle gratings and spectrographs. The second article 215 discussed designs of fixed-focus echelle spectrometers that cover a wide spectral range, e.g., 200–700 nm, with high speed and resolving power. The design is a major improvement over spectrometers that cover a small spectral range and, therefore, must be scanned and refocused to cover a wide range of spectral wavelengths. The configuration discussed in the article is commonly adapted in modern echelle grating spectrometers with 2-D array detectors. Figure 2 of the 1952 paper 215 is a schematic diagram representing the familiar 2-D ‘rectangular spectrum array’ of an echelle spectrograph with cross dispersion by a prism. The effect of critical echelle constants (ruled grating width, number of grooves, groove depth and width, and spectrometer focal length) on spectral resolution and practical design of the spectrometer were discussed. Figure 7 in the paper 215 shows an impressive spectrum of praseodymium with spectral resolution of 180 000, limited by Doppler broadening. The theoretical resolution is 277 000 at 700 nm to nearly one million at 200 nm.”
Echelle grating spectrometers for fundamental and applied emission spectrochemical analysis – (a) Keliher and Wohlers, 216 Anal. Chem., 48 (1976) 333A–340A; (b) Boumans and Vrakking, 217 Spectrochim. Acta Part B, 39 (1984) 1239–1260; (c) Scheeline, Bye, Miller, Rynders, and Owen, 218 Appl. Spectrosc., 45 (1991) 334–346; (d) Barnard, Crockett, Ivaldi, and Lundberg, 219 Anal. Chem., 65 (1993) 1225–1230; (e) Zander, Chien, Cooper, and Wilson, 220 Anal. Chem., 71 (1999) 3332–3340
Stanley Crouch remarked, “This paper by Keliher and Wohlers 216 presents the principles, advantages and limitations of echelle grating spectrometers in chemical analysis, including flame emission and atomic absorption. Applications to multielement analysis and to measurement of spectral line profiles are also discussed.”
The importance of the work by Boumans and Vrakking 217 is outlined by Stefan Florek as: “This detailed paper 217 is the first part of a series of three articles published in the same issue of the journal. The first part deals fundamentally and very instructively with the optical and spectrometric properties of a high-performance echelle monochromator with a pre-disperser in parallel slit orientation and a PMT detector. Based on theoretical calculations and detailed measurements, it is clearly demonstrated that spectrochemical analysis using ICP–AES with its extremely line-rich spectra places high demands on the performance of the spectrometric system because of the risk of line interference and stray light effects. The investigated echelle monochromator with 1.5 m focal length achieves the necessary practical resolution in the range of more than 100 000 to be able to approximately resolve the physical line widths in ICP and arc spectra.”
Stefan Florek also shared his view on this article by Barnard et al. 219 and noted, “From my point of view, Barnard et al. 219 have developed a truly revolutionary echelle spectrograph that is still the benchmark in spectrometric design and detector technology today. The most remarkable and sophisticated component of the optical path is an aspherical concave grating. It provides the separation of the echelle orders in the UV spectrum after the collimated beam from the entrance slit has passed the echelle grating. Additionally, it corrects spherical aberration on the array detector. A fraction of the collimated beam from the echelle runs through a central hole in the concave grating and produces a visible spectrum on a second array detector. Besides the clever optical setup, another highlight of the compact ICP system is the early development of the monolithic, segmented CCD detector. It is characterized by excellent quantum efficiency down to the vacuum UV and low readout noise.”
Alexander Scheeline recommended this pair of articles218,220 on the design of a whole echelle-grating spectrometric system. The first article 218 describes a system that his team designed and he remarked, “Desperate to get wide wavelength coverage for transient discharge measurements, we built our own echelle spectrometer. This f/8 instrument 218 preceded Perkin–Elmer's pioneering commercial CCD/echelle 219 by several years. It was employed for both spark and theta pinch emission measurements.” His comments for the other article 220 are: “Some of Zander's early work involved an echelle spectrometer with photographic and photomultiplier detection. 220 Thoroughly versed in the tradeoffs required for a multi-element measurement system, he and his team developed the definitive finely tuned atomic emission instrument. Optics, detector, grating, and source are coordinated into a robust package with few wasted pixels and broader wavelength coverage than would have been possible with a generic, rectangular CCD. It's my favorite example of an optimal optical analytical instrument.”
Tutorial on how to design a spectrometer – Scheeline, 221 Appl. Spectrosc., 71 (2017) 2237–2252
Alexander Scheeline recounted, “This paper 221 shows how to start with a chemical problem, deduce the properties desired for a spectrometer to solve that problem, and then design an instrument that meets the measurement constraints. The interplay of conventional, closed-form design with numerical, ray-tracing analysis shows how to play off various engineering strategies to develop an acceptable instrument.”
A spectrometer for time-gated, spatially resolved study of repetitive events with rotating mirror as a time disperser – Klueppel, Coleman, Eaton, Goldstein, Sacks, and Walters, 222 Spectrochim. Acta Part B, 33 (1978) 1–30
Alexander Scheeline recommended this paper 222 because “Much insight into transient discharges is achieved with spatiotemporal resolution. This paper 222 describes the ultimate development in Walters's laboratories of apparatus for dissecting stable trains of spark discharges. Later related instruments used CCDs or vidicon detectors, but the central design principles are presented here. With the advent of electronic shutters with nanosecond gating times, negligible lag, and many orders of magnitude dynamic reserve, the photographic approach reported here is obsolete. The insistence on stable, repetitive discharges is just as applicable now as then.”
Monochromatic imaging spectrometer – Olesik and Hieftje, 223 Anal. Chem., 57 (1985) 2049–2055
As concisely summarized by Stanley Crouch, “This paper 223 describes approaches for optical imaging with spectrometric systems. Applications for spatial mapping of ICP and flame sources are discussed.” George Chan noted, “The monochromatic imaging spectrometer described in this pioneering paper 223 is a very useful transformation of a conventional Czerny–Turner spectrometer to obtain two-dimensional wavelength-selective images of an object, provided that a two-dimensional imaging detector, like a vidicon as utilized in the described work, 223 or CCD/intensified-CCD (ICCD) as more common nowadays, is placed at the image plane of the monochromatic imaging spectrometer. Compared to obtaining wavelength-selective images with narrow bandpass filters, the monochromatic imaging spectrometer is much more powerful and versatile because it allows not only tunability of the central wavelength as desired (as long as it is within the free spectral range of the grating), it also allows some tunability of the bandpass. With a spectrometer of 1 m and a grating density of 2400 lines/mm, 2-D images with bandpass narrower than 1 nm can be readily obtained. Filters with 1 nm bandpass, although commercially available, must very often be custom made. Although no color 2-D emission image was shown in this paper 223 (probably because color image printing in journals was not a norm in 1985), papers published at a later time using the same device gave sophisticated 2-D monochromatic emission images with different plasma sources.”
Linear photodiode array as detectors in analytical spectrometry – (a) Benn, Foote, and Chase, 224 J. Opt. Soc. Am., 39 (1949) 529–532; (b) Horlick and Codding, 225 Anal. Chem., 45 (1973) 1490–1494; (c) Horlick and Codding, 226 Appl. Spectrosc., 29 (1975) 167–170; (d) Horlick, 227 Appl. Spectrosc., 30 (1976) 113–123; (e) Franklin, Baber, and Koirtyohann, 228 Spectrochim. Acta Part B, 31 (1976) 589–597
Gary Hieftje noted, “Although the use of imaging detectors for spectroscopy can be traced back to the late 1940s, 224 such devices were derived mainly from those designed for television broadcasting and were not particularly suitable for spectrochemical analysis. However, a chip-based linear photodiode array, which underwent development through many generations that were increasingly attractive for spectral measurements, began being offered in the 1970s by the Reticon Corporation. The research group of Gary Horlick at the University of Alberta was the first to take advantage of the Reticon system. 225 ”
Stanley Crouch stated, “This paper 225 describes the linear photodiode array for detection in spectrometry. Applications to flame emission and atomic absorption are described.” Paul Farnsworth shared a similar view and added, “Gary Horlick was well ahead of his time when he began advocating the use of silicon-based solid-state detectors for atomic spectrometry. At the time it was not at all obvious that such detectors with no gain could ever compete with photomultipliers with gains in excess of 105. Although the diode arrays described in this paper 227 were supplanted by CCDs and charge-injection devices (CIDs), many of the advantages of solid-state detectors identified by Horlick in this paper 227 are routinely exploited in modern instruments.”
WingTat Chan provided more detail on Horlick's work in adopting the linear photodiode array (PDA) for spectrochemical measurements and noted, “These are classical papers226,227 on the application of linear diode arrays for simultaneous multichannel spectrochemical measurement. Photodiode array is a convenient replacement of a photographic emulsion plate for simultaneous multichannel measurement of a spectrum. The implementation of PDAs is also relatively simple compared to electronic image sensors, such as the orthicon and vidicon, that were available in the 1970s. The adoption of array sensors in spectrochemical measurement is a major step forward in computer-controlled spectrochemical instruments and automation of chemical measurements. This article 226 provides details on the construction and control circuit of the Reticon PDA as well as the operational characteristics (electronic background, integration performance and blooming, lag, diode-to-diode sensitivity variations, and dynamic range) of the device in spectrochemical measurements. The limitations of the PDA (sensitivity and wavelength coverage) were also discussed.”
Michael Blades added his comment on Horlick's Applied Spectroscopy paper 227 and remarked, “This paper 227 preceded the first commercial system by about 15 years. It represents an idea which was ahead of its time and it is beautifully written. The breakthrough is that, as noted in the abstract, ‘A rather large number of spectrochemical studies and analyses can be greatly facilitated by the simultaneous measurement of spectral information over a range of wavelengths. Of particular importance and interest to analytical spectroscopists is the development of simultaneous multielement analysis systems. The development and implementation of such analyses have been hampered by a lack of convenient and versatile multichannel spectrochemical measurement systems. New detector subsystems based on modern electronic image sensors are helping to overcome this obstacle.’ 227 ”
Gary Hieftje added, “Linear photodiode arrays soon were adapted to spatial profiling of spectroscopic sources. The first such application of the Reticon linear array was in 1976 by Mike Franklin, then at the University of Missouri, who coupled it with a Hilger–Engis 1-meter spectrometer to obtain spatially resolved images of an ICP. 228 The clever optical arrangement, used later by Gary Horlick 229 and others, involved placing the array at the focal plane of the spectrometer, with the array of 512 diodes oriented vertically. The array therefore provided vertically resolved intensity information about emission from the ICP at the wavelength at which the array was positioned. If desired, horizontally resolved information could be generated simply by inserting a dove prism in the optical path between the ICP and spectrometer, which rotated the image of the ICP by 90°.”
Charge-coupled devices (CCDs) and charge-transfer devices as detectors in analytical spectrometry and plasma diagnostics – (a) Ratzlaff and Paul, 230 Appl. Spectrosc., 33 (1979) 240–245; (b) Pilon, Denton, Schleicher, Moran, and Smith, 231 Appl. Spectrosc., 44 (1990) 1613–1620; (c) Sweedler, 232 Crit. Rev. Anal. Chem., 24 (1993) 59–98; (d) Bye and Scheeline, 233 Two-Dimensional Array Detectors for Plasma Diagnostics, in Charge-Transfer Devices in Spectroscopy, VCH Publishers (1994)
Stanley Crouch recommends a couple of these papers230,232 with comments: “The Ratzlaff paper 230 is one of the earliest reports describing charge-coupled devices as detectors in analytical chemistry. Sweedler's review 232 stresses the principles and applications of charge-injection and charge-coupled devices to analytical spectroscopy.” Vassili Karanassios noted “a detailed description of a charge-injection device (CID) coupled to an echelle spectrometer for optical emission measurements from an ICP is discussed in Pilon et al. 231 ”
Paul Farnsworth expressed a complementary view: “Bonner Denton 231 has been a tireless promoter of the use of two-dimensional solid-state array detectors for use in atomic emission spectroscopy, and as the technology improved, he possessed a unique combination of spectroscopic and electronic know-how that allowed him to lead in the development of modern emission spectrometers.”
Alexander Scheeline recommended this book chapter 233 and recounted, “Strictly speaking, this is a book chapter, not a paper. Originally, it was to be a review of how CCDs were used to characterize arcs, sparks, and other plasmas. 233 It turned into a tour de force of optical diagnostics of sparks. Bye would say, ‘surely there is a paper concerning …,’ and when there wasn't, she made the requisite measurements and reported them in the chapter. By the time she was done, the diagnostics possible with temporally and spatially resolved measurements of high voltage sparks at that time were effectively mined out. While a few other papers on sparks appeared later, most transient discharge research thereafter focused on laser-induced breakdown spectroscopy.”
Alexander Scheeline continued, “One should note that all solid-state cameras have wavelength-dependent response, pixel-to-pixel nonuniformity, non-uniform dark current, non-uniform dynamic range, and linearity limits. A general calibration procedure with example data has come from Snik's group in Leiden. 234 ”
Simple method for flat-field correction for a two-dimensional imaging spectrometer – Monnig, Gebhart, and Hieftje, 235 Appl. Spectrosc., 43 (1989) 577–579
As remarked by George Chan, “A simple and very cost-effective approach to correct for gain and optical throughput variations (i.e., flatfield correction) in a spectrometer and detector system was illustrated in this paper. 235 Even nowadays, more than 30 years after the publication of this work, many ICCDs are not manufactured to a high degree of response uniformity across the entire photo-sensitive area and flatfield correction is still a must-be-performed experimental procedure as exemplified elsewhere.236,237 With only a solution cell and chemiluminescence compound as commonly found in a glowing light stick, a homogeneous emission source for flatfield correction can be readily and conveniently available in a laboratory.”
Premature saturation of intensified CCD (ICCD) detector – Williams and Shaddix, 236 Rev. Sci. Instrum., 78 (2007) 123702
George Chan explained, “This study 236 is one of the very few that specifically addresses a key practical limitation of ICCD – the linearity and premature saturation of the detector. Considering how many analytical spectrometric measurements are made nowadays with ICCDs, it is indeed surprising that the possibilities of linearity deviation and premature saturation, which could lead to measurement error or even wrong conclusions, are not more widely documented in the literature. ICCD users should be cautioned by the findings reported in this work. 236 Depending on the photon flux, the onset of saturation within the microchannel plate producing a significant falloff in response could be as low as 16 000 counts for a 16-bit detector (i.e., around 30% of the maximum limit of ∼65 000 counts). 236 To keep the same gain, the potential difference across the channel needs to be held constant so as to continuously produce secondary electrons from primary photoelectrons. However, after illumination with a strong burst of photons, the charging and recovery time for the microchannel plate could be slow because of the high electrical resistance of the channel. Premature saturation at around 30% of the full limit of the analog-to-digital conversion in an ICCD has also been independently reported elsewhere. 238 ”
Adaptation of an echelle spectrograph to a charge-transfer detector – (a) Bilhorn and Denton, 239 Appl. Spectrosc., 43 (1989) 1–11; (b) Becker-Ross and Florek, 240 Spectrochim. Acta Part B, 52 (1997) 1367–1375
The paper by Bilhorn and Denton 239 was recommended by Gary Hieftje, John Olesik, and Alexander Scheeline. Alexander Scheeline's comments are: “Denton's group had been using array detectors for spectrometry for several years by the time this paper 239 appeared. As far as I can determine, while there had been dozens of talks about CCDs and CIDs prior to this time, this paper 239 is Denton's first peer-reviewed report of the power of pixelated rectangular array detectors for spectrometry. The spectrometer was a commercial echelle.”
John Olesik added, “Denton 239 championed the use of imaging detectors for optical spectrometers and the combination of an echelle spectrometer and an imaging detector is used in most of the ICP–AES instruments today.” Gary Hieftje's notes are similar: “Denton has long been one of the main proponents and innovators in the use of two-dimensional detector arrays for atomic-emission spectrometry. His designs, heralded by this seminal publication, 239 can be found in many modern spectrometers.”
Reinhard Noll recommended a different paper 240 on the “description of a concept for an echelle spectrometer adapted to charge-coupled devices.” This same paper 240 was also recommended by Elisabetta Tognoni, who remarked, “The performance of detectors such as intensified CCDs and spectrometers such as the echelle is nowadays taken for granted. A paper 240 published at the beginning of the CCD era, while describing the physical principles, is capable of communicating the wonder for the performance of the new instruments. To complete the description of principles and technical characteristics of echelle–CCD detectors provided, an example of analytical application to single-shot LIBS spectra on aluminum alloys is given in this article. 241 ”
Likewise, Ulrich Panne mentioned, “This work 240 shows the advent of echelle systems with high spectral resolution and wide spectral range employed in systems when two-dimensional detector systems found their way into spectrochemical analysis.”
Techniques for automated collection, reduction, and analysis of spectral data with wavelength calibration – (a) Miller and Scheeline, 242 Spectrochim. Acta Part B, 48 (1993) E1053–E1062; (b) Sadler, Littlejohn, and Perkins, 243 J. Anal. At. Spectrom., 10 (1995) 253–257
Alexander Scheeline suggests this set of articles and noted, “Both of these papers242,243 describe how to combine knowledge of reference wavelengths and the nonlinear dispersion of diffraction gratings to give calibrated wavelength readout across an array detector. All grating spectrographs have slightly nonlinear dispersion; the angular dispersion of a grating is
Atomic spectrochemical measurements with a Fourier-transform spectrometer – (a) Yuen and Horlick, 244 Anal. Chem., 49 (1977) 1446–1448; (b) Ng and Horlick, 245 Spectrochim. Acta Part B, 36 (1981) 529–542; (c) Thorne, Harris, Wynne-Jones, Learner, and Cox, 153 J. Phys. E: Sci. Instrum., 20 (1987) 54–60; (d) Thorne, 246 Anal. Chem., 63 (1991) 57A–65A
WingTat Chan recommended this pair of articles244,245 and remarked, “The first article 244 reports the design of a FT spectrometer (Michelson interferometer) with three optical inputs: He–Ne laser, white light, and spectral signal of interest. With the control signals derived from the white light interferogram and the laser fringes, the signal interferograms can be precisely time averaged. The second article 245 is a practical guide to fast Fourier transform and cross correlations for the processing of spectrochemical data.”
Gary Hieftje added, “Unlike in the infrared spectral region, where detector noise dominates, most detectors employed for atomic emission, absorption, or fluorescence spectrometry generate more noise as the light level falling on them goes up. As a result, a ‘multiplex DISadvantage’ results from use of a Michelson interferometer, especially for a line-rich source such as the ICP. In addition, source instability distorts spectral lines. These limitations, documented very clearly and understandably in the excellent review article by Anne Thorne, 246 have constrained the wider exploration of Fourier-transform spectrometers for elemental analysis. Nevertheless, FT systems such as those developed by Gary Horlick and his group offer outstanding spectral resolution. An extreme example of this capability was the interferometer developed at Los Alamos National Laboratory in the 1980s, 247 which featured an accessible optical retardation (twice the mirror movement) of five meters! This instrument was coupled with a glow discharge (GD) for analytical measurements, since a GD is both more stable than an ICP and produces less cluttered spectra. 248 The full capability of the Fourier-transform spectrometry (FTS) instrument was not employed, but resolution was still impressive; spectral line widths in the picometer range were obtained and detection limits for Mo in steel were in the µg g−1 range. Another high-resolution Fourier-transform spectrometer intended for use in the UV or vacuum-UV range is the one developed at Imperial College by Anne Thorne, 153 which was later commercialized by Chelsea Instruments. The Imperial-College instrument, like the one at Los Alamos, was initially developed in the 1980s, and featured prominently in the review paper by Anne Thorne cited above. 246
“Despite the multiplex disadvantage of FTS cited above for the UV and visible spectral regions, the method has found important niche applications such as cataloguing atomic spectra. 247 This sort of application benefits from the use of ‘fringe referencing’, 249 which relies on the spectral purity and stability of the reference laser (usually a single-mode He–Ne laser) used to establish a highly accurate wavelength or wavenumber axis in the transformed spectrum. This feature is often referred to as the ‘Connes advantage’ in FTS. 246 In addition, the availability of this reliable wavelength axis enables accurate spectral registration, so spectral subtraction becomes much more practicable and useful. 250 ”
Optical spectroscopic techniques or instrumentation for diagnostics
Thomson scattering for diagnostics of atmospheric-pressure discharges – Scheeline and Zoellner, 251 Appl. Spectrosc., 38 (1984) 245–258
Alexander Scheeline recounted, “Measurement of electron temperature and concentration in atmospheric-pressure discharges had typically been performed using Stark broadening in the analytical spectroscopy community. This paper 251 introduced Thomson scattering, the elastic scattering of laser light from the electron cloud and the inelastic scattering from plasma frequency sidebands, to the community. Estimates are given for how to design a functioning instrument optimized for argon plasmas rather than deuterium–tritium–helium fusion plasmas, the original application of the Thomson technique. Due to high amounts of dust in laboratory air, the Zoellner–Scheeline team could not operate a laser at high enough fluence to do the Thomson scattering experiment 251 (laser induced breakdown occurred instead!). Defocusing the laser slightly, the motion of air, argon, and metal oxide molecules around a spark discharge were mapped instead. 252 ”
Atomic resonance spectrometers and filters – Matveev, 253 Zh. Prikl. Spektrosk., 46 (1987) 359–375
As pointed out by James Winefordner, “This is the first paper 253 (English translation 254 is available) in which the possibility of detecting radiation scattered from an object of interest through a scheme involving a three-step ionization process is described in detail and experimentally demonstrated. A resonance ionization imaging detector cell can be made with Hg vapor illuminated by three wavelengths (λ1, λ2, and λ3), where λ2, and λ3 are chosen to ionize the atoms present in an excited state as a result of previous absorption of photons at λ1. This last wavelength is provided by illuminating the object of interest with a laser wavelength chosen ‘ad hoc’ to produce scattered radiation at λ1. The scattering process can be resonance fluorescence or Stokes Raman scattering. The author253,254 has discussed a variety of processes that can be studied with this detector, 255 showing that it has superior figures of merit in many applications.”
An imaging-based instrument for fundamental plasma studies – Sesi, Hanselman, Galley, Horner, Huang, and Hieftje, 256 Spectrochim. Acta Part B, 52 (1997) 83–102
The key points of this paper, 256 as summarized by George Chan, are: “This paper 256 examined the considerations involved in the design of a multi-functional imaging-based instrument for fundamental plasma studies. This in-house developed instrument offers capabilities to measure Thomson scattering, Rayleigh scattering, three-dimensional radially resolved emission maps by means of optical tomography, and laser-induced fluorescence. When reading this paper, 256 one should appreciate the effort and thinking needed to assemble an instrument for a specific purpose, and what precautions and operation considerations are required. The theory part of the paper covered the scientific principles in a concise fashion and the instrument description part contained a detailed account of various practical considerations that were involved in the design. 256 For instance, the single biggest issue for the instrument was stray light, and multiple spectroscopic tricks were incorporated into the optical arrangement in the laser-beam delivery assembly, the light-collection optics, and the use of a laminar gas flow to further reduce dust (as scatterers) in the critical measurement volume. Furthermore, spectroscopic tricks such as a half-wave plate to match the polarization efficiency of the grating, a polarizer to cut off laser scattering, timing circuitry to avoid jitter uncertainty, and effective means to use two Rayleigh scatterers (Ar and He) to compensate for other scattering and stray light contributions, are useful techniques to learn.”
Mass spectrometers and analyzers
Tutorial on the quadrupole mass filter – Miller and Denton, 257 J. Chem. Educ., 63 (1986) 617–622
Stanley Crouch noted, “The basic operating principles, qualitative and quantitative descriptions and analytical applications of quadrupole mass filters are discussed. 257 ” Vassili Karanassios shared a similar view that this paper 257 contains “an educational description of the equations governing the operation of a quadrupole mass filter.” Steven Ray added, “This paper 257 provides an intuitive explanation of the operating principles of the quadrupole mass filter, which is the platform upon which many ICP–MS instruments are constructed. For students exposed to mass spectrometry for the first time, the notion of combining a high-m/z and low-m/z filter to create an m/z-bandpass instrument still resonates.”
Selected ion fragmentation with a tandem quadrupole mass spectrometer – Yost and Enke, 258 J. Am. Chem. Soc., 100 (1978) 2274–2275
As commented by Stanley Crouch, “This paper, 258 while not describing atomic mass spectrometry, was a breakthrough article in tandem mass spectrometry, resulting in many MS–MS applications and commercial triple-quadrupole MS instruments.” Alexander Scheeline added, “I recall Chris Enke discussing the lead-up to figuring out how to understand data produced by the instrument. At a meeting, he was discussing gas-phase collisions between molecular beams and static gases (alas, I am unsure with whom he was talking, perhaps Graham Cooks). At one point, Chris startled and blurted out, ‘your noise is our signal!’ That is, collisional fragmentation led to the possibility of daughter ion detection, while such collisions reduced parent ion signal and made it noisier.”
Gary Hieftje noted, “Chris also recounted that the idea of a tandem quadrupole system met strong opposition and skepticism from card-carrying mass spectrometrists, most of whom were accustomed to using sector-field instruments that operated at far higher ion energies and who had unsuccessfully attempted similar measurements.”
Micro-Faraday array for ion detection – Knight, Sperline, Hieftje, Young, Barinaga, Koppenaal, and Denton, 259 Int. J. Mass Spectrom., 215 (2002) 131–139
The key point of this paper, as outlined by Stanley Crouch, is that “an ion detector for mass spectrometry, based on a micro-Faraday array is described. 259 This integrating device showed a wide linear dynamic range with the capability of detecting an entire mass spectrum without mass analyzer scanning.” Alexander Scheeline clarified, “The multi-pixel Faraday array 259 is the ion equivalent of linear array detectors for photons and allows higher resolution, wider mass range detection than discrete Faraday cup detectors as have been employed by mass spectrometers practically since their invention.”
Distance-of-flight mass analyzer – (a) Enke and Dobson, 260 Anal. Chem., 79 (2007) 8650–8661; (b) Graham, Ray, Enke, Barinaga, Koppenaal, and Hieftje, 261 J. Am. Soc. Mass Spectrom., 22 (2011) 110–117; (c) Dennis, Gundlach-Graham, Ray, Enke, and Hieftje, 262 J. Am. Soc. Mass Spectrom., 27 (2016) 1772–1786
Stanley Crouch recommended the first two articles260,261 in this cluster as “these papers260,261 present a new mass spectrometric method based on the distance ions travel in a fixed time interval instead of the time required for ions to travel a fixed distance (time-of-flight).” Zhanxia Zhang noted, “A different tutorial review article 262 on this topic is presented and commented that distance-of-flight MS can provide both wider dynamic range and increased throughput for m/z of interest compared with conventional time-of-flight (TOF-)MS. The review also predicted that the distance-of-flight MS might play a key role in achieving simultaneous MS–MS.”
Alexander Scheeline added, “Any time a new approach to information sorting arises, the noise properties also change so that different problems can be solved while previously solved problems may continue to use existing sorting methods. Distance of flight260,261 obviates the need for ultrafast digitization required for time-of-flight MS.”
Fourier-transform ion cyclotron resonance (FT-ICR) mass spectrometer – Comisarow and Marshall, 263 Chem. Phys. Lett., 25 (1974) 282–283
Detlef Günther recommended this article on FT-ICR-MS as “The authors 263 introduced a new FT-ICR technique, which has enabled the analysis and separation of organic molecules at highest resolution. Here, the proof of concept and first application were reported.”
Michael Blades elaborated, “FT-ICR-MS was co-developed by Mel Comisarow and Alan Marshall 263 at the University of British Columbia. They recognized that there were similarities in the way signals were generated for NMR and ICR and reasoned that, using broadband excitation applied to an ICR cell, it should be possible to gain a multiplex advantage provided by a Fourier-transform approach to signal detection. They were successful in constructing the first instrument and demonstrated its S/N and other advantages. For modern instruments the principal advantage of FT-ICR-MS is ultrahigh mass resolution, and it is used in numerous analytical MS applications where high resolution is an asset, including ICP–MS and laser ablation (LA)–ICP–MS.
“When asked to comment on the first instrument, Alan Marshall recounted this interesting anecdote: ‘For the first several years, we borrowed a 1024-point digitizer from a UBC colleague, and fed the detected ICR transient to it. Mel then read out the 1024 data points, and I wrote them down by hand. However, they were in base-10, and the departmental FT-NMR data system operated in base-8, so I would manually convert the 1024 data to base 8, then subtract the average value from each data point (to avoid a big peak at zero frequency after FT), then type the 1024 data manually into the NMR computer to obtain the frequency-domain spectrum (which was then converted manually to an m/z spectrum).’”
Mass spectrometer based on electrostatic axially harmonic orbital trapping – Makarov, 264 Anal. Chem., 72 (2000) 1156–1162
The importance of this paper 264 is summarized by Detlef Günther as “this study 264 introduced a new concept of ion trapping using electrostatic fields and represents a combination of quadrupole and logarithmic potentials. The potential of this new concept has been transferred into an instrument which is currently used world-wide for the characterization of organic molecules.”
On-demand, monodisperse droplet introduction systems for atomic spectrometry
A unique system to generate isolated droplets for studying flame spectrometric processes – (a) Hieftje and Malmstadt, 265 Anal. Chem., 40 (1968) 1860–1867; (b) Hieftje and Malmstadt, 266 Anal. Chem., 41 (1969) 1735–1744
The first paper 265 in this set discusses the development of a unique system to generate isolated droplets for studying flame spectrometric processes and was recommended by several scientists, including: WingTat Chan, Stanley Crouch, Gary Hieftje, Norbert Jakubowski, David Koppenaal, and Ralph Sturgeon. The second paper 266 is on spectrochemical measurements with sample introduction as isolated droplets.
As remarked by Stanley Crouch, “An isolated droplet generator is described that allows sample droplets to be introduced into a flame. 265 The introduction of individual droplets allows study of such processes as desolvation, volatilization, atom or ion formation, and emission of radiation.” Norbert Jakubowski summarized the importance of this work 265 as “single droplet detection in atomic absorption spectrometry and how to generate monodisperse droplets. 265 ” The importance of this work, 265 as explained by Ralph Sturgeon, is “a device for generation and introduction of single aerosol particles into laminar flames permitted spectroscopic study and mathematical modeling of vaporization/atomization processes 265 for the first time. This single droplet introduction technology was the basis for many future fundamental studies of atom formation/dissipation, not only in flames, but plasma sources as well.”
WingTat Chan summarized the key point of the work 265 as and noted, “This is the first droplet generator for reproducible generation and introduction of individual droplets into a flame for the study of the sequence of events of a sample droplet in a flame. 265 The experimental setup allows direct observation of desolvation and analyte vaporization and studies of chemical and spectral interferences in the flame. Fifty years after the publication of the article, the experimental approach and theoretical considerations of heat transfer on the rate of desolvation are still being used in fundamental studies of single-particle analysis using modern atom sources such as the ICP. Figure 1 of the paper 265 is the well-known photograph of introduction of isolated droplets into a laminar flame with droplet introduction rate of 1000 droplets per second.”
David Koppenaal added, “These droplet generator papers265,266 intrigued me and inspired my first interest in atomic spectroscopy. I used these papers as a basis for a required PhD qualifying exam proposal involving a coupled liquid chromatography–flame emission/atomic absorption capability. I passed and my entry into atomic spectroscopy commenced.”
Detlef Günther continued, “The sample introduction of discrete sample volumes has been one of the major challenges and the problem has been solved within this paper. 266 The applications in the last 20 years using the same general principle indicate the importance of this paper. In combination with ICP–TOF-MS the sample introduction system has become the solution for quantification of nano-materials.”
Gary Hieftje indicated, “Howard Malmstadt consistently sought the ‘ideal’ in all things, both personal and scientific. To him, the ideal solution-introduction method for atomic spectrometry would be one that produced a perfectly monodisperse aerosol (i.e., all droplets would be the same size) and would allow all the droplets to experience exactly the same environment in the source (i.e., flame, at that time). He found such a device at the charged-particle laboratory at the University of Illinois and assigned me to couple the device to a chemical flame. After much trial and tribulation – and lack of success – I became known as the first graduate student in the research group whose time in the university would exceed two decades. However, things improved when I abandoned the slot burner originally employed and replaced it with an ‘Alkemade’ burner, developed by Kees Alkemade of the University of Utrecht where Malmstadt had spent a sabbatical leave. That burner produced an unusually stable flame surrounded by a flowing gas sheath that gave it an amazingly constant vertical temperature profile. The combination allowed us first to measure desolvation rates of droplets in a flame. 265 Later, we showed that the same arrangement allowed us to measure alkali metals at detection limits (20 ppt or 0.7 fg) 266 that rival those attainable by ICP–MS today.”
Monodisperse dried microparticulate injector (MDMI) – French, Etkin, and Jong, 267 Anal. Chem., 66 (1994) 685–691
Norbert Jakubowski noted that this article 267 is a key paper as it details “how to generate monodisperse droplets for single droplet introduction into the ICP.” George Chan elaborated the importance of this work as “this is the original paper 267 on the hardware development of the MDMI, which is a powerful and long-wanted tool for fundamental ICP studies. The MDMI was developed by researchers with aero-engineering background. It is interesting to read that, at least as outlined in this paper, 267 the motivation of the development was to delineate the potential of the MDMI approach to conventional nebulization of solution sample into the ICP. Specifically highlighted was the reduction of oxide-ion levels in ICP–MS and reduction of signal noise compared to sample introduction by a conventional nebulizer. The key point to note is the overall design of the MDMI together with modeling. With heating from a laminar-flow oven, the MDMI is able to produce an almost completely dry aerosol. The MDMI development has had a profound impact on fundamental ICP studies, as shown in later publications pioneered by John Olesik and others.”
John Olesik noted that “French et al. 267 had extensive expertise in fluid dynamics and could think in differential equations. In fact, the laminar-flow desolvation furnace into which individual (60-µm-diameter) droplets were injected was designed entirely from fluid-dynamics calculations. When properly aligned, the MDMI provided incredible stability in the partially desolvated droplet diameter at the exit, the droplet or particle flight path and even jitter in arrival time into the plasma. They predicted a jitter time of about 10 µs or better at a droplet frequency of 800 Hz; we measured it to be as small as 7 µs. Any desired monodisperse droplet diameter (from ∼20 µm in diameter to dried particles) could be produced by properly selecting the gas flow rate through the laminar flow furnace and the furnace temperature (of course they had a model to predict the proper selections).”
Thermal inkjet-based aerosol generator for micro-volume sample introduction – Orlandini v. Niessen, Schaper, Petersen, and Bings, 268 J. Anal. At. Spectrom., 26 (2011) 1781–1789
As noted by José Broekaert, “Micro-droplet production with the aid of an inkjet printer has been found to be a useful technique for the analysis of microsamples with plasma atomic spectrometry. The paper 268 describes a new approach for microsampling of liquids including new ways for calibration in dry liquid residue analysis.”
The originator of this technique, Nicolas Bings, provided additional comments: “The work 268 is the first presentation of a novel system for the introduction of liquid samples into analytical plasmas for atomic spectrometric analysis. The ‘drop-on-demand’ aerosol generator is based on the use of a modified thermal inkjet cartridge. The new system offers superior sensitivity, improved limits of detection, and better background-equivalent concentrations for the investigated elements. The achievable precision in multi-elemental drop-on-demand ICP–MS analysis was found to be comparable to the data gained with a conventional nebulization system.”
Analysis of single entities (aerosol, cell, and particle)
Particle and aerosol analysis with flame – (a) Crider and Strong, 269 Rev. Sci. Instrum., 38 (1967) 1772–1775; (b) Crider, 270 Rev. Sci. Instrum., 39 (1968) 212–215
Gary Hieftje recalled, “Single-particle analysis has long been pursued by means of spectrochemical methods. For example, Crider and Strong 269 utilized flame ionization for detection of single particles in an aerosol. Shortly thereafter, Crider 270 employed atomic emission from a chemical flame to give information on both the elemental content and size of individual aerosol particles. The particle size can be deduced from the length of the atomic-emission track of a particle as it volatilizes during its upward travel in the flame, while elemental content is indicated by the emission spectrum. These seminal studies precede by decades most of the work now being cited in the literature for elemental analysis of single particles.”
Particle and aerosol analysis with ICP–AES – (a) Kawaguchi, Fukasawa, and Mizuike, 271 Spectrochim. Acta Part B, 41 (1986) 1277–1286; (b) Bochert and Dannecker, 272 J. Aerosol Sci., 20 (1989) 1525–1528
As noted by Carsten Engelhard, “The analysis of nanomaterials is an important topic both at scientific meetings and in publications today. This article by Kawaguchi et al. 271 is recommended to readers who are interested in the characterization of nanomaterials. The idea to detect individual (isolated) particles with ICP sources dates back to 1986, when Kawaguchi et al. 271 demonstrated the detection of emission signals from monodisperse aerosols with ICP–AES. The authors 271 introduced airborne particles directly into an ICP and were able to deduce the concentration and size distribution of calcium oxide and copper aerosols down to the sub-micrometer particle level. Bochert and Dannecker 272 were able to show a continuous acquisition of millisecond time-resolved emission signals from particles (MnCO3) in the ICP in combination with a computer-assisted data processing solution and achieved estimated particle diameter detection limits of 0.52 µm (0.11 pg).”
Colloid analysis with single-particle (sp-)ICP–MS – Degueldre and Favarger, 273 Colloids Surf. A Physicochem. Eng. Asp., 217 (2003) 137–142
This paper by Degueldre and Favarger 273 is regarded as a pioneering work on single particle-inductively coupled plasma–MS (sp-ICP–MS), which is a technique for the measurement of individual nanoparticles or microparticles. The technique rapidly grew and expanded in the last decade. Accordingly, the Degueldre–Favarger article 273 is recommended by many scientists, including Carsten Engelhard, Norbert Jakubowski, John Olesik, and Martín Resano.
Both Martín Resano and John Olesik noted the article by Degueldre and Favarger as “the first article 273 to report on single particle-ICP–MS – an approach that it is now widely used for the characterization of nanoparticles.” Norbert Jakubowski regarded the publication as a “fundamental paper 273 for single particle (sp)-ICP–MS because it shows the application of time-gated detection of analyte signals for detection of particulate samples, which is the basis for the very popular single particle detection mode of ICP–MS for the analysis of nanoparticles.”
Carsten Engelhard added, “The article by Degueldre and Favarger is the first study in which an unmodified, commercial ICP–MS is used to characterize sub-micrometer sized colloids. 273 The authors used, similarly to early studies with ICP–AES, highly diluted aqueous suspensions with a low particle number concentration, allowing analysis of single particles even at lower time resolution, a concept nowadays termed single particle-ICP–MS.”
Direct single cell analysis with ICP – (a) Nomizu, Kaneco, Tanaka, Ito, Kawaguchi, and Vallee, 274 Anal. Chem., 66 (1994) 3000–3004; (b) Ho and Chan, 275 J. Anal. At. Spectrom., 25 (2010) 1114–1122
José-Luis Todolí remarked, “Single biological cell analysis with ICP was first proposed by Nomizu et al. 274 The authors describe a system consisting of a pneumatic nebulizer connected to a heated (∼70 °C) single-pass device as a first drying step. A portion of the dried aerosol was then injected into an ICP–AES spectrometer through a second pneumatic nebulizer. Calcium was the selected analyte, and the signal spikes were correlated with concentration by means of calcium acetate monodisperse aerosols. Only calcium could be measured in mammalian cell aggregates because of limited instrumental sensitivity and low transport efficiency (about 0.1%). The authors 274 suggested increasing the transport efficiency and using an ICP–MS in order to improve detection power and to extend single-cell analysis to additional analytes.
“Ho and Chan 275 determined major elements (i.e., Mg, Mn and Cu) in single cells of Chlorella Vulgaris, a unicellular alga, by means of ICP–MS. The authors used a conventional sample introduction system (i.e., a V-groove nebulizer fitted to a water-cooled double-pass spray chamber) to deliver on-line diluted, alga suspensions to the plasma. Two calibration strategies were described: using a suspension of 100 nm (average diameter) MgO particles or aqueous solutions as standards. The instrument software was set on time-resolved analysis mode in which the maximum data sampling rate was 100 Hz, so only a single element could be monitored at a time. The number of cells was determined from the frequency of the signal spikes generated by the arrival of cells to the ICP. The diameter of the algae ranged from 1.3 to 5.3 μm and the operating conditions (number density of algae cells, liquid flow rate) were selected to achieve, at maximum, one algal cell per droplet during the ICP–MS integration time (10 ms). 275 A linear relationship was found between the number of spikes and the number density of algae cells while the spike maximum remained unchanged. These two observations permitted overlapping signals from more than one cell to be discarded. The study 275 also demonstrated the rapid Cr3+ biosorption on the algae cell walls.”
Mass cytometry based on ICP time-of-flight mass spectrometry – (a) Tanner, Bandura, Ornatsky, Baranov, Nitz, and Winnik, 276 Pure Appl. Chem., 80 (2008) 2627–2641; (b) Bandura, Baranov, Ornatsky, Antonov, Kinach, Lou, Pavlov, Vorobiev, Dick, and Tanner, 277 Anal. Chem., 81 (2009) 6813–6822
This Analytical Chemistry article 277 published in 2009 on the use of ICP–MS for “mass cytometry” is considered a breakthrough by many scientists, including Michael Blades, José Costa-Fernández, Detlef Günther, Gary Hieftje, Norbert Jakubowski, Steven Ray, and Frank Vanhaecke, whereas John Olesik opted for another paper, 276 which was published in 2008. As summarized by John Olesik, “The importance of mass cytometry 276 is through the use of metal tagging reagents and an ICP–TOF-MS (for m/z > 70) for highly multiplexed measurement of (now more than 50) biomarkers in individual cells with many biomedical applications including identification and counting of rare cancer cells.”
Michael Blades spoke highly of the article by Bandura et al., 277 “Every once in a while a paper describing some new analytical method comes along that is a profound paradigm shift. This paper 277 is one of those and it describes an entirely new concept in biomedical ‘cell sorting’ based on rare-earth element isotopic affinity tags coupled with ICP–MS. It is a landmark paper that has revolutionized the characterization of cell populations in molecular biology. The innovation provides the ability to characterize about 30–40 different cell variants whereas fluorescence flow cytometry is limited to 6–8 at a maximum. The applications are far-reaching and include drug discovery, cancer treatment, and cell manufacturing for clinical applications. This would be my choice as one of the most important elemental analysis papers of the 21st century.”
José Costa-Fernández added, “It is recognized that one of the more exciting recent developments in ICP–MS is mass cytometry, 277 allowing real time analysis of individual biological cells (or other microparticles). Such a development constitutes an extension of conventional atomic spectrometry from inorganic analysis to the analysis of biological or clinical material. In addition to a detailed instrumental description of the system, there is evidence of the potential of the instrument for simultaneous detection of tens of surface antigens in a single cell. The authors 277 also mentioned that the instrument could be useful for real-time analysis of other microentities, as was demonstrated later (e.g., quantification of metal-encoded microbeads, surface modified with antibodies, for the development of bioassays).”
Detlef Günther remarked, “This work 277 introduces a new method for cancer detection based on rare earth antibody labelling and treatment of cells which are then analyzed by ICP–TOF-MS. The so-called CyTOF™ allows the detection up to 100 proteins (50 currently demonstrated) from single cells.”
Norbert Jakubowski commented, “a fundamental paper 277 describing the new principle of ‘mass cytometry’ for single cell detection – in this paper the tagging chemistry and instrumental developments for mass cytometry are discussed.”
As noted by Frank Vanhaecke, “This paper 277 constitutes the introduction of a new technique for real-time analysis of individual cells based on ICP–MS with a time-of-flight mass analyzer. Meanwhile, CyTOF™ is commercially available and by using lanthanide-tagged antibodies (with a single isotopically enriched nuclide of the lanthanide selected), a level of multiplexing in antigen detection in single cells is achieved that is superior to that in flow cytometry technologies based on fluorescence.”
Steven Ray commented, “Mass cytometry is often overlooked as an atomic spectrometry technique since the chemical information it provides relates to biological abundance. However, it is an excellent example of the utility of atomic spectrometry outside the immediate field of elemental analysis. This paper 277 describes the important analytical advantages of mass cytometry as explained by the originators of the technique.”
Gary Hieftje added, “One of the brilliant insights of the CyTOF™ is the way in which it overcomes the traditional problem of ICP–TOF-MS, specifically its limited duty cycle (typically around 10% for measuring most of the periodic table). In brief, TOF instruments snatch a pulse of ions from an incoming ion stream from the ICP and cannot ordinarily capture a new ion batch until the first is analyzed. The CyTOF™ solves this problem by limiting the mass range of ions that must be mass-analyzed, especially to the lanthanides. In turn, the narrower mass range requires less time to be measured, so ion batches can be extracted more rapidly, and duty factor raised accordingly.276,277”
Mass cytometry with laser ablation – Giesen, Wang, Schapiro, Zivanovic, Jacobs, Hattendorf, Schüffler, Grolimund, Buhmann, Brandt, Varga, Wild, Günther, and Bodenmiller, 278 Nat. Meth., 11 (2014) 417–422
Norbert Jakubowski recommended this work on highly multiplexed imaging of tumor tissues with subcellular resolution and noted, “It is the first paper 278 for a multiplex assay used to detect up to 40 different biomarkers in breast cancer tissue samples. This paper is the basis for a new technology with the brand name ‘imaging mass cytometry’ which is based on laser ablation ICP–TOF-MS.”
Detlef Günther added, “This paper 278 describes the CyTOF™ method carried out on a cell suspension transferred to direct tumor tissue analysis using laser ablation. The imaging mass spectrometry allows one-micrometer resolution and provides access to 32 different responses of the antibody treatment.”
Single particle-ICP–MS with conventional nebulizers – (a) Laborda, Jiménez-Lamana, Bolea, and Castillo, 279 J. Anal. At. Spectrom., 26 (2011) 1362–1371; (b) Pace, Rogers, Jarolimek, Coleman, Higgins, and Ranville, 280 Anal. Chem., 83 (2011) 9361–9369; (c) Olesik and Gray, 281 J. Anal. At. Spectrom., 27 (2012) 1143–1155
Steven Ray suggested the article by Laborda et al. 279 and noted, “Castillo and co-workers 279 demonstrate the first use of single particle-ICP–MS (sp-ICP–MS) for the purpose of single-nanoparticle sizing and elemental analysis.” The paper by Pace et al. 280 on determination of transport efficiency specifically for sp-ICP was recommended by John Olesik, who summarized its importance as “a description of means to calibrate transport efficiency for quantitative measurement of nanoparticle size and number concentration.”
The article by Olesik and Gray 281 was recommended by several scientists including José Costa-Fernández, John Olesik, José-Luis Todolí, and Zhanxia Zhang. As explained by John Olesik, “This paper entailed measurement of ICP–MS signals produced from individual nanoparticles with microsecond time resolution and provided practical considerations for accurate measurements. 281 The applications of single particle-ICP–MS to measure the size and number concentration of nanoparticles, especially but not exclusively engineered nanoparticles, have exploded recently.”
The comments from José-Luis Todolí on the importance of the Olesik–Gray article 281 are: “A discussion about the use of quadrupole mass analyzers or sector field instruments to perform the determination of nanoparticles is made together with the most important aspects that should be considered such as dwell time, particle vaporization time, particle residence time and diameter, detector dead time, detection limit in terms of particle diameter, and dynamic range in terms of particle number concentration. 281 ”
José Costa-Fernández remarked, “Nowadays, nanotechnology is a key research area in a wide variety of scientific and technological fields. While nanomaterials are expected to provide many benefits, there is a pressing need to properly characterize their physicochemical properties, including number concentration, size, surface chemistry, aggregation state, and how they interact with the environment. Inorganic mass spectrometry has evolved trying to offer solutions to the need of a proper characterization/detection of inorganic nanoparticles. Particularly, sp-ICP–MS is an emergent ICP–MS method for detecting, characterizing, and quantifying nanoparticles. The article by Olesik and Gray 281 would help students working on analytical nanotechnology to understand the basis of sp-ICP–MS as well as to identify key parameters to determine the number of particles per liter and analyte mass (particle size) distributions (key information in nanotechnology is very difficult to obtain accurately with alternative tools).”
The view of Zhanxia Zhang on this work 281 is: “This paper gives a unique consideration for determining the number of particles per liter and analyte mass (particle size) distributions from sp-ICP–MS measurements with quadrupole or sequential sector field mass spectrometers.” Zhanxia Zhang also noted that sp-ICP–MS can be performed with a monodisperse micro-droplet introduction system. 282
The importance of time resolution (microsecond over millisecond) in sp-ICP–MS – Strenge and Engelhard, 283 J. Anal. At. Spectrom., 31 (2016) 135–144
As noted by Carsten Engelhard, “One often overlooked mistake in sp-ICP–MS is the fact that, with state-of-the-art ICP–MS instruments available today, split particle events and particle coincidence can occur when data acquisition is performed, which leads to erroneous particle size histograms and particle number concentrations. As demonstrated in this work, 283 split particle events can be prevented by particle-triggered data acquisition and careful data processing. Here, sp-ICP–MS with a prototype data acquisition system provides microsecond time resolution (5 µs) for nanoparticle characterization and virtually eliminates artifacts from split particle events.”
Single particle (sp)-ICP–MS (reviews) – (a) Laborda, Bolea, and Jiménez-Lamana, 284 Anal. Chem., 86 (2014) 2270–2278; (b) Montaño, Olesik, Barber, Challis, and Ranville, 285 Anal. Bioanal. Chem., 408 (2016) 5053–5074
José Costa-Fernández recommended the Anal. Chem. “Feature” article 284 and noted, “The review article 284 is an excellent piece of work summarizing the fundamentals and the key-point instrumental issues to be considered when running the ICP–MS in a single-particle mode for nanoanalysis. This paper 284 can be used as a tutorial for introducing sp-ICP–MS.”
This review article 285 on sp-ICP was nominated by Zhanxia Zhang, “The single particle ICP–MS is a powerful technique for the detection and characterization of aqueous dispersions of metal-containing nanomaterials. The review 285 is well written and could be useful for those who are just beginning in sp-ICP–MS.” Steven Ray also recommended this article because “development of both the theory and practice of sp-ICP–MS is coherently explained by Montaño et al. 285 ”
Other novel instrumentation
Laser filaments for atmospheric analysis – Kasparian, Rodriguez, Méjean, Yu, Salmon, Wille, Bourayou, Frey, André, Mysyrowicz, Sauerbrey, Wolf, and Wöste, 286 Science, 301 (2003) 61–64
As noted by Richard Russo, “This paper 286 is the first demonstration of kilometer range optical analysis by using femtosecond filaments through the atmosphere. The technique was later developed into filament-induced stand-off LIBS for atomic (elemental) measurement 287 as well as filament-induced laser ablation molecular isotopic spectrometry (LAMIS) for remote isotopic analysis. 288 ”
Analytical Atomic Spectrometry with Arc and High-Voltage Spark Discharges
Arc
Fractional distillation in carbon arc spectrochemical analyses – Strock and Heggen, 289 J. Opt. Soc. Am., 37 (1947) 29–36
As noted by Alexander Scheeline, “Ideally, one wishes to have all elements emit light in proportion to their concentration in the original sample. In fact, lower-boiling elements distill sooner than higher-boiling elements. Strock 289 documents the distillation process. Pulsed discharges and LIBS try to circumvent the problem, but any sampling that depends on thermal processes rather than volumetric displacement or total consumption will suffer from bias due to sampling from lowest to highest boiling point.”
Direct current (DC) plasma jet as a spectroscopic source – Margoshes and Scribner, 290 Spectrochim. Acta, 15 (1959) 138–145
Michael Blades remarked, “This is a seminal paper on DC plasma jets 290 that led to the development and eventual commercialization of two- and three-electrode plasma jets. The innovation involved was the use of a ‘plasma jet’ for solution analysis analogous to the approach used for flame emission spectroscopy of the day. The original paper from Margoshes and Scribner 290 preceded the similar application of the ICP for elemental analysis of solutions by five years and as such it was a template for plasma spectrochemical analysis. The follow-up publications291,292 improved on the stability and utility of the plasma jet approach to nebulized solution analysis. It is interesting to follow the evolution from DC arc to plasma jet through these papers.”
High-voltage spark
Development and fundamental characterization
Characterization of spatial and temporal emission profile of spark discharge and benefits of synchronously gated detection – (a) Walters and Malmstadt, 293 Anal. Chem., 37 (1965) 1484–1503; (b) Bardócz, 294 US Patent 3 315 560A (1962); (c) Walters, 295 Appl. Spectrosc., 26 (1972) 17–40; (d) Walters and Barnhart, 296 US Patent 4 393 327 (1983)
As stated by Stanley Crouch, “The Walters–Malmstadt paper 293 presents a basic, mechanistic study of a high-voltage spark discharge of the type used in analytical atomic emission spectroscopy. Time-resolved emission spectroscopy was used to study the critical stages in the lifetime of a spark discharge.” Nicolas Bings recommended this paper 293 with a similar view.
Alexander Scheeline commented, “Walters told his Wisconsin research group that his work was accelerated by a visit to Malmstadt's lab by Árpad Bardócz whose time- and space-resolved work preceded Walters's. While Bardócz's English was little better than Walters's non-existent Hungarian, gesticulating indicated that there was interesting radial spatial structure in addition to axial and temporal structure to the discharges. Bardócz was doing time-resolved spark spectroscopy in the 1950s, but it was through Walters's efforts that such research became known to a largely Western audience. While Bardócz patented an approach to time-resolved spark spectroscopy using a screen or other oscillating mechanical obscuration in 1962, 294 his papers on spatial resolution, 297 self-reversal, 298 and time-resolution 299 appeared in English much later. While his work was ground-breaking, the obscurity of his earlier work, not published in western journals, meant that his influence was primarily not via the literature but via what he taught to Malmstadt and Walters.”
Nicolas Bings recommended an additional article 295 and noted, “This classic paper by Walters 295 deals with source characterization on spark discharges for emission spectroscopy.” Alexander Scheeline added, “Walters's 1972 paper 295 on spark breakdown was the highest time-resolution study to that year on the mechanism of spark ignition and channel formation. It used a quarter-wave spark source, one of only two to my knowledge that were ever used for emission spectrochemical analysis. Quarter-wave sources produced higher repetition rates and more spatially stable discharges than typical switched capacitor triggered sparks, but the need for a radiofrequency power supply, unfamiliar to atomic spectroscopy vendors, meant the source was never commercialized.”
The patent 296 on synchronously gated detection was recommended by Alexander Scheeline, who opined, “While this work 296 and the associated dissertation 300 was not, to my knowledge, written up as a journal article, it is the culmination of two decades of work on spatiotemporally resolved atomic emission from sparks. By blocking continuum from the spark channel and gating out the initial continuum from channel formation, the signal-to-background ratio for neutral atomic emission is maximized and thus working curves made as linear and precise as possible.”
Adjustable-waveform high-voltage spark source – Walters, 301 Anal. Chem., 40 (1968) 1672–1682
By the 1960s, high-voltage spark sources had largely supplanted DC arcs for the direct emission-based analysis of conducting (usually metal) samples; they provided better precision, were somewhat less troubled by matrix effects, and offered comparable detection limits. However, as Gary Hieftje indicated, “High-voltage spark sources were ordinarily free-running and therefore less easy to control. In this paper, 301 along with many other similar path-breaking publications by the research group of John Walters, it is shown that simple electronic circuitry can be used to trigger a spark source such that far better control can be established. Here, the circuit can be readily adjusted so unidirectional or oscillatory radiofrequency (RF) sparks can be generated, and with controllable damping so the number of RF cycles can be regulated.”
Arne Bengtson added, “This paper 301 marks a significant improvement in the performance of spark sources for analytical spectroscopy. This was very important for the development of spark OES instruments for routine analysis and process control in the metallurgical industry. For several decades these instruments have been the workhorses in analytical laboratories in the metallurgical industry, nowadays often the central part of completely automated laboratories. Spark OES instruments are one of the instruments for spectrochemical analysis produced in the largest numbers globally.”
Formation and growth of a stabilized spark discharge – Walters, 302 Appl. Spectrosc., 26 (1972) 323–353
This paper 302 is suggested by Alexander Scheeline with an annotation: “If one wants to understand how breakdown occurs, this paper 302 is probably the best one ever written. That it was accomplished with the state of high-speed electronics in the early 1970s is astonishing. While framing cameras are faster now and their response more linear, the essential mechanisms were clear in this landmark paper.” Nicolas Bings expressed a similar view that this paper 302 is a classic in spark spectroscopy.
Elemental fractionation in spark discharges – Brewer and Walters, 303 Anal. Chem., 41 (1969) 1980–1989
According to Alexander Scheeline, “Craters in metallic electrodes from sparking show melting and freezing of analyte, and the concentrations of residual elements are enriched in higher-boiling constituents. 303 The report here connects the more extreme fractional distillation behavior of arcs with the lesser sampling biases of sparks. The work was later expanded and clarified by John Olesik304,305 as discussed in Section 9.2.1.8.”
Quarter-wave spark source for the production of stable spark discharges – (a) Walters and Bruhns, 306 Anal. Chem., 41 (1969) 1990–2005; (b) Renter, Uchida, and Walters, 307 Spectrochim. Acta Part B, 32 (1977) 125–154
This pair of articles documented the development and use of a quarter-wave resonator for better control of the timing in spark discharges and is recommended by Alexander Scheeline, who remarked: “A quarter-wave electrical transmission line reflects and amplifies a radiofrequency wave until the open gap at one end experiences such a high potential that the surrounding gas ionizes and a spark channel forms. The low impedance channel can then conduct current to a sample and excite an analyte. This paper 306 is the first report of the use of a quarter-wave line to ignite spark discharges. Such sparks are triggered by a pulsed radiofrequency source (here 162 MHz, or vacuum wavelength 1.85 m for ¼ wavelength of 46.3 cm) and so are periodic in time and positionally stable. By increasing the radiofrequency to 323 MHz 307 from the earlier 162 MHz, 306 the size of the source was halved and the volume reduced by a factor of 8. 307 The size made it practical for commercialization though, as far as I know, no replica of this source was ever made.”
Reduction of spark timing jitter to nanoseconds through the use of hydrogen thyratron and diode as switching element – (a) Coleman and Walters, 308 Spectrochim. Acta Part B, 31 (1976) 547–587; (b) Walters and Coleman, 309 US Patent 4 055 783 (1977)
This set of articles documenting a conceptually new type of electronic spark source is recommended by Alexander Scheeline, with annotation, “Time-gated measurements require synchronization between spark triggering and detection. Prior to invention of the thyratron-triggered source, one either had to sense spark initiation to trigger data collection, use a periodically fired source (see quarter-wave sources 306 in this compilation), or trigger from the zero crossing of the AC mains, which inherently had 0.1% jitter. With the thyratron source, radiofrequency noise was reduced and triggering jitter reduced to nanoseconds.308,309”
Inter-relationship among intensity, temperature, and density variations in a spark discharge – Oberauskas, Serapinas, Šalkauskas, and Švedas, 310 Spectrochim. Acta Part B, 36 (1981) 799–807
Comments for this paper, provided by Alexander Scheeline, include: “Working behind the Iron Curtain, with limited resources, little contact with the Western time- and space-resolving emission communities, Serapinas and co-workers 310 picked up the thread left by Bardócz in Hungary and did definitive work on spark diagnostics in Vilna, Lithuania. That such work could be done at a competitive level under such circumstances speaks to the group's ingenuity, drive, and scientific dedication. This paper 310 shows the distribution, from spark to spark, of excitation temperatures, shows that analyte temperature and support-gas temperature evolve differently, and provides a fundamental basis for distinguishing response variability due to plasma chemistry versus analyte uptake. The cited paper preceded the Colloquium Spectroscopicum Internationale, held in Amsterdam in 1983. Leo de Galan arranged the most sumptuous reception at this conference of any I have ever attended. No sooner had I arrived at the reception, that I stumbled upon Petras Serapinas. The result was that I, uncharacteristically, missed out on most of the feast, and alas so did Petras, as we talked for over an hour about our related work. After it was clear he was talking with an American (thus from across the Iron Curtain), I asked: ‘What do folks in Lithuania think of being part of the USSR?’ He replied, ‘Nobody knows 'cause nobody asks.’ I sent him some reprints after the meeting, and slipped a page of Chemical and Engineering News into the stack with western views of strained East/West relationships. After the Wall came down in ’89, Serapinas became a government official, and he sent me a card thanking me for my earlier support. It was modest support, admittedly, but every little bit counts!”
Origin of statistical fluctuations in spark signal and statistical evaluation – (a) Onodera, Saeki, Nishizaka, Sakata, Ono, Fukui, and Imamura, 311 Tetsu-to-Hagane, 60 (1974) 2002–2012; (b) Olesik and Walters, 305 Appl. Spectrosc., 37 (1983) 105–119
As remarked by Arne Bengtson, “This work 311 pioneered a novel technology in spark OES, integration of the signals of single sparks and subsequent statistical analysis of the data. The technique was termed ‘pulse distribution analysis’. The single spark data (‘pulsograms’) contain information about the non-metallic inclusion content, since a hit on an area with an inclusion gives strong signals from inclusion elements. The utilization of pulse distribution analysis has emerged as a highly useful tool for rapid screening of the inclusion content in the steel industry.”
Alexander Scheeline recommended this article by Olesik and Walters 305 and noted, “When sampling and excitation are sufficiently reproducible, the statistical fluctuations in spark atomic emission spectrometry 305 (or, more recently, LIBS) are limited by the microstructure of the alloy being sampled. One cannot remove such variance from working curves; ideally, the fluctuations should be dominated by variance in the grain structure of the sampled solid, not by photometric shot noise or instrument drift. Note how the Olesik and Walters paper builds on the earlier Brewer and Walters work, 303 in that precision and accuracy both depend on metallic grain structure and the volatility of alloyed elements in specific metallic grains.”
Electron number density measurement and mapping in a high-voltage spark by means of the Hβ Stark broadening – (a) Scheeline, Kamla, and Zoellner, 312 Spectrochim. Acta Part B, 39 (1984) 677–691; (b) Bye and Scheeline, 313 Spectrochim. Acta Part B, 48 (1993) 1593–1605
This pair of articles is recommended by Alexander Scheeline with the following notes: “The first article 312 was my group's first attempt at using the comprehensive tables for Stark broadening of H lines by Vidal, Cooper, and Smith 181 on time-resolved spark emission recorded with photographic plates. Because photographic plates give nonlinear response, I only trust relative measurements, not absolute numbers, in this paper. 312 If anything, the paper showed the futility of working with nonlinear, irreproducible detectors for performing plasma diagnostics and indicated the desperate need for charge-coupled array detectors to replace photographic plates. This second article 313 is a rerun of the 1984 Spectrochimica Acta paper, 312 but using a CCD and computer reduction of the data. Precision and accuracy are both drastically improved. Stark broadening is better at measuring electron concentration than temperature, and the broad optimum in fitting line shape to temperature shows the limitations.”
Historical developments, diagnostics, and opportunities in spark discharges (review) – Walters, 314 Appl. Spectrosc., 23 (1969) 317–331
Alexander Scheeline suggested this key paper by Walters 314 and commented, “Walters 314 gives a thorough history of high-voltage spark discharges from early work in the nineteenth century through the first quarter century after the end of World War II. It is unlikely that any important paper was missed. The dominant detector for this era was the photographic plate, although photomultipliers began to influence the literature after the invention of direct-reading spectrographs. Because laser-induced breakdown plasmas are, in essence, sparks without net directed current, this review 314 is also basic background information for LIBS. While the current review focuses on papers, not books, the reader interested in deep background is also commended to read J.M. Meek and J.D. Craggs, Electrical Breakdown of Gases as a culturally important treatise. First edition is from 1953; second edition is from 1978.”
Unique approaches for chemical analysis with spark
Spatially resolved microanalysis by spark emission spectroscopy – Scheibe and Martin, 315 Spectrochim. Acta, 1 (1939) 47–65
As noted by Ulrich Panne, “This paper 315 is the first record of spatially resolved microanalysis by spark emission spectroscopy and an ingenious instrumental design. A capillary electrode replacing the slit of the spectrograph, which also spatially blocked the emissions from the gas atmosphere and electrodes simultaneously, enabled via a current-limited DC discharge a spatial resolution of 20 μm. With a simultaneous movement of the sample and photographic plate an efficient observation of spatially resolved emission spectra on a single photographic plate was achieved and the grain boundaries of Mg in Al alloys were detected. The performance of the method is thus quite comparable to current experimental systems for μ-LIBS.”
Spark-in-spray and liquid-layer-on-solid-sample spark technique for analysis of solution samples with spark emission spectrometry – (a) Malmstadt and Scholz, 316 Anal. Chem., 27 (1955) 881–883; (b) Barnes and Malmstadt, 317 Anal. Chem., 46 (1974) 66–72
As remarked by Alexander Scheeline, “At a time when flame emission was the standard way to perform emission measurements on solutions (a decade before invention of the ICP), spark-in-spray 316 seemed like an interesting way to couple direct readers and simultaneous or sequential measurement to solution analysis, with different matrix effects than would be found in combustion flame sampling and excitation. This paper on liquid-layer-on-solid-sample spark technique 317 describes an interesting way to either perform solution analysis or response calibration for sparks. It avoids the stochastic aspects of spray-in-spark. 316 ”
Miniature, low-energy spark discharge system for spectrochemical analysis of solutions – Zynger and Crouch, 318 Appl. Spectrosc., 29 (1975) 244–255
Alexander Scheeline noted, “This work, 318 20 years after the original Malmstadt–Scholz spray-in-spark work, 316 shrank the apparatus and made it both safer and more portable. It was my introduction to sparks. Jack Zynger's detection limit for P as PO43− using the ‘Zynger zapper’ (a take-off on an advertisement for the packaged cupcake, the Zinger, where a hungry thief was the ‘Zinger zapper’), as the Crouch group nicknamed the spark source, was lower than my detection limit for the same species using stopped flow kinetics. ‘Where can I go to graduate school to learn more about sparks?’ I asked. The rest is history.”
Microanalysis with microsparks – (a) Vogel, 319 Methodes Physiques d'Analyse, 3 (1967) 131–135; (b) Vogel, 320 US Patent 3 316 801 (1967)
Alexander Scheeline commented, “Only 16 libraries world-wide hold copies of the journal Methodes Physiques d’Analyse. Vogel 319 worked on the Manhattan Project. Uranium pellets swelled and cracked the jackets in fuel rods, and it was with microsparks that Vogel determined that the problem was silicate inclusions in the uranium. Prior to wide availability of electron microscopes, the microspark with ∼20 μm resolution was an important way to spatially map alloys. This nearly forgotten paper, published long after the war and in an obscure journal, was the only public report of Vogel's microspark work. 319 The patent 320 provides a detailed description of the hardware, although it has no spectroscopic data and doesn't show micrographs as in the journal article. 319 Jennifer Cappel Cousins (now Larson) 321 in my group was, I believe, the only person to pick up Vogel's work 319 and try to extend it. She detected emission using a CCD, but obtained such limited data that we never submitted an article. Because Vogel lived in Urbana (Illinois), he was able to advise us along the way.”
Analytical Atomic Spectrometry with Flames and Furnaces
Flames
The Alkemade burner – (a) Alkemade, Smit, and Verschure, 322 Biochim. Biophys. Acta, 8 (1952) 562–570; (b) Alkemade, 35 A contribution to the development and understanding of flame photometry, doctoral thesis (1954); (c) Hollander, 323 Self-absorption, ionization and dissociation of metal vapor in flames, doctoral thesis (1964); (d) Snelleman, 324 A flame as a standard of temperature, doctoral thesis (1965); (e) Snelleman, 325 Metrologia, 4 (1968) 117–122
Gary Hieftje commented: “Humphry Davy is reputed to have said, ‘Nothing begets good science like the development of a good instrument.’ The same, of course, can be said about critical instrument components. In the field of atomic spectrometry, these components include novel detectors, means of spectral dispersion, and both atomization and illumination sources. One such source, termed the ‘Alkemade burner’ after its inventor, played an important role in fundamental atomic spectrometry. A prototype of the burner that was later adopted was first described in 1952. 322 That burner played a key role in Kees Alkemade's doctoral studies; more details can be found in his dissertation. 35 Indeed, any serious student of spectrochemistry should make every effort to secure a copy of the seminal investigations discussed in that detailed thesis; failing that, the synopsis prepared by John Willis 326 provides a valuable overview. As ultimately configured, the Alkemade burner was roughly of the Meker configuration, 327 but featured two sets of inputs that fed, respectively, an inner flame and an outer concentric ring. The outer ring, in turn, could support a surrounding flame or an inert gas such as nitrogen or argon. The inert gas, when used, stabilized the central flame and helped reduce the entrainment of atmospheric gases into it; a surrounding flame, in contrast, provided a somewhat adiabatic barrier around the central flame and gave it an unusually flat vertical and horizontal temperature profile. Perhaps the best description and schematic diagram of this later burner can be found in the thesis of Tj. Hollander, 323 one of Alkemade's students. The arrangement was so effective that the flame was subsequently suggested by Willem Snelleman of the University of Utrecht to be used as a standard of temperature.324,325 Many other fundamental studies arose from use of that flame, not only in the Alkemade group but also by visitors to that lab, including Howard Malmstadt and Jim Winefordner, both of whom brought working burners back to their research groups. My own thesis research, involving the use of isolated droplets for both analytical measurements and for determining droplet desolvation rates, would not have been successful without that burner. Regrettably, no complete description of the ultimate Alkemade burner (sometimes called the ‘Hollander burner’) appears to exist in the conventional literature.”
Birth of modern flame analytical atomic absorption spectrometry (AAS) – (a) Walsh, 328 Spectrochim. Acta, 7 (1955) 108–117; (b) Alkemade and Milatz, 329 J. Opt. Soc. Am., 45 (1955) 583–584; (c) Alkemade and Milatz, 330 Appl. Sci. Res., 4 (1955) 289–299; (d) Russell, Shelton, and Walsh, 331 Spectrochim. Acta, 8 (1957) 317–328
The Walsh 328 and Alkemade–Milatz329,330 papers marked the birth of modern flame analytical AAS and accordingly were recommended by many scientists, including Nicolas Bings, Michael Blades, WingTat Chan, Stanley Crouch, Igor Gornushkin, Gary Hieftje, Vassili Karanassios, David Koppenaal, Steven Ray, Martín Resano, Benjamin Smith, and Ralph Sturgeon.
Michael Blades and Steven Ray regarded Walsh's publication 328 as “A seminal paper on the use of AAS for elemental analysis.” David Koppenaal heralded Walsh's paper 328 as “…the article 328 that started atomic absorption spectrometry. Original theory, instrumentation basics, and analytical promise are provided by the technique's inventor. One of the most important atomic spectroscopy papers ever!” WingTat Chan added, “The article 328 discusses the theoretical basics of the relationship of atomic absorption and analyte concentration. Absorption is considered to be superior to emission method of analysis because absorption is based on the ground-state analyte atoms of which the population is less susceptible to variations in temperature compared to the excited-state population. Measurement of intensity ratios is also easier than measurement of emission intensity in absolute units. The article also discusses the experimental issues of absorption (broadening of absorption line width and analyte emission) and practical solutions to the problems. The possibilities of atomic absorption as an absolute method of analysis and isotopic analysis are also briefly discussed.”
Igor Gornushkin noted, “The foundation of many modern analytical techniques was laid in 1950s–1960s. The paper by Walsh 328 in 1955 lays a foundation for flame AAS using narrow-line light sources. It revisits, in simple terms, the governing relationships for light–atom interaction and discusses the possibility of isotope and even absolute analyses by flame AAS.”
Stanley Crouch remarked, “The Walsh 328 and Alkemade 329 papers were published nearly simultaneously and represent the first descriptions of atomic absorption spectroscopy for analysis using flames as atom reservoirs. Atomic absorption is now one of the major elemental analysis techniques with widespread utility.”
Nicolas Bings shared a similar view and noted, “The first two papers on atomic absorption spectrometry published in the same year by the pioneers Alkemade and Milatz 330 as well as Walsh 328 should be strongly recommended. In these classic works, the potential applications of atomic absorption for chemical analysis are described when a hollow-cathode lamp is used as primary emission source.”
Views from Ralph Sturgeon are, “The framework for the foundation of modern analytical atomic absorption and the theoretical factors governing the relationship between atomic absorption and atomic concentration are presented by Walsh 328 for the first time along with an experimental assessment of recording atomic absorption spectra. It is also suggested that the absorption method offers the possibility of providing a simple means of isotopic analysis. The letter by Alkemade and Milatz 329 is the second commonly recognized publication acknowledging the foundation of modern AAS that was published at virtually the same time as Walsh's paper, 328 but was never pursued by the authors. Also cited is a full-length paper 330 published in the same year.”
Vassili Karanassios provided an additional view and stated, “The Walsh paper 328 is a classic and it provides the theoretical foundation for the factors governing atomic absorption versus concentration whereas the Alkemade and Milatz paper 330 describes a simple and yet conceptually very elegant instrument that was developed in the mid-1950s. To use a quote about simplicity, ‘there is beauty in simplicity.’ Or (to use another quote on the topic, this time from Einstein), ‘everything must be made as simple as possible. But not simpler.’”
Martín Resano shared yet a different view on Walsh's paper 328 by noting that it is “key in the development of modern atomic absorption spectrometry, introducing flame AAS. 328 It is also very informative to read some later reviews by Alan Walsh on The development of the atomic absorption spectrophotometer, 332 which starts with the following sentence: ‘My development of the atomic absorption spectrophotometer originated in one sublime moment during which I was able to avoid being stupid.’”
Benjamin Smith expanded the discussion and included the article by Russell et al., 331 and explained, “It is rare for an analytical scientist to be able to propose and demonstrate an entirely new method of chemical analysis all at once. In this pair of papers,328,331 Alan Walsh described the theory for atomic absorption spectroscopy and then showed its successful application, sparking a flurry of research, commercialization and useful application which extended for many years. Acceptance of the method by chemists was slow at first and commercial instruments took several years to appear. However, the method of atomic absorption soon became the most widely used technique for trace elemental analysis and eventually replaced flame emission and, to a large extent, arc and spark methods. Annual worldwide instrument sales reached 1000 in 1966 and by 1975 were above 6000. In the early 1950s, Walsh had been thinking about the value of probing the much larger ground state population in a flame, rather than the feeble excited state population seen in emission. In March 1952, while working in his vegetable garden at home he suddenly had the realization that one could do so using a chopper to extract the absorption signal in the presence of emission at the same wavelength. A simple experiment the next morning in the lab, using sodium, proved that such measurements were feasible. Several years of diligent research then led to his first publication in 1955.”
Both Michael Blades and Ralph Sturgeon proffered this article 331 and commented, “This article 331 demonstrated the utility of an early simple single beam AAS instrument to encourage the uptake and growth of this new technique within the analytical community. Although the authors 331 recognized its limitations, they concluded that the inexpensive single beam design was fit-for-purpose for most analytical applications at that time, as the noise from the hollow-cathode lamp source (∼1% relative) was deemed to be acceptable. As instrumentation improved over the years, full double beam design was ultimately implemented.”
Gary Hieftje echoed many of the foregoing remarks but added, “A key distinction between the Walsh 328 and Alkemade–Milatz 330 studies is Walsh's use of a hollow-cathode lamp (HCL) as the primary light source for AAS. Because the HCL emits an extraordinarily narrow spectral line, the atomic-absorption behavior more closely follows the linear absorbance–concentration pattern predicted by the Beer–Lambert law. Further, it simplifies wavelength adjustment in the monochromator and virtually eliminates spectral interferences. Although some exaggerated claims were later made by others about the freedom of AAS from matrix interferences, such claims were found to result from the use of better nebulizers and burners rather than from the atomic-absorption process itself.”
Development of total-consumption (“Beckman”) burner – Gilbert, 333 US Patent 2 714 833 (1955)
Gary Hieftje noted, “The Beckman DU UV-visible spectrophotometer had become a standard laboratory fixture for molecular absorption measurements by the early 1950s. It was therefore attractive as a potential component of a flame photometer useful for elemental analysis. Paul Gilbert of Beckman Instruments made the transition possible with his invention of a total-consumption burner with an integrated nebulizer operated in the total-consumption mode. 333 The burner, soon commercialized, was fabricated from three concentric tubes, the innermost of which served as the solution-transport device and the outer tubes carried the fuel and oxidizer gases. The intermediate tube ordinarily transported the oxidizer, usually oxygen, because its higher flow served well to nebulize the solution in the central tube and to draw that solution into the central tube via the Venturi effect. The outermost tube carried the fuel gas. Because the fuel and oxidizer were not mixed until they exited the burner, flashback common in premix burners could not occur, so gas mixtures such as oxygen–hydrogen and oxygen–acetylene could be used safely. However, although the resulting flames were extremely hot, they were also turbulent and noisy (both acoustically and signal-wise). Moreover, because the device incorporated no spray chamber, many large droplets were introduced into the flame, so vaporization-based matrix interferences were troublesome. Still, the ‘Beckman burner’ brought flame-emission spectrometry into common use and deserves a prominent place in this compilation.”
Nitrous oxide–acetylene flame in atomic absorption spectroscopy – (a) Willis, 334 Nature, 207 (1965) 715–716; (b) Amos and Willis, 335 Spectrochim. Acta, 22 (1966) 1325–1343; (c) Willis, 336 Spectrochim. Acta Part B, 52 (1997) 667–674
The first article 334 in this set is a communication on the development of the nitrous oxide–acetylene flame for atomic absorption spectroscopy whereas the second article 335 contains a detailed account of the research development. The third article 336 is a personal account from Willis on this development.
Ralph Sturgeon recommended both articles334,336 and noted, “A hotter (reducing) and more stable (no flashback) flame than the oxygen–acetylene could be supported on a 4 in. × 0.015 in. slotted burner using nitrous oxide–acetylene, permitting access to the AAS determination of many refractory elements.334,336”
As noted by WingTat Chan, “The article 335 documented details of the characteristics, operational procedures and parameters, and analytical performance of pre-mixed nitrous oxide–acetylene and oxygen–nitrogen mixture–acetylene flames with slot burner for AAS. Nitrous oxide–acetylene is now a common fuel–oxidant mixture for AAS. The development of the high temperature (2955°C) and relatively easy to operate nitrous oxide–acetylene flame is a breakthrough that adds 25 ‘refractory’ and ‘borderline’ elements to the list of elements that can be determined by flame AAS. Ionization and chemical interference in the high-temperature flames is also discussed. 335 ”
Gary Hieftje added, “The high burning velocity of many gas mixtures such as oxygen–acetylene and oxygen–hydrogen precluded their safe use in premixed burners; the downward-burning gases in the flame would exceed the exit velocity of the unburned gas mixture from the burner top, to ignite the premixed combination in the burner body. The well-known and dreaded phenomenon of flashback would result. It was John Willis's insight into this process that led to his study 335 and application of the nitrous oxide–acetylene combination, which produces a high-temperature flame but offers a lower and therefore safe burning velocity.”
Distribution and measurement of the free atom fraction in an atomic absorption flame – (a) Rann and Hambly, 337 Anal. Chem., 37 (1965) 879–884; (b) de Galan and Winefordner, 338 J. Quant. Spectrosc. Radiat. Transf., 7 (1967) 251–260; (c) Walters, Lanauze, and Winefordner, 339 Spectrochim. Acta Part B, 39 (1984) 125–129
This set of three articles337–339 was recommended by Ralph Sturgeon, who noted, “In the paper by Rann and Hambly, 337 two-dimensional distributions of a number of atoms as well as OH radical and temperature are mapped in an air–acetylene flame, providing insights into the processes governing free atom formation and the influence of highly reducing and oxidizing environments on sensitivity. In the second article, 338 absolute degrees of atomization of 22 elements in a fuel-rich air–acetylene flame were calculated from measurements of total absorption using a continuum, rather than a line source. As copper was determined to be completely atomized, it was proposed as a standard of reference for the air–acetylene flame which gave rise to its use in numerous subsequent studies in this area. In the third article, 339 the divided output from a single pulsed dye laser provided for both a low intensity probe and a high intensity saturating beam which were crossed to interrogate a small volume of the flame at the Sr I 460.733 nm line. The absorbance determined along a line of sight defined by the probe beam was decreased due to perturbation to a small volume element intersected by the saturation beam. An air–acetylene flame was translated parallel to the probe beam to provide spatial mapping of the concentration ratio of the atoms in the intersecting volume to the total number in the flame volume captured by the probe beam. Similar subsequent approaches in other laboratories enabled directly probing small plasma volumes for numerous other species to effect spatial mapping, including electron number density (e.g., Thomson scattering) and gas temperatures (see the discussion on the paper by Welz et al. 340 in this compilation), yielding 3-D profiles of sources without the need to apply Abel inversion techniques. This, and similar methodologies, provided the basic tools for subsequent flame and plasma diagnostic studies.”
Extended path length for AAS measurement – Fuwa and Vallee, 341 Anal. Chem., 35 (1963) 942–946
In this work, 341 absorption path length up to a total of 99 cm was described. As a result of the extended absorption path, detection limits as low as 0.4 parts-per-billion (ppb) were reported. As noted by Ralph Sturgeon, “Vycor tubes of varying length were mounted above a conventional burner system such that flame gases could enter the tube along with nebulized analyte solution to provide an increased absorption path length. 341 Sensitivity was increased for a number of elements. These results provided the foundation for numerous subsequent studies relying on long-path AAS measurements as well as trapping and release of analyte atoms on various water-cooled tubes with and without an additional slotted quartz tube (e.g., as in the work by Watling 342 ).”
Flame emission spectrometry – Pickett and Koirtyohann, 343 Anal. Chem., 41 (1969) 28A–42A
David Koppenaal recommended this Anal. Chem. A-page article 343 because “this review 343 provides a fresh and compelling look at flame emission spectrometry approaches and makes a strong case for the complementary utility and status of the methods compared to the more popular atomic absorption method. For many elements, flame emission and atomic absorption are shown to be equally effective analytically, and this review 343 stands out as putting the flame emission stake back in the ground. It also set the stage in the community with the resurgence of emission spectroscopy, especially with ICP–AES coming on strong at this point of time.”
Emission noise spectrum in a pre-mixed H2–O2–N2 flame – Alkemade, Hooymayers, Lijnse, and Vierbergen, 344 Spectrochim. Acta Part B, 27 (1972) 149–152
José Broekaert commented, “This work 344 is one of the first papers describing the significance of noise power spectra for the optimization of the analytical precision obtainable. Experimental noise spectra for flames in the frequency range of 15 to 105 Hz are shown to include bands stemming from traceable sources and to give useful information for optimal modulation frequencies to be used.”
Critical comparison of the experimental and theoretical characteristics of atomic absorption, emission, and fluorescence in flames – (a) Winefordner, Svoboda, Cline, and Fassel, 345 Crit. Rev. Anal. Chem., 1 (1970) 233–272; (b) Bower and Ingle, 346 Appl. Spectrosc., 35 (1981) 317–324
The critical review by Winefordner et al. 345 is nominated by Stanley Crouch and Alexander Scheeline. Annotations from Alexander Scheeline are: “While this review paper 345 cites prior art in understanding error propagation in spectrometry, it is the ‘go to’ reference that launched a general appreciation for how parametric equations describing analytical methods can be used both to comprehend measurement imprecision and to modify parameters to improve precision. It led, in part, to work by Ingle, Crouch, and others on the precision of absorption spectrometry. Evaluation of the performance of nearly any analytical method can benefit from the approach so thoroughly reported here.”
Stanley Crouch added, “This paper 345 critically compares the flame methods of atomic emission, atomic absorption, and atomic fluorescence spectrometry. Theoretical signal strengths, limits of detection, and sensitivities are discussed along with the shapes of analytical curves and theoretical growth curves.”
Bower and Ingle 346 reported a comparison of experimental and theoretical precision of flame atomic absorption, fluorescence, and emission measurements using copper as a test probe in a H2–air flame. As noted by Ralph Sturgeon, “Seminal equations and experimental evaluation procedures are clearly delineated in a practical evaluation, including noise power spectra, illustrating that emission and fluorescence measurements are limited by background shot and flicker noise and absorption measurements by flame transmission lamp flicker noise at the detection limit. 346 Analyte flicker noise dominates at higher analyte concentrations for all three techniques.”
Furnaces
Birth of modern electrothermal atomization – (a) L’vov, 347 Inzh.-Fiz. Zh., 2 (1959) 44–52; (b) L’vov, 348 Spectrochim. Acta, 17 (1961) 761–770
Gary Hieftje noted, “After the seminal publication by Alan Walsh on AAS, 328 a number of workers pursued the use of ‘non-flame’ atomizers to replace the premixed flame used by Walsh. Among those pioneers were Massmann in Germany, Ray Woodriff in the United States, and Boris L’vov of the USSR, all of whom explored graphite-furnace-based atomizers. Of those pioneers, L’vov 347 (English translation 349 is available) has appropriately been given most credit because of the combination of performance and simplicity that his furnaces offered. Of course, the acceptance of the L’vov design was aided in part by his association with Perkin–Elmer, who marketed the device.”
The paper by L’vov published in 1961 348 was recommended by several other scientists including: Nicolas Bings, Michael Blades, WingTat Chan, Stanley Crouch, Heinz Falk, Igor Gornushkin, Gary Hieftje, Steven Ray, Martín Resano, and Ralph Sturgeon. Stanley Crouch commented, “L’vov's paper 348 describes vaporization of samples in a graphite crucible for atomic absorption spectrometry and is one of the first electrothermal atomization papers, paving the way for many developments and commercial implementation of graphite furnace atomization.” Nicolas Bings, Michael Blades, Heinz Falk, and Martín Resano shared a similar view. For example, Heinz Falk commented, “In this paper, 348 L’vov reveals the basics of the analytical use of flameless atomic absorption spectrometry. Starting in 1961 with the evaporation from a graphite crucible, this paper 348 forms the basis for the later development of the graphite furnace AAS.” Views from Igor Gornushkin are: “Six years after Walsh's paper on AAS, 328 L’vov 348 proposed a new type of an atomizer, a graphite furnace (GF) heated by an electric current in an argon atmosphere. The technique was dubbed GF–AAS and allowed for high sensitivity and high throughput analysis.”
Steven Ray shared a similar view and remarked, “Whereas his paper in 1961 marked the beginnings of modern GF–AAS, 348 L’vov in 2005 presented a poignant review of the early development of the technique over a 50-year period. 350 ”
Ralph Sturgeon noted, “The original isothermal cuvette developed by L’vov is described in this publication, 348 followed by a more comprehensive one published in 1969. 351 Complete vaporization of a sample into a preheated graphite cuvette is achieved, eliminating the effect of the sample matrix on the analytical results. A high absolute sensitivity is reached for the determination of the majority of the elements. Commercial furnaces could not achieve these conditions and were subject to many condensed- and gas-phase interferences.”
WingTat Chan furthered the discussion and commented, “The article 348 describes a prototype of a graphite furnace atomic absorption spectrometer: a graphite furnace (crucible), lined with a tantalum foil to reduce diffusion loss through the graphite wall, is maintained at constant temperature (2000–3000 K); a solution sample is placed on a graphite electrode and heated to dryness; the graphite electrode carrying the dried sample is introduced into the crucible and the sample is vaporized by the application of a DC arc. The analytical performance was very good for the prototype instrument: matrix of 1:10 000 Mn in NaCl, Pb(NO3)2 and Sr(NO3)2 did not change the measured absorbance of Mn (100 μg); matrix of 1:1000 Sr in Al also had no effect on the absorbance of Sr; and the absolute sensitivity to give an absorbance of 0.05 was in the range of 10 pg to 10 ng. The design of the instrument with separate control of sample vaporization and atomization is still sound.”
Massmann furnace for AAS – Massmann, 352 Spectrochim. Acta Part B, 23 (1968) 215–226
As summarized by Ralph Sturgeon, “The classic Massmann furnace 352 is described and evaluated for performance against flame–atomic absorption and for use with atomic fluorescence detection. End-on sample loading was utilized with the sample being placed on the graphite tube wall. The simplicity of design, despite shortcomings of sample vaporization from the heated tube wall, was adopted by commercial manufacturers.”
Continuously heated furnace atomizer for AAS – Woodriff and Ramelow, 353 Spectrochim. Acta Part B, 23 (1968) 665–671
Ralph Sturgeon commented, “A continuously heated graphite tube of similar design to that of Massmann's was used to atomize samples introduced from a nebulizer into a stream of Ar conducted to the tubular furnace. 353 The greatest advantage of the method was reported to be increased sensitivity over elements that form refractory compounds in flames. This concept was never adopted by commercial suppliers of furnace instrumentation.”
Electrothermal AAS with metal micro-tube atomizer – Ohta and Suzuki, 354 Talanta, 22 (1975) 465–469
According to Ralph Sturgeon, “This paper 354 is the first report of the use of a tubular metal atomizer (Mo) for analysis and highlights the low power (200 W) and spatially isothermal tube. The design used an enclosure flushed with inert gas to prevent tube oxidation. A more comprehensive study of metal tube atomizers was presented by Sychra et al. 355 Metal-based electrothermal atomizers have essentially been abandoned despite their initially attractive prospects, primarily due to the need for protective atmospheres or their short lifetime due to interaction with sample components.”
Gary Hieftje added, “Despite their initial attractiveness, metal-based electrothermal atomizers 354 have been supplanted almost entirely by those based on graphite. Graphite, often with a pyrolytic coating, offers several benefits: it is available in very high purity, so background levels of analyte elements are extremely low, it can be simply machined into complex shapes such as those found in modern atomizers, it can reach the high temperatures necessary for atomizing refractory species and, at such high temperatures, it sublimes rather than softening or melting.”
L’vov platform for furnace AAS – (a) L’vov, Pelieva, and Sharnopol'skii, 356 Zh. Prikl. Spektrosk., 27 (1977) 395–399; (b) Slavin and Manning, 357 Spectrochim. Acta Part B, 35 (1980) 701–714
As noted by Ralph Sturgeon, the importance of this set of articles is: “The first widely used commercial furnaces were based on a simplified Massmann design with the sample being deposited directly onto the inner wall of the tube prior to its heating. This made it impossible to control independently the appearance temperature and the temperature of the vapor phase. Following L’vov 356 (English translation 358 is available), the use of a graphite platform within the graphite tube furnace upon which the sample is deposited was evaluated and shown to successfully reduce matrix interferences and delay the release of volatile analytes into a higher tube temperature environment. 357 Thus began the development of furnace techniques universally adopted by all commercial suppliers.”
Igor Gornushkin added, “L’vov356,358 further improved the GF–AAS technique by placing a graphite support (a platform) inside the GF. The support shifted vaporization of the sample in time toward a more equilibrium state of the furnace that significantly improved figures of merit of GF–AAS; specifically, it allowed for the reduction of the matrix effect.”
Discrete sample introduction and atomization in a furnace at steady-state temperature – (a) Manning, Slavin, and Myers, 359 Anal. Chem., 51 (1979) 2375–2378; (b) Frech and Jonsson, 360 Spectrochim. Acta Part B, 37 (1982) 1021–1028
These two articles359,360 were recommended by Ralph Sturgeon, who explained, “The first application of discrete sample introduction into a pre-heated furnace for the purpose of reduction of matrix effects is reported by Manning et al. 359 Matrix interferences from high chloride concentrations were substantially eliminated for Pb and Tl when the sample was vaporized from the tip of a tungsten wire probe mounted on the end of a sampling arm that was manually maneuvered to enable insertion through the central dosing hole in the tube once the latter had reached a preselected steady-state temperature. This arrangement complemented atomization from the L’vov platform,356–358 demonstrated the utility of a more isothermal furnace and verified the predictions of L’vov on means of controlling interferences. Unfortunately, the probe sample technique was too cumbersome to implement for routine practice. The first practical attempt to achieve sample atomization into a furnace at steady-state temperature is described by Frech and Jonsson 360 and consisted of two independently heated devices: a graphite cup into which a sample could be conveniently and automatically dosed in liquid form, and an upper absorption cell comprising a longitudinal graphite tube. The two components were tightly fastened together to permit the atomization from the heated cup into a preheated tube. This arrangement satisfies many of L’vov's original design criteria and was considered to be ideal for the study of atomization reactions, multi-element analyses as well as serve as a potential high temperature emission source. It was, unfortunately, too difficult to be routinely used and required two independent power supplies.”
Transversely heated graphite atomizer as spatially isothermal graphite furnace – (a) Frech, Baxter, and Huetsch, 361 Anal. Chem., 58 (1986) 1973–1977; (b) Lundberg, Frech, Baxter, and Cedergren, 362 Spectrochim. Acta Part B, 43 (1988) 451–457; (c) Hadgu and Frech, 363 Spectrochim. Acta Part B, 49 (1994) 445–457
This set of articles was recommended by Ralph Sturgeon. The first two articles361,362 are on spatially isothermal graphite furnaces (GFs) by means of side-heated cuvettes with integrated contacts, more commonly termed transversely heated graphite atomizers, whereas the third article 363 focuses on a design equipped with end caps in the tubes. As explained by Ralph Sturgeon, “A significant contribution to the evolution of present day furnace design is reported in this pair of papers.361,362 A single integrated graphite structure provided both the heated absorption cell and power contacts to generate a spatially (longitudinally) isothermal absorption path length. 361 This arrangement reduced required atomization temperatures for many elements compared to the standard Massmann design and reduced signal tailing, analyte condensation and memory effects. In combination with a L’vov platform, the integrated-contact cuvette provided higher vapor-phase temperatures and reduced spectral and non-spectral interference effects in comparison to platform-equipped Massmann-type furnaces. This important work was followed up with a second publication. 362 This design morphed into the transversely heated graphite atomizer upon which modern furnaces are now based. The final design change to Massmann furnace architecture that was adopted for the modern transversely heated graphite atomizer is described in this publication. 363 The application of aperture restricting end caps on the tubular furnace reduced diffusional losses of analyte and matrix through the tube ends and enhanced gas phase temperatures. With an optimal aperture of 3 mm, sensitivity increases in the range 1.7–2.5 were achieved for 13 elements.”
Toward absolute analysis – (a) de Galan and Samaey, 364 Anal. Chim. Acta, 50 (1970) 39–50; (b) L’vov, 365 Spectrochim. Acta Part B, 33 (1978) 153–193; (c) Slavin and Carnrick, 366 Spectrochim. Acta Part B, 39 (1984) 271–282; (d) L’vov, Nikolaev, Norman, Polzik, and Mojica, 367 Spectrochim. Acta Part B, 41 (1986) 1043–1053
The article by L’vov 365 suggesting the possibility of absolute analysis with electrothermal AAS was recommended by WingTat Chan, Heinz Falk, Igor Gornushkin, Ulrich Panne, and Ralph Sturgeon.
As commented by Ulrich Panne, “The concept of absolute analysis364,365 originated in spectrochemical analysis long before the chemical metrology community established the concept of a primary method and is still an inspiring idea for instrumental analytical chemistry.” Igor Gornushkin added, “Absolute analysis is a ‘holy grail’ of any spectrochemical method. It is especially apt for AAS as the analytical signal, the absorbance, is readily convertible into the number of absorbers. The possibility of absolute analysis was discussed by Walsh for flame AAS 328 and by L’vov for platform–GF–AAS. 356 Here, L’vov 365 put forward a theory of GF–AAS and summarized the quantitative results achieved by the method.”
Heinz Falk noted, “Based on a critical evaluation of the fundamental processes going on in atomizers, this paper 365 deals with the limiting factors of electrothermal atomization, opening ways for the following analytical use of AAS.” WingTat Chan shared a similar view and said, “L’vov platform to overcome non-isothermal analyte atomization was proposed. 365 Absolute analysis was always in the mind of the analysts at that period of time.” Ralph Sturgeon commented, “The first comparative discussion of the various designs of graphite furnaces is presented from both a practical performance as well as theoretical perspectives. 365 Shortcomings in current designs are identified which have led to common matrix interferences due to the inherent thermochemistry of the environment as well as spatial and temporal non-isothermality along the absorption path. Means of overcoming the design flaws were proposed, including exclusive use of signal integration and vaporization of samples from a platform.”
The paper by Slavin and Carnrick 366 further discussed the possibility of standardless furnace AAS, and as detailed by Ralph Sturgeon, “The concept of stabilized temperature platform furnace is elucidated by which commercial Massmann-type furnaces can be used under conditions which approach the ideal needs for matrix-free operation, as espoused by L’vov. Under such conditions (rapid temperature-controlled heating, signal integration, sample release from a platform, Zeeman background correction, use of appropriate matrix modifiers and rapid detection electronics), the potential for absolute analyses can be considered as characteristic masses reported in various laboratories are in agreement within 15%. This paper 366 is significant in that a simple ‘recipe’ is proposed for practical users to eliminate many spurious interferences.”
This other paper by L’vov et al. 367 is on theoretical calculation of the characteristic mass in GF–AAS. Ralph Sturgeon provided a detailed account of the importance of this work, and noted, “A comparison is made of calculated and experimental values of the characteristic mass for 40 elements atomized in standard graphite tubes using integrated absorbance signals. 367 The theoretical calculation involved a simplified model of vapor diffusion from the tube center toward its ends for a spatially and temporally isothermal furnace. Account was taken of the impact of line source operating conditions. Good agreement was obtained for volatile elements, supporting a conclusion that maximum achievable efficiency had been reached whereas for less volatile elements, formation of gaseous carbides and other molecular species precluded efficiencies reaching greater than 10–30%.”
Chemical modifier for graphite furnace (GF)–AAS – Schlemmer and Welz, 368 Spectrochim. Acta Part B, 41 (1986) 1157–1165
According to Martín Resano, “This is the article 368 that finally established Pd as the universal modifier in GF–AAS, leaving other options for particular applications. It was followed by a series of articles published in the Journal of Analytical Atomic Spectrometry evaluating the performance of Pd and Mg(NO3)2 for different analytes. Of those, Part 5 of the series 369 is noteworthy as it investigated the performance of this mixture for 21 analytes.”
Ralph Sturgeon added, “A combination of Pd and Mg(NO3)2 was demonstrated to be optimal for a wide range of elements, stabilizing them to high temperatures (900–1400°C) while permitting a relatively uniform optimal atomization temperature. 368 This mixture is very efficacious due to its high purity, ready availability and the fact that it is rarely the target for analysis. This approach was widely adopted internationally as the general modifier of use for conditions of stabilized temperature platform furnace and minimization of matrix effects and background absorption.”
Aerosol-based sample introduction into furnace atomizers – (a) Matousek, 370 Talanta, 24 (1977) 315–319; (b) Sotera, Cristiano, Conley, and Kahn, 371 Anal. Chem., 55 (1983) 204–208; (c) Shabushnig and Hieftje, 372 Anal. Chim. Acta, 148 (1983) 181–192
As Gary Hieftje recounted, “The most common method for introducing a sample solution into a furnace-based atomizer is via a pipette, either manually or under automatic (usually computer) control. This method leaves a small droplet, which then must be dried and volatilized, and the resulting vapor introduced into a second device such as an ICP for measurement by emission or mass spectrometry, or converted as efficiently as possible into free atoms (for atomic absorption or fluorescence). However, some workers370–372 have found that there are important advantages to introducing the sample solution into the furnace by means of a nebulizer. First, the solution is thereby deposited as a very finely divided aerosol, so the resulting dried deposit consists of tinier solute particles that are vaporized more efficiently, with a consequent reduction in vaporization-based matrix interferences. 371 Second, if sufficient sample solution exists, deposition can proceed for a longer period of time, so the sample is in effect preconcentrated within the furnace. 370 Third, a single standard solution can mimic a broad range of analyte concentrations, simply by varying the deposition time. 370
“Yet, even the aerosol from a conventional pneumatic nebulizer will contain a fairly large number of large droplets, so the resulting dried deposit will have in it particles that might volatilize slowly or incompletely. Accordingly, it has proven advantageous to introduce the aerosol in the form of isolated, uniform-size droplets. 372 The dried solute will then consist of tiny particles of similar size, which vaporize reproducibly and more efficiently. Although single-droplet generators of the sort used with flames or ICPs would serve, the one used in the cited study 372 employed a very small glass needle that poked repeatedly into a small reservoir of sample solution and directed the resulting uniform droplets onto the surface of the graphite furnace.”
Supply and response function to characterize release and transport processes in electrothermal atomizers – (a) Paveri-Fontana, Tessari, and Torsi, 373 Anal. Chem., 46 (1974) 1032–1038; (b) van den Broek and de Galan, 374 Anal. Chem., 49 (1977) 2176–2186; (c) McNally and Holcombe, 375 Anal. Chem., 59 (1987) 1105–1112
These three articles373–375 were recommended by Ralph Sturgeon, who explained, “This article 373 was the first of several publications from this group that launched a mathematical approach to describe the time and temperature-dependent evolution of atomic vapor within electrothermal atomizers. The concept of convolution of a supply and response function to isolate and characterize the process was subsequently adopted by numerous researchers undertaking mechanistic studies. 376 The first detailed analysis of the model used by Paveri-Fontana 373 for application to an enclosed tubular furnace is presented to validate that release of analyte atoms from the heated graphite surface is determined by the wall temperature via an Arrhenius rate constant, permitting activation energies to be derived for the process. 374 Diffusional losses are determined by temperature and tube length. Efficiencies for peak absorption are estimated to be less than 10% under normal operating conditions, far below estimates from other studies. This is a significant paper 375 which introduced the concept of order of release of analyte atoms from the vaporizer surface, suggesting bulk spheres, cap and adatom structures which explain the noted shifts in the peaks of absorption transients with analyte concentration. This treatment influenced subsequent interpretations of release mechanisms.”
Thermodynamic and kinetic approach for mechanism of atom formation in graphite furnace – Sturgeon, Chakrabarti, and Langford, 377 Anal. Chem., 48 (1976) 1792–1807
As discussed by Michael Blades, “The mechanism of atom formation was studied using a combined thermodynamic and kinetic approach. This paper 377 was the first to provide an understanding of the atom-formation processes in GF–AAS and provided a fundamental understanding of the interplay between thermodynamics, kinetics, and analytical signal for furnace atomization analysis.”
Ralph Sturgeon noted, “This article 377 was the first publication that attempted to use kinetic parameters derived from the rising edge of the absorbance transient to generate activation energies for many elements. This study engendered many subsequent publications from other researchers who improved the approach.”
Factors affecting atomization and determination of the atomization efficiency in GF–AAS – (a) Sturgeon, 378 Anal. Chem., 49 (1977) 1255A–1267A; (b) Sturgeon and Berman, 379 Anal. Chem., 55 (1983) 190–200
This Anal. Chem. A-page article 378 was suggested by Nicolas Bings with annotation: “In an early and brilliant paper, 378 Sturgeon focuses on aspects of electrothermal atomization and methods of recording atomic absorption signals generated by these devices. The fundamental background is briefly and clearly summarized before the reader is introduced to the details to gain an understanding of the fundamental operation of atomizers, which helps to identify those factors important in the design of more effective electrothermal atomizers.”
Ralph Sturgeon recommended this article on the determination of the atomization efficiency in GF–AAS, 379 and commented, “The efficiency of the Massmann furnace for the production and containment of atomic vapor at the peak of the measured transient has been determined for several elements. 379 Electron number densities generated in the atomizer during analyte ionization were measured by microwave attenuation techniques and related to the analyte population through the Saha equation. Experimental efficiencies reported for Al, K, Rb, Cs, Na, Ca, Ba, Ga, and Sr average 12% with a range from 1% (Sr) to 30% (Cs).”
Role of oxygen in GF–AAS – (a) Sturgeon, Siu, and Berman, 380 Spectrochim. Acta Part B, 39 (1984) 213–224; (b) Sturgeon, Siu, Gardner, and Berman, 381 Anal. Chem., 58 (1986) 42–50; (c) Sturgeon and Falk, 382 J. Anal. At. Spectrom., 3 (1988) 27–34
This series of papers discussing the measurement of partial pressure of oxygen, 380 carbon–oxygen reactions, 381 and oxidant release in a GF used for AAS 382 was recommended by Ralph Sturgeon, who gave a detailed account of the work: “The first experimental measurement of the partial pressure of oxygen in the graphite furnace as a function of its surface temperature was discussed in the first paper 380 in this series. It is shown that the C–O2 reaction remains far from equilibrium, even at a temperature of 2100 K. This contrasts sharply with earlier equilibrium thermodynamic calculations frequently used to model reaction mechanisms in the furnace. In the second paper, 381 reactions between oxygen and carbon were quantitatively investigated, revealing that heterogeneous equilibria are not attained at temperatures below 2600 K. Time-resolved spectroscopic measurements of the release of CO from the decomposition of real samples provided evidence, for the first time, that a major source of free oxygen in the furnace arises from analyte oxide/matrix decomposition, 382 which had not been considered in earlier mechanistic models of analyte atomization.”
Combined atomic absorption and mass spectrometric techniques for evaluation of analyte–furnace interactions – Styris and Kaye, 383 Spectrochim. Acta Part B, 36 (1981) 41–47
As noted by Ralph Sturgeon, “The first report 383 of interfacing mass spectrometry with a graphite furnace to study vaporization of molecular and atomic species to elucidate mechanisms of analyte vaporization/atomization provided evidence of surface interactions controlling such processes over a wide temperature range. This landmark study 383 launched a number of subsequent investigations utilizing vacuum and ambient atmosphere AAS–MS studies to further refine atomization mechanisms in the furnace. 384 ”
Electron number densities and gas-phase temperature measurements in electrothermal atomizers – (a) Sturgeon, Berman, and Kashyap, 385 Anal. Chem., 52 (1980) 1049–1053; (b) Welz, Sperling, Schlemmer, Wenzel, and Marowsky, 340 Spectrochim. Acta Part B, 43 (1988) 1187–1207
As explained by Ralph Sturgeon, “This article 385 is the only fundamental investigation of electron number density and analyte ionization in the electrothermal atomizer. Concentrations of free electrons generated in a graphite and tantalum tube were determined by microwave attenuation techniques and found to be well accounted for by thermionic emission. Using electron number density, Saha equilibrium indicates that analyte ionization in the graphite furnace is negligible for elements having ionization potentials greater than 4.6 eV. 385 In the second article, 340 the temperature of the nitrogen gas in a graphite tube furnace was determined using coherent anti-Stokes Raman scattering, providing definitive, non-invasive data that the gas follows the wall temperature very closely and with essentially the same heating rate. The presence of a platform induced a pronounced radial temperature gradient during the rapid heating phase. These remain the most accurately measured temperatures of the gas phase in Massmann-type furnaces and were accomplished with high spatial and temporal resolution. A subsequent similar study was later conducted using the side-heated integrated-contact furnace design, showing the elimination of the longitudinal temperature gradient.”
Schlieren imaging detailing dynamics in a heated graphite furnace – Gilmutdinov, Zakharov, Ivanov, and Voloshin, 386 J. Anal. At. Spectrom., 6 (1991) 505–519
According to Ralph Sturgeon, “This paper 386 is the first of a series of publications detailing dynamic Schlieren imaging with a cine-camera monitoring absorption by atoms and molecules to follow their time (temperature)-dependent distributions in the heated graphite furnace. The technique clearly revealed development of spatial inhomogeneities, inverse atomization events and the velocity of longitudinal and transverse propagation of atomic vapors. This approach was subsequently utilized for the investigation of many more elements and was ultimately followed up with use of CCD digital recording for ease of use (see also Hughes et al. 387 for a review).”
Kinetic parameters from electrothermal atomic absorption data – Fonseca, Pfefferkorn, and Holcombe, 388 Spectrochim. Acta Part B, 49 (1994) 1595–1608
Ralph Sturgeon remarked, “Methods used for the determination of kinetic parameters for atom formation in electrothermal atomization were compared. 388 In particular, attention to the pre-exponential factor was used to infer an order of release of atoms from the heated surface, to provide additional information on the complex physical processes delineating adsorbed atoms from deposits of 3-D spheres and 2-D caps. An excellent summary of earlier literature developments is available.”
Computer simulation for graphite furnace atomization – (a) Black, Riddle, and Holcombe, 389 Appl. Spectrosc., 40 (1986) 925–933; (b) Histen, Güell, Chavez, and Holcombe, 390 Spectrochim. Acta Part B, 51 (1996) 1279–1289
These two articles389,390 were recommended by Ralph Sturgeon with annotations: “Monte Carlo simulation techniques were used for the first time to model the atomization processes in the graphite furnace. 389 Copper was selected as the test element in this study, and spatially integrated and resolved absorbance profiles from experimental measurements were presented for comparison. The method was shown to be a highly useful aid for evaluating the impact of experimental variables which are otherwise difficult to study. Monte Carlo simulations of analyte atomization models on transient peak shapes are conveniently undertaken with this approach, 390 as demonstrated in a number of earlier publications by these authors, providing answers to hypothetical experimental situations.”
Electrothermal vaporization (reviews) – (a) Majidi, Xu, and Smith, 391 Spectrochim. Acta Part B, 55 (2000) 3–35; (b) Majidi, Smith, Xu, McMahon, and Bossio, 392 Spectrochim. Acta Part B, 55 (2000) 1787–1821
According to Ralph Sturgeon, “In Part I of the review, 391 all of the fundamental studies of mechanisms of atomization and gas-phase chemistry in Massmann-type graphite furnaces, including publications on molecular absorption spectroscopy and thermogravimetric analysis in conjunction with gas-phase mass spectrometry are presented. In Part II, 392 unique insights, derived from Rutherford backscattering experiments are presented, outlining the influence of surface chemistry on liquid-solid interactions, solid-solid interactions, catalysis, diffusion, migration, heterogeneous reactions, and intercalation to illustrate how they ultimately control the gas-phase species, making these two reviews the most comprehensive to that date, but which still define the subject.”
Background correction for AAS
Deuterium arc lamp for background correction – (a) Koirtyohann and Pickett, 393 Anal. Chem., 37 (1965) 601–603; (b) Koirtyohann and Pickett, 394 Anal. Chem., 38 (1966) 585–587
David Koppenaal noted, “This article 393 provides the basis for a then new approach for background correction in AAS, using a deuterium arc to measure broadband or molecular absorption and correct for the atomic absorption signal that is affected by the former. This article 393 really fascinated me as a neat instrumental solution at the time.”
Ralph Sturgeon provided additional comments, “The first description of a method for correction of non-specific broadband scatter and molecular absorption by subtraction of alternating measurements of total and non-specific absorbance with a hollow-cathode line source and a continuum source such as a hydrogen lamp, respectively, is presented. 393 AC modulation of the lamps and tuned detection enabled rapid and accurate difference spectra to be recorded and formed the basis for the first successful background correction system.”
Gary Hieftje added, “The specific insight of Koirtyohann and Pickett393,394 is that, to a good approximation, atomic absorption of light from a broadband source is invisible. That is, the band of radiation (light) passed by a monochromator is so broad compared to the spectral width of an atomic-absorption line that the atomic absorption process does not appreciably diminish the intensity of the transmitted light. In contrast, the fraction of light lost by either molecular absorption or scattering is the same for a broadband light source as for a narrow-band source such as a hollow-cathode lamp (HCL). Thus, the apparent absorbance caused by scattering or molecular absorption can be measured directly from the broadband (deuterium) source and subtracted from the HCL absorbance to yield an almost perfect background correction.”
Exploitation of Zeeman effect for background correction – (a) Hadeishi and McLaughlin, 395 Science, 174 (1971) 404–407; (b) Stephens and Ryan, 396 Talanta, 22 (1975) 659–662; (c) Dawson, Grassam, Ellis, and Keir, 397 Analyst, 101 (1976) 315–316; (d) Brown, 398 Anal. Chem., 49 (1977) 1269A–1281A; (e) de Loos-Vollebregt and de Galan, 399 Spectrochim. Acta Part B, 33 (1978) 495–511; (f) Fernandez, Myers, and Slavin, 400 Anal. Chem., 52 (1980) 741–746
According to Nicolas Bings, “The Zeeman background correction technique in AAS was first described by Hadeishi and coworkers in 1971. 395 In a series of four publications, Stephens et al. 396 presented a few years later the advantages of the application of the Zeeman effect in AAS and highlighted its potential as a tool for background correction. A brilliant compilation on the topic of Zeeman background correction techniques was published in 1977 by Brown. 398 ”
The review by Brown 398 also was recommended by Ralph Sturgeon, who noted, “One of the first fundamental overviews of the principles and applications of Zeeman effect background correction for AAS is presented. 398 This publication preceded by a few months a similar review by de Loos-Vollebregt and de Galan. 399 ”
Igor Gornushkin offered his view in a broadened scope: “Another notable improvement in AAS was due to Hadeishi and McLaughlin 395 who proposed a background correction based on the Zeeman effect. The sensitivity of AAS with Zeeman correction broke down to the parts-per-billion (ppb) level. The novel ideas, which were put forward in this 395 and three other articles (Walsh's AAS, 328 L’vov's GF–AAS, 348 and platform for GF–AAS 356 ), resulted in more than four decades of flourishing AAS and GF–AAS with many commercial instruments appearing on the market.”
José Broekaert remarked, “The use of different techniques for Zeeman splitting of the spectral lines has been shown to offer possibilities for background correction in atomic absorption spectrometry. The paper 399 first describes the different practical ways for using the Zeeman splitting of spectral lines for true spectral background measurements as required in atomic absorption spectrometry.”
Michael Blades recommended two articles396,399 in this cluster, and his summarized view was: “An elegant application of atomic physics to a practical problem in elemental analysis – background correction. The paper by Stephens and Ryan 396 describes the application of the Zeeman effect to background correction whereas a theoretical analysis is presented in the paper by de Loos-Vollebregt and de Galan 399 on the signals observed with different systems that employ the Zeeman effect for background correction in analytical atomic absorption spectrometry.”
Gary Hieftje indicated, “Both before and after the seminal publication by Koirtyohann and Pickett393,394 on the use of a continuum (deuterium) source for background correction in AAS, many others sought to find an alternative and potentially better approach. Two others were later found, the more successful of which uses the Zeeman effect, the splitting of atomic energy levels in the presence of a magnetic field. This splitting is accompanied by a difference in the polarization behavior of the new atomic levels, so the level that is not shifted from its energy in the absence of the magnetic field can be distinguished from the other(s). Early approaches employed the spectrally shifted component to gauge the background absorbance directly and subtracted it from the non-shifted component, which was due to both background and atomic absorbance. Although several successful arrangements could be envisioned, an early publication 397 employed a furnace with a magnet mounted transversely in a laboratory setup; later, a similar configuration was found in a commercial instrument. 400 ”
Smith–Hieftje background correction – Smith and Hieftje, 401 Appl. Spectrosc., 37 (1983) 419–424
The Smith–Hieftje paper on AAS background correction was recommended by several scientists including Nicolas Bings, Michael Blades, WingTat Chan, Gary Hieftje, David Koppenaal, and Ralph Sturgeon. Nicolas Bings noted, “This article 401 is the original report of the Smith–Hieftje background correction method based on the use of high current pulses applied to the hollow-cathode lamp to exploit the long-known fact that resonance lines become broadened and self-reversed at high lamp current.”
David Koppenaal commented, “This article 401 describes a new approach for AAS background correction, one which requires no additional light source or ancillary instrumentation. Broadened hollow-cathode lines are used to measure off-resonance absorption and correct for background signals. It is another neat instrumental approach to background correction/reduction.” Michael Blades and Ralph Sturgeon also shared a similar view, and Ralph Sturgeon added that the system was eventually commercialized.
WingTat Chan opined, “The article 401 describes an elegant method of background correction of broadband molecular absorption, particulate scattering, and atomic line overlap, using a single hollow-cathode lamp (HCL). Background absorption is measured using the broadened hollow-cathode spectral line produced by operating the HCL at high current. Successful correction of the background due to 2% NaCl matrix for Cd GF–AAS measurement was demonstrated. An interesting application of the Smith–Hieftje background correction method is the successful correction of spectral-line interference of 2% Ni matrix on Sb 231.15 nm measurement while the conventional deuterium-lamp method can only partially correct the interference. The detection limits, however, are slightly poorer than those obtained under conditions where no background correction is employed because of the lower working curve slope. The method is a gem of analytical instrumentation, but expertise in selection of custom current waveform for different elements is required.”
Gary Hieftje added, “The back story here illustrates the value of in-person scientific gatherings. The location was Cambridge, England and the event was the XXI CSI conference in 1979. Stan Smith and I had earlier struck up a friendship and often discussed novel, sometimes bizarre methods for AAS background correction (e.g., can the emitting atoms in a hollow-cathode lamp, or the lamp itself, really be accelerated to relativistic velocities?). At the conference, Ed Peipmeier was speaking on some of his recent work involving the measurement of line widths from hollow cathode lamps and displayed some amazing levels of spectral broadening at elevated current levels. In the scheduled break after Ed's lecture, Stan and I realized the same idea had struck both of us, so we spent the coffee break outlining ideas and experiments, went back to Stan's room, and wrote out the skeleton of a patent application and publication. Had the CSI been a virtual meeting, this symbiosis might never have developed.”
Intercomparison of different background correction methods – de Galan and de Loos-Vollebregt, 402 Spectrochim. Acta Part B, 34 (1984) 1011–1019
As noted by Nicolas Bings, “de Galan and Loos-Vollebregt 402 compared the Smith–Hieftje background-correction approach to the established continuum source and Zeeman correction methods with regards to analytical sensitivity, roll-over of the analytical curve, and wavelength proximity of the background correction. Interestingly, the magnitude of the roll-over effect was found to be less pronounced in the case of the pulsed Smith–Hieftje system, but at the expense of wavelength proximity and analytical sensitivity.”
Continuum source atomic absorption spectrometry (CS–AAS)
Towards modern-day AAS with continuum source coupled with high spectral resolution detection – (a) Fassel and Mossotti, 403 Anal. Chem., 35 (1963) 252–253; (b) Snelleman, 404 Spectrochim. Acta Part B, 23 (1968) 403–411; (c) Keliher and Wohlers, 405 Anal. Chem., 46 (1974) 682–687; (d) Zander, O’Haver, and Keliher, 406 Anal. Chem., 48 (1976) 1166–1175; (e) Harnly, O’Haver, Golden, and Wolf, 407 Anal. Chem., 51 (1979) 2007–2014; (f) O’Haver, 408 Analyst, 109 (1984) 211–217
As noted by Ralph Sturgeon, “The paper by Fassel and Mossotti 403 described a continuum source of excitation in conjunction with a medium resolution monochromator and a typical detection system, which provided sensitivities for flame atomic absorption comparable to a line source for a number of elements. 403 Unfortunately, the problem of non-specific background absorption was not addressed. This typical study laid the foundations for numerous subsequent papers exploring both theoretical and practical aspects of continuum source AAS. The work by Snelleman 404 was the first description of the use of wavelength modulation with a continuum source for AAS, which provided significantly better performance than an unmodulated system. An added important advantage of wavelength modulation was that it effectively discriminates against broadband background spectral interferences. The paper by Keliher and Wohlers 405 is the first description of a continuum source AAS device based on use of a high resolution optical system. The effective spectral bandwidth using a continuum source with the echelle spectrometer is wider than for a line source but much narrower than that used in most previous studies of atomic absorption with continuum sources.”
Ralph Sturgeon continued his comment and noted that in the article by Zander et al., 406 “The potential for wavelength modulation-CS–AAS utilizing a high resolution echelle monochromator with single channel detection demonstrated the potential for fully background-corrected, multi-element AAS. This publication 406 paved the way for ultimate development of commercial instrumentation.”
Nicolas Bings added, “The work by Zander et al. 406 is the first report on the use of a continuum light source in AAS in combination with high resolution detection and wavelength modulation. The paper by O’Haver 408 comments on the development and the potential of CS–AAS and ‘speculates’ about the future of line sources versus continuum sources in AAS.”
Stefan Florek added, “The 1979 paper by Harnly, O’Haver, Golden and Wolf 407 describes the probably first truly powerful simultaneous CS–AAS instrument, before the first PDA and CCD cameras with their fascinating features were available. A commercial xenon arc continuum source was coupled to a simultaneous echelle spectrometer with 16 PMTs. The oscillating refractor plate, placed behind the entrance slit, generates simultaneous absorption and background signals for all channels. Despite the excellent LODs for many elements compared to line source–AAS, the major limitation of this fascinating setup was the low radiance of the xenon lamp in the UV below 250 nm, where many important resonance lines are located, and the poor quantum efficiency in that region.”
Ralph Sturgeon shared a similar view and noted that this “Multielement atomic absorption spectrometer is based on a continuum source and an echelle polychromator modified for wavelength modulation, 407 providing simultaneous background-corrected measurements for 16 elements with either flame or electrothermal atomization. Subsequent advances in optical and detector technology firmly established the possibility of commercialization of a multielement instrument based on this successful design.”
Spectral bandwidth influence on sensitivity and signal-to-noise in CS–AAS – (a) Harnly, 409 Spectrochim. Acta Part B, 48 (1993) 909–924; (b) Becker-Ross, Florek, Heitmann, and Weisse, 410 Fresenius J. Anal. Chem., 355 (1996) 300–303
Stefan Florek recommended these two articles,409,410 which deal with the first use of array detectors to overcome sequential data generation by wavelength modulation. For the first article, 409 he highlighted, “Harnly 409 uses a linear photodiode detector for truly simultaneous measurements of the intensities of the absorption line and its spectral neighborhood. The technological advance allows the use of a pulsed xenon lamp with much higher radiation intensity. The resulting gain in signal-to-noise ratio is limited by the high readout noise of the PDA. A sufficiently large slit width nevertheless allowed very low LODs with flame atomization, even for As and Se. For furnace atomization at typically short exposure times, however, the wide slit potentially leads to line interference.”
Regarding the second article, 410 Stefan Florek recounted, “From the work published so far, it is clear that CS–AAS requires a continuum light source with extremely high radiance, a spectrometer with very high resolution and high throughput, and last but not least, a detector with the lowest possible readout noise and high quantum efficiency down to the UV range. The authors 410 used a combination of a novel hotspot xenon lamp, a self-developed double-echelle monochromator, and a unique CCD line detector to determine very low LODs, for the first time even for As and Se in the graphite furnace. The sophisticated spectrometer concept served as the basis for a large number of scientific papers and the development of commercial instruments for various applications in analytical spectroscopy until today. A detailed description of the echelle monochromator can be found in a follow-up work. 411 ”
Non-metal analysis with CS–AAS through molecular bands – Dittrich, Vorberg, Funk, and Beyer, 412 Spectrochim. Acta Part B, 39 (1984) 349–363
As recommended by Ralph Sturgeon, “Although scattered publications appear several years earlier, this paper 412 is a convenient review of the literature on the determination of non-metals based on absorption characteristics by diatomic molecules deliberately formed in the graphite furnace. These principles form the basis for numerous subsequent studies, especially noteworthy being those undertaken with high-resolution continuum source atomic absorption spectrometers. 413 ”
Spectral interference and chemical modifiers for CS–AAS – Becker-Ross, Florek and Heitmann, 414 J. Anal. At. Spectrom., 15 (2000) 137–141
As noted by Martín Resano, “While there were several previous papers from this research group, developing what later will become the commercially available high-resolution continuum source atomic absorption spectrometry instrumentation, this article 414 is the first one in which the analytical advantages of such a technique became evident, in this case for correcting spectral overlap.”
Laser-driven continuum source for CS–AAS – Geisler, Okruss, Becker-Ross, Huang, Esser, and Florek, 415 Spectrochim. Acta Part B, 107 (2015) 11–16
As summarized by Martín Resano, “This paper 415 describes a new design of a high-resolution continuum source instrument with much improved multi-element possibilities, which has the potential to redefine AAS.”
Stefan Florek explained the main points of this work as follows: “This work 415 describes the first use of a novel commercial laser plasma source for CS–AAS. The laser source is an essential component of a laboratory prototype of a modular echelle spectrograph whose optical design, setup, and testing are described. The prototype is developed for all applications that require high spectral resolving power and an extended simultaneously detectable wavelength range. The concept of the spectrograph allows easy changing between different modes of operation like switching between UV/vacuum-UV and visible/near-infrared range or switching between a spectral overview mode and a zoom mode for detailed investigations of single spectral regions. The work 415 impressively demonstrates the analytical potential of simultaneous high-resolution absorption and emission spectroscopy if a suitable large-area CCD or even CMOS detector is available.”
Inductively Coupled Plasma (ICP) Optical Spectrometry
Development of analytical ICP and its emission characteristics
Early induction-coupled plasma – Reed, 416 J. Appl. Phys., 32 (1961) 821–824
According to Vassili Karanassios, “To my knowledge, the paper by Reed 416 contains the first description of generating a stable induction-coupled plasma at atmospheric pressure.” Michael Blades remarked, “In 1961, Reed 416 published an article describing an inductively coupled plasma operating at atmospheric pressure supported by flowing argon gas. The plasma torch consisted of a quartz tube, open at one end and supplied with flowing argon gas at the other. A five-turn copper coil was wrapped around the quartz tube near its outlet and RF power to a maximum of 10 kW at 4 MHz was delivered to the coil. Reed 416 also introduced the idea of vortex stabilization whereby the argon gas is introduced into the torch tangentially, causing it to flow in a spiral motion up along the walls of the quartz tube. This centers the plasma, recirculates some of the plasma gas between the coils, and cools the quartz tube to prevent melting. This proved to be an important concept and has been widely employed for analytical plasmas. It was quickly recognized that the ICP could be a useful tool for spectroscopic analysis and two groups independently published their application of the Reed type torch.”
Birth of ICP as analytical spectrometric source – (a) Greenfield, Jones, and Berry, 417 Analyst, 89 (1964) 713–720; (b) Wendt and Fassel, 418 Anal. Chem., 37 (1965) 920–922
These two articles417,418 are nominated by many scientists, including Michael Blades, José Broekaert, Stanley Crouch, Carsten Engelhard, Paul Farnsworth, Vassili Karanassios, David Koppenaal, John Olesik, and Zhanxia Zhang. According to Carsten Engelhard, “The paper by Greenfield et al. 417 is one of the ground-breaking papers in our community. As a result, the ICP is the most important atomization, excitation, and ionization source for atomic spectrometry today.” Stanley Crouch shared a similar view.
John Olesik added, “The article by Greenfield, Jones and Berry 417 is the first report of an ICP as an analytical atomic emission source whereas the paper by Wendt and Fassel 418 is the first report of 1 to 2 kW ICP for analytical atomic emission much like those used today.” David Koppenaal commented, “This paper by Greenfield et al., 417 like Walsh's paper for AAS, 328 was the start of ICP–AES. This paper 417 is generally credited as the first real ICP–AES paper, although the two Fassel group papers418,419 followed it rapidly and presented more thorough analytical evaluations that cemented intrigue and excitement in the atomic spectroscopy community.”
Vassili Karanassios supplemented, “The descriptions by Wendt and Fassel 418 offered much better analytical performance characteristics than those described by Greenfield et al. 417 ” Zhanxia Zhang shared a similar view and remarked, “This is an early paper 418 pioneering ICP–AES. The experimental arrangement for maintaining the plasma and for introducing an aerosol into the discharge is considered different from the Greenfield design and possesses definite advantages for analytical applications.”
Paul Farnsworth stated, “This Analyst paper by Greenfield et al. 417 and the subsequent note in Analytical Chemistry by Wendt and Fassel 418 led to a revolution in the use of emission spectrometry for elemental analysis. Although these papers appeared well before I entered the field of atomic spectrometry in the late 1970s, some of the rancor from competing claims of priority persisted. If I were teaching a graduate course in spectrochemical analysis, I would use the papers to illustrate that major advances in a field rarely occur in isolation.”
José Broekaert extended the discussion and noted, “An ICP as a source for atomic spectrometric analysis of solutions, into which aerosols are introduced by pneumatic nebulization, is described and compared with results of a DC plasma jet. 417 The paper 417 is the first description of an analytical high power ICP in optical emission spectrometry using pneumatic nebulization.” For the other article 418 , he further commented, “An ICP as a source for optical emission spectrometric analysis of solutions into which aerosols are introduced by ultrasonic nebulization is described. 418 A first description of a low power argon ICP as an optical emission radiation source in combination with ultrasonic nebulization is given.”
Michael Blades shared a somewhat similar view on this pair of articles, and remarked, “Both417,418 are seminal papers! Greenfield et al. 417 described a torch which is very close to that utilized in present commercially available plasma systems. It consisted of two concentric glass tubes with tangential gas inlets on each and a central gas tube for injecting sample into the plasma. Emission from the elements injected was observed in the tail-flame region of the plasma. This paper was followed by a description by Wendt and Fassel 418 of a laminar flow ICP torch. However, Fassel's group eventually converted to tangential gas inlets favoring Reed's approach of vortex stabilization. From these beginnings the use of the ICP as a source for spectrochemical analysis was born. The competition between these groups spurred development of the ICP as a ‘routine’ elemental analysis system. The Fassel and Greenfield papers417,418 and the link to Reed 416 are an example of how science and innovation work. In my opinion, these papers417,418 are two of the most influential analytical atomic spectroscopy publications of the 20th century.”
Development of ICP as analytical spectrometric source – (a) Dickinson and Fassel, 419 Anal. Chem., 41 (1969) 1021–1024; (b) Fassel and Kniseley, 420 Anal. Chem., 46 (1974) 1110A–1120A; (c) Fassel, 421 Science, 202 (1978) 183–191
The paper by Dickinson and Fassel, 419 another early publication pioneering ICP–AES, was recommended by WingTat Chan, Gary Hieftje, David Koppenaal, and Zhanxia Zhang. Its importance, as explained by David Koppenaal, is that it “demonstrated significant analytical improvement for ICP–AES and really got people's attention. 419 ” As noted by WingTat Chan, “Major improvement in the power of detection of trace elements in solution could be achieved through optimization of experimental parameters. 419 The toroidal-shaped plasma and remote tuning for optimal coupling of the generator to the plasma are still in use today. Figure 1 in the article 419 showing the two plasma shapes at low and high radiofrequency is a classic.”
Gary Hieftje noted, “Perhaps the most remarkable thing about the Dickinson and Fassel paper 419 of 1969 is how little things have changed in the intervening 50 years. The apparatus used in this study, and the detection limits that were measured, are not greatly different from what is cited in modern commercial literature. It makes one wonder whether there can be a better source for emission spectrometry than the argon ICP.”
Stanley Crouch commented, “The Fassel–Kniseley paper 420 was the first review of the technique that is now a standard in the analytical arsenal.” Michael Blades expressed a similar view and noted, “A follow-up work by Fassel and Kniseley 420 and Scott et al. 422 to the paper above. 418 These two papers420,422 explore in more detail the application of the ICP for trace multi-element analysis.” Nicolas Bings, who also selected these two papers,420,422 concurred. The paper by Scott et al. 422 is listed under Scott double-pass spray chamber (Section 18.2.1).
Vassili Karanassios noted the Science article 421 contained “a detailed description of the state-of-the-art (to that date) of ICP–AES.” David Koppenaal further noted, “An analytical chemistry paper in Science! This paper 421 introduces ICP–AES to the larger scientific community. The cover of this issue of Science also showed a photograph of the classic Y/YO blue/red ICP. Seems a landmark paper.”
Inductively coupled plasma (ICP) in axial-viewing configuration – (a) Abdallah, Diemiaszonek, Jarosz, Mermet, Robin, and Trassy, 423 Anal. Chim. Acta, 84 (1976) 271–282; (b) Davies, Dean, and Snook, 424 Analyst, 110 (1985) 535–540; (c) Dubuisson, Poussel, and Mermet, 425 J. Anal. At. Spectrom., 12 (1997) 281–286
As noted by George Chan, “This paper by Abdallah et al., 423 to the best of my knowledge, is the first publication which described an analytical ICP in axial-viewing mode. Although commercialization of axial-viewing ICP did not commence until around the mid-1990s, the concept of axial viewing was established in the early days of ICP development history. A direct comparison of axial and lateral viewing was given and distinctly demonstrated that axial viewing offers improved analyte signal in this pioneering work. 423 In addition, atomic absorption in ICP through the central channel was demonstrated.”
José-Luis Todolí suggested the Analyst article 424 on this topic and commented, “The use of an axially observed plasma is reported in this work. 424 This mode has been extensively used and many modern optical instruments are based on it. Systematic experiments were carried out with respect to plasma temperatures, electron number density, and analytical figures of merit (linearity, molecular band emission, S/N, LODs, and matrix effects).”
Steven Ray recommended the article by Dubuisson et al., 425 in which axially and radially viewed ICP were compared in terms of SBR and matrix effects, and noted, “Mermet and co-workers 425 critically evaluate and compare the radial and axial geometry of observation in terms of fundamental analytical parameters. The studies provide a basis for understanding the differences between the two common ICP–AES geometries.”
Prominent emission lines in ICP – Winge, Peterson, and Fassel, 426 Appl. Spectrosc., 33 (1979) 206–219
As remarked by Michael Blades, “This paper 426 contains the first systematic compilation of the prominent spectral lines for an analytical ICP. It became the ‘bible’ for early adopters of ICP–AES for choosing analytical lines for determination of most of the elements in the periodic table.”
Nomenclature of different zones in the ICP – (a) Koirtyohann, Jones, and Yates, 427 Anal. Chem., 52 (1980) 1965–1966; (b) Koirtyohann, Jones, Jester, and Yates, 428 Spectrochim. Acta Part B, 36 (1981) 49–59
Gary Hieftje remarked, “In the early days of ICP–AES investigation, various spatial reference points and descriptors were employed, with the most common being distance above the load coil. However, the full spatial structure was the result of a number of experimental variables, including gas flows, power levels, torch design, and others. It remained for Koirtyohann, Jones, and Yates 427 to make some sense of the confusion. They named the now well-known zones in the ICP according to easily visible features, and related them to dominant processes occurring in them.”
George Chan expressed a similar view and noted, “This classic paper 427 is a short letter which proposed the now well-known nomenclature of the different zones in an analytical ICP: induction region, preheating zone, initial radiation zone, and normal analytical zone. The Na-bullet method to identify the location of the initial radiation zone was also documented. 427 ” José-Luis Todolí shared a similar view.
David Koppenaal chose a follow-up, full paper by the same group and stated, “This paper 428 used the initial radiation zone and normal analytical zone plasma structure and nomenclature paradigm for the ICP and actually demonstrated its utility in differentiating inter-element effects in the different zones, conclusively showing how the position of the initial radiation zone can be employed to consistently select regions of low matrix influence.”
Organic solvents in ICP emission spectrometry – (a) Boorn and Browner, 429 Anal. Chem., 54 (1982) 1402–1410; (b) Weir and Blades, 430 J. Anal. At. Spectrom., 9 (1994) 1311–1322
These two articles429,430 were recommended by José-Luis Todolí, who commented, “The paper by Boorn and Browner 429 evidences the role played by the solvent volatility in terms of plasma stability when organic solvents are delivered. Thirty different solvents are evaluated. Background spectra are registered and changes in the CN, C2 and C emission intensities at different plasma locations are reported. The use of a cooled spray chamber or condenser to overcome negative effects caused by organic solvents is anticipated. 431 The paper by Weir and Blades 430 is the first one in a series of four studies432–434 that discussed the changes occurring in the plasma as it is loaded with organic solvents. The whole work goes from spatial distribution of pyrolysis products to the effects on the electron number density, the spatial distribution of the analyte species and the noise power spectra.”
Michael Blades provided some background of this work, 430 “The key innovation that enabled the study was a clever device that utilized Peltier coolers to control the ‘solvent-plasma load’ that was conceived and designed by (then) graduate student Doug Weir.435”
Power modulated analytical ICP – Farnsworth, 436 Spectrochim. Acta Rev., 14 (1991) 447–462
As noted by George Chan, “This review 436 gave a very coherent account on the development and research on a power modulated ICP. In addition, it contained a very detailed account on the historical aspect of power modulation in other analytical sources (e.g., pulsed hollow cathode discharge and electrical arcs). Power modulation is an effective tool for both analytical and diagnostic purposes. It separates the different processes (e.g., energy coupling, excitation, ionization, recombination, propagation, relaxation, and thermal conduction) according to differences in their temporal responses and gives insights on processes which would be otherwise difficult to obtain in a steady-state system.”
Fundamentals of excitation and ionization mechanisms in ICP
Attempts at a comprehensive understanding of excitation processes in the ICP – Mermet, 437 C.R. Acad. Sci. B Phys., 281 (1975) 273–275
As noted by Michael Blades, “This paper by Mermet, 437 and some closely related papers from Mermet's group in Lyon, contains the first real attempt at a comprehensive understanding of the fundamental processes in the ICP and the impact of these on the analytical characteristics of the plasma. In the mid-1970s, it was clear that many of the most sensitive emission lines for elemental analysis were ion lines. What was less clear was why ion lines were dominant for many elements. The paper by Mermet 437 attempted to identify possible mechanisms by which ion lines would be produced and the excited states produced. Among these was excitation transfer from metastable argon. This suggestion was incentive for many researchers, including myself, to try to develop a better understanding of excitation processes and how these processes linked to analytical characteristics.”
Dual role of argon excited states as an ionizer and an ionizant in an ICP – Boumans and de Boer, 438 Spectrochim. Acta Part B, 32 (1977) 365–395
José Broekaert noted, “For an ICP operated with argon the excitation mechanisms were studied and the role of an overpopulation of the argon metastable levels discussed. 438 The paper in a unique way relates the analytical properties of ICP–AES with hypotheses on the excitation processes taking place.”
José-Luis Todolí added, “Interesting evidence of the departure from LTE is given in this study 438 and the special role of metastable argon atoms is discussed in the present work.”
George Chan commented, “This is a key paper 438 offering a unique prospect on the dual role of argon excited states (the 4s levels) in the ICP. Boumans and de Boer 438 argued that the Ar metastable levels (note: ‘metastable’ is only a convention here, as all the 4s levels of Ar are collisionally well mixed in the ICP and no single 4s level is overpopulated with respect to others), which are overpopulated in the ICP, have a dual role – as an ionizer for the analyte through a Penning-type process and as an ‘ionizant’ (a term coined by Boumans to indicate a species being ionized) somewhat behaving like an easily ionizable element (EIE). The ionizant role is based on the fact that any Ar excited state (including ‘metastable’) requires additional energy of only 4.21 eV at most for it to ionize to an Ar+ ion.”
Measurement of argon metastable number densities in an ICP – Hart, Smith, and Omenetto, 439 Spectrochim. Acta Part B, 41 (1986) 1367–1380
George Chan commented, “This key paper 439 addressed the absolute number densities of all the Ar 4s levels in an analytical ICP. Although this is not the first paper on measuring the Ar ‘metastables’ in an ICP, it is the most comprehensive one reported as the four 4s Ar levels were evaluated from a total of 19 Ar lines by means of continuum source absorption. 439 Absorption with a continuum source offers more information than with a line source because it is relatively straightforward to also obtain the absorption line profile from a continuum source. From the absorption line profile, the damping constant of the line can be calculated, which is information required to transform absorbance to number density. This study 439 also confirmed that all four 4s Ar levels are well equilibrated among themselves according to a Boltzmann distribution, even though some 4s levels are radiatively allowed whereas some others are forbidden (i.e., the metastables). This study 439 unambiguously established that there is no ‘metastable’ behavior for Ar levels in the ICP, which is not too surprising because of the frequent and efficient collisional mixing in an environment like the ICP. A suprathermal population of the Ar 4s levels was also confirmed in the study. Despite the many key points as discussed above, the authors remarked ‘The absorption technique for the determination of number densities is well known and therefore we do not feel that anything particular was achieved in this work.’ 439 What a modest remark!”
A rate model of ICP analyte spectra – Lovett, 440 Spectrochim. Acta Part B, 37 (1982) 969–985
As noted by Michael Blades, “This (perhaps underappreciated) paper by Raymond Lovett 440 was the first attempt to rationalize the intensity ratios of ion and atom lines in the ICP using reported measured temperatures and electron number densities coupled with published rate constants for collisional and radiative processes using an equilibrium model. It is a landmark paper because it stimulated many researchers, including myself, to rethink the prevailing opinion regarding excitation processes in the ICP. At the time it was published, there was a lot of discussion in the literature regarding the observation that in the ICP the most sensitive analysis lines were from ion emission. The prevailing opinion was that the plasma was not in equilibrium and that Penning ionization was responsible for this observation (see Section 11.2.2 for example). One outcome of Lovett's theoretical study was the finding that ‘Penning ionization was shown to have a negligible effect on spectrally derived temperatures’ from ion-atom emission intensity ratios suggesting that the emission characteristics of the ICP were consistent with a plasma close to LTE – i.e., a collision dominated excitation environment. This somewhat surprising suggestion stimulated several research groups, including my own, to carry out detailed measurements of electron number densities and temperatures and compare measured values with calculated LTE values. One of my graduate students at the time, Brenda Caughlin, made detailed radially resolved measurements of electron number density and compared measured ion-atom emission intensities of magnesium and cadmium and found that the ion-atom emission ratios for these lines were ‘close’ to LTE values. 441 This suggested that Lovett's framework and interpretation were on the right track.”
Quantum efficiency and collisional processes in an ICP – Uchida, Kosinski, Omenetto, and Winefordner, 442 Spectrochim. Acta Part B, 39 (1984) 63–68
As explained by George Chan, “This paper 442 is unique as it discussed an important, yet seldom reported, characteristic in the ICP – the quantum efficiency, which is directly related to collisional processes in the plasma. Lifetimes of excited atoms and ions were studied with laser induced fluorescence and a large span of quantum efficiencies were found, ranging from almost unity (0.99) for Na I to 0.06 for Fe I. 442 The key is that quantum efficiencies were found to correlate with the presence of the number of excited levels near the laser excited level; the efficiency became smaller if a nearby level exists. The study 442 is important in understanding the factors governing collisional spreading (through electrons) of the excited level to nearby levels. More crowded energy levels lead to faster spreading, and hence lower quantum efficiency.”
Early use of a self-scanning photodiode array for measurement of ICP spatial emission profiles – (a) Edmonds and Horlick, 229 Appl. Spectrosc., 31 (1977) 536–541; (b) Horlick and Blades, 190 Appl. Spectrosc., 34 (1980) 229–233
John Olesik recommended the paper by Edmonds and Horlick 229 and noted, “Much confusion about the behavior of ICP emission intensities as a function of instrument parameters and the effect of matrix was cleared up by measuring spatially resolved emission in this 229 and many subsequent papers from Horlick's group and then other groups.”
WingTat Chan expanded the discussion and said, “These constitute two of the first papers on the application of linear photodiode arrays to measure the spatial profiles of spectrochemical emission sources190,229 (see also Franklin, Baber, and Koirtyohann 228 ). Systematic study of ICP operating parameters on spatial profiles of ICP atomic and ionic emission gives the famous ‘Mount Horlick’. The second article 190 clears up the confusion of ICP emission characteristics of atom lines (Ca I) based on fixed ICP observation positions.”
Vertical spatial characteristics of analyte emission and matrix interferences – (a) Blades and Horlick, 191 Spectrochim. Acta Part B, 36 (1981) 861–880; (b) Blades and Horlick, 443 Spectrochim. Acta Part B, 36 (1981) 881–900
This pair of back-to-back published articles on vertical characteristics of analyte emission and matrix interferences by means of simultaneous measurement with a PDA is a classic and was recommended by several scientists, including Michael Blades, George Chan, WingTat Chan, Gary Hieftje, Steven Ray, and José-Luis Todolí. According to Michael Blades himself, “This pair of papers191,443 was the first to offer a rational interpretation of the spatial distribution of emission in the ICP, the influence of operating parameters on the emission profiles, and ‘easily ionizable element (EIE) effect’ observed in the ICP.”
Gary Hieftje expanded the discussion to indicate that “In the early days of ICP–AES, there was considerable confusion about interelement and matrix interferences, with some workers reporting signal enhancements while others reported a signal depression, even under nominally identical experimental conditions. It remained for Blades and Horlick191,443 to clarify what was occurring. For a given instrument, operating conditions, and analyte/interferent combination, there is a signal rise low in the plasma, followed by a decline higher up. However, the signal behavior in the presence of an interferent was shifted lower in the discharge compared to its behavior in the absence of the interferent. Thus, at lower plasma locations, an enhancement was observed, whereas at higher positions, the signal was depressed.”
José-Luis Todolí further noted, “Besides reviewing the different mechanisms responsible for the matrix effects caused by EIEs in ICP–AES, this paper 443 presents a thorough spatial study indicating the influence of this kind of concomitants on vertical spatial profiles for different interfering elements and operating conditions. Radial profiles are also examined. This idea has also been explored in many other excellent papers. A thorough study 444 examines separately the radially resolved maps for a set of eight concomitants. In this study, 444 possible mechanisms are proposed such as lateral diffusion, shifts in the analyte ionization equilibrium, and collisional excitation efficiency. These processes may explain why in the presence of a given concomitant the emission intensity either increases or decreases and in which zone a given process prevails.”
WingTat Chan continued the discussion and added, “This paper 191 is considered a classic on fundamental studies of ICP–AES. The article 191 describes characterization of the vertical emission profiles of ‘soft’ lines (very dependent on power, aerosol flow, and analyte excitation and ionization characteristics) and ‘hard’ lines (spatial profiles relatively insensitive to the above parameters). The ‘thermal’ and ‘non-thermal’ regions of the ICP for the excitation of the ‘soft’ and ‘hard’ lines, respectively, are discussed. The second article 443 discusses possible mechanisms of EIE interference in ICP–AES in detail. The 3-D plots in Figures 18 and 19 in the paper 443 show the spatial emission profiles of Ca I and Ca II with and without matrix effects with great clarity.”
As pointed out by Steven Ray, “This series of papers provides a basis for understanding the ICP–AES experiment as it is performed today. Blades and Horlick191,443 examine the ICP spatial structure and provide an evaluation of the analytical performance of ICP–AES based upon fundamental measurements of plasma parameters, analyte emission profiles, and the interference. Together with the work by Mermet and coworkers, 425 who critically evaluated and compared the radial and axial geometry of observation in terms of fundamental analytical parameters, these studies191,425,443 show the student how experimental parameters like the optical integration volume/area can greatly change an experiment.”
George Chan further noted, “These two back-to-back published papers191,443 are examples of one of the early uses of PDA to measure simultaneously the spatial profile of ICP emission. In the first paper, 191 that emission lines can be classified as ‘soft’ and ‘hard’ lines (a terminology from Boumans) was confirmed. Soft lines show a high dependence on carrier flow and ICP power, and spatial peak positions correlate with analyte excitation and ionization characteristics as well as norm temperature, whereas spatial peak positions for hard lines are insensitive to plasma operating parameters. In brief, ‘norm temperature’ (from the German word ‘Normtemperatur’ 445 ) is not a physical temperature but a concept, and refers to the optimal temperature for maximum emission of a particular spectral line as a result of the mutual dynamic balance among atomization, excitation, and ionization. Excitation mechanisms involving collisions of the first kind in the thermal region were suggested for soft lines whereas Penning ionization in the non-thermal region and ion-electron recombination were suggested for ionic and atomic hard lines, respectively. 191 The second paper 443 reported matrix-effect vertical profiles in ICP–AES. The study is pioneering as it clarified some confusion involving matrix effects reported before this work, and concluded that spatial information is indispensable in the description of matrix effects. Before this work, 443 matrix effects from the ICP appeared confusing as both signal enhancements or depressions were reported. Blades and Horlick 443 showed that the matrix effect is vertical-position (observation height) dependent with enhancement low in the plasma and depression high in the plasma. Somewhere in-between the matrix induced signal enhancement and depression regions where the two opposite effects just balanced, there appears a location termed the cross-over point with no apparent matrix effect. 443 Furthermore, a dual-nebulizer setup was used to separate plasma effects from nebulization and particle-vaporization effects.”
Role of water and hydrogen in an ICP – (a) Tang and Trassy, 446 Spectrochim. Acta Part B, 41 (1986) 143–150; (b) Murillo and Mermet, 447 Spectrochim. Acta Part B, 44 (1989) 359–366
As commented by José-Luis Todolí, “Hydrogen supplied by water to the plasma is the main factor responsible for the changes in the plasma thermal conductivity. The presence of water in the plasma accelerates the energy transfer process in the plasma central channel. It is also mentioned that the conductivity of an argon–water mixture at the temperature of an ICP can be more than 10 times higher than that of pure argon. 446 Later, the role of water448,449 and water-vapor loading 450 were studied in more detail. Based on previous studies of the role of water 446 in terms of plasma conductivity, it is indicated that the addition of a hydrogen stream to the plasma is beneficial from the point of view of analyte excitation processes. 447 Plasma excitation temperature increases and the analyte emission intensity peaks at low plasma observation heights.”
Charge transfer mechanism in the ICP – (a) Farnsworth, Smith, and Omenetto, 451 Spectrochim. Acta Part B, 46 (1991) 843–850; (b) Ogilvie and Farnsworth, 116 Spectrochim. Acta Part B, 47 (1992) 1389–1401; (c) Farnsworth, Woolley, Omenetto, and Matveev, 452 Spectrochim. Acta Part B, 54 (1999) 2143–2155
Paul Farnsworth shared his view and an anecdote on the first paper 451 in this cluster. “As the ICP developed into the source of choice for atomic emission spectrometry, there was intense interest in the degree to which the source could be modeled by local thermodynamic equilibrium (LTE) and in the mechanisms that contributed to any departures from LTE. Asymmetric charge transfer and Penning ionization were both advanced as possible contributors to non-LTE behavior, and their relative importance was vigorously debated. I first encountered the idea of using a laser to perturb equilibrium in the ICP as a probe of excitation mechanisms while I was a post-doc in the Gary Hieftje lab. One of his graduate students, John Shabushnig, suggested the idea. I ran some unsuccessful experiments at Brigham Young University, but it wasn't until I was a visitor at the Joint Research Center in Ispra, Italy, that the idea was combined with the laser expertise to carry out a successful experiment. To me the experiments 451 were particularly satisfying because they provided direct evidence, for one element, at least, that charge transfer contributed to non-LTE behavior and that Penning ionization was relatively unimportant. The experiments are conceptually simple, and I have used them in freshman [first-year] chemistry courses as a demonstration of Le Chatelier's principle. They serve as a reminder that the steady-state signals observed from the ICP reflect a dynamic equilibrium, and they show the time scale on which the processes that control the equilibrium operate.”
For the second paper in this cluster, 116 Paul Farnsworth stated, “Several experimental studies had demonstrated conclusively that asymmetric charge transfer was responsible for overpopulation of highly excited Mg+ levels, but similar evidence was lacking for other elements. Gary Hieftje and Gary Horlick had extolled the virtue of correlation methods for analytical spectrometry (please refer to Section 6.3.1 in this compilation), and it occurred to me that instances of charge transfer would be reflected in a strong correlation between the ground state of an analyte atom and highly excited ions created by charge transfer. We built a simple analog correlator and used it to extend the study of charge transfer in the ICP to several additional metallic elements. 116 ”
George Chan recommended these two articles116,452 and commented, “These two key papers116,452 described a technique termed correlation spectroscopy for the investigation of a charge-transfer (CT) mechanism in the ICP. The technique, 116 once again, demonstrated the power of signal correlation; in addition, it is an outstanding example of showing how normally undesirable ‘measurement noise’ can become ‘measurement signal’ in the right person's hands. Due to local cooling by sample aerosol and analyte vaporization, ICP signals fluctuate greatly on a microsecond time scale (see Olesik et al. 453 in this compilation for more information). The fluctuation patterns between neutral-atomic and normal (non-CT) ionic emission lines are anti-correlated. For CT emission lines, due to the direct link between neutral atoms and the high-energy CT level, noise behavior of CT lines resembles that of a neutral-atomic emission line (i.e., positively correlated). By using a neutral-atomic line as a reference and scanning the second spectrometer for different ionic emission lines from the analyte, non-CT and CT-dominated ionic emission lines can be distinguished. 116 The second paper 452 is a breakthrough work as it showed that CT in the ICP is indeed common rather than special cases applicable to only few elements. The CT behavior of the third-row metals from Ca to Cu was studied with two techniques – laser induced fluorescence (single- or multi-color) and correlation spectroscopy. Out of these ten probed elements, positive-CT character for eight elements was unambiguously confirmed in the ICP. The positive experimental evidence of CT in the ICP for a large number of elements is important because, before this work, it was unknown whether CT ionization and excitation is a special case and only for some elements (with Mg as the only representative model in many studies); however, this study provided evidence for the generality of CT in the ICP. 452 ”
Probing charge transfer in ICP by means of matrix effects – (a) Chan and Hieftje, 454 Spectrochim. Acta Part B, 59 (2004) 163–183; (b) Chan and Hieftje, 455 Spectrochim. Acta Part B, 59 (2004) 1007–1020
As noted by Annemie Bogaerts, “These are two key papers on fundamental plasma diagnostics in ICP emission spectroscopy. The first paper describes a novel method for using matrix effects as a probe for the charge-transfer reaction between analyte atoms and argon ions, 454 while the second paper discusses the state-selective charge-transfer behavior due to inefficient collisional mixing of the quasi-resonant charge-transfer energy levels with nearby levels. 455 ”
George Chan shared additional details and stated, “This is another study based on the concept of signal correlation as a tool to understand the CT mechanism in the ICP.454,455 Instead of a yet-another study, the proposed approach greatly simplified the procedures and the required hardware.454,455 Unlike preceding work, which all required some sort of specially designed hardware or a wavelength-tunable laser, the developed method required only a commercial multi-channel ICP spectrometer. 454 The correlation is through a matrix-interference effect. It has been known for some time that matrix interference caused by elements with low second ionization potentials (like Ca or Ba) are more severe and affect mostly ionic emission lines. Under the charge-transfer mechanism, the close linkage between the high-energy CT ionic lines and the neutral atom makes the former behave like neutral-atomic lines. Hence, if we plot the extent of matrix effects (for example, relative emission intensities in the presence of Ca or Ba matrix) versus the total excitation potentials of the ionic lines, it is common to see an initially decreasing trend (that is, a more severe matrix effect as the excitation potential increases) but then a sudden decrease in matrix interference (that is, a jump in relative intensity). This jump signifies charge-transfer behavior for those emission lines. The use of matrix effects to probe charge-transfer reactions greatly simplifies the instrumentation and procedures, and hence, a large number of emission lines can be studied in a relatively short time. For example, the CT character of 22 elements can be probed in a single study. 454 The ability to easily probe a large number of emission lines has another advantage: a large set of data can uncover structural factors affecting the rates of CT in the ICP. 455 In this study, 455 the importance of differences in the electronic configuration of the core electrons was positively revealed only after examination of a large data set (matrix effects on a total of around 2000 spectral lines). The novelty of the work is that it showed state-selective CT in the ICP, which was presumed to be improbable prior to this work. 455 Matrix interference obviously is an undesirable phenomenon during an analysis, and I feel very satisfied to transform it into a useful tool for another purpose and that novel information can be derived from it.”
Radiation trapping and collisional–radiative modeling for radiation trapping and transport phenomena in analytical ICP – (a) Mills and Hieftje, 456 Spectrochim. Acta Part B, 39 (1984) 859–866; (b) Hasegawa and Haraguchi, 457 Spectrochim. Acta Part B, 40 (1985) 1505–1515
As explained by Nicoló Omenetto and James Winefordner, “This work 456 is an important step forward towards an improved understanding of the central role played by the Ar 4s levels (two radiative and two metastable, rapidly mixed by electron collisions) lifetime in sustaining the plasma well beyond the load coil region. The paper discusses in detail the central role played by the imprisonment of argon resonance radiation (resonance radiation trapping) in increasing the number density of the 4s levels by retarding the electron-ion recombination processes, and therefore supporting a supra-thermal population of the 4s levels in the central channel at significant heights beyond the load coil. The paper 456 highlights the importance of lifetime measurements of self-absorption. Unfortunately, the key parameter needed in these studies, i.e., the ‘escape factor’, defined as the ratio between the natural radiative lifetime and the apparent radiative lifetime, would require experimental measurements at 105 nm. The calculated trapping lifetime (1.6 µs) was too short to confirm previous postulated conclusions. 458 ”
As commented by George Chan, “A comprehensive collisional–radiative model for an analytical ICP 457 which included radiation trapping and species transport was described. As somewhat expected, the model showed complete radiation trapping for the radiative Ar 4s level. What is remarkable is the extent of self-absorption for some higher energy Ar levels. For instance, 50% of the 4s–4p optical transition is reabsorbed and the extent slightly decreased (yet significantly) to around 30% for the 4p–3d and 25% for the 4p–4d transitions. 457 Clearly, induced absorption needs to be considered in energy flow and its importance in ICP mechanisms and diagnostics should not be neglected.”
Plasma diagnostics performed on ICP
Early measurements on various temperatures and electron number densities in an ICP – (a) Mermet, 459 Spectrochim. Acta Part B, 30 (1975) 383–396; (b) Kornblum and de Galan, 460 Spectrochim. Acta Part B, 32 (1977) 71–96; (c) Jarosz, Mermet, and Robin, 461 Spectrochim. Acta Part B, 33 (1978) 55–78
José Broekaert's annotations on the article by Mermet are: “The paper 459 treats the relevant methods for plasma diagnostic measurements in spectrochemical sources. Practical methods for the determination of excitation temperatures, electron temperatures, rotational temperatures, and electron number densities as important plasma diagnostic values for the use in ICP spectrometry are given.”
José-Luis Todolí commented, “The main conclusion of this study 459 is that local thermodynamic equilibrium (LTE) does not exist in an ICP. A 2000 K deviation exists between the ionization temperature measured on the basis of the argon Stark effect and the (electronic) excitation temperatures. Electron number densities are also a function of the method employed to calculate them. Therefore, only partial LTE may exist.”
The article by Kornblum and de Galan 460 was recommended by Michael Blades and Zhanxia Zhang. As noted by Michael Blades, “This is a seminal paper 460 on the fundamental characteristics (spatial distribution of the temperature and the number densities of electrons and atomic and ionic species) of the ICP commonly used for spectrochemical analysis. Kornblum and de Galan 460 designed and implemented a measurement system to measure radial spatial distributions of emission intensity in the ICP, and used it to calculate excitation temperature and electron number density as well as to study matrix effects.” Zhanxia Zhang expressed a similar view.
Michael Blades continued, “From my own perspective, it suggested what kinds of measurements would be required to gain a better understanding of the spatial distribution of emitting species in the ICP and how correlated the emission lines were with the fundamental characteristics of plasma temperature and electron number density. The paper was a blueprint for my PhD thesis and my subsequent research at the University of British Columbia. I can't overstate the impact of this paper 460 on myself and others who studied plasma fundamentals. When I first met de Galan at a Winter Plasma Conference in Orlando in 1982, I was in awe!”
The article by Jarosz, Mermet, and Robin 461 was recommended by José-Luis Todolí with annotations: “Fundamental parameters such as the electron number density, excitation temperatures of different elements, and ionization temperatures are determined for a 40-MHz ICP. The excitation temperatures measured with Ar, Ti, Fe and V are in agreement. However, the results show that the ionic temperature of Ar obtained with the Saha equation under the LTE assumption differ from those calculated when the LTE assumption is not considered. Results also shown in this study 461 are in contrast with this assessment.”
Diagnostics of an ICP with laser (Thomson and Rayleigh) scattering – (a) Huang, Marshall, and Hieftje, 462 Spectrochim. Acta Part B, 40 (1985) 1211–1217; (b) Huang and Hieftje, 463 Spectrochim. Acta Part B, 40 (1985) 1387–1400; (c) Huang, Hanselman, Yang, and Hieftje, 464 Spectrochim. Acta Part B, 47 (1992) 765–785; (d) van de Sande and van der Mullen, 465 J. Phys. D: Appl. Phys., 35 (2002) 1381–1391
As described by Alexander Scheeline, “In this series of papers,462,463,466–468 Thomson scattering was employed to measure electron concentration and temperature in the ICP. Rather than viewing Rayleigh scattering as an interference (as physicists typically had), the Rayleigh peak was used as an internal standard since the intensity of the Rayleigh peak was dominated by scattering from argon, a nearly ideal gas. In place of difficult-to-verify Stark broadening parameters, the theoretically cleaner Thomson method proved definitive for measuring electron properties in the ICP.”
Hieftje himself added, “Use of Thomson and Rayleigh scattering is a minimally invasive way to measure electron concentrations (number densities), temperatures (if a Maxwellian velocity distribution exists or is assumed), velocity distributions in non-Maxwellian situations, and gas-kinetic temperatures, all on a temporally and spatially resolved basis, and all on the same instrument. The concept is straightforward: electron velocities are determined from the Doppler shift of an incident laser beam, and their concentration from the scattered intensity. Gas-kinetic temperature is calculated from the intensity of scattered laser light at the incident (non-shifted) wavelength (at a higher temperature, the local concentration of argon atoms is lowered). The gas-kinetic temperature scale is calibrated from scattering of the argon stream at room temperature (when the plasma is off) and from the scattering of helium at room temperature (which mimics the scattering of argon at a much higher temperature). These studies462–468 reveal the genesis of these measurements.”
Scheeline recalls how three research groups played a role in bringing Thomson scattering to the analytical spectroscopy community. He had developed a proposal for use of Thomson scattering to study spark discharges while a graduate student with John Walters at the University of Wisconsin–Madison. While Scheeline and his group started development toward studying spark discharges in 1979, by 1981 no experiments had yet been attempted. Hieftje heard a discussion of Scheeline's plans at a Gordon Research Conference and asked if he could try to make measurements on the ICP, and the papers in this section eventually appeared.
Carsten Engelhard suggested these three papers462–464 from the Hieftje group as well as this paper from van de Sande and van der Mullen, 465 and remarked, “Any future ICP user will benefit from a fundamental understanding of the device and the underlying plasma processes. This applies not only to the mere method optimization with a commercial instrument but also to the design of new methods and instrumentation. Early on, scientists were interested to elucidate the pathways that lead to analyte excitation in the ICP including potential contributions from direct electron impact. It was therefore important to have methods at hand that would be able to measure accurately electron concentrations and energy distributions. In 1985, Huang et al. 462 reported an apparatus to do so using Thomson scattering from an ICP and explained the underlying theory in a related publication. 463 The authors were successful in extracting reliable Thomson scattering signals from the mixture of stray light and the apparatus was used later on in many fundamental plasma studies (see Hieftje group publications). Isocontour maps are a great way to visualize fundamental plasma parameters in the ICP and in this paper, 464 spatially resolved data on electron temperature, electron number density, and gas-kinetic temperature in an ICP are presented. From these maps, the reader can easily grasp the influence of the operating conditions on the fundamental plasma parameters. For example, electron temperature and electron number density increase throughout the plasma as RF power is raised. The article by van de Sande and van der Mullen 465 provides a solution to the experimentalist that suffers from stray light during fundamental plasma studies. The authors 465 reported the use of a triple grating spectrograph as part of an experimental setup for fundamental plasma studies and Thomson scattering. The device helps to study plasmas (with low scattering intensity and low electron temperature such as low-pressure gas discharge lamps) in the presence of intense stray light because the first two gratings of the spectrograph act as a stray-light filter.”
José-Luis Todolí recommended this article, 464 which is specifically related to examining the effect of water and regarded it as an “impressive study evaluating plasma fundamental properties for different operating conditions. 464 Spatially resolved information is obtained and the special characteristics of the plasma are discussed in the presence as well as in the absence of water.”
Plasma diagnostics on a mixed-gas ICP – Sesi, Mackenzie, Shanks, Yang, and Hieftje, 469 Spectrochim. Acta Part B, 49 (1994) 1259–1282
As explained by José-Luis Todolí, “The effect of helium, nitrogen, and hydrogen is studied from the point of view of radially resolved electron number density, electron temperature, gas-kinetic temperature, and Ca II emission intensities. 469 Very interesting observations complement previously published work cited by this article, indeed. This work, 469 together with others published by the same group over the years, have allowed an understanding of the complexity of the processes occurring inside the plasma in the presence or absence of gases other than argon or particular matrices. An idea has remained in many of these studies: the phenomena occurring in the plasma are spatially dependent.470,471”
Comparison of plasma fundamental parameters for ICPs operated at 27 and 40 MHz – Huang, Lehn, Andrews, and Hieftje, 472 Spectrochim. Acta Part B, 52 (1997) 1173–1193
As commented by George Chan, “The Hieftje group published several reports on ICP diagnostics with Thomson and Rayleigh scattering (see Sections 11.3.2 and 11.3.3), and this one 472 is particularly picked as there is another unique component in this paper. It compared the effect of radiofrequency at 27 and 40 MHz with the same radiofrequency generator, impedance-matching network, load coil, torch, and operating conditions. Because all other experimental conditions were identical, this study 472 unambiguously clarified the fundamental differences of a 27- and a 40-MHz ICP. Inherently offered by Thomson and Rayleigh scattering, absolute values of electron temperature, electron number density, and gas-kinetic temperature in vertically and radially resolved 2-D maps were presented. All these fundamental physical parameters were found to decrease as plasma frequency was switched from 27 to 40 MHz; the central channel was affected the most and was widened at 40 MHz, facilitating the ease of sample introduction.”
Plasma robustness as indicated by the Mg II/Mg I ratio – Mermet, 473 Anal. Chim. Acta, 250 (1991) 85–94
This classic paper 473 on the use of the emission intensity ratio of Mg II/Mg I to gauge plasma robustness in an ICP was recommended by many scientists, including George Chan, Gary Hieftje, Steven Ray, José-Luis Todolí, and Elisabetta Tognoni.
Concisely summarized by Elisabetta Tognoni, “This paper 473 is the classic on the use of the Mg ionic-to-atomic line-intensity ratio in ICP–AES to check for robust conditions.” As noted by Steven Ray, “A foundational concept in the development in plasma spectrochemical analysis that provides a basis for comparison between different plasma systems, and a simple yet powerful robustness test. The reasons behind selection of this line pair are well described in this paper, 473 and it is useful not only to instruct students on this particular ICP–AES approach but also to introduce the idea of a ‘robustness test’ of an analytical system to ensure reproducibility and accuracy of results.”
Gary Hieftje added, “This paper 473 is one of those for which Jean-Michel Mermet is well known, and reveals his hallmark common-sense approach to addressing vexing problems in ICP–AES measurements.”
José-Luis Todolí expanded the discussion and stated, “In the present paper, 473 a discussion of the use of a simple method to determine the departure of the plasma from LTE is given. The method was based on the determination of the Mg II/Mg I ratio. A clear explanation is given to understand why magnesium is a good candidate for this purpose. Likewise, discussions on the effect of the plasma RF power, the inner diameter of the injector tube, the residence time through the plasma observation height, the mass of aerosol delivered to the plasma, and the coupling energy on the Mg II/Mg I ratio are included. Even the effect of sodium as a concomitant in terms of modification of the plasma thermal characteristics is mentioned together with the impact of a sheathing gas stream on the sodium effect. Many of the aspects mentioned in this article are currently used as references in studies related to ICP–AES analysis and optimization of the plasma performance. Furthermore, this article, 473 together with the references therein, allowed an understanding on how non-spectral interferences originating from the plasma can be overcome in order to achieve good accuracies.”
George Chan added, “This is the classic paper by Mermet 473 discussing the development and the underlying principles of the Mg II 280.270 nm/Mg I 285.213 nm line-intensity ratio (which is sometimes referred to as the Mermet ratio) as a gauge for plasma robustness in ICP–AES. Based on a simple LTE argument, Mermet explained why a plasma giving a Mg II/Mg I ratio around 10 in an ICP is termed a robust plasma (i.e., the origin of the magic number 10). 473 Reasons why this specific Mg line pair was chosen were also explained in detail. The paper further discussed the effect of plasma operating conditions (RF power, carrier gas flow, injector internal diameter, use of a sheathing gas, and hydrogen addition) on residence time, energy transfer, and hence plasma robustness. There are two specific points to note. First, the criterion of an Mg II/Mg I ratio at around 10 for a robust plasma is specifically referring to an ICP and other analytical plasmas should have their own (likely different) threshold numbers, based on the typical electron number density and temperature of the plasma in question. Thus, it is inappropriate to simply apply this ‘Mg II/Mg I ratio ∼10’ criterion to other plasma sources. Second, the remark ‘the closeness of wavelengths usually avoids a wavelength response correction’ 473 does not apply to an echelle-grating spectrometer. This remark is slightly outdated because of the increasing popularity of array detectors with echelle-grating spectrometers starting in the 1990s and now present in many commercial ICP–AES instruments. For an echelle-grating spectrometer, a wavelength-dependent correction factor is required.”
Relationship of analyte residence time and LTE – Mermet, 474 Spectrochim. Acta Part B, 44 (1989) 1109–1116
As summarized by José-Luis Todolí, the key point of this article 474 is that “LTE can be approached in an ICP system by increasing the inner diameter of the torch injector, because the aerosol residence time goes up. 474 This study also shows how the Mg ionic-to-atomic net emission intensity ratio, Mg II/Mg I, changes as a function of the plasma electron number density and provides the values of this ratio delimiting plasma LTE conditions, which are nowadays widely accepted to discern whether a plasma is robust or not. Also interesting is the discussion about the ratios found by other authors with instruments operated at different RF power values, frequency of the generator, and aerosol plasma residence time. The literature survey included in this report, 474 together with the obtained results, highlight the importance of the injector inner diameter, plasma observation height, and the addition of a sheathing gas in terms of energy transfer to the analyte. Although the focus is put on the residence time, useful discussions on the impact of RF power and nebulizer gas flow rate on the plasma state are included. It could be considered as one of the key papers helping to understand the plasma performance under different circumstances.”
Effect of and signal fluctuations due to incompletely desolvated droplets in an ICP – (a) Olesik, Smith, and Williamsen, 453 Anal. Chem., 61 (1989) 2002–2008; (b) Olesik and Fister, 475 Spectrochim. Acta Part B, 46 (1991) 851–868; (c) Fister and Olesik, 476 Spectrochim. Acta Part B, 46 (1991) 869–883
José-Luis Todolí recommended this pair of articles453,475 and commented, “In this work, 453 emission data are taken at 10 μs time intervals. Both ionic and atomic emission signals are measured in different plasma observation zones. The existence of droplets and desolvated particles in the plasma is demonstrated by means of laser scattering experiments and their effect on plasma fundamental properties (i.e., temperature) is characterized. The ICP–AES signal fluctuations are connected to incompletely desolvated droplets arriving in the plasma. 475 The amount and size of these droplets is a direct function of operating conditions such as the nebulizer gas flow rates and the plasma RF power. A value of the droplet diameter above which the signal fluctuates is established (12 μm). Interestingly, it is indicated that the presence of an incompletely desolvated droplet in the plasma affects the emission intensity in a relatively large plasma region located as far as 1.4 mm from the droplet.”
George Chan expanded the discussion, included all three articles,453,475,476 and explained, “This article 453 is one of the earlier works to show that the really large (several 10%) signal fluctuation in ICP–AES is due to the presence of individual droplets from a conventional nebulizer–spray chamber system. Although an ICP gives stable signals during a typical analysis (e.g., <1% RSD for an integration lasting several seconds from an analyte present at a concentration much higher than the LOD), on a much shorter time scale (e.g., 10 μs), the fluctuations can be as large as several 10% RSD. 453 This paper 453 systematically traced the source of such large fluctuations in the ICP with a comparatively simple tool – two optical spectrometer detector channels, dual nebulizers and a He–Ne laser. Through well-presented deduction, it showed very convincing results in explaining the anti-correlated behavior in signal fluctuations of neutral-atomic and ionic emission lines low in the plasma and correlated fluctuations high in the plasma. Furthermore, the dual nebulizer setup, which again used the correlation argument, unambiguously pinpointed that the anti-correlated signal fluctuations low in the plasma are due to the presence of individual droplets in the observation window. The paper 453 also concluded that some droplets can survive to elevated heights (20 mm above load coil) in the ICP.
“This set of back-to-back published articles475,476 is a breakthrough as they linked in a quantitative fashion many previously reported observations in ICP emission profiles and signal fluctuations with the presence and number of incompletely desolvated droplets. The first paper 475 showed the relationship between vaporizing droplets and analyte emission through correlation between temporally resolved analyte emission and laser light scattering measurements (due to droplets). The work showed an unambiguous positive correlation between temporal intensity spikes in neutral-atomic emission with the presence of incompletely desolvated aerosols through laser-light scattered signals. In contrast, temporal dips in ionic emission signals (with Ca II) were shown to correlate with the presence of vaporizing droplets. The general rule of thumb is that droplets > 10 μm in diameter might not be able to undergo complete desolvation in the ICP (depending on carrier gas flow and power), and droplets > 20 μm in diameter are incompletely desolvated in the normal analytical zone of a typical analytical ICP. The second paper 476 clarified the role of the number of desolvating aerosol droplets in defining the spatial location of peak emission in the ICP. Specifically, the number of desolvating aerosol droplets at the height of the maximum time-integrated Ca I line was found to be constant under different combinations of forward power and nebulizer gas flow and was relatively high (∼10 500 counts s−1) whereas the same parameter was found to be much lower (∼300 counts s−1) and again appeared to be constant for the Ca II line under different studied conditions. The study 476 also uncovered a direct, quantitative link between the time-resolved and time-integrated Ca II/Ca I ratio. Time-resolved Ca II/Ca I ratios could fluctuate as much as a factor of 70 and the time-integrated ratio is controlled by the fraction of time an incompletely desolvated droplet or cloud of droplet-vaporization product is near the spatial observation region. The work discussed in this set of articles475,476 are key studies as they pinpointed the role of incompletely desolvated aerosols, in a quantitative fashion, as an important parameter in controlling and defining vertical and temporal emission profiles in the ICP.”
Effect of desolvating droplets and vaporizing particles on ionization and excitation temperatures – Hobbs and Olesik, 477 Spectrochim. Acta Part B, 48 (1993) 817–833
George Chan commented, “This is the original paper 477 that directly measured the magnitude of change in plasma temperatures and electron number density close to vaporizing droplets and particles. The experimental design for radially resolved measurements with in-house built circuitry to differentiate no-drop/near-drop scenarios should be appreciated. Although it is somewhat expected that temperatures and electron number densities should decrease in the vicinity of a vaporizing droplet or particle, this paper 477 not only solidly confirmed the expectation but also determined the changes in a quantitative fashion with spatial information. A somewhat surprising result was also reported. The number densities of both Sr neutral atoms and ions are found to be higher near incompletely desolvated droplets, which cool the plasma locally but do not release additional analyte into the plasma. 477 ”
Effect and fate of individual sample droplets in an ICP – (a) Olesik and Hobbs, 478 Anal. Chem., 66 (1994) 3371–3378; (b) Olesik, 479 Appl. Spectrosc., 51 (1997) 158A–175A
The original article on the use of the monodisperse dried microparticulate injector (MDMI) 478 for fundamental studies in the ICP was recommended by several scientists, including Annemie Bogaerts, George Chan, and José-Luis Todolí. Likewise, many scientists such as George Chan, Heinz Falk, Norbert Jakubowski, and John Olesik recommended the A-page article in Applied Spectroscopy. 479
As noted by José-Luis Todolí, “A MDMI, initially developed by French et al., 267 is used to perform plasma fundamental studies. 478 The plasma observation height at which vaporization of the desolvated droplets is complete depends on their size and is produced in a period of time ranging from 30 to 80 μs.”
Likewise, Annemie Bogaerts remarked, “This paper investigates the fate of individual sample droplets, by means of a MDMI, 478 looking at the diffusion process of a single element (Sr) after injection of droplets, or particles from dried droplets, by means of side-on optical emission spectroscopy.”
Comments from John Olesik on his Applied Spectroscopy A-page article 479 are that: “ICP–AES, ICP–laser induced fluorescence and ICP–MS showed the effect of desolvating individual droplets and vaporizing particles on the plasma temperature, excitation, and ion transport from the ICP to the MS. Atomization and ionization were directly measured using time-gated measurement of individual ion clouds as they travel through the plasma and to the MS. Matrix-induced changes in the number of ions and atoms in the plasma as well as the fraction excited were directly measured. Mass-dependent, matrix-induced changes in the transport of individual clouds of ions from the ICP to the MS detector were measured using time-resolved ICP–MS. This article 479 includes some results not published in other articles.”
Heinz Falk stated, “By introducing isolated monodisperse droplets of a liquid sample into the ICP, the fundamental processes in the plasma can be studied which is the basis for the understanding of the mechanisms taking place in ICP–AES and ICP–MS instruments. This knowledge enabled researchers to improve the analytical performance of ICP–AES and ICP–MS and to develop self-diagnosing instrumentation with higher reliability in elemental analysis. This paper 479 can be a valuable tool to introduce beginners to the ICP for solution analysis.”
George Chan opined, “The 1994 Analytical Chemistry paper 478 is the first one in a series of seminal papers by the Olesik research group on using the MDMI to gain fundamental insights into the various physical processes like aerosol desolvation, vaporization, atomization, ionization, and diffusion in the ICP. Although introducing individual, monodisperse-sized droplets reproducibly is conceptually identical to similar studies in a chemical flame, the higher temperature, spatial heterogeneity, and smaller size of the ICP make it a very difficult task in practice prior to the development of the MDMI. This paper 478 clearly demonstrated the enormous potential of the MDMI for fundamental studies in the ICP as it separates the different processes in time and space and allows one to follow the processes sequentially. The paper 478 contained a first demonstration of the time scale, 40 to 80 μs, of analyte particle vaporization in the ICP. Another first demonstration was the sequential events of particle vaporization, atomization, and ionization in the ICP, in particular, a rapid initial raise of Sr I emission to a peak followed by a decline with a rise of Sr II emission which then continues as a plateau. The focal-point article in Applied Spectroscopy 479 summarized the many findings on fundamental processes in the ICP, including kinetic information on desolvation, vaporization, atomization, and ionization. The Olesik group combined several tools (atomic emission spectrometry, laser induced fluorescence, mass spectrometry) with the MDMI and opened up many possibilities of plasma diagnostics, and in many cases, with complementary information. The beauty in the design of these experiments should itself be a learning point (in addition to the experimental findings and conclusions). Quite a substantial list of fundamental questions (of course, there are still unanswered questions) related to fundamental processes in the ICP were covered in a very easy-to-navigate and coherent way, making this review 479 a very good starting point for readers who want to know more about possibilities with the MDMI for fundamental work.”
Visualization of local cooling, plasma reheating, and thermal pinching induced by single aerosol droplets injected into an ICP – Chan and Hieftje, 480 Spectrochim. Acta Part B, 121 (2016) 55–66
As summarized by Annemie Bogaerts, this study 480 “focuses on the localized effects induced by the introduction of single aerosol droplets into an ICP, 480 by capturing time-resolved two-dimensional monochromatic images of the plasma.” Carsten Engelhard also suggested this paper 480 and commented, “Chan and Hieftje 480 showed monochromatic images (OH, Hα, and Ar emission lines) that illustrate the changes an ICP undergoes upon introduction of single aerosol droplets including plasma cooling, plasma reheating, and thermal pinching. This study helps to more fully understand the physical behavior of the ICP. For example, a local cooling effect was observed that can extend 6 mm into the plasma volume with respect to the physical location of the vaporizing droplet (50-µm diameter). Also, plasma reheating was found to last longer than 4 ms after the droplet event. These findings are important to consider in the future not only for single droplet and particle analysis but also for single cell applications. Note that there is a movie in the supplementary material, which shows the effects of droplet introduction on the plasma behavior (excellent teaching material).”
High-speed photographic study of droplets and particles in ICP – (a) Houk, Winge, and Chen, 481 J. Anal. At. Spectrom., 12 (1997) 1139–1148; (b) Aeschliman, Bajic, Baldwin, and Houk, 482 J. Anal. At. Spectrom., 18 (2003) 1008–1014
As mentioned by George Chan, “This paper 481 discussed another imaging technique, high-speed photography (4000 frames s−1), to follow the trajectories of wet droplets or solid particles during their vaporization and atomization events. Although similar explosions had been reported in a chemical flame, 483 droplet explosion during desolvation was captured for the first time in the ICP. The work illustrated an important point that ‘for a given sample composition, all droplets and particles need not dry and decompose in precisely the same way,’ 481 at least both in a flame and ICP. The other paper 482 is a follow-up study focusing on laser-ablated particle vaporization in ICP by means of digital photography and video. ‘High-speed’ in the title 482 referred only to the shutter speed, not the video rate. Particle trajectory – an indication of incomplete particle vaporization – was clearly visible in the pelletized Y2O3 sample, independent of laser wavelength (266 versus 193 nm) or ablation gas (Ar versus He). To a lesser extent, incomplete vaporization was also observed for a Y-doped glass sample. An interesting idea was presented to effectively reduce (but not eliminate) larger ablated particles, and hence reduce particle streaks, through the use of a tandem cyclone–Scott spray chamber. 482 The approach works only if solution is nebulized simultaneously or at least when the inner surface of the chamber is wet.”
Measurement of gas flow velocities in an ICP – Cicerone and Farnsworth, 484 Spectrochim. Acta Part B, 44 (1989) 897–907
As explained by George Chan, “Whilst measuring gas flow velocities in a plasma source as hot as the ICP does not sound like an easy task, this paper 484 showed a very simple, non-invasive way. It is another remarkable example showing how one can wisely transform measurement noise into a signal. The principle of the method is based on the emission spikes (i.e., noise) of a neutral-atomic emission line at hundreds-μs time scale. With two spectrometers and detectors set at slightly different heights, the spike patterns at the two detectors are offset by the time for the atom cloud (the source of the spike) to travel the pre-defined distance between the two spectrometer slits. The travel time can be readily measured through correlation of the two detector channels. Gas velocities in the ICP under different combinations of operating conditions were reported to be typically between 20 to 30 m s−1 for plasma regions above the load coil. 484 A striking finding is that the gas velocity above the load coil is independent of the central channel gas flow within a reasonable operating range. 484 A similar approach using atomic vapor clouds from isolated aerosol droplets was employed earlier with an analytical flame.485,486”
Simple experiments for the control, evaluation, and diagnosis of an ICP–AES system – Poussel, Mermet, and Samuel, 487 Spectrochim. Acta Part B, 48 (1993) 743–755
According to José-Luis Todolí, “In the present study, 487 an analysis of the effect of different components of the ICP instrument on the analytical performance is presented. A procedure to perform a rapid ICP diagnostic is suggested. This method is based on the measurement of Ar, Mg, Ba, and Zn emission lines. Magnesium ratios are also determined. A flow chart is proposed to complete the evaluation and the diagnosis of an ICP instrument. Examples of malfunctions of the instrument are given. Previous, more complex diagnostic procedures 488 are described for determination of spatially resolved electron number densities, gas kinetic temperatures, three-dimensional emission intensities, noise power spectra, and the use of a Langmuir probe to study the expansion processes occurring in an ICP–MS interface.”
George Chan shared similar comments and stated, “This paper is unique as Poussel and Mermet 487 described a suite of very simple diagnostic tools and parameters which can be readily applied for the control, evaluation and diagnosis of a commercial ICP system. Although the described procedure is very application-oriented, the development is undoubtedly based on many years of experience and a very deep understanding of fundamental plasma diagnostics. It is a good example showing how fundamental research can be developed into very simple tools for routine users. Specifically, the flowchart 487 allows routine ICP users to verify practical resolution, efficiency of ionization and excitation, light absorption, stability and efficiency of nebulizer, and drift of commercial ICP systems. An interesting example presented is the dramatic impact of the conductivity of cooling water on energy transfer (see Figure 12 in the paper 487 ).”
Matrix interference in ICP optical spectrometry
Early work on the effects of easily ionizable elements (EIEs) on plasma characteristics – Kalnicky, Fassel, and Kniseley, 489 Appl. Spectrosc., 31 (1977) 137–150
Ralph Sturgeon and Michael Blades both nominated this paper. 489 Michael Blades noted, “It is a classic paper 489 on the interference effects caused by easily ionized elements when ICPs are used for spectrochemical analysis. Specifically, excitation temperatures and electron number densities experienced by analyte species in ICPs with and without the presence of an easily ionized element were reported. This paper set in motion efforts by a number of groups to try to understand the origins of these effects.”
The effect of sample matrix on electron number density, electron temperature, and gas temperature examined by laser scattering – Hanselman, Sesi, Huang, and Hieftje, 470 Spectrochim. Acta Part B, 49 (1994) 495–526
As noted by John Olesik, “Direct (extremely challenging) measurement of the effect of matrix on electron number density, electron temperature, and gas temperature as a function of distance downstream of the load coil and radial distance from the center of the plasma by Thomson and Rayleigh scattering provided a breakthrough in understanding matrix effects in ICP–AES. 470 Previous to this paper, electron number densities in ICPs were measured using line-of-sight H emission line broadening that required techniques such as Abel inversion to obtain radially resolved data that resulted in large uncertainties in the radial center of the plasma. The Thomson and Rayleigh scattering measurements provided not only three-dimensional resolution without inversion but also the first direct measurement of electron and gas temperatures. Many of the previously conflicting reports on whether the electron number density or ‘temperature’ are changed by the presence of high concentrations of an efficiently ionized element or an inefficiently ionized element in the sample could be reconciled by the three-dimensionally spatially resolved measurements reported in this publication. In addition, this study 470 was the first direct measurement of the significant impact of matrix effects on the gas and electron temperatures.”
Effect of second ionization potentials of matrix elements on severity of matrix interferences – (a) Chan, Chan, Mao, and Russo, 490 Spectrochim. Acta Part B, 56 (2001) 77–92; (b) Chan and Hieftje, 491 Spectrochim. Acta Part B, 61 (2006) 642–659
Comments from George Chan on this set of articles490,491 are: “This set of papers490,491 is worthy of discussion because it showed that matrix elements having low second (instead of the widely reported first in the literature) ionization potentials produce the strongest matrix effect in the ICP. The work showed that it is sometimes needed to repeat experiments with a large set of data in order to dig deeper into other observations, particularly the secondary factor. In the first part of the work, 490 matrix effects from a total of 31 matrices were investigated to arrive at the conclusion that the severity of matrix effects in the ICP correlates with the second ionization potential of the matrix element. In the second part of the study, 491 the matrix list was expanded to 51 elements. Only with a sufficiently large set of chemical matrices, including almost all low second-ionization potential elements (excluding radioactive ones), we revealed that the electronic configuration of the doubly charged matrix ion has an unambiguous correlation with the low second-ionization potential matrix effect; namely matrix effects are stronger if the doubly charged matrix ion possesses low-lying energy levels. 491 Although there was a lot of literature on ICP matrix effects prior to this study, I learnt the lesson that repeating ‘classical’ experiments with a vastly expanded data set (if advancement in instrumentation allows such a study to be relatively easily performed) sometimes could offer new insights. Surprise can happen if one digs down into the details with a large data set.”
Local effects of atomizing analyte droplets and matrix effects on plasma parameters – (a) Groh, Garcia, Murtazin, Horvatic, and Niemax, 492 Spectrochim. Acta Part B, 64 (2009) 247–254; (b) Murtazin, Groh, and Niemax, 493 Spectrochim. Acta Part B, 67 (2012) 3–16
As noted by Annemie Bogaerts, “The first paper 492 in this list reported a study on the effect of desolvation and atomization of monodisperse microdroplets introduced into an ICP, with frequencies between 1 and 10 droplets per second, by means of end-on and side-on optical emission spectroscopy, employing simultaneously up to three calibrated monochromators with fast photomultipliers. It studied the effect of injector gas flow rate, droplet diameter, and amount of analyte on the spatial positions of analyte atomization and ionization. The second paper 493 reported matrix effects in the ICP by the introduction of single droplets.”
Spatially resolved plasma emission as an indicator for flagging matrix effects – Chan and Hieftje, 494 J. Anal. At. Spectrom., 23 (2008) 193–204
José-Luis Todolí explained, “Often, facing matrix effects and drift is difficult to handle, firstly because one may not be aware of the existence of these phenomena. This article 494 has led to a series of papers explaining the potential of obtaining signal emission profiles for flagging interferences caused by easily ionized elements and inorganic acids as well as instrument drift. The interesting basic idea behind this study 494 is that the plasma thermal and excitation characteristics are modified by the presence of a matrix vertically along the plasma central channel. Because the magnitude of matrix effects changes as a function of the plasma excitation state, a modification in the calculated analyte concentration provided by external calibration along the plasma channel would identify the existence of a matrix effect (or drift). In the absence of these phenomena, the sample must behave as the standards and, hence, the determined analyte concentration should be the same regardless of the plasma observation height. An interesting point is that the method could be applied for flagging plasma and sample-introduction related matrix effects as well as for testing the absence of spectral interferences. As regards drift flagging, the article 494 describes the vertical profiles under slightly different conditions of three variables to simulate possible changes in the system operation: (i) liquid flow rate; (ii) nebulizer gas flow rate; and (iii) plasma RF power. The method also provides a simple means for controlling the stability of the ICP system.”
José-Luis Todolí continued, “Among the studies related to this work, 494 we could highlight some other references.495–497 Thus, paper 495 could be considered as the precursor study dealing with the evaluation of several parameters as indicators for the detection of a given matrix effect. This study 495 concludes that the analyte emission vertical profile changes significantly as the matrix is modified. Meanwhile, the interest of this reference 496 is that it demonstrates that axial analyte relative profiles may be a warning indicator of interferences in end-on viewed plasmas. Finally, a follow-up work 497 shows how a protocol can be developed for automatically classifying the analyte concentration spatially resolved curves in order to detect whether the method is free from interferences or not (i.e., if the profile is flat, no matrix effect appears whereas a curved profile reveals the existence of these unwanted phenomena). I would include all the papers of this series also because they have contributed to a better understanding of the processes occurring within the plasma in the presence of an element easy to be ionized. The effects were prefaced by investigations reported by Galley et al. 498 in which the spatially dependent magnitude of the matrix effects caused by an easily ionized element was demonstrated.”
Noise, analytical performance, and improvement
Noise-power spectra of ICP – Belchamber and Horlick, 499 Spectrochim. Acta Part B, 37 (1982) 17–27
As commented by George Chan, “Noise-power spectra of the ICP reveal lots of interesting features, as depicted in this paper. 499 The experimental section, albeit brief, summarized the very important consideration of detector bandwidth and Nyquist frequency for data collection for noise power spectra. The fact that the amplitude of the low frequency component (<5 Hz) increased by one order of magnitude (noise power increased two orders) when the analyte concentration increased by one order confirmed analyte flicker noise. Another key point of the paper 499 is the presence of a comparatively broad noise component at 200 to 400 Hz depending on the applied power and coolant gas flow. Through confirmation with a microphone, this noise feature was found to match the acoustic noise of the plasma and could be eliminated through the use of an extended torch to vary the plasma gas-flow dynamics. Another reported innovation was simultaneous use of dual-channel measurement with two identical spectrometers placed at 90° to each other, which found that the signal in one channel is 90° out of phase to the other channel, confirming that the plasma was rotating. 499 ”
Examples of environmental parameters on ICP stability – (a) Tracy, Myers, and Balistee, 500 Spectrochim. Acta Part B, 37 (1982) 739–743; (b) Kornblum, Klok, and de Galan, 501 Spectrochim. Acta Part B, 38 (1983) 1363–1366
This pair of articles was recommended by George Chan, who noted, “These two early papers500,501 are representatives showing how delicate an ICP system can be. The paper by Tracy, Myers, and Balistee 500 showed the importance of observing very fine details in measurement signals and careful tracing of signal fluctuation to an often-neglected source. Although it was known for a long time that droplets naturally carry electrical charges (e.g., droplets from a nebulizer or from a waterfall), this paper 500 showed how droplet electrification changes aerosol generation and transport in an ICP system. Although the presented experiments sound somewhat straightforward (through grounding the solution at various points – sample bottle, spray chamber, and waste drain), the researchers likely took a lot of effort to pinpoint and suspect aerosol electrification as a candidate in the first place because the observed phenomenon was reported to be intermittent and depended on the laboratory environment (relative humidity). 500 The paper by Kornblum, Klok and de Galan 501 is unique as it reported another often-overlooked parameter in defining signal stability in the ICP – temperature of the cooling water. With an ICP generator without a feedback circuit to minimize reflected RF power, reflected power was shown to increase with rising cooling water temperature and caused more than 1.5% relative change per degree Celsius change in water temperature. Although with reflected power minimization, the emission intensity variation was smaller with changes in cooling water temperature, the effect was reported to be still significant. 501 The work clearly showed that an ICP can be readily affected by environmental parameters.”
An LTE model toward a calibration-less ICP–AES method – Tognoni, Hidalgo, Canals, Cristoforetti, Legnaioli, and Palleschi, 502 J. Anal. At. Spectrom., 24 (2009) 655–662
As commented by Nicoló Omenetto, “This work 502 describes a welcome combination of the calibration-free analysis developed for laser-induced plasmas 503 and a modified classical ‘robustness’ parameter identification procedure introduced by Mermet (to whom the paper is dedicated) for ICP emission of solutions. Like in the case of laser plasma, the analytical zone of the ICP can be affected by spatial gradients of temperature, electron and species number densities. The authors 502 show how the proposed double ratio procedure allows easy detection of changes in plasma temperature and consequently infer the existence of a matrix effect.”
A simple partial-LTE model for semi-quantitative ICP–AES analysis based on a single element calibration standard – Dettman and Olesik, 504 J. Anal. At. Spectrom., 27 (2012) 581–594
As commented by John Olesik, “This paper 504 presents the first application of a partial-LTE model to accurately (within 3× for most emission lines) predict relative populations of all atom and ion electronic energy levels for 66 elements. The model allows semi-quantitative analysis for 66 elements while requiring only one single element calibration solution. A subsequent paper 505 showed that the partial-LTE model could be used to compensate for matrix effects that resulted in a change in the plasma temperature and therefore, line-dependent changes in signal/concentration. In addition, results using the partial-LTE model and a measured Mg II/Mg I emission intensity ratio showed that the percentage of atom ionization is lower for many elements than was previously estimated, 506 which has implications on the relative sensitivities of different elements by ICP–MS as well as the potential severity of matrix effects due to sample-induced increases in the electron number density in the plasma.”
Computer simulation of ICPs
Early work on computer simulation on gas properties and energy losses in argon ICP – (a) Barnes and Schleicher, 507 Spectrochim. Acta Part B, 30 (1975) 109–134; (b) Mostaghimi, Proulx, Boulos, and Barnes, 508 Spectrochim. Acta Part B, 40 (1985) 153–166
José Broekaert recommended the paper by Barnes and Schleicher, 507 and noted, “The paper 507 in a first attempt shows that the discharge characteristics of the ICP can be derived by theoretical modeling. Models for calculating the spatial distributions of gas properties and energy losses in the case of analytical ICPs are given and simulations of temperature distributions as a function of discharge configurations are presented.”
According to Annemie Bogaerts, “The paper by Barnes and Schleicher 507 is the first modeling study for a spectrochemical ICP, based on a combined 2-D/1-D model, solving the energy equation in 2-D and the electromagnetic field equations in 1-D. The model provides the 2-D temperature and velocity distributions, and the plasma and analyte emission pattern. The group by Mostaghimi, Proulx and Boulos did most of the pioneering work on ICP modeling, although mostly not for analytical chemistry conditions. However, in this paper, 508 in collaboration with Barnes, they built a model which provides the 2-D emission profiles of various atomic and ionic emission lines, for a spectrochemical ICP. In addition, the gas flow profiles, temperature distribution, and various plasma species density profiles were obtained, based on the assumption of local thermodynamic equilibrium (LTE).”
Self-consistent simulation model for plasma temperature, flow velocity, and injection diameter effects – (a) Lindner and Bogaerts, 509 Spectrochim. Acta Part B, 66 (2011) 421–431; (b) Lindner, Murtazin, Groh, Niemax, and Bogaerts, 510 Anal. Chem., 83 (2011) 9260–9266
According to Annemie Bogaerts, this pair of papers509,510 contains the work on the “first ‘self-consistent’ model 509 (i.e., without the need of external input parameters) for an ICP used in analytical spectrochemistry, operating at atmospheric pressure and at typical conditions adopted from experiments. It calculates the gas-flow behavior and plasma formation, accounting for viscosity and ionization. This model was developed in a generic way, so that it is applicable to a range of gases, i.e., carrier gas, sample material, as well as various mixtures. The model was validated by experiments in a later study. 510 ”
In addition to Annemie Bogaerts, José Broekaert and José-Luis Todolí also recommended the second article 510 in this cluster. The annotations by José Broekaert on this article are: “The paper 510 shows that results from theoretical modeling of ICPs are in excellent agreement with the measured analytical performance. On the basis of well-known energy-exchange processes and material properties as well as simulations, temperature distributions and analytical properties of ICPs as ion sources for mass spectrometry can be calculated and are shown to be in good agreement with measured values.”
Comments from José-Luis Todolí are: “In this study, 510 numerical simulation has been applied to characterize the plasma temperature and flow velocity. Variables evaluated include the injector inner diameter, gas flow rate, and the plasma observation area. This paper is a good example of what computer simulations can do in order to better understand the plasma processes occurring in both ICP–AES and ICP–MS. Additional examples are also found in the work performed by Bogaerts.”
Modeling of particle and ion cloud transport in ICP torch – (a) Aghaei and Bogaerts, 511 J. Anal. At. Spectrom., 31 (2016) 631–641; (b) Aghaei, Lindner, and Bogaerts, 512 Anal. Chem., 88 (2016) 8005–8018
As explained by Annemie Bogaerts, this group of papers511,512 is an “extension of the previous model by describing the behavior of elemental particles most relevant for ICP–MS, including particle transport, vaporization (first paper) 511 and ionization, and the behavior of the corresponding ions (second paper). 512 This final model thus describes the particles’ behavior, and calculates the actual position, phase (liquid, vapor or ionized), temperature, and velocity, not only in the ICP torch but also at the sampler orifice. Hence, information is obtained on the position of the ion clouds, for both the Ar carrier gas and the sample material. This is important both for OES and MS. A general overview of this complete model, presenting typical results, was later published as an invited review paper. 513 ”
Low-flow ICP
Development and construction of miniaturized and low-flow ICP – (a) Savage and Hieftje, 514 Anal. Chem., 51 (1979) 408–413; (b) Rezaaiyaan, Hieftje, Anderson, Kaiser, and Meddings, 515 Appl. Spectrosc., 36 (1982) 627–631
Both Carsten Engelhard and José-Luis Todolí recommended the first paper 514 in this cluster, in which a miniaturized ICP was discussed. As commented by Carsten Engelhard, “Savage and Hieftje 514 demonstrated quite early that it is possible to design and operate a size-reduced ICP torch (‘mini-ICP’ with 50% less argon gas consumption) and achieve comparable analytical performance as conventional ICP sources at the time. Unfortunately, the commercially available torches used today still require high radiofrequency power and their continuous operation is expensive due to the high argon consumption (10–20 L min−1).”
José-Luis Todolí added, “In this study, 514 a low consumption (7.9 L min−1 coolant and 0.97 L min−1 nebulizer gas flow rates) ICP torch is used and its capabilities are compared against those provided by a conventional system consuming around 17 L min−1 of argon. After this report, 514 several efforts515–517 have been made in order to further lower the argon consumption by miniaturizing the torch as well as characterizing interferences. More recent designs have lowered the argon consumption down to 0.6 L min−1. 518 ”
The paper by Rezaaiyaan et al. 515 was suggested by José Broekaert with annotation, “The paper 515 is a unique approach to promote the ICP as a low-cost source for atomic spectrometry. The possibilities of reducing the argon consumption to ∼5 L min−1 and lower in argon ICPs were discussed.”
Hieftje himself added, “Given the success of earlier studies on the use of optimized torches for lower-flow and lower-power ICP operation,514,515,517,519 it seems strange that most (but not all) commercial instruments continue to use torches that require flows and power levels common several decades ago.”
ICP torch with very low (≤ 2 L min−1) argon consumption – (a) Klostermeier, Engelhard, Evers, Sperling, and Buscher, 518 J. Anal. At. Spectrom., 20 (2005) 308–314; (b) Scheffer, Brandt, Engelhard, Evers, Jakubowski, and Buscher, 520 J. Anal. At. Spectrom., 21 (2006) 197–200
Carsten Engelhard suggested this pair of papers518,520 and noted, “The paper by Klostermeier et al. 518 is the first one from a series of papers on alternative low-argon-flow ICP torch designs published by the Buscher group, all of which were cooled externally by compressed air. While the analytical performance was comparable to the standard torch, the device suffered from thermal stress and was never commercialized. Scheffer et al. 520 reported a torch-on-sampler design for ICP–MS with very low argon (<2 L min−1) and power consumption (0.65 kW). Clearly, new concepts have to convince the broader community with excellent performance, durability, as well as reduced cost to ultimately replace the standard torch design.”
Inductively Coupled Plasma–Mass Spectrometry (ICP–MS)
Developments of ICP and other relevant atomic MS
Analytical atomic MS before ICP–MS
Mass spectrometric characterization of chemical reactions and flames – (a) Spencer-Smith, 521 Philos. Mag., 19 (1935) 1016–1027; (b) Knewstubb and Sugden, 522 Proc. R. Soc. Lond. A, 255 (1960) 520–537; (c) Gray, 523 Spectrochim. Acta Part B, 40 (1985) 1525–1537
Gary Hieftje complained, “Many current scientists are of the view that mass spectrometry of plasmas began with the use of capillary arcs, ICPs, and the like. In contrast, there is a rich body of literature dating back to at least the 1930s in which mass spectrometry was used to characterize chemical reactions in glow discharges 521 and later in combustion flames. 522 More about these early days of plasma-source mass spectrometry can be found in the excellent overview by Alan Gray. 523 ”
Spark source mass spectrometry – (a) Hannay, 524 Rev. Sci. Instrum., 25 (1954) 644–648; (b) Hannay and Ahearn, 525 Anal. Chem., 26 (1954) 1056–1058
David Koppenaal remarked, “These two articles524,525 contain pioneering work in spark source mass spectrometry (MS) for direct solid analysis. The papers are among the first to demonstrate the impressive simultaneous analysis capability of spark source MS and to show analytical utility unmatched at the time in terms of detection limits, breadth of application, and relative ease of comprehensive elemental analysis. They contain some extensive discussion of photographic ion detection and data interpretation. The papers524,525 had significant impact in prompting commercial development of the MS7 series of spark source MS instruments by Metrovic/AEI (Associated Electronic Industries) in the UK, Europe, and USA, and similar subsequent instruments by JEOL Inc. in Japan and the Far East. These spark source MS instruments remained in production and use for the next 30+ years and cemented the use of the Mattauch–Herzog magnetic-sector MS design for elemental MS. The spark source MS technique remained in vogue, particularly for metals and geological analysis, until the late 1980s when sector-field instruments for GD–MS and ICP–MS began taking its place.”
Mass spectrometric sampling from a capillary arc plasma at atmospheric pressure – Gray, 526 Anal. Chem., 47 (1975) 600–601
John Olesik noted, “This paper 526 described the first atmospheric-pressure plasma–mass spectrometer. According to Sam Houk, 527 Alan Gray was probably the person who first thought of ICP–MS. The development of the first ICP–MS instrument by Sam Houk, at the time a graduate student, and Velmer Fassel, his research advisor, began immediately after they read Gray's paper. 526 Therefore, the impact of this paper was enormous – leading Houk et al. 528 to build the first ICP–MS. Gray's paper 526 showed that the combination of an atmospheric plasma and mass spectrometry could provide excellent detection limits.”
Birth of inductively coupled plasma–mass spectrometry (ICP–MS) – Houk, Fassel, Flesch, Svec, Gray, and Taylor, 528 Anal. Chem., 52 (1980) 2283–2289
Numerous scientists, including Nicolas Bings, Michael Blades, Annemie Bogaerts, José Broekaert, WingTat Chan, Paul Farnsworth, Detlef Günther, Gary Hieftje, Norbert Jakubowski, Vassili Karanassios, David Koppenaal, John Olesik, Martín Resano, José-Luis Todolí, Frank Vanhaecke, and Zhanxia Zhang recommended reading this classic paper 528 in which the birth of ICP–MS was described.
Gary Hieftje opined, “From a current perspective, it seems rather shocking that this seminal paper 528 had so much difficulty in finding its way to publication. It laid the groundwork for what is now clearly one of the dominant methods for elemental analysis.” Paul Farnsworth commented, “As was the case with ICP–AES, several groups and individuals contributed to the emergence of ICP–MS as a powerful analytical technique. I have listed this paper 528 because it includes the key figures and it demonstrates not only the potential of the technique, but also identifies some of the challenges that would remain as ICP–MS developed into a mature analytical tool.”
Detlef Günther shared a similar opinion and noted that this paper, “describes the first combination of an ICP with a mass spectrometer. 528 Experience with the ICP developed for optical emission was the starting point for mass spectrometry. It has set the basics for countless developments for trace and ultra-trace element analysis in various media.”
Frank Vanhaecke stated, “It is the first paper 528 published on the combination of an ICP as ion source with a quadrupole filter for mass analysis. Capabilities for trace element and isotope ratio determination in aqueous solutions are described.” Zhanxia Zhang shared a similar view on the capability of isotope-ratio determination.
The viewpoint offered by José Broekaert is that “the use of an ICP as an ion source for mass spectrometry enabling trace determinations in solutions was described. The paper 528 is the basic one and the first one on mass spectrometry with an ICP.” Michael Blades, Norbert Jakubowski, and John Olesik shared a very similar view, and WingTat Chan noted that this paper 528 contains not only “ICP–MS for the determination of trace elements but also a clear depiction of polyatomic background species.”
José-Luis Todolí added, “This study 528 is the first one dealing with the coupling of an ICP with a mass spectrometer. In this paper, 528 a description of the interface, vacuum system, etc. is made. The basic configuration is currently still being used and issues such as mass spectra, determination of isotopic abundances, detection limits, interelement effects (ionization suppression) or formation of solid deposits are still being studied in recent investigations.”
David Koppenaal elaborated, “This paper 528 is one of the seminal, classic articles describing the basis and promise of ICP–MS, and is considered as the original ICP–MS demonstration by the Iowa State/Ames Laboratory research group led by Velmer Fassel. Spectra showing singly charged elemental species along with minor polyatomic ions are presented and discussed. Impressive detection limits and simultaneous analysis potential are made obvious. This paper 528 and the one by Date and Gray 529 started the ICP–MS revolution in atomic spectrometry.”
Early development of ICP–MS – (a) Date and Gray, 529 Analyst, 106 (1981) 1255–1267; (b) Gray and Date, 530 Analyst, 108 (1983) 1033–1050; (c) Houk, 506 Anal. Chem., 58 (1986) 97A–105A
This cluster of papers from Date, Gray, and Houk506,529,530 document the early development of ICP–MS. As noted by Nicolas Bings, “Since the ICP was first successfully coupled to a quadrupole mass analyzer, it became the most versatile trace, ultra-trace elemental and isotope analysis technique available, as we all know. A huge number of manuscripts were published since then and it is therefore quite difficult to select outstanding and important papers representing the broad variety of applications and instrumental developments that have taken place since 1981. These three papers506,529,530 documented some of the early development.”
Comments offered by Vassili Karanassios on the Date and Gray 1981 article 529 are: “The paper 529 provides blank (i.e., water-acid) background mass spectra and it identifies major and minor background species.” David Koppenaal added, “In this article, 529 the UK team of Alan Date and Alan Gray shows first illustrative data from their ICP–MS system. Their approach and work would lead to the development of one of the first two commercially available ICP–MS systems (the VG PlasmaQuad, introduced in 1983–84). It is a seminal and classic article on the original ICP–MS development.”
In addition to Nicolas Bings, the paper by Gray and Date 530 was also recommended by Michael Blades, Martín Resano, and Ralph Sturgeon. Michael Blades noted that the Gray and Date paper 530 was “the first description of a practical method for continuous sampling of an ICP for ICP–MS”. Martín Resano further noted that the Gray and Date paper 530 “featured the first coupling of an electrothermal vaporizer to an ICP–MS”. Ralph Sturgeon provided more insight on this electrothermal vaporization (ETV) aspect and noted, “Following the earlier study by Kirkbright, 531 Gray and Date 530 demonstrated the benefits of ETV for sample introduction into an ICP–MS, highlighting the benefits of short integration time and lower background arising from water to enhance detection of elements such as S and to improve isotope-ratio determinations due to enhanced counting statistics (i.e., sensitivity).”
Steven Ray shared his view on Houk's A-page article 506 and stated, “This paper 506 provides the first exposition on the key concepts and advantages of ICP–MS, written by one of the fathers of the technique. The paper 506 provides scientific motivation, places ICP–MS within the field of other analytical options, and makes conclusions that remain valid today.”
Atomic mass spectrometry with microwave-induced plasma and Campargue-type interface – Douglas and French, 532 Anal. Chem., 53 (1981) 37–41
According to David Koppenaal, “This research 532 describes the first use of a microwave plasma as an ionization source for elemental mass spectrometry. It extends the early research for plasma ionization sources. Despite some advantages relative to ICP–MS, this approach simmered as the development of ICP–MS took off. This work 532 ultimately led to the development of a second commercially available ICP–MS system, the SCIEX ELAN system, introduced in 1983.”
John Olesik added, “One of the challenges for the initial ICP–MS instrument developed by Houk et al. 528 was that the narrow (0.06 mm diameter) orifice between the ICP and the MS was easily clogged by solids deposited from the sample. The small orifice also resulted in ion sampling through a cooler boundary layer, producing what would now be considered high oxide-ion/element-ion signal ratios. This paper 532 reported the first use of Campargue-type (sampler–skimmer) interface with larger orifices (0.5 mm) that prevented orifice clogging. This interface resulted in continuum flow where ions passed through the interface without going through a cooler boundary layer, resulting in much lower oxides/elemental ion signal ratios and much higher elemental ion sensitivities.”
Simultaneous atomic emission and mass spectrometric measurements on an ICP – Lepla, Vauchan, and Horlick, 533 Spectrochim. Acta Part B, 46 (1991) 967–973
George Chan noted, “This paper 533 described an interesting and unique idea of simultaneous ICP–AES and ICP–MS measurements. An important observation was that the LaO+ MS signal was found to occur at a lower gas flow than the LaO emission signal, implying that oxide ions in ICP–MS are formed downstream of the plasma. Furthermore, matrix effects in simultaneous ICP–AES and ICP–MS were compared; although somewhat expected, unambiguous experimental evidence was presented to show that the interferences are of different nature in ICP–AES and ICP–MS. 533 Regrettably, no single combination of operating conditions can be optimized for both measurement modes so that a compromise is needed.”
High-resolution double-focusing sector-field MS for ICP – (a) Bradshaw, Hall, and Sanderson, 534 J. Anal. At. Spectrom., 4 (1989) 801–803; (b) Feldmann, Tittes, Jakubowski, Stuewer, and Giessmann, 535 J. Anal. At. Spectrom., 9 (1994) 1007–1014; (c) Moens, Vanhaecke, Riondato, and Dams, 536 J. Anal. At. Spectrom., 10 (1995) 569–574
John Olesik recommended the first article 534 and remarked, “This paper 534 reported the first ICP–sector field MS; it is important for high mass-spectral resolution to resolve many spectral overlaps with mass resolving power up to 10 000 or high sensitivity at mass resolving power of 300.”
José-Luis Todolí commented on the first two articles534,535 in this cluster, and noted, “The first article is a communication 534 and describes the first ICP–sector field MS instrument on the market. It contained a double-focusing magnetic sector field mass spectrometer. In the second article, 535 a high resolution prototype has been presented and evaluated. 535 A double-focusing magnetic field analyzer is purposely employed.”
Martín Resano added that “the prototype ICP–sector field MS as reported in reference 535 became commercially available.”
Frank Vanhaecke shared his view on the second article 535 and noted, “It is the first report on single-collector sector field MS for ICP 535 (often termed high-resolution ICP–MS). By using a double-focusing sector field mass spectrometer of reverse Nier–Johnson geometry instead of a quadrupole filter for mass analysis, spectral interferences hampering accurate determination of trace elements can be resolved by measuring at a higher mass resolution.”
David Koppenaal further noted, “In the early-mid 1990s, ICP–MS practitioners began investigating alternative forms of MS analyzers (up to this point quadrupole ICP–MS was exclusively available). A number of different types of MS systems were developed and demonstrated. These papers,534,535 together with those employing a mass spectrometer of Mattauch–Herzog geometry,537,538 describe the first generation of magnetic sector-field MS systems for ICP.”
As mentioned by Martín Resano, the third article 536 “further highlighted the benefits of the new sector field-MS instrumentation for ICP discussing the figures of merit for a number of elements of different m/z values, including aspects such as linearity, sensitivity (at different mass resolutions), limits of detection, memory, and matrix effects. The work also showed, as an example, the potential of the technique to determine Pt in grass samples at very challenging levels (700 pg g−1). After this series of papers, it was obvious that ICP–sector field MS was becoming a key technique for ultratrace elemental analysis.”
Mattauch–Herzog mass spectrometer for ICP – (a) Cromwell and Arrowsmith, 537 J. Am. Soc. Mass Spectrom., 7 (1996) 458–466; (b) Burgoyne, Hieftje, and Hites, 538 J. Am. Soc. Mass Spectrom., 8 (1997) 307–318
David Koppenaal recommended these two articles537,538 and noted that, in addition to the double-focusing sector-field mass spectrometers534,535 noted above, “they describe the first generation of magnetic sector-field MS systems for ICP.”
According to Kenneth Marcus, “This paper by Burgoyne, Hieftje and Hites 538 on array-detector for MS, together with one of TOF-MS 539 and another one on distance-of-flight MS, 261 in which each introduces totally new MS platforms at the time of their publication, illustrate something more important; the concept of ‘all the signal, all the time’. This was a hallmark of the efforts of the Hieftje group's contributions in ICP–MS instrumentation. The premise is simple, viewing a full spectrum produced at a single moment in time yields higher throughput and higher analytical precision. The work in each paper is described in terms of the rationale of design and the characterization of realized performance. Significantly, the two platforms on TOF 539 and array detector 538 have already been incorporated in commercial instruments.”
Simultaneous Mattauch–Herzog ICP–MS with micro-Faraday array detector – (a) Schilling, Andrade, Barnes, Sperline, Denton, Barinaga, Koppenaal, and Hieftje, 540 Anal. Chem., 79 (2007) 7662–7668; (b) Schilling, Ray, Rubinshtein, Felton, Sperline, Denton, Barinaga, Koppenaal, and Hieftje, 541 Anal. Chem., 81 (2009) 5467–5473; (c) Ardelt, Polatajko, Primm, and Reijnen, 542 Anal. Bioanal. Chem., 405 (2013) 2987–2994
This group of articles describes the development of an array detector for atomic MS at its different stages. José Broekaert, Norbert Jakubowski, and Vassili Karanassios nominated the first one. 540 As stated by José Broekaert, “Mass spectrometry using multichannel simultaneous detection of ions with different masses through the use of solid-state multipixel detectors was described. The paper 540 first describes the basis for truly simultaneous mass detection with high precision in plasma mass spectrometry.” Norbert Jakubowski added that this work 540 showed “simultaneous detection in ICP–MS by using a Mattauch–Herzog sector field instrument and detection by an electronic photo plate.”
The second article 541 contains an evaluation of the third generation of Faraday-strip array detectors, which contains 512 channels, coupled to an ICP–Mattauch–Herzog mass spectrograph. As highlighted by Martín Resano, this paper 541 is “part of a remarkable series of works from various research groups cooperating to produce a spectrometer with truly simultaneous monitoring potential, 541 which would offer significant advantages for ICP–MS, among other plasma techniques.”
Heinz Falk recommended the third article, 542 which deals with a commercialized version of a fully simultaneous ICP–Mattauch–Herzog MS, and remarked, “The availability of a simultaneous multielement ICP–MS 542 initiated a remarkable progress compared to the sequential ICP–MS instruments based on a quadrupole MS. With such a simultaneous ICP–MS, very high precision of isotope-ratio measurement down to 0.05% relative could be achieved.”
Time-of-flight (TOF) mass analyzer for ICP – (a) Myers and Hieftje, 543 Microchem. J., 48 (1993) 259–277; (b) Myers, Li, Yang, and Hieftje, 539 J. Am. Soc. Mass Spectrom., 5 (1994) 1008–1016; (c) Myers, Li, Mahoney, and Hieftje, 544 J. Am. Soc. Mass Spectrom., 6 (1995) 411–420; (d) Mahoney, Ray, Li, and Hieftje, 545 Anal. Chem., 71 (1999) 1378–1383; (e) Leach and Hieftje, 546 Anal. Chem., 73 (2001) 2959–2967; (f) Tanner and Günther, 547 Anal. Bioanal. Chem., 391 (2008) 1211–1220; (g) Borovinskaya, Hattendorf, Tanner, Gschwind, and Günther, 548 J. Anal. At. Spectrom., 28 (2013) 226–233
The first paper 543 in this cluster discussed preliminary design considerations and characteristics of an ICP–TOF-MS. As noted by Detlef Günther, “All developments in ICP–MS were focused on fast sequential measurements. The introduction and consideration of combining ICP–MS with time of flight 543 opened the strategy for fast quasi-simultaneous detection. One of the most promising developments in more recent times has been the cytometry-TOF developed for fast tissue imaging (please refer to reference 277 in this compilation).”
Frank Vanhaecke shared a similar view and noted, “It is the first paper 543 reporting on the coupling of an ICP ion source with a TOF analyzer as mass spectrometer. While for many years, ICP–TOF-MS was no commercial success, novel application types, like single-particle ICP–MS, single-cell ICP–MS and high-speed multi-element LA–ICP–MS bio-imaging, now strongly benefit from the capabilities for quasi-simultaneous multi-element determination at very high repetition rate.”
José-Luis Todolí offered a slightly different viewpoint and said, “An ICP is coupled to a TOF-MS 543 for the first time. According to the findings, the right-angle geometry appears to be the most appropriate from the point of view of sensitivity (low in the present study) and spectral resolution. This paper generated more research on this subject and subsequently, about 50 studies on TOF instruments were published by Hieftje.539,544,549”
John Olesik noted, “The first ICP–TOF-MS was described in 1994 539 but commercial success was limited until recently.” Norbert Jakubowski recommended this article 544 and highlighted that it shows “simultaneous detection in ICP–MS by use of a time-of-flight mass analyzer.” Zhanxia Zhang shared a similar view on two papers by Myers et al.539,544
José-Luis Todolí continued the discussion by referring to the article by Mahoney et al. 545 on the capability of TOF-MS for measurements of transient signals with ETV sample introduction as an example and noted, “The high data-acquisition rate exhibited by the TOF instrument makes it perfectly fitted to perform multielement analysis when transient signals are involved, as in the case of ETV sample introduction. This spectrometer 545 takes full advantage of the capabilities of ETV as a means for the removal of spectral interferences through careful control on the thermal program. An additional coupling involving ICP–TOF-MS is also discussed in the field of single-shot laser ablation. 546 ”
Ralph Sturgeon shared a similar view and added, “The first coupling of an ETV to an inductively coupled plasma time-of-flight mass spectrometer (ICP–TOF-MS) is described. 545 Figures of merit for simultaneous determination of 34 elements are presented as well as examples of enhanced isotope-ratio precision and a demonstration of elimination of isobaric overlaps among the isotopes of Cd, Sn and In, resolved by exploiting differences in their vaporization characteristics (effective R > 100 000 achieved).”
The article on the development of a new ICP–TOF-MS with spectra readout at 30 μs time resolution 547 was recommended by Norbert Jakubowski as it demonstrated “simultaneous detection in ICP–MS with fast transient signals generated by in-torch laser ablation with fast wash out using an ICP–TOF-MS.” 547 John Olesik shared a similar view and said, “A new ICP–TOF-MS 547 capable of continuously storing data with 30 µs time resolution has greatly enhanced measurement of fast transient signals including individual nanoparticles, individual cells and elemental imaging.”
José-Luis Todolí continued the discussion on a new ICP–TOF-MS 548 capable of providing temporally resolved, multi-element detection of short signals generated by single particles and droplets and opined, “The new ICP–TOF-MS prototype 548 is able to detect transient signals on the milli- to micro-second scale. The most important advantages of the system are linked to the virtually simultaneous detection of multiple isotopes on this time scale. As a result, the instrument can be applied to the determination of the composition of multicomponent nanoparticles as well as spatially resolved multielement analysis (imaging) through laser ablation.”
Time-of-flight (TOF) mass analyzer for ICP (review) – (a) Mahoney, Ray, and Hieftje, 550 Appl. Spectrosc., 51 (1997) 16A–28A; (b) Ray and Hieftje, 551 J. Anal. At. Spectrom., 16 (2001) 1206–1216
Norbert Jakubowski suggested the Appl. Spectrosc. article and noted, “This focal point article 550 on simultaneous detection in ICP–MS by use of a time-of-flight mass analyzer is unique because it summarizes all fundamental aspects of ICP–TOF-MS together with all analytical figures of merit of this new technology which are otherwise fragmented in different research papers. It demonstrates how improvements in isotope precision and accuracy can be achieved by integrated multiple measurements and how time resolution can be used for multielement measurements in transient signals in ETV and single laser-shot applications and even to discriminate isobaric interferences.”
Stanley Crouch recommended the review published in J. Anal At. Spectrom. 551 and remarked, “Time-of-flight mass analyzers for ICP–MS are discussed. 551 The design concepts and operating principles of different TOF-MS geometries are compared.”
Ion-trap mass spectrometer for ICP – (a) Barinaga, Koppenaal, and McLuckey, 552 Rapid Commun. Mass Spectrom., 8 (1994) 71–76; (b) Koppenaal, Barinaga, and Smith, 553 J. Anal. At. Spectrom., 9 (1994) 1053–1058
According to David Koppenaal, “In the mid-1990s, ion trap552,553 and TOF-MS systems (as discussed elsewhere539,549) were experimented with, providing ICP–MS practitioners with possibilities for higher resolution, reaction cell, and fast transient signal analysis possibilities.” Steven Ray recommended the first paper in this cluster 552 because “ion reaction chemistry is exploited as an extremely selective and efficient means of isobar resolution, which subsequently led to prototypical ion reaction cells used to overcome polyatomic interferences in ICP–MS.” John Olesik added his view on the second article 553 in this set and summarized its importance as “the first report on charge transfer reaction of H2 with Ar+ (to measure 40Ca) and with other plasma ions (also reported results using O2). 553 ”
Distance-of-flight mass spectrometer for ICP – Gundlach-Graham, Dennis, Ray, Enke, Barinaga, Koppenaal, and Hieftje, 554 J. Anal. At. Spectrom., 28 (2013) 1385–1395
As discussed by José-Luis Todolí, “Details of the main components and spatial arrangement of an inductively coupled plasma–distance-of-flight mass spectrometer are given in this study. 554 The capabilities of this combination are examined in terms of resolution, mass range, limits of detection, dynamic range, and isotope-ratio precision and it is concluded that this low-cost design is a promising device.”
Fundamentals on gas dynamics and ion extraction processes
Gas dynamics of the ICP–MS interface – (a) Olivares and Houk, 555 Anal. Chem., 57 (1985) 2674–2679; (b) Douglas and French, 556 Spectrochim. Acta Part B, 41 (1986) 197–204; (c) Douglas and French, 557 J. Anal. At. Spectrom., 3 (1988) 743–747
These three articles555–557 are recommended by David Koppenaal with annotations, “A fundamental understanding of the ICP–MS interface and sampling system was essential in the early years of ICP–MS. Several landmark papers covering these fundamentals were published and helped to improve ICP–MS interface designs, mainly improving signal intensity (by orders of magnitude) and improving precision. These papers555–557 laid the foundation for the improved understanding of the ICP–MS interface (which has changed little since that time).”
Paul Farnsworth suggested the Douglas and French 1988 article because, “This paper 557 distilled large volumes of information from the literature on supersonic jets, selected those features that were applicable to ICP–MS, and presented them in a form that was understandable to a practicing spectroscopist. Although subsequent work by Ross Spencer and me and other research groups has refined some of the details of ICP–MS interface behavior, the essential features presented in this paper have held up over time. I know that the paper 557 was an invaluable resource to me and other academicians, and I suspect that it helped instrument manufacturers as well.”
Likewise, Annemie Bogaerts commented, “This article 557 provided the first theoretical study directly relevant for ICP–MS. The authors 557 developed an approximate model of ideal gas flow through the sampling cone of an ICP, i.e., the so-called ‘hemispherical-sink model’, assuming that the gas flow toward the nozzle behaves like a flow in a duct.”
Visual observation of shock waves in an ICP–MS expansion stage – (a) Lim, Houk, Edelson, and Carney, 558 J. Anal. At. Spectrom., 4 (1989) 365–370; (b) Gray, 559 J. Anal. At. Spectrom., 4 (1989) 371–373
According to Carsten Engelhard, “One key point of the fundamental study by Gray 559 is that it allows one to see the shock wave dimensions in photographs of the ICP–MS expansion stage behind the extraction aperture. The photographs of the shock wave pattern illustrate the influence of operating pressure and skimmer and nicely complement a study by Lim et al. 558 on the supersonic jet formed in the expansion stage.”
Fundamental aspects of ion extraction in ICP mass spectrometry – (a) Niu and Houk, 560 Spectrochim. Acta Part B, 49 (1994) 1283–1303; (b) Niu and Houk, 561 Spectrochim. Acta Part B, 51 (1996) 779–815
The first paper 560 in this group is a primary-research article on spatially resolved electron number density and temperature of the ion-extraction process determined by Langmuir probe; the second paper 561 is a review on various aspects of the ion-extraction process in ICP–MS.
Paul Farnsworth suggested the first article 560 with the remark, “In an elegant piece of experimental work, Niu and Houk identified non-ideal behavior in the skimming process in the vacuum interface of an ICP–MS. This paper 560 served as a launching point for our subsequent spectroscopic efforts to understand the nature of the shock structure forming on the tip of the skimmer cone and the effects of skimmer design on shock formation.”
The second article 561 was recommended by José Costa-Fernández, José-Luis Todolí, and Frank Vanhaecke. As noted by José Costa-Fernández, “This review 561 collects the fundamentals of the ion-extraction process in ICP–MS including aspects such as ion production in the ICP, origins of polyatomic ions, causes of and remedies for the secondary discharge, properties of the supersonic jet and of the beam leaving the skimmer, space-charge effects, and matrix interferences. To recognize and understand those items is a must for researchers working with ICP developments.”
Frank Vanhaecke commented that it is “a very useful and comprehensive review paper 561 providing ICP–MS users with insight into various processes affecting ICP–MS performance. It brings together fundamental knowledge on the ion-extraction process in ICP–MS, originally reported in many research papers in an accessible way, thus also providing less specialized readers with some insight into issues like the occurrence of doubly charged and polyatomic ions, processes in the interface, space-charge effects, and spectral and non-spectral interferences.”
José-Luis Todolí added, “This contribution 561 is a review that shows, in an extremely comprehensive way, all the processes undertaken by ions when they migrate from the plasma to the mass spectrometer. Among the concepts developed in this article, one can find: space charge effects, which depend on the ion-optic lens configuration; flow through the skimmer; three-cone aperture interface (currently used in commercial systems); and matrix effects. Further to these studies, Chambers et al.562,563 published excellent papers explaining in more detail the processes taking place during the ion transfer to the mass spectrometer. Furthermore, the extraction processes are studied for three general spectrometer configurations. This review has been followed by a more recent one written by Farnsworth and Spencer. 564 ”
Effect of sampling orifice on analyte transport and analytical performance – (a) Günther, Longerich, Jackson, and Forsythe, 565 Fresenius J. Anal. Chem., 355 (1996) 771–773; (b) Macedone, Gammon, and Farnsworth, 566 Spectrochim. Acta Part B, 56 (2001) 1687–1695
These two articles565,566 were recommended by Annemie Bogaerts. The first paper 565 reported the experimental effect of sampler orifice diameter on backgrounds, sensitivities, and limits of detection of a dry ICP–MS, whereas the second paper 566 focused on factors affecting analyte transport through the sampling orifice. As summarized by Annemie Bogaerts, “Günther et al. 565 explained that a smaller sampler cone orifice (0.5 mm instead of 0.7 mm) could reduce the background intensity by a factor of 10 (in the high mass range) and a factor of 100 (in the low mass range), without affecting the sensitivity, thus improving the limits of detection. Based on laser-excited ionic fluorescence, Macedone and co-workers 566 studied the impact of sample composition, operating conditions (i.e., power, nebulizer flow rate) and coil shielding on analyte ion transport efficiency through the sampling orifice of an ICP–MS. The above parameters had a big effect on the ion-transport efficiency, and the changes were attributed to changes in the potential measured 1 mm upstream from the sampling orifice.”
Characterization of the supersonic expansion in the first vacuum interface of an ICP–MS – (a) Radicic, Olsen, Nielson, Macedone, and Farnsworth, 567 Spectrochim. Acta Part B, 61 (2006) 686–695; (b) Macedone, and Farnsworth, 568 Spectrochim. Acta Part B, 61 (2006) 1031–1038; (c) Mills, Macedone, and Farnsworth, 569 Spectrochim. Acta Part B, 61 (2006) 1039–1049
Annemie Bogaerts concisely summarized the key point of this set of three papers567–569 as “studies on the supersonic expansion into the first vacuum stage of an ICP–MS and on the imaging of the plasma composition near the sampling cone.” As explained in more detail by Paul Farnsworth, “As we studied ion beams in the ICP–MS vacuum interface with pulsed lasers, it became clear that there were Doppler shifts large enough that they could be used to characterize ion and atom velocity distributions in addition to the density measurements that were our original goal. Diode lasers were ideal for the task, and this paper 567 reports their use in a detailed study of the expansion of neutral argon in the first vacuum stage of an ICP–MS. The analytical performance of an ICP–MS depends on a complex interplay of operating parameters. Two of the most important of these parameters are nebulizer gas flow rate and applied radiofrequency power. The cross-sectional views of the plasma presented in this paper 569 illustrate clearly how nebulizer gas flow rate and applied RF power affect delivery of the analyte to the vacuum interface of an ICP–MS.”
Ion density inside skimmer cone and in the second vacuum stage of an ICP–MS – (a) Duersch, Chen, Ciocan, and Farnsworth, 570 Spectrochim. Acta Part B, 53 (1998) 569–579; (b) Duersch and Farnsworth, 571 Spectrochim. Acta Part B, 54 (1999) 545–555
Paul Farnsworth recounted, “Matrix effects have always been a challenge in ICP mass spectrometry, driving an intense interest in their origins. Among possible causes of matrix effects, the influence of space charge on ion beam formation downstream from the skimmer cone in an ICP–MS has been particularly difficult to characterize either experimentally or theoretically. Three investigators, Sam Houk, Gary Hieftje, and I all attempted to characterize the ion beam by placing a target in the beam downstream from the skimmer cone and analyzing deposits formed on the target. We were particularly dissatisfied with our own results, so we developed optical probes that allowed us to characterize the beam with laser-induced fluorescence. This paper 570 is the first of a series in which laser-induced fluorescence was used to characterize the ion beam produced in an ICP–MS.”
Carsten Engelhard added, “While several research groups were interested to investigate ion-transfer efficiency, ion-beam shape, and space-charge effects in ICP–MS using indirect methods such as ion deposition early on, a direct approach based on laser-induced fluorescence was reported by Farnsworth's group. 570 They developed an apparatus that could be used to characterize the ion beam inside the skimmer cone of an ICP–MS by laser excited atomic and ionic fluorescence. 570 In 1999, one year after their first publication using optical probes, they described radial maps of ion density for Ba ion, Sc ion, and Pb atom 8 mm downstream from the tip of the skimmer cone. 571 Effects of added matrix (Mg and Pb) on the radial profiles of analyte ions were reported. Overall, their contribution helped us to better understand non-spectroscopic matrix effects in the first and second vacuum stage of an ICP–MS.”
Effect of skimmer cone design on shock formation and ion-transmission efficiency – Taylor and Farnsworth, 572 Spectrochim. Acta Part B, 69 (2012) 2–8
As discussed by Annemie Bogaerts, “In this paper, 572 five commercial skimmer cone designs were evaluated by laser-induced fluorescence, to study shock formation and the ratio of analyte density downstream versus upstream from the skimmer tip, as a measure for the ion-transmission efficiency in ICP–MS. 572 A skimmer with cylindrical throat produced the strongest shock, while a skimmer with large diameter and conical throat gave the weakest shock. The highest transmission efficiency was found for the highest skimmer orifice diameter. Comparison was made between Ba atoms and ions (to assess Coulombic effects, which were found to be small) and between Cu and Ba ions.”
Effect of mass spectrometric sampling interface on the fundamental parameters of an ICP – (a) Gamez, Lehn, Huang, and Hieftje, 573 Spectrochim. Acta Part B, 62 (2007) 357–369; (b) Gamez, Lehn, Huang, and Hieftje, 574 Spectrochim. Acta Part B, 62 (2007) 370–377
This pair of papers573,574 was recommended by Annemie Bogaerts and Carsten Engelhard. As remarked by Carsten Engelhard, “Gamez et al.573,574 reported the first study using Thomson and Rayleigh scattering to study the effect of a mass spectrometric sampling interface on fundamental ICP parameters (electron number density, electron temperature, gas-kinetic temperature, calcium atom and ion number densities) and at a variety of different operating conditions (RF power, pressure, central gas flow, and sampling position).”
Annemie Bogaerts shared a similar view and noted, “These two papers573,574 on Thomson and Rayleigh scattering measurements in the ICP described the study of the effect of the mass spectrometer sampling interface on the ICP behavior. They reported that the perturbation in the radial distribution of the electron number density, as well as the drop in gas temperature due to the MS interface, varies with applied RF power, central gas flow rate, and sampling depth.”
Modeling the effect of a mass spectrometer interface on ICP characteristics – Aghaei, Lindner, and Bogaerts, 575 J. Anal. At. Spectrom., 27 (2012) 604–610
As noted by Annemie Bogaerts, this work 575 is an “extension of the previous model by Lindner and Bogaerts, 509 connecting the ICP torch to a MS sampler cone, considering the large pressure drop from upstream to downstream (i.e., from 1 atm to 1 torr). This model 575 showed for the first time how the plasma characteristics (e.g., flow path lines, temperature, and electron number density) are affected by a cool, grounded sampler, and by the sudden pressure drop behind it.”
Modeling and experimental comparison of gas flow upstream from the sampling cone in ICP–MS – (a) Spencer, Krogel, Palmer, Payne, Sampson, Somers, and Woods, 576 Spectrochim. Acta Part B, 64 (2009) 215–221; (b) Spencer, Taylor, and Farnsworth, 577 Spectrochim. Acta Part B, 64 (2009) 921–924
Annemie Bogaerts recommended this pair of articles because they contained the “first description of the effect of the sampler cone in ICP–MS by direct Monte Carlo simulations to model the flow of neutral argon gas through the first vacuum stage of the ICP–MS. The authors576,577 could obtain plasma velocity data in the region a few millimeters upstream from the sampler, in reasonable agreement with experiments. There are two other papers which focused on laser induced fluorescence (LIF) experiments for the ion and atom behavior in the first stage of the ICP–MS vacuum interface from the same research group.578,579”
Inductively Coupled Plasma–Mass Spectrometry (ICP–MS) signal behavior and matrix effects
Dependence of analyte signals on operating parameters – (a) Horlick, Tan, Vaughan, and Rose, 580 Spectrochim. Acta Part B, 40 (1985) 1555–1572; (b) Vaughan, Horlick, and Tan, 581 J. Anal. At. Spectrom., 2 (1987) 765–772
Both articles580,581 focus on the effect of plasma operating parameters on analyte signals in ICP–MS. Norbert Jakubowski, Kenneth Marcus, Frank Vanhaecke, and Zhanxia Zhang recommended the first article. 580 As noted by Frank Vanhaecke, “This paper contains a description of the effect of various instrument settings on the signal intensity visualized using a large collection of graphs. At the time, a graph plotting the signal as a function of the nebulizer pressure or nebulizer gas flow rate was sometimes referred to as a ‘Mount Horlick’. 580 ” Zhanxia Zhang shared a similar view.
Kenneth Marcus added, “This is truly a classic paper. 580 Soon after the highly touted introduction of commercial ICP–MS instruments, for which there was much anticipation of great freedom from matrix/operation effects versus ICP–AES, this effort 580 brought the field back to earth. Detailed parametric studies revealed a complex set of relationships between nebulizer/auxiliary gas flow rates, forward power, and ion sampling depth. The resultant relationships were manifest in the so-called ‘Mount Horlick’ responses. These plots revealed both commonalities and disparities in response among atomic, multiple-charged, and oxides of metal analytes. Interestingly, the conclusion suggests that some form of MS–MS may be in order; more than a decade before its commercial advent.”
Norbert Jakubowski summarized the key point of both papers580,581 as “a comprehensive study of how operational parameters affect the analyte sensitivity in ICP–MS, which is essential for optimization. It was demonstrated that highest sensitivity could be achieved for single element analysis only, but compromise conditions are needed for multielement analysis because plasma power, nebulizer flow rates, sampling depth, and lens voltage settings can cause element-specific discrimination.”
Behavior of matrix interferences in ICP–MS – Tan and Horlick, 582 J. Anal. At. Spectrom., 2 (1987) 745–763
This article, 582 which describes the now well-known mountain-like behavior of matrix interference in ICP–MS, is recommended by multiple scientists including: Paul Farnsworth, Gary Hieftje, Norbert Jakubowski, David Koppenaal, John Olesik, Steven Ray, and José-Luis Todolí.
As noted by Steven Ray, this paper 582 provides “an excellent explanation of the base causes of non-spectroscopic and spectroscopic interferences observed in ICP–MS. A broad range of parametric experiments are combined with coherent analysis to present a well-considered explanation of the root cause of both interferences. Prescient identification of the skimmer as a region of influence for many effects was evident. The mechanisms responsible for matrix effects as covered in Tan and Horlick 582 can be coupled with a simple-to-read table of common polyatomic interferences for the student, such as that provided in the literature.583,584”
John Olesik added, “This article 582 is the most comprehensive investigation of matrix effects in ICP–MS ever done using a first-generation commercial instrument; matrix effects depend on the concentration of matrix ions (not matrix/analyte ratio; not atoms), are more severe for light analyte ions and heavy matrix ions, depend on power and nebulizer gas flow rate; lead to identification of space charge repulsion after ions were sampled from the ICP as the main cause.”
Comments from Paul Farnsworth are: “This detailed study 582 presented a clear-eyed view of some of the challenges that matrix effects posed for the emerging field of ICP–MS. Some of the early studies of both ICP–AES and ICP–MS tended to oversell the capabilities while under-emphasizing the limitations. Horlick's work was notable for its objective assessment of both strengths and weaknesses of the techniques.”
David Koppenaal noted, “In this publication, 582 the research group of Gary Horlick at University of Alberta provided a comprehensive examination of ICP–MS matrix interference effects, showing many plasma operating condition effects (these were termed matrix ‘mountain’ effects). This paper 582 served to fully document the severity of such effects, and had, to some, the impact of tarnishing the luster that ICP–MS had garnered to that point. The result was that a greater appreciation was gained for the frequency and severity of interferences in ICP–MS. It certainly led me down a path of interference reduction research and development pursuits.”
José-Luis Todolí shared a similar view and remarked, “Key aspects related to elemental matrix effects in ICP–MS are discussed in this paper. 582 Currently widely accepted and claimed trends are presented such as: the complexity of the experimentally observed trends; the influence of operating conditions on this kind of phenomenon; suppressions–enhancements in the analytical signal as a function of the mass of the interferent; the influence of the matrix ionization potential; the effect of the absolute concentration. Finally, interesting comments on modification in the ion beam dimensions are included.”
Gary Hieftje summarized, “Just as in his 1981 paper that clarified the origins of matrix effects in ICP–AES, 443 Gary Horlick, along with his grad student Samantha Tan, takes a clear-eyed, common-sense approach to characterizing matrix effects in ICP–MS and revealed what is really going on. 582 ”
“Zone model” to explain signal behavior and matrix interferences in ICP–MS – Vanhaecke, Dams, and Vandecasteele, 585 J. Anal. At. Spectrom., 8 (1993) 433–438
This “zone model” paper for ICP–MS 585 is recommended by several scientists, including José-Luis Todolí, Martín Resano, and Frank Vanhaecke. As summarized by Martín Resano, this paper describes “an intuitive model 585 that explains the variation of ion signals with mass number, operating parameters, and matrix composition in ICP–MS.” José-Luis Todolí noted, “A simplified model 585 that is based on the idea that, for a given element, there is a plasma zone where the ionic density maximum is developed. This model has been useful in trying to explain the optimum plasma area in terms of sensitivity. This zone is correlated with both the operating conditions and the sample matrix. Negative as well as positive non-spectral interferences can be explained by applying the zone model.”
Frank Vanhaecke recounted, “This paper 585 had the aim to provide the non-specialist with a basic understanding of how tuning of instrument settings and the introduction of sample matrix affects the signal intensities in ICP–MS. There is an anecdote on this work: one reviewer had really assessed my manuscript in great detail and provided both critical remarks and suggestions for further improvement. This reviewer even provided a figure that represented the diffusion of atoms/ions out of the central channel better than the original figure that I had come up with. Later on (during the 1993 Winter Conference on Plasma Spectrochemistry), that referee revealed himself as Scott Tanner!”
Influence of water vapor loading on ICP–MS – Zhu and Browner, 450 J. Anal. At. Spectrom., 3 (1988) 781–789
Recommended by Kenneth Marcus, “In a great complement to the Mount-Horlick effort, this work 450 used fine control of the plasma solvent (water) loading through heating/cooling of the spray chamber to study the production of metal oxide/hydroxide species. Uniquely, both of the commercial ICP–MS instruments of the time (VG PlasmaQuad and SCIEX Elan) were used in parallel experiments; yielding quite different responses. MS responses were correlated with electron number density and excitation temperature measurements. The results indicated that solvent loading was a primary challenge in ICP–MS performance.”
ICP–MS signal fluctuations due to individual aerosol droplets and vaporizing particles – Hobbs and Olesik, 586 Anal. Chem., 64 (1992) 274–283
Carsten Engelhard underscores the importance of fundamental studies for the advancement of ICP–MS technology and commented, “This paper by Hobbs and Olesik 586 helps us to understand the influence of single vaporizing particles and incompletely vaporized droplets on signals in ICP–MS. The authors 586 sampled the detector's analog signal and were able to record temporal profiles of individual transients with a time resolution of tens of microseconds. While the ICP–MS user typically uses millisecond dwell times and observes relatively stable analyte signals, this study makes it quite clear that signal fluctuations of analyte (Sr+, Ga+, As+), solvent (O+, OH+, H2O+, H3O+), and plasma gas (Ar+) species in ICP–MS are readily observed on a tens of microseconds time scale and are important to consider not only during instrument tuning but also during routine analyses.”
Ion kinetic energies in ICP–MS – Fulford and Douglas, 587 Appl. Spectrosc., 40 (1986) 971–974
As noted by Ralph Sturgeon, “Ion kinetic energies in an ICP–MS designed to eliminate secondary discharges to the interface were measured with the use of a retarding potential on the analyzing quadrupole 587 and were found to differ from previously reported values, showing an expected increase with the mass of the ion, consistent with molecular beam sampling. Such findings were the basis for future beneficial use of center-tapped grounding of load coils as well as use of guard electrodes on ICP–sector field MS instruments. A similar experimental arrangement was later used (by Scott Tanner) for monitoring metal-oxide molecular ions to implicate local cooling around evaporating analyte during its transit through the plasma.”
Space charge in ICP–MS – Tanner, 588 Spectrochim. Acta Part B, 47 (1992) 809–823
Norbert Jakubowski summarized the key point of this article 588 as “how space-charge effects, which in turn direct matrix effects, affect analytical signals in ICP–MS.” John Olesik expanded the discussion and explained, “This work 588 provided a theoretical basis for mass dependence of matrix effects in ICP–MS. This article, together with the Tan and Horlick experimental results, 582 have led to acceptance of space charge as the source of mass-dependent matrix effects ever since and selection of internal standards to correct for matrix effects.”
Space-charge effects investigated with single droplet introduction – Stewart and Olesik, 589 J. Am. Soc. Mass Spectrom., 10 (1999) 159–174
As discussed by José-Luis Todolí, “Axial and radial space-charge effects are studied in a single ionic cloud, 589 the latter being responsible for losses in sensitivity. Bimodal analyte ion distributions are even observed and discussions about the localization of these effects are made, concluding that these phenomena take place in the charge separation zone where the charge density is high.”
Matrix effects with noticeably reduced analyte mass dependence – Olesik and Jiao, 590 J. Anal. At. Spectrom., 32 (2017) 951–966
As explained by John Olesik, “This paper 590 reported matrix effects that are not strongly analyte-ion mass-dependent, so space-charge repulsion may not be the complete explanation of mass-dependent matrix effects in ICP–MS (although matrix effects are more severe for heavy matrix ions); similar results have now been obtained on other ICP–MS instruments including sector-field mass spectrometer. 591 ”
Other fundamental characterizations
Noise characteristics of an ICP–MS – Furuta, Monnig, Yang, and Hieftje, 592 Spectrochim. Acta Part B, 44 (1989) 649–656
As noted by José Broekaert, “Noise amplitude spectra in ICP–MS are compared with those in ICP–AES and are shown to display mostly white noise character. 592 The noise frequency band in the 200–350 Hz range, which is known from OES, changes in frequency with the sampling depth in ICP–MS. The paper 592 is a prime example of the feasibilities of noise power spectra to study the noise in spectrochemical sources.”
Mixed-gas ICP–MS – Lam and Horlick, 593 Spectrochim. Acta Part B, 45 (1990) 1313–1325
Recommended by José-Luis Todolí, “The use of nitrogen in an argon ICP plasma is evaluated for ICP–MS. 593 Results discussed are related with the effect of the addition of this gas in terms of optimum operating conditions, elemental ionization efficiency, oxide formation, and background. The improved performance induced by the addition of gases other than argon was the subject of numerous studies. Nowadays, the addition of nitrogen is still recommended in situations in which the amount of water delivered to the plasma is too low.”
Helium ICP–MS – Montaser, Chan, and Koppenaal, 594 Anal. Chem., 59 (1987) 1240–1242
As explained by Kenneth Marcus, “To this point, only Ar ICP sources had been applied for ICP–MS. Montaser had previously proposed the use of He as the support gas for ICP–AES, with the intended product being a kinetically hotter plasma with higher excitation/ionization temperatures. The first challenge to the coupling to a commercial ICP–MS was the fact that the SCIEX Elan used He-cryopumps to maintain the high vacuum, so the VG PlasmaQuad had to be used. The He ICP 594 operated at lower powers and flow rates (<900 W and 8 L min−1) than the Ar plasma. By virtue of the higher ionization energies, the report 594 focused exclusively on halogen and sulfur analytes, without mention of metals.”
Gary Hieftje recalled, “In conference presentations involving his work on helium ICP–MS, Akbar Montaser complained about a ‘raging’ discharge at the sampling (first) orifice, leading to rapid erosion of the sampling cone. This candid statement might have lowered interest in the He ICP, but serves as a model of openness that other scientists should consider emulating.”
David Koppenaal added, “that later developments (coil designs, coil screens, etc.) resulted in a less severe pinch discharge that was kinder to sampling orifices and provided improved analytical performance.”
High-speed photographic study of plasma fluctuations and intact aerosol particles or droplets in ICP–MS – Winge, Crain, and Houk, 595 J. Anal. At. Spectrom., 6 (1991) 601–604
As summarized by Annemie Bogaerts, “This paper 595 describes the study of plasma fluctuations and the trajectory and diffusion of analytes throughout the ICP and illustrates the presence of recirculation by high-speed photography of plasma fluctuations. 595 The frequency of the fluctuations was lower upon larger separation between torch and sampling cone. In addition, vapor clouds around the aerosol droplets were observed with use of a concentric nebulizer.”
Isobaric interference and means to overcome it
This section covers the most commonly used approaches for reducing isobaric interference (spectral overlaps) in atomic MS. We begin with methods that exploit collisions and reactions with a fill gas in a controlled-pressure cell. A note from David Koppenaal helps to clarify the situation and to shed light on commonly used and misused terms: “The devices typically used are collectively referred to as collision/reaction cells. These can be ion traps (3-D or Paul-type traps or FT-ICR-MS type cells) or multipole (quadrupole, hexapole, octopole, even decapole) cells. Gas-phase collisions can be used to dissociate some polyatomic interferences, but this is typically an inefficient process. Collisional discrimination against polyatomic ions owing to larger cross sections for these ions versus atomic ions can be very effective – using retarding potentials to attenuate/discriminate against polyatomic ions is known in the field as kinetic energy discrimination. Reaction cells use added gaseous reagents to chemically react and reduce/eliminate polyatomic interferences, or in some cases react with the analyte ions through atom-addition reactions to form product ions that are mass-separated from polyatomic ions. There are two primary types of commercial reaction-cell instruments: those that use hexapole/octopole ion-guide reaction cells and those that use a quadrupole reaction cell. The former instruments tend to use simple reagent gases that have minimal side reactions and more efficient ion guides to transfer ions to the analyzer quadrupole. The quadrupole-based instrument, marketed in the late 1990s by Perkin–Elmer/SCIEX, was named the Dynamic Reaction Cell™ (DRC™). This instrument can utilize more complex reagent gases and is coupled with specially applied quadrupole bandpass filtering to allow desired reactions while also eliminating undesired side-reaction products from the reaction cell. Both approaches have alternately been referred to as chemical resolution techniques. In the following sections, generic use of the dynamic collision/reaction cell term will appear uncapitalized. When specific mention or reference to the Perkin–Elmer/SCIEX ICP–MS instrument is made, the capitalized/trademarked DRC™ notation will be used. The reader can thus easily discern what approach and instrument type is being referenced/discussed. Note that the Perkin–Elmer/SCIEX DRC™ instrument is no longer in production today, but many such instruments are still in use.”
Attenuation of polyatomic ion interferences by gas-phase collisions – Rowan and Houk, 596 Appl. Spectrosc., 43 (1989) 976–980
This article describes the first use of a collision cell to reduce isobaric interference from polyatomic molecular ions in ICP–MS and was recommended by multiple scientists including José Costa-Fernández, David Koppenaal, Norbert Jakubowski, Kenneth Marcus, John Olesik, José-Luis Todolí, and Frank Vanhaecke.
As summarized by John Olesik, it is the “first report on charge transfer ion-molecule reactions (with CH4) and kinetic energy discrimination. 596 ” Norbert Jakubowski noted, “Gas phase reaction chemistry is discussed 596 for the first time to overcome polyatomic spectral interferences in ICP–MS. However, a strong loss in sensitivity was observed by ion losses in the reaction device.”
David Koppenaal remarked, “This article, 596 along with the Douglas paper, 597 introduced the concept of removing interferences in atomic mass spectroscopy, primarily using598,599 collisional dissociation. Overall, these results showed modest improvements (only 50–400× interferent-ion reduction, coupled with 30–50% analyte signal loss), and immediate interest by the ICP–MS community was lukewarm, perhaps due to higher interest/attention on increasing sensitivity at the time. A door was cracked open, however, and significant gains were later made in interferent ion reduction and specificity with minimal analyte signal loss.”
José-Luis Todolí added, “This paper 596 describes a double quadrupole based assembly in which a gas (Xe or CH4) is added to promote collisions with polyatomic ions thus leading to a mitigation of this kind of spectral interference. In this work the capabilities of the collision/reaction cell are demonstrated. In the late 1990s, ICP–MS manufacturers made such an assembly commercially available.”
Frank Vanhaecke shared a similar view and narrated, “It is the first paper 596 describing the use of a collision/reaction cell in quadrupole-based ICP–MS as a means of overcoming spectral interferences. The use of Xe and CH4 in a hexapole-based collision/reaction cell was demonstrated to reduce the signal intensity of Ar-based polyatomic ions. It would take several years before quadrupole-based ICP–MS instruments equipped with such a collision/reaction cell would become commercially available. Nowadays, practically every unit sold is equipped with such a cell.”
José Costa-Fernández opined, “Probably, a key point justifying the introduction and success of ICP–MS in bioanalysis was the incorporation into the mass analyzers of reaction cells, offering the potential for enormous efficiency in the removal of interfering ions prior to mass analysis. This is one of the pioneers’ articles behind the idea of a DRC™. Here, a double quadrupole arrangement is evaluated to remove polyatomic ions by collisions with an added target gas. This paper 596 could be an introduction to the later developments on collision/reaction cells for ICP–MS.”
Attenuation of isobaric interferences by atom-addition ion-molecule reaction – Douglas, 597 Can. J. of Spectrosc., 34 (1989) 38–49
As noted by John Olesik, “This paper 597 is the first report on an atom-addition ion-molecule reaction to attenuate ions causing spectral overlaps. Today, such atom-addition reactions are commonly used in collision/reaction cells to shift the analyte ion to a higher mass in order to avoid a spectral overlap. This is one of the three approaches used in collision/reaction cells to greatly reduce the severity of spectral overlaps in ICP–MS; the other two are ion-molecule reactions (especially charge transfer reactions) that reduce or eliminate the ion causing the spectral overlap and kinetic energy discrimination (a purely physical process). Atom-addition reactions are often used to measure S, P, Se, and As; they are particularly commonly used with ICP–‘triple quad’ MS instruments.”
Collision/reaction cell ICP–MS (development) – (a) Eiden, Barinaga, and Koppenaal, 600 J. Anal. At. Spectrom., 11 (1996) 317–322; (b) Eiden, Barinaga, and Koppenaal, 601 J. Anal. At. Spectrom., 14 (1999) 1129–1132
According to David Koppenaal, “These two papers on collision/reaction cell ICP–MS600,601 were important in influencing the thinking and planning of the Koppenaal research group at Pacific Northwest National Laboratory, who began early studies using ICPs and various configurations of ion trap mass spectrometers.552,553 This then led to the realization that a simple Ar+−H2 reaction could be used to reduce Ar ion intensities by at least 5–6 orders of magnitude, and also result in the decrease or near-elimination of many Ar polyatomic ion interferences. The age of collision-reaction cell ICP–MS was born. The important ion trap ICP–MS papers are discussed elsewhere.552,553”
Norbert Jakubowski also shared his view on the first paper 600 in this cluster and commented, “Gas-phase reaction chemistry was discussed to overcome polyatomic spectral interferences in ICP–MS. The role of buffer gas He was discussed. This paper 600 stimulated gas phase reaction chemistry to be used to overcome spectral interferences in ICP–MS and is one of the pioneering papers for development of collision and reaction cells in ICP–MS.”
Kenneth Marcus expanded the discussion and noted, “While the double-quadrupole efforts of Houk 596 and Marcus 602 were virtually ignored, this effort 600 from the Pacific Northwest National Laboratory was clearly the major driving force for the implementation of chemical reaction cells in ICP–MS. This work 600 illustrated the incredible efficiency of H2 gas to shuttle charge from background gas species (most importantly Ar), simplifying mass spectral composition. The primary driving force of the effort was to reduce the number of background ions in their plasma source ion trap instrument, and thus increase the dynamic range. The utility of the approach as a general method was quite clear.”
Dynamic Reaction Cell™ for ICP–MS (development) – (a) Tanner and Baranov, 603 Atomic Spectroscopy, 20 (1999) 45–52; (b) Baranov and Tanner, 604 J. Anal. At. Spectrom., 14 (1999) 1133–1142; (c) Tanner and Baranov, 605 J. Am. Soc. Mass Spectrom., 10 (1999) 1083–1094; (d) Tanner, Baranov, and Vollkopf, 606 J. Anal. At. Spectrom., 15 (2000) 1261–1269
The first paper in this cluster is a tutorial-like article on the theory, design, and operation of a Dynamic Reaction Cell™ (Perkin–Elmer/SCIEX trademark) for ICP–MS whereas the remaining three articles are primary research papers. Several scientists, including Michael Blades, Norbert Jakubowski, Martín Resano, and Frank Vanhaecke recommended the Atomic Spectroscopy article. 603 As noted by Michael Blades, “It is the first paper 603 on the commercialized Dynamic Reaction Cell™ (DRC™) for eliminating molecular interferences in ICP–MS. These, along with more conventional (non-DRC™) collision/reaction cells, are now ubiquitous in ICP–MS instruments.” Martín Resano shared a similar view and added that “the review 603 shows a tutorial focus that is ideal for students and new users.” Norbert Jakubowski commented that it is a “fundamental review 603 on gas phase reaction chemistry and how it can be applied to overcome spectral interferences.”
Frank Vanhaecke provided more details and noted that it is the “first paper describing the DRC™, a quadrupole-based collision/reaction cell. 603 The presence of the quadrupole reaction cell allows the definition of a bandpass mass window for excluding unwanted ions from the ion beam based on their mass-to-charge ratio. To some extent, this instrument is a predecessor of ICP–tandem mass spectrometry, introduced in 2012.”
The set of three primary research articles604–606 was recommended by José Costa-Fernández, David Koppenaal, and Zhanxia Zhang, whereas John Olesik recommended Part II 605 and Steven Ray recommended Part III 606 of the set. José Costa-Fernández commented, “This series of three papers604–606 deals with pioneering developments on the DRC™ for ICP–MS. In addition to a detailed description of the technology of pressurized RF-driven multipole cells and the fundamentals of ion–molecule chemistry as might be applied to ICP–MS, applications are also described and evaluated.”
John Olesik noted that this article 605 is the “first report on a quadrupole reaction cell for ion-molecule reactions that also prevents undesired ion products.”
Likewise, Zhanxia Zhang commented, “The three-part article604–606 discussed in detail the design of the DRC™ reaction cell, the various types of interferences and their elimination and practical procedures for the experiments.” David Koppenaal added, “The SCIEX research group (Tanner, Bandura, Baranov)604–606 also introduced a reaction cell ICP–MS system shortly after this development.600,601 This system, the SCIEX DRC™, used more complex reagent gases but incorporated a dynamic bandpass quadrupole to remove anything but the desired analyte product ions. The important seminal research papers604–606 and a review 607 are cited here.”
Steven Ray noted, “This paper 606 shows the prototypical ion DRC™ used to overcome polyatomic interferences in ICP–MS. Based on the observations of Barinaga and Koppenaal, 552 ion reaction chemistry is exploited as an extremely selective and efficient means of isobar resolution. A new collision/reaction cell is introduced and evaluated through examples, such as the interference-free determination of trace As+ and Se+, succinctly demonstrating the utility of the approach. 606 ”
Quadrupole reaction cell for ICP–MS (operation strategies) – Olesik and Jones, 608 J. Anal. At. Spectrom., 21 (2006) 141–159
As summarized by John Olesik, “This paper 608 presents the logic to develop methods using charge transfer and atom addition ion-molecule reactions to overcome spectral overlaps in ICP–MS.” José-Luis Todolí explained, “A flow chart is given to face the problems caused by polyatomic interferences in ICP–MS. 608 Two basic ideas should be considered: the removal of these unwanted phenomena through degradation of the interfering species, and chemical modification of the analyte into a heavier ion that is detected at a mass-to-charge ratio where the background is extremely low.”
Quadrupole collision/reaction cells for ICP–MS (reviews) – (a) Bandura, Baranov, and Tanner, 607 Fresenius J. Anal. Chem., 370 (2001) 454–470; (b) Tanner, Baranov, and Bandura, 609 Spectrochim. Acta Part B, 57 (2002) 1361–1452; (c) Koppenaal, Eiden, and Barinaga, 610 J. Anal. At. Spectrom., 19 (2004) 561–570
The Fresenius’ J. Anal. Chem. review 607 was recommended by David Koppenaal to accompany the three primary research papers604–606 discussed above on the development of the SCIEX DRC™. David Koppenaal further noted that the other two review articles609,610 are “important summary/perspective papers609,610 documenting the success and status of the collision/reaction cell ICP–MS approach, which has rendered what was once considered the Achilles’ Heel of ICP–MS (isobaric interferences) into a minor factor using current reaction cell ICP–MS techniques (and which are the completely predominant type of ICP–MS systems distributed today). These and the preceding papers600,601,604–606 established a new age for ICP–MS, one where polyatomic ion interferences are no longer the over-riding problem they once were.”
Martín Resano offered a comment on the Spectrochim. Acta Part B paper 609 that “it is the most comprehensive review 609 available on the topic and contains abundant information for advanced users.” Frank Vanhaecke similarly stated that it is “an exhaustive review paper, 609 addressing history, design, operation and application of multipole collision/reaction cells in ICP–MS instrumentation.”
Use of electrothermal vaporization (ETV) sample introduction for reduction of isobaric interferences – Carey, Evans, Caruso, and Shen, 611 Spectrochim. Acta Part B, 46 (1991) 1711–1721
The article by Carey et al. 611 was suggested by José-Luis Todolí as it is “an interesting study 611 on ETV liquid sample introduction, which was introduced in the 1980s, 612 for reduction of isobaric interferences. By proper optimization of the key variables of the ETV temperature program (i.e., carrier flow, drying temperature, and coolant gas flow), it was possible to temporally separate 56Fe ions from 40Ar16O ions. As a result, the polyatomic interference caused by argon oxide ions on the major Fe isotope was mitigated. In the same study, the concept was extended to the removal of the 40Ar35Cl+ interference on 75As determination. This original idea has been followed by many authors to perform the analysis of samples with complex matrices containing organic solvents, acids or high salt content.”
Gary Hieftje added: “These capabilities can be expanded by using a mass spectrometer that inherently offers multielement and multi-isotope capability and which has the speed to follow the relatively rapid transient signal changes produced by electrothermal (furnace) vaporization. One such instrument is a time-of-flight mass spectrometer. 545 Another is a sector-field MS equipped with an array detector. 613 With the TOF-MS, Mahoney et al. 545 were able to separate and quantify a broad range of elements and isotopes on the basis of differences in their volatilization behavior, whereas without this thermal dimension, a mass spectrometric resolving power in excess of 100 000 would be needed.”
“Cold” plasma operating conditions – (a) Sakata and Kawabata, 614 Spectrochim. Acta Part B, 49 (1994) 1027–1038; (b) Tanner, 615 J. Anal. At. Spectrom., 10 (1995) 905–921
This set of articles614,615 reports the use of so-called “cool” or “cold” plasma conditions. According to Frank Vanhaecke, the paper by Sakata and Kawabata 614 “contains the first description of the use of cool plasma conditions for strongly attenuating the signal intensity of Ar-containing (polyatomic) ions, thereby enabling trace determination of elements previously hardly accessible by ICP–MS, like K, Ca and Fe, at trace levels. The capacitive decoupling of the torch and the ICP was later also relied on to reduce the ion energy distribution and thus, to increase signal intensities.”
The second paper 615 deals with the characterization of ionization and matrix suppression in “cold” plasma operating conditions and was suggested by Norbert Jakubowski, who noted “This paper 615 shows the strengths and weaknesses of the ‘cold plasma’ technology in ICP–MS. It describes a parametric study of the effect of plasma power and central gas flow rate to demonstrate the transition from normal analytical conditions to cooler plasma conditions using an ICP–MS instrument with a balanced load coil. A significant signal enhancement was observed for elements with low first ionization potential at about 6 eV whereas severe suppressions occurred for elements with a high first ionization potential, thus making this new technology interesting to improve the limits of detection for only a few elements such as K, Ca and Fe. However, these elements have been quite important in the electronics industry to analyze pure waters and acids, and this explains why this special operation mode in conventional ICP–MS was of analytical interest.”
Analytical figures of merit and example applications
Internal standardization in ICP–MS – Thompson and Houk, 616 Appl. Spectrosc., 41 (1987) 801–806
Norbert Jakubowski summarized the key point of this paper 616 as “application of an internal standard in ICP–MS to compensate matrix-induced and drift-induced effects in ICP–MS on analyte intensities. The paper 616 describes how analyte signals depend on instrumental optimization.” José-Luis Todolí regarded the importance of this work 616 as “The best internal standard in ICP–MS should have a mass as close as possible to the mass of the analyte of interest. Several internal standards must be used when multielement analysis is required. This important conclusion for the development of current ICP–MS analysis methods as described in this work 616 was supported by further studies. 617 ”
Isotope dilution mass spectrometry – (a) Fassett and Paulsen, 618 Anal. Chem., 61 (1989) 643A–649A; (b) Rottmann and Heumann, 619 Fresenius J. Anal. Chem., 350 (1994) 221–227; (c) Heumann, Rottmann, and Vogl, 620 J. Anal. At. Spectrom., 9 (1994) 1351–1355
It has long been known that the best internal standard is one that matches as closely as possible the physical, chemical, and spectroscopic characteristics of the species of interest. In turn, there is no potential internal standard that meets these conditions better than an isotope of the same element. The resulting determination is the essence of isotope dilution. According to José Costa-Fernández, “This article 618 constitutes a tutorial showing the capability of isotope dilution for total elemental determinations, based on the measurement of isotope ratios in samples where its isotopic composition has been altered by the addition of a known amount of an isotopically enriched element. Relevance of this article is justified because isotope dilution mass spectrometry became nowadays a routine method for accurate, quantitative elemental analysis, especially in calibrating other analytical methods and for the certification of standard reference materials.”
As noted by Martín Resano, “The paper by Rottmann and Heumann 619 introduced the use of isotope dilution in speciation, which later became the calibration method of choice.” Frank Vanhaecke recommended another article 620 and commented, “In this paper, Heumann and co-workers 620 describe two approaches for enhancing the reliability of quantitative high-performance liquid chromatography–ICP–MS speciation results by using isotope dilution for quantification. In species-unspecific isotope dilution, the column effluent is mixed with a continuous calibrated ‘spike’ flow of the target element (i.e., a standard solution containing the element of interest in a non-natural isotopic composition) prior to introduction into the ICP. In species-specific isotope dilution, the sample is mixed with a specific species containing the element of interest in a non-natural isotopic composition. While the first approach allows all species containing the element of interest to be determined, the second approach is more reliable as it, for example, also accounts for species interconversion and on-column losses.”
Multi-element and/or isotopic analysis with electrothermal vaporization–ICP–MS – (a) Resano, Verstraete, Vanhaecke, and Moens, 621 J. Anal. At. Spectrom., 16 (2001) 1018–1027; (b) Venable, Langer, and Holcombe, 622 Anal. Chem., 74 (2002) 3744–3753
Ralph Sturgeon recommended these two papers621,622 and noted, “The number of nuclides that can be ‘simultaneously’ monitored in ETV quadrupole-based ICP–MS without degrading the precision, the sensitivity and the limits of detection was investigated based on several elements possessing different thermal characteristics (Cd, Co and Ti). 621 Most applications to this date were limited to 3–5 nuclides. However, analysis shows that no detrimental effects on the precision, detection limits, and sensitivity occur as long as a critical value of three or four points to define the signal profile is achieved (through selection of dwell time), corresponding to the possibility of monitoring more than 20 elements for a standard peak width of 1.5–2 s. Further to the conclusions by Kántor and Güçer, 623 the second paper 622 presents a mathematical model for calculating the maximum number of transient signals generated by ETV sample introduction into an ICP–MS that can be monitored by a quadrupole mass analyzer. Scan time, dwell time, statistical noise, and peak shapes are accounted for to show that a 10 ppb sample is accurately quantified with precision better than 9% while permitting 68 isotopes to be monitored.”
High-precision isotopic analysis with ICP–multi-collector (MC)-MS
High-precision isotope ratio determination – (a) Walder and Freedman, 624 J. Anal. At. Spectrom., 7 (1992) 571–575; (b) Walder, Platzner, and Freedman, 625 J. Anal. At. Spectrom., 8 (1993) 19–23; (c) Vanhaecke, Moens, Dams, and Taylor, 626 Anal. Chem., 68 (1996) 567–569
This group of articles624–626 focuses on the use of a sector-field mass analyzer for isotope-ratio measurement. For the first article, 624 as noted by José Costa-Fernández, “First developments of ICP–MS were based on quadrupole-based instruments that suffered from larger uncertainty in isotope ratios by ICP–MS, compared to ‘traditional’ isotope techniques such as thermal ionization mass spectrometry (TIMS). This article 624 describes a double-focusing magnetic sector mass spectrometer (with an ICP ion source) for the precise determination of isotope ratios. The advantages and disadvantages of this type of instrument were discussed. Relevance of this development is clear as introduction on the market of double-focusing magnetic sector mass spectrometers opened a door to highly precise isotope-ratio measurements by ICP–MS, well beyond the reach of quadrupole ICP–MS instruments.”
The first article 624 was also recommended by Frank Vanhaecke, who summarized its key points as “introduction of ICP–multi-collector mass spectrometry (ICP–MC-MS) 624 as a unique tool for isotopic analysis. By combining an ICP ion source with a double-focusing sector-field mass spectrometer and an array of Faraday collectors, precisions for Sr, Pb, and U isotope ratios comparable to those obtained with TIMS were reported. ICP–MC-MS has revolutionized the field of metal/metalloid isotopic analysis and has largely replaced TIMS by now.”
The view from John Olesik is that “this is the first report 624 of ICP–MC-MS and an update on capabilities and challenges. ICP–MC-MS has led to extensive use of non-traditional element isotope ratio measurements and enabled new research in earth sciences and cosmochemistry.”
Comments from David Koppenaal on the first two articles624,625 are: “ICP–MC-MS systems, 624 taking a page from thermal ionization MS, soon followed the development of single-detector magnetic-sector MS systems for ICP, enabling higher precision isotope-ratio determinations for a host of biological, geological, and environmental applications. 625 ”
For the third article, 626 Martín Resano commented, “This article 626 demonstrated the benefits of ICP–sector field MS for isotopic analysis, which was employed only for elemental analysis at the time. In principle, the precision of such devices cannot compete with that of ICP–MC-MS instrumentation, but the analyte content ultimately plays a prominent role in this aspect. When targeting extremely low analyte levels, and if sample preconcentration is not feasible (e.g., direct analysis via laser ablation), an ICP–sector field MS operated in low-resolution mode may provide competitive performance simply because of counting statistics. In this work, the RSD values reported were around 0.04%, therefore lying between those offered by quadrupole-based and multi-collector-based ICP–MS devices.”
David Koppenaal pointed out that “these early ICP–sector field MS instruments provided comparatively higher sensitivity owing to better ion transmission and resolution enhancement of up to ∼10 000–12 000 R, which allowed demonstration and reduction of a number of common polyatomic ion interferences.”
As an interesting anecdote, Koppenaal recalled, “Chuck Douthitt and I visited the Finnigan (at the time) MS production facility in Bremen Germany sometime in the late 1980s. We proposed that Thermo develop an ICP–sector field MS instrument (single- and/or multi-collector types) and were met with incredulity – ‘why would we do that?!’ – was the comment made by company principals. Basically there was worry about the effect on their thermal ionization MS business. A few years later, Fisons (formerly VG Instruments) did build sector-based ICP–MS instruments (both single- and multi-collector versions). Thermo eventually followed suit and is now the leading producer of such instruments. Odd how things turn out.”
Mass bias and discrimination in ICP–MC-MS – (a) Vance and Thirlwall, 627 Chem. Geol., 185 (2002) 227–240; (b) Andrén, Rodushkin, Stenberg, Malinovsky, and Baxter, 628 J. Anal. At. Spectrom., 19 (2004) 1217–1224; (c) Fontaine, Hattendorf, Bourdon, and Günther, 629 J. Anal. At. Spectrom., 24 (2009) 637–648; (d) Yang, Mester, Zhou, Gao, Sturgeon, and Meija, 630 Anal. Chem., 83 (2011) 8999–9004
Lu Yang recommended these three articles627,628,630 on mass bias and mass-independent isotopic fractionation (MIF) within ICP–MC-MS, and provided detailed comments on their importance: “The paper by Vance and Thirlwall 627 is the first one that reported the observation of mass-independent isotopic fractionation (MIF) (Nd isotopes) in ICP–MC-MS. In simple words, MIF means that mass bias varies in isotopes of the same element. MIF was unnoticed and/or ignored for many years and was believed to be a rare phenomenon. The majority of isotope ratio measurements are reported in delta notation (δ = Rsample/Rsample − 1) and not as an absolute isotope ratio Rsample. The delta isotope ratio is a relative term, so MIF has little effect on it. Biases (arising from inadequate correction models) in the ratios of the standard and the sample thus cancel out if the analyte and matrix in the sample and standard are matched, if the sample and standard are bracketed, and if the ICP–MC-MS is stable. However, MIF has a significant effect on absolute isotope ratio measurements if mass-dependent models are used for isotopes that exhibit MIF.
“The paper by Andrén et al. 628 is a good one on the effects of instrumental operating conditions (e.g., gas flow rate and torch position) on mass bias and its magnitude. It is recommended to optimize the instrument to achieve maximum intensity first and then increase the sample gas flow rate or move the torch closer to the sampler cone until the intensity drops by about 20% for better isotope-ratio measurement precision. Although it is impossible to completely eliminate mass bias, it is useful to achieve stable mass bias by optimizing the instrument.
“Article 630 reported significant MIF for additional elements including Pb, Ge, Hg within ICP–MC-MS, suggesting/confirming that MIF may not be a rare phenomenon as previously believed. One should note that the most popular correction model (Russell's law) is applicable only for mass-dependent isotopic fractionation; biased results can occur for isotopes displaying MIF. Unfortunately, there is no tool to directly quantify the magnitude of MIF, but its effect on the isotope-ratio measurements can be estimated. It was reported in paper 630 that significant (∼½ percent) biases in isotope ratios (73Ge and 204Pb) arose when Russell's law was applied for isotopes displaying MIF. Since isotopic variation in nature is normally small (in the per mil (‰) range), a ½-percentage bias in the ratio is significant. Therefore, proper use of mass-bias correction models is crucial for absolute isotope-ratio measurements. The study 630 also provided evidence that the cause of MIF remains unknown, and a more in-depth study of the mechanism of mass bias in the future will be helpful to better identify the type of mass bias and for a better choice of mass-bias correction models.”
José-Luis Todolí suggested this article by Fontaine et al. 629 and remarked, “The influence of the nebulizer gas flow rate, the sampling depth and the ion settings on the mass bias effects is studied for a ICP–MC-MS. 629 Likewise, the influence of the aerosol water content on these phenomena, together with the effect of a Ho matrix, are assessed. Interesting discussions about the zone of the spectrometer mainly responsible for the mass discrimination are included. Space-charge effects and collisions in the ICP–MS interface are also described. The role of the kinetic energy distribution of the ions in the plasma is also considered. Interestingly, it appears that optimization of the instrument should not be done in terms of sensitivity and the relative transmission of the ions can be made similar by working under cold plasma conditions.”
Regression models for correction of mass bias – (a) Maréchal, Télouk, and Albarède, 631 Chem. Geol., 156 (1999) 251–273; (b) Yang and Meija, 632 Anal. Chem., 82 (2010) 4188–4193
As noted by Lu Yang, “Russell's law is a mass-dependent mass-bias correction model originally developed for TIMS; it assumes equal mass bias for the analyte and the calibrant isotopes. However, this assumption has been proven inadequate for ICP–MC-MS, as it has been recognized that mass bias varies among elements; after all, the mass bias is different for Li (∼20%) and U (∼1–2%). In addition, MIF also arises in the ICP–MC-MS itself. To overcome the limitation of Russell's law for absolute isotope-ratio measurements, a regression model has been developed and tested.
“The paper by Maréchal et al. 631 describes a regression model for mass-bias correction. This regression model (Eq. 26 in the paper) was derived from Russell's law and was employed to determine absolute Cu and Zn isotope ratios (Table 4). In brief, a regression model for mass-bias correction is based on a linear relationship between the natural logarithm of the measured analyte isotope ratio ln(ranalyte) and the natural logarithm of the measured calibrant isotope ratio ln(rcalibrant) (i.e., a standard with known isotope ratio). To calculate the absolute isotope ratios, the authors used either the intercept (for Cu) or the slope (for Zn) from the regression (Table 4), both of which were obtained from measured Cu (analyte) + Zn (calibrant) mixtures.
“The article by Yang and Meija 632 revised the original regression mass-bias correction model in the paper by Maréchal et al. 631 The new calibration equation (Eq. 5) 632 was derived from first principles based on a generic correction factor k, which links the measured isotope ratio, r, to the unbiased estimate of the true ratio, R, (i.e., R = k • r) without any assumptions (i.e., identical mass bias for the analyte and calibrant in the Russell's law). Equations used in the paper 632 are simple and straightforward. Most importantly, the final calculation of the absolute analyte isotope ratio uses both the slope and the intercept of the regression, along with the calibrant reference value (see Eq. 6 in the paper). This approach 632 generates reliable isotope ratios, regardless of the type of mass bias involved and does not assume mass-dependent isotopic fractionation. This model has gained increased interest and has been applied to absolute isotope-ratio measurements for a number of elements. The modified regression model is based on the linear relationship of ln(ranalyte) versus ln(rcalibrant) between the measured isotope ratios of the analyte and the calibrant in time because of instrument drift. Although accurate isotope ratio results can be obtained, the measurement time/session at constant ICP RF power is very long (6 to 15 hours), as ICP–MC-MS is usually very stable and thus it takes a long time for a natural drift to occur to ‘draw’ the regression line.
“Malinovsky et al. 633 improves the efficiency of the modified regression mass-bias correction model. 632 Instead of performing a measurement at the optimal RF power (highest sensitivity and stable signal) and waiting for natural drift to occur, the RF power is intentionally changed along both sides of the optimum RF to induce a large enough variation in mass bias for creation of the regression line quickly. The authors succeeded in reducing the measurement time from 6 to 15 hours (with fixed RF power) to 30 minutes (with changing RF power). The results obtained by this approach were validated with the full gravimetric isotope mixture model described in more detail in Sections 12.7.5 and 12.7.6 below.
“In summary, the regression model does not require the same mass bias for the analyte and the calibrant, but it was found that a smaller uncertainty of isotope ratio is obtained when analyte and calibrant isotopes are close in mass, possibly due to similar mass bias for close-by isotopes. The regression model still relies on a calibrant, thus the accuracy and precision of the reference isotope ratio is crucial. The uncertainties of both the slope and the intercept generated from the least-squares linear regression are included in the calculation of the final uncertainty of the Ranalyte. As shown in the work by Tong et al., 634 compared to previous work obtained under fixed RF power, the precision of the regression model measured at varying RF power has been significantly improved; the uncertainties of Pb isotope ratios measured with the optimized regression model are similar to or better than those of the full gravimetric isotope mixture model, which is considered as a primary method.”
Combined standard-sample bracketing and internal normalization isotopic fractionation correction model – Yang, Peter, Panne, and Sturgeon, 635 J. Anal. At. Spectrom., 23 (2008) 1269–1274
As recounted by Lu Yang, “The key point of this paper 635 is that it illustrates the simple and commonly used combined standard–sample bracketing and internal normalization model. The precision of isotope-ratio measurements using this combined model is significantly improved compared to the direct standard–sample–standard bracketing model which is widely used in the literature. Although the standard–sample–standard bracketing model can generate accurate isotopic results, it needs an isotopic calibrator. Because mass bias is corrected separately, mass-independent fractionation has no effect on the accuracy of the isotopic results. However, the standard–sample–standard bracketing model cannot fully correct for temporal mass bias drift. This drawback can be avoided by using the combined standard–sample bracketing and internal normalization model, wherein irregular changes in mass bias during the measurement sequence are largely corrected, and matrix-induced isotopic fractionation can be reduced, providing better measurement precision as demonstrated in the study for Sr isotope ratio measurements.”
Full gravimetric isotope mixture for mass-bias correction – Qi, Berglund, Taylor, Hendrickx, Verbruggen, and De Bièvre, 636 Fresenius J. Anal. Chem., 361 (1998) 767–773
Lu Yang explained, “The paper by Qi et al. 636 is the first one describing ICP–MC-MS with a full gravimetric isotope mixture (FGIM) model, a primary method for mass-bias correction. Unlike the commonly used standard–sample–standard bracketing, combined standard–sample bracketing and internal normalization, and optimized regression models, the FGIM model is a primary method without the need to use a separate isotopic calibrator. For an element with N stable isotopes, the model requires, at a minimum, measurements of all (N − 1) isotope ratios in all N pure enriched materials and in (N − 1) independent gravimetrically prepared mixtures of any two enriched materials to derive an isotope-ratio correction factor. Importantly, the isotopic compositions of the enriched materials are not needed, but chemical purity of the enriched materials is essential. The FGIM model has been used for other types of MS (e.g., TIMS).
“The paper 636 reported isotope-ratio measurement of Li, which is the simplest system because only two isotopes are involved. As the number of isotopes of an element increases, the cost of enriched pure materials, the effort to characterize the purities of the pure enriched materials and the difficulty in the calculation increase significantly. As a result, the method has rarely been applied to multi-isotope systems (more than four isotopes). A study demonstrating the complexity of using FGIM for a system with four isotopes (Pb) was published by Tong et al. 634 For more details about the FGIM model, please see review article 637 in this compilation.”
Accurate and precise determination of isotope ratios by ICP–MC-MS (reviews) – (a) Vanhaecke, Balcaen, and Malinovsky, 638 J. Anal. At. Spectrom., 24 (2009) 863–886; (b) Yang, 639 Mass Spectrom. Rev., 28 (2009) 990–1011; (c) Yang, Tong, Zhou, Hu, Mester, and Meija, 637 J. Anal. At. Spectrom., 33 (2018) 1849–1861
Comments from José Costa-Fernández related to the review by Vanhaecke et al. 638 are: “This article 638 constitutes a key tutorial review on the use of single-collector and multi-collector ICP–MS for isotopic analysis. The authors 638 make a critical comparison about the performances of different types of ICP–MS instruments for isotopic analysis. Also, students can find here some fundamentals, pitfalls and key points to be considered when measuring isotope ratios. Selected applications of the use of isotope ratios in geochemical, environmental and biomedical studies are also collected.”
Frank Vanhaecke recounted, “While high-precision isotopic analysis using ICP–MC-MS was already routinely deployed in geo- and cosmo-chemistry, it was less popular in other research areas despite the huge potential it had to offer. We decided to write a tutorial review 638 to familiarize interested readers with the basics of natural variation in the isotopic composition of the elements and isotopic analysis using single-collector and multi-collector mass spectrometers for ICP, and to illustrate the capabilities of isotopic analysis in various research fields. In fact, this review paper was then extended into a book, titled Isotopic Analysis – Fundamentals and Applications using ICP–MS and published by Wiley-VCH, that I edited together with a colleague from another university.”
As outlined by Lu Yang, “There are two recent review papers637,639 on accurate and precise isotopic analysis by ICP–MC-MS. As a starting point, this paper 639 provides a quick overview on developments in ICP–MC-MS instrumentation, purification techniques for analyte separation prior to measurements, mass bias, and correction models. The updated review paper 637 focuses on current mass bias correction models, wherein the applicability of each model is outlined. Recent observation of mass-independent isotopic fractionation within ICP–MC-MS, which is of paramount importance for the selection of mass-bias correction models since many models are able to correct only mass-dependent bias, is summarized. Possible reasons for the cause of MIF are discussed. Two state-of-the-art protocols covering the regression mass bias model and full gravimetric isotope mixture model are discussed in further detail. A helpful flow chart, which delineates proper choice of mass-bias correction models for accurate and precise isotopic analysis by ICP–MC-MS, is included in this paper (see Figure 4). 637 ”
Glow Discharge
Glow discharge (GD) optical spectrometry
Hardware development, characterization, and general analytical applications
Paschen law for GD – Paschen, 640 Ann. Phys., 273 (1889) 69–96
As pointed out by Volker Hoffmann, “The operational principle of glow discharge is based on the fundamental work of Paschen, 640 who found that the ignition voltage of the plasma depends on the product of pressure and distance between the electrodes. At geometry and pressure conditions of analytical glow discharges, the ignition voltage increases with decreasing product of pressure and distance, which is used to restrict the plasma. It is very interesting to read scientific papers from this time, where observations were made with great care. This way Paschen concluded that his experiments were most reproducible on cold winter days and at low humidity.”
Birth of Grimm-type GD – (a) Grimm, 641 Naturwissenschaften, 54 (1967) 586; (b) Grimm, 642 Spectrochim. Acta Part B, 23 (1968) 443–454
This paper by Grimm, 642 which marks the birth of the now-called Grimm-type GD, is very popular among our respondents, including Arne Bengtson, Michael Blades, Annemie Bogaerts, José Broekaert, Gerardo Gamez, Gary Hieftje, Volker Hoffmann, Kenneth Marcus, Jorge Pisonero, and Steven Ray.
According to José Broekaert, “The paper 642 describes a unique source for direct solids analysis widely used in this form up to date. A new glow discharge lamp for the direct optical emission spectrometric analysis of electrically conductive solids with a flat and cooled cathode has been described.”
Steven Ray added, “Grimm 642 introduces the modern glow discharge lamp as used today in both GD–OES and GD–MS.” Volker Hoffmann remarked, “With his invention, Grimm 642 opened the development of commercial GD–OES. A modified source was later also used in the fast flow GD–MS. The operational principle is based on the fundamental work of Paschen. 640 ” Kenneth Marcus indicated, “This is the seminal paper 642 which started the entire field of GD–OES. The key here was the presentation of an alternative to erratic arc and spark sources, wherein the plasma was readily sustained to a standard metal ‘hockey puck’ sample. The ‘Grimm lamp’, with slight modifications in geometry and powering by radiofrequency potentials, remains the mainstay in GD–OES.”
Michael Blades commented, “A seminal paper 642 that spawned the field of glow discharge analysis of metals. The construction and use in quantitative spectrochemical analysis of a low pressure discharge lamp which can be operated as either a glow discharge lamp, or hollow-cathode lamp is described in detail. Due to the basic design of the lamp, the analytical samples, preferably in the form of metal plates and sheets, can rapidly be changed. This light source therefore can easily be applied in routine analysis.”
Arne Bengtson noted, “In this paper, 642 an easy-to-use and very stable glow discharge source for optical emission is presented. It has since become an ‘industrial standard’ for glow discharge optical emission spectrometers. Due to the rather gentle sputter removal of the sample surface, it has become an extremely useful tool for rapid, multielement surface depth profiling.”
Jorge Pisonero shared a similar view and added, “In 1968, Grimm 642 achieved a very important milestone in GD spectroscopy with the development of a new type of glow discharge source. The Grimm GD source (as it is known) was originally developed for GD–OES and consisted of flat cathode source, where the sample itself serves as the vacuum sealing part, allowing fast sample changing and easy source cleaning. The discharge area on the sample surface (defined by the anode diameter) is restricted, resulting in more stable and reproducible signals. Grimm GD sources as well as other modified Grimm-type GD sources (e.g., without suction between anode and cathode and including flow tubes) are the preferred sources for many of the current commercial instruments as they show a great analytical performance for bulk analysis and for depth-profile analysis.”
Gerardo Gamez elaborated, “This paper 642 describes the design and initial characterization of what has come to be known as a Grimm-type glow discharge lamp source. It represents ground zero for what has exploded into the field of glow discharge optical emission spectroscopy. Despite the inherent advantages of glow discharge sources, for example direct solid analysis capabilities, the complications of sample preparation and positioning in previous glow discharge lamp geometries had greatly hindered its in-depth scientific exploration towards development for routine materials chemical analysis. The Grimm-type GD source significantly improved sample throughput. One aspect worth noting is that, even with the evolution of the source design, current commercial GD–OES lamps look very similar to the original design in this paper, 642 which gives a clear testament of its impact. Something unique about this manuscript is that the original language is in German, which gives a taste of how the international language of science has evolved.”
Gary Hieftje added, “An important and innovative feature of the Grimm design of the glow-discharge lamp641,642 is its use of an argon flow that enters beneath the restrictor anode and flows first across the lamp window. Atoms sputtered from the cathode therefore do not deposit readily on the window, and their concentration along the optical path is reduced, so self-absorption and self-reversal are lessened. Another important design element is the arrangement of the anode restrictor, which promotes electrical field lines that lie orthogonal to the cathode surface, so sputtering is more uniform, and cathode erosion occurs on a layer-by-layer fashion.”
Fundamental characterization of the Grimm-type GD – (a) Dogan, Laqua, and Massmann, 643 Spectrochim. Acta Part B, 26 (1971) 631–649; (b) Dogan, Laqua, and Massmann, 644 Spectrochim. Acta Part B, 27 (1972) 65–88; (c) El Alfy, Laqua, and Massmann, 645 Fresenius Z. Anal. Chem., 263 (1973) 1–14
This three-part work is recommended by José Broekaert because, “The first paper 643 contains the best available description of the excitation properties in an analytical glow discharge at reduced pressure. The electric characteristics, the sample ablation, and the spectral properties of the glow discharge lamp according to Grimm are studied. The second paper 644 covers the best description of the analytical properties of a glow discharge with flat cathode for the analysis of electrically conductive compact samples. Analytical possibilities for optical emission spectrometric analyses of metal samples with the Grimm-type glow discharge both for bulk and for depth-profile analyses were studied. The third paper 645 treats in a unique way the method of powder analysis with the Grimm-type glow discharge lamp. A unique approach for optical emission spectrometric trace analyses of electrically non-conductive powders after briquetting them with copper powder to serve as an electrode was presented.”
This group of papers also demonstrated the potential of depth analysis for solid samples. As noted by Michael Blades, “These two papers643,644 firmly establish glow discharge optical emission spectrometry as a methodology for quantitative and depth analysis for conducting samples. Seminal papers!” Annemie Bogaerts commented on the second paper 644 in this cluster and noted, “First description of the analysis of non-conductors by GD–OES 644 by mixing the non-conducting sample as a powder with a conductive binder, and pressing it into an electrode.” The paper by Dogan et al. 643 published in 1971 is also recommended by Gerardo Gamez; his comment can be found in Section 13.3.1.
Hollow-cathode lamp discharges for the emission-spectrographic determination of trace elements – (a) Thornton, 646 Analyst, 94 (1968) 958–967; (b) Harrison and Prakash, 647 Anal. Chim. Acta, 49 (1970) 151–159
José Broekaert stated, “A high-temperature hollow cathode as a source for optical emission spectrometry to determine trace elements in steels, high-temperature alloys and related materials has been described. The paper by Thornton 646 in a unique way describes the features of a high sensitivity determination of volatile elements directly in solids by evaporating them selectively from the samples in the form of a hot cathode and exciting them in a low-pressure glow discharge. The paper by Harrison and Prakash 647 discusses a unique method for spectrochemical microanalysis with high power of detection, in which a hollow-cathode source for the optical emission spectrometric analysis of dry solution residues in stainless steel cathodes has been described.”
Microwave boosted GD – Leis, Broekaert, and Laqua, 648 Spectrochim. Acta Part B, 42 (1987) 1169–1176
José Broekaert recounted, “Cross excitation with microwave energy of the sputtered material in a glow discharge according to Grimm has been shown to enable a considerable increase of the line intensities and the power of detection obtainable in optical emission spectrometry. The paper 648 treats a unique approach for the use of cross excitation to boost the power of detection of the Grimm-type glow discharge.”
Gary Hieftje added, “This paper 648 was among the first to exploit the concept of a ‘tandem source’, one that separated the processes of sample volatilization and excitation, with each handled by a system tailored to the respective task.”
Radiofrequency (RF)-GD
Implementation of RF-GD optical emission spectrometry – (a) Chevrier and Passetemps, 649 French Patent 2 616 545A1 (1987); (b) Winchester and Marcus, 650 J. Anal. At. Spectrom., 5 (1990) 575–579; (c) Winchester, Lazik, and Marcus, 651 Spectrochim. Acta Part B, 46 (1991) 483–499
Volker Hoffmann recalled, “The urgent need to analyze non-conducting samples drove the early research and development of a radiofrequency glow discharge at Renault in France. Based on Grimm's design, a patent for this device was granted already in 1987. 649 As is often the case, open publication of important developments in industry are rare, but the users of Jobin Yvon instruments still remember these path-breaking developments at the present time.”
Gerardo Gamez noted, “The Winchester–Marcus paper 650 shows the implementation of radiofrequency powered GD for optical emission spectroscopy. It is interesting that radiofrequency GD had already been implemented for MS almost 20 years earlier as described by Coburn and Kay. 652 The significance of this paper 650 was enhanced by the momentum that DC-GD–OES had already generated. The main advantage of RF powering schemes in GD is that they give access to analysis of non-conducting samples, which opens a wide variety of applications in several fields. A more detailed characterization of an RF-GD–OES source was published a year later by the same research group. 651 ”
Kenneth Marcus recounted, “While GD–MS had always, to this point, been effected using a coaxial cathode (in cell) geometry, GD–OES had always employed a Grimm-type geometry, with the flat metal sample mounted external to the source. In this work, 651 RF powering was implemented in such a geometry, with direct analysis of metals and a machinable glass ceramic (Macor) demonstrated. To date, RF powering is the norm in all commercial GD–OES systems.”
Operation principles and design considerations for RF-GD (review) – Marcus, 653 J. Anal. At. Spectrom., 8 (1993) 935–943
According to Kenneth Marcus, “Marcus 653 describes here the fundamental differences between RF- and DC-GD source operation, and how those differences require fundamental differences in the approaches to how the sources are constructed. In addition, means for assessing how RF powering affects source operation and how those parameters are related to conventional DC operation were described. How those design aspects are manifest in both MS and OES sources is presented.”
Measurements of electrical properties of RF-GD and pulsed-GD – (a) Wilken, Hoffmann, Uhlemann, Siegel, and Wetzig, 654 J. Anal. At. Spectrom., 18 (2003) 646–655; (b) Wilken, Hoffmann, and Wetzig, 655 Spectrochim. Acta Part B, 62 (2007) 1085–1122; (c) Efimova, Hoffmann, and Eckert, 656 J. Anal. At. Spectrom., 26 (2011) 784–791
As noted by Volker Hoffmann, “Wilken et al. 655 developed a special radiofrequency glow discharge source including voltage and current probes. This way it became possible for the first time to measure voltage–current curves of analytical RF glow discharges and to determine the components of the plasma equivalent circuit. This technology also became important for the investigation of pulsed RF discharges 656 and a comparison with pulsed DC discharges became possible.”
Gary Hieftje also pointed out, “In the application of glow discharges to depth profiling, a vexing problem has always been converting the time-dependent emission or mass-spectrometric signal into one that expresses analyte concentration as a function of sample depth. For a DC discharge, this problem is relatively easy to solve because discharge current and voltage can be directly measured. The problem, much more difficult in an RF discharge, was successfully addressed in the publication by Wilken, Hoffmann, Uhlemann, Siegel and Wetzig, 654 in which RF current and voltage probes were installed directly into the discharge.”
Pulsed GD
Characterization of pulsed GD – (a) Dawson and Ellis, 657 Spectrochim. Acta Part A, 23 (1967) 565–569; (b) Klingler, Savickas, and Harrison, 658 J. Am. Soc. Mass Spectrom., 1 (1990) 138–143; (c) Winchester and Marcus, 659 Anal. Chem., 64 (1992) 2067–2074; (d) Hang, Walden, and Harrison, 660 Anal. Chem., 68 (1996) 1148–1152; (e) Harrison, Yang, and Oxley, 661 Anal. Chem., 73 (2001) 480A–487A
According to Gerardo Gamez, “The Dawson-Ellis paper 657 had a great influence in the subsequent pulsed power schemes in glow discharge analytical spectrochemistry. Klingler, Savickas and Harrison 658 cited Dawson and Ellis 657 in their own landmark paper 658 as an inspiration for their development of pulsed GD as an elemental ion source for mass spectrometry. Pulsed GD has the advantage of allowing a higher instantaneous power that may lead to better analytical performance while permitting analysis of thermally labile samples, along with a finer control of sputtering rates. Pulsed GD–OES was implemented later in another landmark paper by Winchester and Marcus 659 for an RF powered source. Furthermore, gated detection coupled with pulsed schemes allows access to different conditions along the GD pulse that can lead to better S/N or even molecular/structural information.”
Remarks from Annemie Bogaerts on the paper by Klingler, Savickas, and Harrison 658 are: “It introduced pulsed glow discharges, 658 which gave better sensitivity due to higher peak voltages and currents for the same average power. The authors also found that the analytically important ions and interfering ions were formed during a different time in the pulse. Hence, by coupling this time-resolved production of ions to time-resolved detection, spectral interferences in mass spectrometry can be reduced.”
Kenneth Marcus recommended the article by Hang et al. 660 and noted, “Harrison was the first to recognize that one could tailor both the atomization and ionization processes in a GD ion source. Use of very short powering pulses 660 provides high energy sputter-action (atomization), without excess sample heating. Uniquely, as analyte and background gas species are ionized differently, via Penning and electron ionization processes, their ionization characteristics differ as a function of the plasma lifetime. With the plasma ‘on’, electron ionization dominates, and soon after it is switched ‘off’ there is an overpopulation of argon metastable states, preferentially promoting post-pulse ionization of metals. Thus, mass spectra taken post-pulse are virtually composed exclusively of analytes. This aspect was never used to advantage commercially until the recent introduction of a GD–MS on a TOF platform.”
Annemie Bogaerts shared a similar view and noted, “This paper 660 introduced microsecond-pulsed glow discharges as a source for atomic emission, absorption, fluorescence, and mass spectrometry. Compared to millisecond-pulsed glow discharges, they can still provide higher peak currents and voltages during the short pulses, so they have better analytical sensitivity.”
Volker Hoffmann suggested two articles658,661 by the Harrison group on this topic and noted, “Willard Harrison recognized the potential of radiofrequency and pulsed glow discharge very early. Most probably this was due to the fact that a spark source mass spectrometer working under high vacuum in his lab was already equipped with these features and later operated with a glow discharge source.”
Likewise, Steven Ray suggested this article by Harrison et al. 661 and concisely summarized, “The pulsed glow discharge and RF-powered glow discharge have greatly extended the scope of application for these techniques, as reported in this reference.”
Two-dimensional maps of excited and ionized atoms in millisecond pulsed GD – Lewis, Jackson, Doorn, Majidi, and King, 662 Spectrochim. Acta Part B, 56 (2001) 487–501
This paper discusses two-dimensional maps of the spatial distributions of excited and ionized atoms in a millisecond pulsed GD, which demonstrates both the temporal and spatial dependence of different excitation and ionization processes over the pulse cycle. As pointed out by Volker Hoffmann, the key point of this paper 662 is that it “contains a very detailed investigation about the spatial and temporal characterization of pulsed discharges. In particular, analytical glow discharges are spatially inhomogeneous, caused by variations in the electrical field, current, pressure, and gas flow. Furthermore, the analyte is introduced by sputtering of the sample surface, is distributed by diffusion and convection in the source and is part of the complex plasma physics. In pulsed discharges all these processes depend additionally on time, so spatially and time-resolved measurements are key to understanding and optimizing this kind of plasma for analytical purposes.”
Spatial emission distribution of a pulsed RF-GD – Valledor, Pisonero, Nelis, and Bordel, 663 Spectrochim. Acta Part B, 68 (2012) 24–33
According to Annemie Bogaerts, “A pulsed RF glow discharge was characterized based on side-on measurements of various Ar and Cu emission lines, for different pulse frequencies. 663 Insights were obtained on different excitation characteristics for Ar atoms, Ar ions and Cu atoms, as the emission lines showed different behavior at different frequencies, as well as different spatial distributions. For instance, the fact that the ions exhibit a maximum emission near the anode indicates the possibility to detect ionic emission far away from the negative glow, thus where the sampler cone is usually placed in GD–MS. This is useful information for applications.”
Fundamental plasma diagnostics in GD
Self-absorption and Doppler temperatures in GD lamp – West and Human, 664 Spectrochim. Acta Part B, 31 (1976) 81–92
As explained by Gerardo Gamez, “In this paper, 664 West and Human present one of the first high-resolution measurements of emission line shapes in a Grimm-type GD lamp. They use their measured line shapes to show the degree of self-absorption and even calculate Doppler temperatures. In a classroom setting, this would be a great platform to launch discussions into line shapes and thermal equilibrium in plasmas.”
Kinetic temperatures, electron number densities, and atom densities in Grimm-type GD – (a) Ferreira, Human, and Butler, 665 Spectrochim. Acta Part B, 35 (1980) 287–295; (b) Ferreira, Strauss, and Human, 666 Spectrochim. Acta Part B, 38 (1983) 899–911
Gerardo Gamez shared his comments on the first paper 665 in this set and noted, “Here, the authors 665 from South Africa keep pushing their line shape measurements but now toward determination of electron number densities in a Grimm-type GD lamp. They introduce a slotted anode to be able to obtain side-on emission intensities. Interestingly, they use broadening from the He 447.148 nm line because they found the traditionally used Hβ line to be wider than the free-spectral range of their interferometer.”
Kenneth Marcus suggested the second paper 666 and commented, “This review article 666 describes detailed fundamental research and applications in GD–OES, performed at the National Physical Research Laboratory, Council for Scientific and Industrial Research, in Pretoria, South Africa. Fundamental studies included gas phase kinetic temperatures, sputtered atom and metastable argon atom densities. Also included were concepts of the atomic fluorimeter and the use of ‘boosted’ glow discharge lamps.”
Volker Hoffmann added, “This article 666 provides an overview on the work performed by the group of Council for Scientific and Industrial Research in South Africa. It highlights the possibility and meaning of side-on observation for the fundamental characterization (plasma diagnostics) of the GD plasma. Although already summarized in this overview article, the importance of side-on viewing on the characterization of the fundamental properties (e.g., kinetic temperature and electron number densities, densities of sputtered atoms and Ar metastables) in GD plasma can be found in references 2, 6, and 11 within this paper. 666 ”
Grimm-type GD lamp measured with Fourier-transform optical spectroscopy – Broekaert, Brushwyler, Monnig, and Hieftje, 248 Spectrochim. Acta Part B, 45 (1990) 769–778
According to José Broekaert, “High-resolution Fourier-transform spectrometry has been shown to enable both line profile studies and full spectrum detection as well as multi-element analyses in glow discharge optical emission spectrometry. The paper 248 describes the features of Fourier-transform spectrometers for atomic emission spectrometry with glow discharges and its use for diagnostic and analytical purposes.”
Langmuir-probe measurements – Fang and Marcus, 667 Spectrochim. Acta Part B, 45 (1990) 1053–1074
Gerardo Gamez commented, “In this paper, 667 the authors use a Langmuir probe for determination of electron number densities and temperature, as well as the electron energy distribution function of a planar-diode GD lamp. Basic aspects of Langmuir-probe theory are well covered and the significance of the measured parameters toward GD spectrochemical analysis is made evident.”
Lateral distribution of the emission line intensities in a Grimm-type GD – Hoffmann and Ehrlich, 668 Spectrochim. Acta Part B, 50 (1995) 607–616
Volker Hoffmann recalled, “In the GD plasma of Grimm type the emission of the sputtered material is inhomogeneous with end-on observation, 668 which was not well known then. Most light is emitted by the discharge gas, which shows a homogeneous distribution. This fact was essential for the imaging of the plasma into the spectrometer and later similar experiments led to the use of pulsed discharges for improved imaging with end-on observation.”
Three-dimensional density profiles of sputtered atoms and ions in a direct current GD – Bogaerts, Wagner, Smith, Winefordner, Pollmann, Harrison, and Gijbels, 669 Spectrochim. Acta Part B, 52 (1997) 205–218; (b) Bogaerts, Guenard, Smith, Winefordner, Harrison, and Gijbels, 670 Spectrochim. Acta Part B, 52 (1997) 219–229
Annemie Bogaerts remarked, “This set of papers669,670 deals with detailed plasma diagnostics by means of combined atomic absorption and laser-induced fluorescence spectroscopy, to quantitatively measure 3-D density profiles of Ar metastable atoms and sputtered atoms and ions in order to validate model calculations.”
Laser scattering techniques for GD diagnostics – (a) Gamez, Bogaerts, Andrade, and Hieftje, 671 Spectrochim. Acta Part B, 59 (2004) 435–447; (b) Bogaerts, Gijbels, Gamez, and Hieftje, 672 Spectrochim. Acta Part B, 59 (2004) 449–460
As explained by Gerardo Gamez, “The advantages of laser scattering plasma diagnostic techniques, including Thomson and Rayleigh scattering, are utilized here 671 for measuring radially resolved profiles of the electron and gas-kinetic temperatures, as well as the low electron number densities and non-Maxwellian electron energy distribution functions. The aspect I remember most from these studies was that, to cope with the small electron Thomson scattering cross sections and the low electron number densities, we had to use gated photon counting with collection times that would span several hours to get a full spectrum on the double-monochromator.”
Annemie Bogaerts commented, “These two papers671,672 compare results between plasma diagnostics (by laser scattering) and numerical modeling for a glow discharge. In the first paper, 671 the gas temperature was determined via Rayleigh scattering, whereas Thomson scattering provided the electron number density, electron temperature, and electron energy distribution function. The second paper 672 focused on modeling, and predicted the same plasma characteristics for the same conditions as used in the experiments. Such a 1-to-1 comparison is of great value to validate the model, which can then be used to provide detailed insights that are not always available from the experiments.”
Excitation and ionization mechanisms in GD
Charge-transfer excitation processes in GD – (a) Farnsworth and Walters, 673 Spectrochim. Acta Part B, 37 (1982) 773–788; (b) Steers and Fielding, 674 J. Anal. At. Spectrom., 2 (1987) 239–244; (c) Bogaerts and Gijbels, 675 J. Anal. At. Spectrom., 11 (1996) 841–847
According to Annemie Bogaerts, “Steers and coworkers 674 have published many papers on the role of asymmetric charge transfer in glow discharges for various elements, but five years earlier, Farnsworth and Walters 673 already reported this process. These papers were influential to modeling studies, to identify the importance of this process. Typically it occurs when the energy difference between the formed analyte ions and the discharge gas ions is small, so that there is resonance, but it was shown that the analyte ions can also be formed in excited states. This was demonstrated for various elements.”
As noted by Gerardo Gamez, “In this paper, 674 Steers and Fielding look into the excitation processes of copper ion lines in a Grimm-type glow discharge and propose charge-transfer as an excitation pathway. It is very instructive to see how several other excitation pathways are considered and discarded.”
The third paper 675 is on understanding the role of charge transfer and Penning ionization to the relative sensitivity factors in GD–MS. Annemie Bogaerts recounted, “Based on the insights obtained by modeling, we were able to explain the reason for variations in relative sensitivity factors, commonly used in GD–MS. 675 Based on a survey for all elements of the periodic table, we could attribute the variations in relative sensitivity factors to Penning ionization and especially to asymmetric charge transfer with Ar ions.”
Wei Hang shared a similar view and elaborated, “This paper 675 emphasized charge transfer as an important ionization mechanism in addition to Penning ionization and electron impact ionization. Penning collision is generally considered to be the main mechanism for ionization, while electron impact ionization is of minor importance. However, a model based on transport and ionization 675 is not able to explain the variations in experimental relative sensitivity factors for all elements. The discrepancy is clearly correlated with the (non) availability of suitable energy levels for charge transfer to the analyte ions, which strongly suggests the role of ionization by asymmetric charge transfer between argon ions and the sputtered atoms.”
Role of metastable atoms in GD ionization processes – Hess and Harrison, 676 Anal. Chem., 60 (1988) 691–696
Gerardo Gamez recommended this paper because, “In this paper, 676 opto-galvanic spectroscopy and mass spectrometry are used to follow the effects of depopulating metastables through a tunable laser. It was reported that the signal for analyte ions with ionization potentials lower than the energy of the Ar metastable, such as Cu or Zn, is decreased upon metastable depopulation.”
Foreign gas effect in GD – (a) Hodoroaba, Hoffmann, Steers, and Wetzig, 677 J. Anal. At. Spectrom., 15 (2000) 1075–1080; (b) Šmíd, Steers, Weiss, and Vlček, 678 J. Anal. At. Spectrom., 18 (2003) 549–556
As noted by Jorge Pisonero, “The presence of other gases such as hydrogen or oxygen in the Ar glow discharge is known to significantly affect the sputtering rates and the excitation/ionization processes. In particular, the effects caused by hydrogen were initially investigated in detail by Hodoroaba, Hoffmann, Steers, and Wetzig. 677 In this study, 677 which was carried out using multiple matrices, new spectral features, such as emission bands of new compounds (hydrides of sputtered sample constituents) and a continuous background in the range of approximately 220–440 nm were found. As a result, the population of the argon metastables species was observed to be quenched, affecting other elementary processes in the plasma.”
Gerardo Gamez elaborated, “This study 677 describes how the presence of hydrogen gas in the GD–OES, even in quantities less than 1%, can have a significant effect on the spectral features observed. The authors clearly show that the spectral features of a TiH sample under pure Ar gas are similar to the ones from a pure Ti sample under Ar gas doped with hydrogen. Other implications touch on plasma diagnostics where, for example, addition of a small fraction of hydrogen gas to follow Hβ line Stark broadening would have a significant impact on the nature of the GD being observed. The other article 678 illustrates the changes in the spectral features measured when the Ar plasma gas is doped even with very small fractions of N2. For example, a decrease in the self-reversal of Ar I 811.5 nm is attributed to a reduction of the metastable population. It has implications toward nitrogen-rich samples, as well as plasma diagnostic studies where N2 is doped into the Ar gas to observe rotational temperatures.”
Transition rate diagram for mechanistic study – Weiss, Steers, and Pickering, 679 Spectrochim. Acta Part B, 110 (2015) 79–90
Volker Hoffmann recommended this article and commented, “The use of spectrometers with a wide spectral range, like Fourier-transform spectrometers or polychromators with CCD, CID or CMOS detectors, allows the evaluation of excitation and de-excitation processes. This is very essential in glow discharge spectrometry, where local thermodynamic equilibrium is not attained. The application of the methodology presented in this paper 679 is very essential for the development of improved data treatment in future.”
Computer simulation of GD
Modeling GD – (a) Bogaerts, Gijbels, and Goedheer, 680 J. Appl. Phys., 78 (1995) 2233–2241; (b) Bogaerts, Gijbels, and Goedheer, 681 Anal. Chem., 68 (1996) 2296–2303; (c) Bogaerts and Gijbels, 682 Anal. Chem., 68 (1996) 2676–2685; (d) Bogaerts and Gijbels, 683 Anal. Chem., 69 (1997) 719A–727A; (e) Bogaerts, Gijbels, and Vlcek, 684 J. Appl. Phys., 84 (1998) 121–136; (f) Bogaerts and Gijbels, 685 J. Anal. At. Spectrom., 16 (2001) 239–249
This cluster of papers680–685 was collectively suggested by several scientists; the papers are all focused on modeling of GD and were published by the research group of Annemie Bogaerts. Bogaerts picked these two Analytical Chemistry publications in 1996681,682 as the most representative ones, as they reported the “first comprehensive models for GD–MS,681,682 describing the behavior of various species in a typical glow discharge ion source (VG9000) in 2-D (cylindrical symmetry). The models were first developed for the separate species, in 1-D, and were previously published.680,686–690”
Gerardo Gamez recommended these two articles680,684 and explained, “This paper 680 is an early description of one of the computational models that Bogaerts, Gijbels, and Goedheer developed for studying glow discharges. This highly cited work, together with their collisional–radiative model 684 work, is a big part of the basis for the subsequent series of modeling papers from Bogaerts that have tremendously advanced the understanding of glow discharges in spectrochemical analysis.”
The J. Appl. Phys. article, 684 which deals with collisional–radiative modeling for an argon GD, was also recommended by Jorge Pisonero with an annotation, “Glow discharge excitation and ionization processes need to be understood to further improve the performance of this atomic spectroscopy technique. As argon is usually the preferred discharge gas to run GDs, an extensive collisional–radiative model for the argon atoms in a glow discharge was originally developed by Bogaerts, Gijbels, and Vlcek as reported in this work. 684 This model took into account radiative decay, Penning ionization of sputtered atoms, and different kinds of collisions, among other processes; and was able to calculate the populations of the various excited levels as a function of distance to the sample, and the relative contributions of different populating and depopulating processes for all levels. Further improvements of this model and the development of more complex models have been carried out by the research group of Bogaerts in Belgium.”
José Broekaert suggested the Anal. Chem. A-page article as “The feature paper 683 impressively shows that the analytical properties of glow discharges can be obtained through modeling. Detailed models including the temperature and line properties in the case of glow discharges under reduced pressure especially are shown to allow calculation of analytical properties such as sputtered crater forms and depths as well as analyte signals in glow discharge atomic spectrometry.”
Volker Hoffmann picked this article 685 out of the many from the group of Bogaerts on this topic and mentioned that “Annemie Bogaerts and her modeling group contributed much to the progress in analytical GD over the years. This article 685 especially was essential to understand the time scale of the different processes of sputtering, diffusion, excitation and ionization in pulsed discharges.”
Glow discharge mass spectrometry (GD–MS)
Development of GD–MS
Hollow-cathode ion source for solids mass spectrometry – (a) Harrison and Magee, 691 Anal. Chem., 46 (1974) 461–464; (b) Bruhn, Bentz, and Harrison, 692 Anal. Chem., 50 (1978) 373–375
The paper by Harrison and Magee 691 was recommended by Annemie Bogaerts, José Broekaert, and Gerardo Gamez. As noted by José Broekaert, “The use of a hollow-cathode glow discharge as an ion source for mass spectrometry was described. The paper 691 is the basic one on analytical mass spectrometry with a glow discharge as ion source.” Gerardo Gamez shared a similar view that, “This paper 691 shows one of the earliest couplings of a GD ion source to a sector field mass spectrometer. It is significant because about a decade later the double focusing GD–MS VG9000 came about and became the most successful commercial GD–MS instrument.”
Annemie Bogaerts pointed out this “development of a hollow-cathode ion source 691 is applicable for both bulk solids and solution residue analysis.”
Kenneth Marcus and Annemie Bogaerts suggested an additional paper by the Harrison group. 692 Kenneth Marcus stated, “Glow discharge mass spectrometry (GD–MS) is the benchmark method in the characterization of high purity materials. Usually performed on sector-field instruments (for high sensitivity and spectral resolution), this paper 692 describes the first practical approach to ion source design in terms of the handling of small samples. The concepts here (in terms of source design) led to the introduction of the VG9000 in the coming years.”
Coaxial-cathode ion source for solids mass spectrometry – Mattson, Bentz, and Harrison, 693 Anal. Chem., 48 (1976) 489–491
As suggested by Wei Hang, “This paper 693 described the use of a coaxial-cathode ion source, which is popularly used currently, and is a milestone marking the glow discharge as an analytical ion source for direct solids analysis. Metal rods/wires and solution residues were analyzed, and LODs of ppb levels were reached in this work.”
Relative sensitivity factors in GD–MS – Vieth and Huneke, 694 Spectrochim. Acta Part B, 46 (1991) 137–153
Gerardo Gamez opined, “This paper 694 is excellent for learning about quantitation in GD–MS, which is very different from GD–OES. It is not the first mention of relative sensitivity factors in GD but it is the first study that is most comprehensive.”
Wei Hang added, “This paper 694 is frequently cited in most GD–MS quantitative analysis work. The statistical evaluation of the data demonstrates the precision and accuracy of elemental analysis by high mass resolution GD–MS and confirms that relative sensitivity factors are independent of matrix. A model for estimating relative sensitivity factors in GD–MS is also presented, in which the diffusion, ionization/recombination and ion-extraction phenomena were taken into consideration.”
GD–quadrupole MS – Jakubowski, Stuewer, and Toelg, 695 Int. J. Mass Spectrom. Ion Processes, 71 (1986) 183–197
The key point of this work, 695 as summarized by Annemie Bogaerts, is that “a Grimm-type GD source, which was before only used for GD–OES, was developed for GD–MS, as an ion source for a quadrupole mass analyzer, thereby greatly expanding the application of this Grimm-type source. The authors 695 studied the effect of electrode arrangement, plasma sampling, ion optics, and discharge conditions. The optimized design allowed minimization of the interference from molecular ions and enhancement of the atomic ion intensities.”
GD–time-of-flight (TOF)-MS – (a) Myers, Heintz, Mahoney, Li, and Hieftje, 696 Appl. Spectrosc., 48 (1994) 1337–1346; (b) Heintz, Myers, Mahoney, Li, and Hieftje, 697 Appl. Spectrosc., 49 (1995) 945–954; (c) Pisonero, Costa, Pereiro, Bordel, and Sanz-Medel, 698 J. Anal. At. Spectrom., 16 (2001) 1253–1258; (d) McClenathan and Hieftje, 699 J. Anal. At. Spectrom., 20 (2005) 1326–1331
Gary Hieftje recalled, “The benefits of TOF-MS, first demonstrated in atomic spectrometry by coupling with an ICP ion source (see Sections 12.1.9 and 12.1.10 above) are that it provides full elemental coverage, excellent time resolution, and simultaneous extraction of ions from the source. The first effort in GD–TOF-MS was performed in the Hieftje research lab at Indiana University, mostly with locally designed and constructed TOF instruments. The earliest was with a radiofrequency GD 696 ; a follow-on paper described studies with a planar-magnetron radiofrequency GD. 697 However, these early investigations did not exploit fully the time-resolution capability of TOF-MS. When coupled with a suitably designed GD (e.g., of the Grimm design), time resolution offers depth-profiling measurements of a flat, layered sample. Such studies were performed in the Sanz-Medel research group. For example, in this paper, 698 depth resolution was demonstrated.”
Jorge Pisonero suggested the third article in this cluster 698 and commented, “Glow discharge sources have been coupled also to different kinds of mass spectrometers, including quadrupoles, double-focusing or time-of-flight mass spectrometers. In particular, GD–TOF-MS instrumental developments and applications have been extensively investigated by Sanz-Medel research group in Spain during the last two decades. In our first publication in 2001, 698 a simple and small-sized glow discharge ion source was developed and coupled to a commercial on-axis time-of-flight mass spectrometer for fast simultaneous multielement-selective detection on solid samples.”
Annemie Bogaerts suggested the article by McClenathan and Hieftje 699 and wrote, “The authors 699 evaluated various quantification strategies for multielement analysis by a DC-GD coupled with a time-of-flight mass spectrometer. They described a method for standardless analysis, providing a good accuracy, without the need of calibration factors or internal standards. They could further improve the accuracy of this method up to 5–12% for analyte concentrations above 1%, by means of relative sensitivity factors, which seemed to be rather independent of the matrix.”
GD–Fourier transform-ion cyclotron resonance (FT-ICR)-MS – Zientek and Eyler, 700 J. Anal. At. Spectrom., 19 (2004) 1513–1516
This paper on the coupling of GD with FT-ICR-MS equipped with ion preselection with an external octopole ion guide was recommended by Annemie Bogaerts, who wrote, “This interesting instrumental development for GD–MS could improve the sensitivity for low abundance ions. 700 The external octopole ion guide could remove the low mass, high abundance ions by destabilizing their trajectories, before introducing the other ions (with low abundance) into the FT-ICR analyzer. The authors 700 demonstrated this method for high mass, low abundance Pb and Sn ions in a steel sample.”
GD–Mattauch–Herzog-MS with focal plane array detector – Rubinshtein, Schilling, Ray, Sperline, Denton, Barinaga, Koppenaal, and Hieftje, 701 J. Anal. At. Spectrom., 25 (2010) 735–738
As discussed by Annemie Bogaerts, “This paper 701 describes the coupling of a Mattauch–Herzog mass spectrometer and a Faraday-strip array detector to a DC glow discharge, providing simultaneous determination of several elements and offering improved resolution and detection limits.”
Getters as plasma reagents in GD–MS – Mei and Harrison, 702 Spectrochim. Acta Part B, 46 (1991) 175–182
As noted by Wei Hang, “This is a milestone paper 702 about getting cleaner GD–MS spectra by using getters. Even today, getters are used in several ways to diminish gaseous interferences in GD–MS. Lanthanide elements are prone to form polyatomic species. In this paper, 702 the authors simply used getter reagents as sample matrices in analyzing lanthanum oxide with glow discharge mass spectrometry. Gettering action is considered proportional to the sputter yield and its affinity toward oxygen. It not only reduces gaseous interferences greatly, but also enhances the atomic population of the analyte.”
Use of secondary cathode in GD–MS – Milton and Hutton, 703 Spectrochim. Acta Part B, 48 (1993) 39–52
As explained by Wei Hang, “This is an important paper 703 about using a secondary cathode for non-conductive material analysis, which was followed by many other researchers and commercial instrument companies. The use of a secondary cathode promotes sputtering of insulating samples in a DC glow discharge, which has the advantages of high cost-performance ratio and easy discharge controlling.”
Annemie Bogaerts added, “This paper 703 reports an alternative and creative method for the direct analysis of non-conducting samples by GD–MS, besides mixing with conductive binder, which loses spatial information, i.e., possibility for depth profiling, and besides using RF-sources. This method 703 uses a metallic secondary cathode diaphragm in front of a non-conducting sample surface. Due to the redeposition of a part of the sputtered metal atoms from the secondary cathode, a very thin conductive layer is formed on the non-conductive material. Because the sampling depth is large enough, it allows atomization of the non-conducting sample as well.”
Pulsed GD–MS – (a) Hang, Baker, Smith, Winefordner, and Harrison, 704 J. Anal. At. Spectrom., 12 (1997) 143–149; (b) Lewis, Moser, Dale, Hang, Hassell, King, and Majidi, 705 Anal. Chem., 75 (2003) 1983–1996
According to Wei Hang, “This influential paper 704 stressed the advantages of pulsed GD in GD–MS. A microsecond-pulsed glow discharge allows very high instantaneous power to be achieved while keeping average power low to maintain a stable discharge. When coupled with a time-of-flight mass spectrometer, it demonstrates significant advantages, including higher signal-to-noise ratios than that of a DC glow discharge source. Important temporal advantages resulted from the pulsed discharge and pulsed mass analyzer, including being able to greatly reduce the interference from gas species and polyatomic species.”
Jorge Pisonero suggested the paper by Lewis et al. 705 and commented, “Pulsed-GD results in the formation of a dynamic plasma with different dominant ionization processes. In this sense, TOF-MS are very suitable mass spectrometers to be coupled to pulsed-GDs due to their fast time gating capabilities. These advantages were considered for a multidimensional analysis of gas samples (e.g., series of aromatic and halogenated hydrocarbons) for the first time as presented in this work. 705 In particular, a millisecond-pulsed glow discharge was employed for time-gated generation of elemental, structural, and molecular ions. A gas chromatograph was coupled to the ms-pulsed-GD–TOF-MS for the determination of mixtures containing benzene, toluene, o-xylene, cymene, tert-butylbenzene, carbon tetrachloride, chloroform, chlorobenzene, tetrachloroethane, and dichlorobenzene. Spectra were collected at three separated time regimes: pre-peak, plateau, and afterglow, to achieve elemental information, structural information as ascertained from molecular fragmentation, and molecular M+ and MH+ ions, respectively.”
Fast-flow GD–MS – Beyer, Feldmann, Gilmour, Hoffmann, and Jakubowski, 706 Spectrochim. Acta Part B, 57 (2002) 1521–1533
Volker Hoffmann noted, “The good performance of the Grimm-type source also in GD–MS encouraged several groups, including my own, to use this approach. During my work in the laboratory of Norbert Jakubowski in 1989, I noticed the small sampling distance in his Grimm-type source, but understood only much later that this together with low flow, pressure and power were needed to obtain enough sensitivity. Several groups boosted sensitivity by using flow tubes, which guide the sputtered material to the sampler. This development led to the so-called fast flow, high power sources. 706 The success of European projects on the development of new GD instrumentation is reflected in these two articles,707,708 where a fast flow GD–MS instrument and a RF-GD–TOF instrument were developed and introduced into the market.”
Particle beam-GD–MS for molecular analysis of liquid samples – Quarles, Niemann, and Marcus, 709 J. Anal. At. Spectrom., 25 (2010) 1780–1786
Annemie Bogaerts summarized the key points of this work 709 as “the application of a commercial gas chromatography (GC) mass spectrometer for liquid chromatography particle beam GD–MS. The authors 709 optimized the nebulization characteristics, GD source temperature and plasma conditions for caffeine as a test compound.”
Molecular interferences in GD–MS – (a) King, McCormack, and Harrison, 599 J. Anal. At. Spectrom., 3 (1988) 883–886; (b) McLuckey, Glish, Duckworth, and Marcus, 598 Anal. Chem., 64 (1992) 1606–1609
David Koppenaal recommended these two papers598,599 and noted, “These two papers598,599 are related to a study of molecular isobaric interferences in glow discharge mass spectrometry. The interferences were removed using gas-phase collisions with triple-quad or ion-trap MS systems in a similar approach as those presented for ICP–MS systems. 596 ”
Glow discharge mass spectrometry (reviews) – Harrison, Hess, Marcus, and King, 710 Anal. Chem., 58 (1986) 341A–356A
Wei Hang opined, “This is the first A-page paper about GD–MS in Analytical Chemistry. 710 It outlined the detailed GD mechanism for ionization, and as a source for mass spectrometry, as well as the introduction of its applications, and is a very readable tutorial paper.”
Annemie Bogaerts added, “Harrison was for me the pioneer for GD–MS in general, this review 710 paper is just one of his many publications.”
Kenneth Marcus elaborated, “In much the same way as Ferreira, Strauss and Human did, 666 Harrison (the godfather of the glow discharge) and co-workers present a well-balanced review 710 that covers various aspects of plasma fundamentals, different ion source geometries, and then a range of analytical applications. The versatility of the ionization source itself was demonstrated through metals analysis, depth profiling, non-conductive samples compacted in metal powder matrices, the analysis of solutions, and the use of lasers as atomizers and probes.”
Radiofrequency (RF) GD–MS
RF-GD as atomization/ionization source for solids mass spectrometry – (a) Coburn and Kay, 711 Appl. Phys. Lett., 18 (1971) 435–438; (b) Donohue and Harrison, 712 Anal. Chem., 47 (1975) 1528–1531; (c) Duckworth and Marcus, 713 Anal. Chem., 61 (1989) 1879–1886
According to Wei Hang, “The paper from Coburn and Kay 711 is an important and influential early stage GD–MS paper, which called people's attention to a glow discharge acting as an ion source for mass spectrometry. The authors 711 used a planar diode discharge system. Positive ions incident on the substrate plane were observed with an electrostatic deflection energy analyzer and a quadrupole mass spectrometer. Several targets were RF sputtered in rare gas discharges and the mass spectra indicate that the sputtered species are subsequently ionized in the discharge by Penning ionization rather than by electron-impact ionization or other ion-molecule reactions. As the first influential RF-GD–MS paper for analytical applications, Duckworth and Marcus 713 used an RF generator to supply the discharge operating potential. A pseudo-continuous plasma was produced which permits the sputtering of electrically insulating materials. This work 713 opened the possibility for GD–MS analyzing samples such as glasses, ceramics, and metal oxides.”
As pointed out by Annemie Bogaerts, “Donohue and Harrison introduced radiofrequency glow discharges in GD–MS, 712 and it was later revisited by Marcus and coworkers, 713 who wrote many publications about it.”
In addition to Wei Hang and Annemie Bogaerts, whose comments are presented above, the article by Duckworth and Marcus 713 was also recommended by Michael Webb, Jorge Pisonero, and Kenneth Marcus. Comments from Michael Webb are: “The most significant difference between direct current glow discharge (DC-GD) and radiofrequency glow discharge (RF-GD) is that the latter can be applied directly to nonconductive samples. This paper 713 describes the considerations in designing an RF-GD specifically for elemental analysis. The resulting design is familiar to current analysts.”
Jorge Pisonero shared a similar view and noted, “The use of radiofrequency glow discharges allows the direct analysis of conductive and non-conductive (limited to a certain thickness) samples. Radiofrequency-GD sources in mass spectrometry were introduced and developed by Duckworth and Marcus. 713 Mass spectra from alloys, metal oxides, and glass matrix samples were obtained with ion currents of major species similar to those obtained using DC-GD.”
Kenneth Marcus added, “For decades, the calling card for GD methods was ‘direct solids elemental analysis’, with the caveat that the sample was electrically conductive, or made to be so. The concept of RF sputtering was known in the semiconductor industry, and had long been postulated to be useful for analytical GD–MS. This work 713 reduced the concept to practice, opening up direct analysis of both insulators and metals.”
Millisecond pulsed radiofrequency GD–MS – Li, Millay, Turner, and King, 714 J. Am. Soc. Mass Spectrom., 15 (2004) 87–102
As noted by Annemie Bogaerts, “This paper proposed using a so-called ‘thermometer molecule’ in millisecond pulsed RF glow discharge TOF-MS. 714 The molecular and fragment ions of this thermometer molecule provided information on the internal energy distributions in the plasma. The authors 714 could distinguish three different temporal regimes, i.e., (i) a prepeak period, with high energy and significant fragmentation, mainly generating atomic ions, (ii) a plateau region with lower energy, to provide mainly structural information, and (iii) an afterpeak period, with low energy, giving rise to intact molecular ions due to soft ionization. Hence, it is clear that a pulsed GD can tune the energy, providing selective ionization and fragmentation, and thus enabling molecular, structural and elemental information.”
Fundamental studies of processes in GD–MS
Diffusion, ionization, and sampling processes in GD–MS – Hang and Harrison, 715 Anal. Chem., 69 (1997) 4957–4963
Gerardo Gamez commented, “In this paper, 715 Hang and Harrison measured the temporal evolution of the sample and plasma gas ion signals as a function of different parameters, like cathode-sampling orifice distance and pressure, enabled by pulsing the GD at microsecond duration. Their results show the critical role played by diffusion and the place of origin of the ions generated in the GD source as evidenced by the differences in the intensity temporal profiles of plasma gas ions versus sputtered ions. Of particular note is their use of simple diffusion models to fill the gap between their observations and the theory. The results had a significant impact on the development of GD source fast-flow designs for MS.”
Plasma quenching by hydrocarbon in pulsed millisecond DC-GD–MS – Fliegel and Günther, 716 J. Anal. At. Spectrom., 26 (2011) 2052–2057
As suggested by Annemie Bogaerts, this article 716 reported “a study of the plasma chemistry of single plasma pulses when introducing organic solvents. Small amounts of solvents gave already strong quenching of the afterpeak ion signals. This study allowed information about the plasma chemistry during quenching to be obtained. This information is important in the case of transient sample introduction systems with a pulsed glow discharge. 716 ”
Depth profiling of samples by GD
Early work on depth profiling of samples by GD – (a) Coburn and Kay, 652 Appl. Phys. Lett., 19 (1971) 350–352; (b) Greene and Whelan, 717 J. Appl. Phys., 44 (1973) 2509–2513; (c) Belle and Johnson, 718 Appl. Spectrosc., 27 (1973) 118–124; (d) Berneron, 719 XVIII Colloquium Spectroscopicum Internationale, Volume 1 (1975) 263–267; (e) Hofmann, 720 Surf. Interface Anal., 2 (1980) 148–160
Michael Webb recommends this pair of articles652,718 because “Coburn and Kay 652 showed that by sputtering sample layers sequentially, a glow discharge produces a signal as a function of time that is related to the sample's composition as a function of depth. Notably, this was done using a radiofrequency glow discharge and so could be applied to either conductive or non-conductive samples. Although a relationship between time and depth was clear, it was not calibrated in this study, nor was the relationship between signal and concentration. Later works by this group also noted that the design also produced sputtering of the sample holder, which led to a background signal. Although a correlation between glow discharge as a function of time and the composition of a sample as a function of depth had previously been shown, Belle and Johnson's paper 718 is a significant turning point in the use of glow discharge for depth profiling. This paper made use of a Grimm-type lamp and added calibration of both concentration and depth, so that results could be given in those terms rather than signal and time. That said, it is important to realize that this paper 718 did not consider important factors in these calibrations such as variations in sputtering rate as the sample composition changes.”
Gerardo Gamez added his comment and said, “The paper by Coburn and Kay 652 is significant not only because it is one of the earliest developments of glow discharge as an ionization source for spectrochemical analysis via mass spectrometry but also because the GD is operated on radiofrequency power. Furthermore, it shows the depth profiling capabilities of GD–MS. The paper by Belle and Johnson 718 is one of the earliest studies, published in English, which demonstrates the depth profiling potential of GD–OES. Surface depth profiling is one of the unique features of GD–OES that has had significant impact in the wide area of thin-film analysis. An even earlier study by Dogan, Laqua, and Massman 643 also shows early Grimm-type GD–OES depth profiling capabilities and I would recommend that manuscript to those who enjoy reading in German.”
Volker Hoffmann summarized the paper by Coburn and Kay 652 as “Here, for the first time, sputtering and ionization by a glow discharge was used in combination with mass spectrometry for analytical purposes. 652 Remarkably, already at this time radiofrequency glow discharge was applied.” Volker Hoffmann also recommended the review article on quantitative depth profiling in surface analysis by Siegfried Hofmann and remarked, “Besides accurate measured data, also deep insight into depth profiling by sputtering is essential, where the work of Siegfried Hofmann 720 must be cited. For the evaluation and comparison of depth profiles, measured with different instruments and conditions, the use of clear definitions of depth resolution is essential. Without using the same definition or none at all, there were and still are discussions in the GD community about the achieved or ultimate depth resolution. There is a big difference between the possibility to obtain information about monolayers 721 and to get depth resolution in this range.”
Gary Hieftje summarized, “This study 652 is particularly noteworthy because it not only is the first paper that employs a radiofrequency glow discharge for analysis but also because it uses mass-spectrometric detection and suggests use of a glow discharge for depth-resolved analysis.”
Arne Bengtson shared a different view and recommended a pair of articles717,719 on thin-film analysis with GD. The paper by Greene and Whelan 717 was submitted later than that of Coburn and Kay 652 by only three weeks, and reported the use of a DC-GD and emission spectrometry for thin-film samples. Arne Bengtson opined, “This paper 717 is important because it is the first where a glow discharge source was used for compositional depth profiling of surface films in combination with optical emission spectroscopy. However, the source used was not the emerging ‘industrial standard’ Grimm type, and the application to epitaxial semiconductor films was rather unusual at that time. Even so, this work 717 is definitively an important milestone in the development of this field of spectrochemical analysis.”
Arne Bengtson continued, “Using the Grimm-type glow discharge source, it was shown that the sputtering produced by ionic bombardment of the sample enables the depth repartition of several elements to be made in the same run. This was one of the first works 719 on depth profiling using a glow discharge source, and it had a tremendous impact on the development of this technology for industrial purposes. Roger Berneron 719 worked in a research institute closely linked to the French steel industry (Institut de Recherge de la Sidérurgie), and his research rapidly sparked the development of commercial instruments introduced into the R&D labs of the steel and manufacturing industry.”
Sputtering rate in GD – (a) Boumans, 722 Anal. Chem., 44 (1972) 1219–1228; (b) Payling, 723 Surf. Interface Anal., 21 (1994) 785–790; (c) Payling, 724 Surf. Interface Anal., 21 (1994) 791–799; (d) Wilken, Hoffmann, and Wetzig, 725 J. Anal. At. Spectrom., 18 (2003) 1141–1145
Gerardo Gamez gave an overview of this cluster of articles and said, “Something unique about glow discharge sources is the direct solid sampling afforded through the sputtering process. The paper by Boumans, 722 published only four years after Grimm's paper 642 above, describes for the first time a linear approximation of the relationship between sputtering rate and the discharge parameters of voltage and current, with an implicit relationship to pressure. The findings have also been instrumental for the development of quantification theory in glow discharge studies. More than 20 years later, Payling published a two part study723,724 to modify the equation proposed by Boumans with the introduction of a non-linear dependence on the voltage, which is the way a sputtering rate term is now included in emission intensity relationships.”
The work by Boumans 722 was also recommended by Michael Blades, Volker Hoffmann, Kenneth Marcus, and Jorge Pisonero. As noted by Michael Blades, “This paper 722 explores the application of the Grimm discharge, 642 measures sputtering rates, and provides details of the sampling geometry. It forms the basis for the first understanding of the fundamental aspects of glow discharge lamp analysis.” Kenneth Marcus added, “Boumans was, as they say, ‘an old spark source guy’ at the time. This paper 722 was the first detailed look at the fundamentals of how the Grimm-type glow discharge actually operated and how monitoring of discharge conditions (voltage and current) could provide insights into fundamental processes. His discovery of a threshold voltage, above which sputtering occurred, has been a consistent concept (referred to in GD circles as the Boumans equation) and is still included in all GD–OES quantification packages. Interestingly, it was his only foray into GD–OES, though he always appreciated the method.”
Volker Hoffmann concisely summarized the work 722 and noted, “Paul Boumans 722 revealed that independent of the actual pressure the sputtered mass per time depends linearly on discharge voltage and current – a very basic correlation for quantification in GD.”
The importance of this cluster of studies is further elaborated by Jorge Pisonero as “Direct solid analysis using glow discharge spectroscopy is initially based on the sputtering of the sample surface. This process results in the extraction of atoms that are afterwards ionized and/or excited in the discharge. In this context, Paul Boumans 722 showed that the sputtering process in Grimm-type glow discharges can be described by a simple relation between the sputtering rate and the discharge parameters. In particular, he introduced a linear relationship (known nowadays as ‘Boumans equation’) between the mass sputtered per unit of time and the product of the current and operating voltage. Moreover, Boumans already highlighted that: ‘this empirical relationship between the sputtering rate and the operating parameters of the glow discharge allows the evaluation of spectral-line intensities as a function of the discharge parameters at constant sputtering rate.’ 722 In 1994, Richard Payling 724 suggested a slight modification to the Boumans equation when he found that sputtering rates were not quite linear with voltage but with voltage to the power of 0.74 (empirical value). Nevertheless, when both equations are plotted together, they appear very similar; therefore, many continue to use the original Boumans equation.”
Volker Hoffmann noticed, “The sputtering rate decreases with the temperature of the sample, which may explain deviations from the linear Boumans equation 722 at high power and differences between experiments when cooling of the sample is low, different or missing. This behavior also explains high sputtering rates observed with pulsed discharges operated at low duty cycle (of course corrected by the duty cycle) or when sources of smaller diameter are used at the same power density. There are different options for the determination of the essential sputtering parameter in glow discharge spectrometry. Even if the measurement of mass loss by weighing has more historical meaning and is less accurate and precise, because the mass loss is very low and there is redeposited material at the crater wall, this method is still used. Nowadays, the measurement of crater volume and sample density mostly is used. In this work, 725 it was shown that the three-dimensional measurement of a crater is possible with a precision of 1% RSD. Density measurements can be done even more precisely and accurately. The possibility to calculate the sputtering factor of the standard model based on calibration curves, which was presented by Weiss, 726 is very useful in practice. However, for fundamental research and calibration of specific elements (e.g., H and O) the real sputtering rate must be measured.”
Concept of emission yield and quantitation theory in GD–optical emission spectrometry (OES) – (a) Bengtson, 727 Spectrochim. Acta Part B, 40 (1985) 631–639; (b) Pons-Corbeau, 728 Surf. Interface Anal., 7 (1985) 169–176; (c) Bengtson, 729 Spectrochim. Acta Part B, 49 (1994) 411–429; (d) Payling, 730 Surf. Interface Anal., 23 (1995) 12–21; (e) Bengtson and Nelis, 731 Anal. Bioanal. Chem., 385 (2006) 568–585
As explained by Gerardo Gamez, “This cluster of articles deals with the development of quantitation theory in GD–OES, which requires more than one paper. An excellent big picture and very complete overview was presented by Bengtson and Nelis in a review paper 731 towards which I would direct anybody trying to become familiar with the topic. Nevertheless, if I had to pick landmark papers on this topic, I would include those by Pons-Carbeau, 728 Bengtson, 727 and Payling, 730 which build the relationship of the emission yield to current, potential above threshold, and less significantly to pressure. These have greatly influenced the development of quantitation, especially toward depth profiling, and the matrix independence, which serve as a basis for multi-matrix calibration in GD–OES.”
Besides Gerardo Gamez, the article by Bengtson published in 1985 727 was also recommended by Annemie Bogaerts, Gary Hieftje, and Volker Hoffmann. Volker Hoffmann highlighted that “The implementation of the quantification algorithm of Arne Bengtson 727 pushed the application of GD–OES in industry and research, especially for depth profiling, where the matrix changes between layer and substrate.” Annemie Bogaerts also pointed out that this paper 727 is “one of the first studies on depth profiling by GD–OES, 727 which later became routine analysis for many applications.” Gary Hieftje added that “This paper 727 provides the foundation for the algorithm still used by many manufacturers of GD–OES instruments for performing depth-resolved analysis of solid samples.”
The article by Bengtson published in 1994 729 was recommended by Jorge Pisonero and Kenneth Marcus. As noted by Jorge Pisonero, “Quantitative depth profile analysis using glow discharge optical emission spectrometry is mainly based on the concept of emission yield (emission intensity per sputtered weight). This concept and other alternative quantification methods that also incorporated compensation for variations in excitation parameters were studied in detail by Bengtson at the Swedish Institute for Metals Research. 729 ”
Kenneth Marcus added, “This is the seminal paper 729 in terms of setting the benchmarks of how one employs a GD–OES source (solely DC at that point) for the depth-resolved analysis of industrially relevant materials. It presents an outstanding blend of fundamental plasma physics and how source operation parameters affect the use of the sources in depth profiling. Much of the understanding dates back to Boumans's work, with the introduction of the concept of the emission yield as a means of normalizing elemental responses.”
In addition, Kenneth Marcus recommended the review by Bengtson and Nelis 731 with an annotation: “While spark source optical emission spectrometry is still the benchmark metal foundry method, the advantages for GD–OES are two fold, depth profiling and ease of quantification. The underlying concept, known previously in GD–MS, is the fact that the plasma excitation efficiency is virtually independent of the sample type. This allows the use of emission intensity ratios to perform semi-quantitative analysis, with corrections to sputter rates improving quantitation using the aforementioned Boumans equation. Bengtson and Nelis 731 describe these concepts and their ramifications in quantitative depth profiling applications.”
Emission yield and calibration method in GD–OES (review) – (a) Weiss, 732 Spectrochim. Acta Part B, 61 (2006) 121–133; (b) Weiss, 726 J. Anal. At. Spectrom., 30 (2015) 1038–1049
According to Volker Hoffmann, “The evaluation of data in GD–OES was developed empirically. For example, there is no theory existing about the prediction of the sputtering rate of an unknown sample and therefore also for samples with known elemental composition the sputtering rate cannot be calculated. Nevertheless, the underlying physics helps to understand the so-called standard model and to improve the existing evaluation programs. In this review article, 732 Zdeněk Weiss published for the first time a comprehensive description of this link between glow discharge theory and experiment. In another review article 726 by Zdeněk Weiss, the different options for evaluation of GD–OES data are reviewed, and accuracy and precision are discussed. Even without knowledge of the physical background, based on the methods outlined in this review, 726 an experienced user will find the best data evaluation.”
Monolayer depth analysis with radiofrequency-GD–OES – Shimizu, Payling, Habazaki, Skeldon, and Thompson, 721 J. Anal. At. Spectrom., 19 (2004) 692–695
This paper on monolayer depth analysis with RF-GD–OES was recommended by Annemie Bogaerts, Volker Hoffmann, and Jorge Pisonero. According to Jorge Pisonero, “In a glow discharge, sputtering particles penetrate to a depth of about 2 nm in the sample, but the sputtered (ejected) particles might arise from nearer the surface. In this sense, depth profile analysis of sub-nanolayers was for the first time demonstrated by Shimizu. 721 In particular, radiofrequency (RF) GD–OES was employed for the depth profile analysis of a monolayer of thiourea adsorbed on a mirror-polished copper substrate. Signals from different elements were separated and located in the order that was expected from the orientation of the thiourea molecules adsorbed on the copper substrate.”
Volker Hoffmann added, “The strength of GD spectrometry clearly consists of the possibility to analyze samples first from the upper surface and later deep inside the sample (bulk analysis). Even though it became clear already at the very beginning that GD spectrometry delivers reproducible information about the first atomic layers, because of instrumental difficulties (e.g., at fast data acquisition) it was only Shimizu et al., 721 who in 2004 reported for the first time the analysis of monolayers. This observation was soon confirmed by other authors, but the interpretation is still difficult and discussion controversial.”
Annemie Bogaerts pointed out that this work 721 is “the first example of depth profiling analysis of a layer of sub-nanometer thickness by RF-GD–OES. 721 This allows the application of RF-GD–OES to expand to monolayer analysis or detecting adsorbed molecules on surfaces. The authors 721 stated in this paper that RF-GD–OES has unique capabilities for fast and sensitive depth profiling of surface regions, with depths ranging from one atomic layer to several tens of microns, for almost all elements in the periodic table, including conducting and non-conducting materials.”
Depth profiling with direct current and radiofrequency Grimm-type GD–MS – Pisonero, Feldmann, Bordel, Sanz-Medel, and Jakubowski, 733 Anal. Bioanal. Chem., 382 (2005) 1965–1974
Gerardo Gamez noted, “The capabilities of depth profiling in GD–MS were demonstrated very early by Coburn and Kay 652 but did not catch on the same way it did for GD–OES. Nevertheless, the last two decades have seen a resurgence in this area and this paper, 733 published almost 35 years after Coburn and Kay, 652 is a great example of the work that served as an inflection point. The main contribution of this paper 733 was the simple but elegant modification of the glow discharge ion source geometry by increasing the distance between the flow tube and the sample surface, which allowed the production of flat-bottomed sputtering craters critical for depth profiling. The improved design stemmed from understanding the pressure heterogeneity distribution around the sample surface of the original design and its effect on the crater shape. One of the biggest lessons for early-stage researchers here is that the older literature is an excellent source of good ideas that may not have had the immediate impact at the time, for any number of reasons, but that are worth revisiting when armed with the leverage provided by other advancements in the field.”
Surface mapping with GD and imaging spectrometer – (a) Webb, Hoffmann, and Hieftje, 734 Spectrochim. Acta Part B, 61 (2006) 1279–1284; (b) Gamez, Ray, Andrade, Webb, and Hieftje, 735 Anal. Chem., 79 (2007) 1317–1326
Volker Hoffmann recommended these two papers734,735 and noted, “The Hieftje group734,735 was very active to investigate and apply the features of pulsed GD–OES for imaging. During my work in the Hieftje group in 2001, we tried to improve the depth resolution of GD–OES by use of direct imaging of the flat centre of the crater, application of a pulsed DC discharge and gated detection. It turned out that diffusion is too fast for efficient discrimination of the crater edge effect. However, in this way using a pulsed discharge we found improved lateral resolution and pursued continued research in Bloomington,734,735 Münster, and Dresden.”
Gary Hieftje added, “It was the insight of Volker Hoffmann that a pulsed discharge will provide better lateral spatial resolution than a continuous discharge, because the excitation pulse can be terminated before sputtered atoms have time to diffuse very far. Along with Volker, and additional insights from other cited co-authors, we characterized the effect of discharge parameters (current, voltage, duration, pressure) on spatial resolution and sensitivity, 734 and showed that the same considerations could be applied to both DC and radiofrequency discharges, 735 a finding that led Gerardo Gamez to suggest (and demonstrate) that it can be used to image silver-stained proteins separated on a gel plate. The ultimate goal would be to achieve not only lateral spatial resolution along a sample surface, but also depth-resolved information for true three-dimensional characterization of both conductive and non-conductive samples.”
Annemie Bogaerts remarked on the key points of the first paper in this cluster 734 as a “very interesting application of GD–OES for obtaining information on elemental surface distributions. 734 Pulsing the glow discharge significantly improved the spatial resolution, and a large impact of pulse frequency and pulse width was observed, as well as of applied voltage, pressure, and gas flow rate. These effects could be explained by atomic transport in the plasma. Combined with gated detection, this surface mapping allows analyte transport in a glow discharge plasma to be studied.”
As detailed by Gerardo Gamez, “The significance of this paper 735 lies in the newly afforded access to mapping capabilities by GD–OES with RF powering schemes, which also allowed the development of an application for biopolymer elemental mapping. I remember having a blast putting together the RF glow discharge lamp from old parts scavenged from around the Hieftje lab ‘playground’ at Indiana University Bloomington in order to show Gary that this might work. The ‘Frankenstein’ RF GD lamp power supply was an old waveform generator connected to an amplifier and then through an impedance matching network made from pieces of old ICP systems where I had to manually turn the cranks to get it in tune.”
Use of restrictive anode array masks for GD mapping – Kroschk, Usala, Addesso, and Gamez, 736 J. Anal. At. Spectrom., 31 (2016) 163–170
As noted by Annemie Bogaerts, this article is “another interesting paper 736 on obtaining spatial information from the lateral dimension, by means of a pulsed power supply. At short pulses, sputtered species cannot travel far before the end of the excitation pulse. Information on the lateral distribution of the sample surface composition could be obtained from time-gated optical detection. Such information is of great interest for various applications, ranging from materials science to biology. Especially, the short acquisition times make this method of GD mapping of high value for very high-throughput chemical imaging. While GD–OES elemental mapping had before been illustrated for small surface areas, this paper 736 proposed various GD configurations for samples of 10 cm diameter. A so-called restrictive anode array mask design allowed a lateral resolution of 1 mm for large area samples.”
Glow discharges with liquid electrode
Development of GDs with liquid electrode as an analytical source
Development of the electrolyte-cathode discharge (ELCAD) – (a) Cserfalvi, Mezei, and Apai, 737 J. Phys. D: Appl. Phys., 26 (1993) 2184–2188; (b) Cserfalvi and Mezei, 738 J. Anal. At. Spectrom., 9 (1994) 345–349
As commented by Michael Webb, “This pair of papers737,738 shows the first use of an atmospheric-pressure glow discharge with an aqueous solution electrode for the purpose of detecting and quantifying dissolved metals. This atomic emission excitation source, initially named an electrolyte-cathode discharge (ELCAD), had advantages over traditional sources including using relatively little power and no compressed gases. Although there was some delay before its importance was widely realized, the past 5–10 years have shown a surge of related excitation sources useful for a wide variety of samples and analytes. All of these sources (including solution-cathode glow discharge, liquid-sampling atmospheric-pressure glow discharge, and flowing-liquid cathode atmospheric-pressure glow discharge) are grounded in Cserfalvi et al.'s initial work.737,738”
Volker Hoffmann shared a similar view and stated that “I like to point out the work of Cserfalvi and coworkers 737 in Budapest, which started very early with the application of glow discharge for the analysis of liquids.”
José Broekaert recommended the article by Cserfalvi and Mezei 738 and wrote “A glow discharge with the solution to be analyzed as the cathode for optical emission spectrometry has been described. 738 It is the basic paper of a unique approach using glow discharges at atmospheric pressure for direct solution analysis.” This same article 738 was also suggested by Kenneth Marcus because “This is the primary conceptual paper 738 initiating the field of liquid-based glow discharges operating at atmospheric pressure, the ELCAD source. In fact, to that point, it was not believed that a GD (as defined by its current–voltage characteristics) could be operated at atmospheric pressure. While the operation parameters, inclusive of liquid feed rates of up to 10 mL per minute, were not practical, the results spurred entire new ways of thinking about alternatives to ICP–AES.”
Liquid sampling–atmospheric-pressure glow discharge (LS–APGD) – (a) Marcus and Davis, 739 Anal. Chem., 73 (2001) 2903–2910
As recounted by Kenneth Marcus, “Based principally on skepticism of the operation of the ELCAD source 738 as a glow discharge, this design 739 deviates appreciably from that approach, inclusive of a nested micro-bore glass capillary through which the electrolyte/sample solution was fed. Abnormal glow discharge I–V characteristics were confirmed. Total sample consumption was achieved at feed rates of less than 0.3 mL min−1. The ability to switch powering modes (which electrode served as the cathode) suggested alternative operation mechanisms than proposed for ELCAD. Total sample consumption was seen as being a promising attribute regarding potential portability.”
Wei Hang commented, “This paper 739 describes a compact, economical, yet effective atmospheric-pressure glow discharge emission source for the direct analysis of solution. It directly utilized an electrolytic solution containing the analyte as one of the discharge electrodes. The electrical current across the solution/gas phase interface caused the heating and volatilization of the analyte species. Collisions in the discharge region immediately above the solution surface resulted in optical emission that was characteristic of the analyte elements.”
Solution-cathode glow discharge (SCGD) – (a) Webb, Andrade, Gamez, McCrindle, and Hieftje, 740 J. Anal. At. Spectrom., 20 (2005) 1218–1225; (b) Webb, Andrade, and Hieftje, 741 Anal. Chem., 79 (2007) 7899–7905
As remarked by Annemie Bogaerts, “Spectroscopic and electrical studies were performed for the SCGD, 740 in a wide range of gap size, applied current, pH, conductivity, and flow rate of the solution, in order to obtain more insight into the underlying mechanisms. The authors 740 demonstrated the potential of this system, being sensitive and inexpensive for the elemental analysis of liquids, but with limitations as a multi-elemental technique.”
Kenneth Marcus noted, “With a design more like the ELCAD 738 than the LS–APGD, 739 the SCGD 740 provided the ability to operate at lower flow rates and eventually the use of sample flow injection into the moving electrolyte stream. Detailed spectroscopic studies involving the spatial distribution of analyte and background species were complemented by fundamental characterization of the I–V relationships. Limits of detection on the tens of parts-per-billion level were obtained.”
Volker Hoffmann concisely summarized the importance of the first paper 740 in this cluster as “The work by Cserfalvi et al. 737 on GD with solution cathode was continued by the Hieftje group 740 and commercial activities are now going on.”
Michael Webb recommended another paper 741 on this topic and recounted, “An earlier paper 740 on the SCGD variety of ELCAD-like plasma was greeted with a comment to the effect that a dog speaking at all is interesting, even if the speech isn't extraordinary. In other words, some thought ELCAD-like plasmas were interesting because they worked at all, but it wasn't clear to everyone that they were useful yet. There was important work done in the decade and a half after Cserfalvi et al.737,738 introduced the ELCAD, but few research groups were involved. This paper 741 marked something of a turning point in that regard. Primarily by shrinking the cathode size, detection limits were improved by about an order of magnitude. This improvement helped bring much wider interest to the field.”
Molecular dynamics calculations on plasma sputtering of water molecules – Nikiforov, 742 High Energy Chem., 42 (2008) 235–239
Volker Hoffmann noted, “In this paper, 742 Nikiforov explains the transfer of atoms and molecules in a liquid into an atmospheric-pressure glow discharge (APGD) by means of molecular-dynamics calculations. He found that during an impact of O2+ ions on the surface of liquid water, the sputtering yield of H2O molecules varies from 2 to 450 molecules per ion as the ion energy is increased from 50 to 500 eV.”
Glow discharges with liquid electrode as an ionization source for mass spectrometry
Liquid sampling–atmospheric-pressure glow discharge (LS–APGD) for elemental mass spectrometry – Marcus, Quarles, Barinaga, Carado, and Koppenaal, 743 Anal. Chem., 83 (2011) 2425–2429
Kenneth Marcus recounted, “For the previous dozen years, the liquid-GD field had totally been dedicated to applications involving optical emission detection; the obvious approach regarding reduced-format instrumentation. The successful coupling to a commercial, organic mass analyzer (Orbitrap) without any modifications to the pumping or ion optics system 743 was unexpected. More surprising, the ability to produce atomic mass spectra from such a low power (<5 W) source was also unexpected. Sub-nanogram elemental sensitivity was easily achieved. While the driving force for using the ultra-high resolution afforded by an Orbitrap analyzer is straightforward in concept, the use of that type of analyzer for quantitative measurements was not.”
Liquid sampling–atmospheric-pressure glow discharge (LS–APGD) for molecular mass spectrometry – Zhang and Marcus, 744 J. Anal. At. Spectrom., 31 (2016) 145–151
This article 744 was recommended by Kenneth Marcus, who explained, “A new set of capacities for liquid-GD systems was demonstrated with the coupling of the LS–APGD to an ion trap mass spectrometer. 744 ‘Molecular’ mass spectra, closely mimicking those of atmospheric-pressure chemical ionization, were obtained for test molecules including caffeine, sinapinic acid, a flavonoid, a synthetic lipid, and the heme-protein myoglobin. A limit of detection of 43 pg of caffeine was demonstrated.”
Solution-cathode glow discharge (SCGD) for molecular mass spectrometry – Schwartz, Shelley, Walton, Williams, and Hieftje, 745 Chem. Sci., 7 (2016) 6440–6449
Annemie Bogaerts recommended this article 745 “as a novel approach for ionization and controlled fragmentation of peptides at atmospheric pressure. The solution-cathode GD allows direct contact between the liquid and the plasma, enabling volatilization, ionization, and fragmentation of peptides, depending on the discharge current, i.e., a low current yielded significant fragmentation, while a high current resulted in mainly singly and doubly protonated molecular ions. This method provides information about the amino-acid sequence of proteins and about post-translational modification of proteins. 745 ”
Atmospheric-pressure glow discharge (APGD) for ambient desorption ionization–mass spectrometry (ADI–MS)
Atmospheric-pressure chemical ionization source with afterglow of a GD – Andrade, Shelley, Wetzel, Webb, Gamez, Ray, and Hieftje, 746 Anal. Chem., 80 (2008) 2646–2653
As noted by José Broekaert, “A glow discharge at atmospheric pressure operated in the flowing afterglow mode for the generation of excited species and ions has been described and characterized. The paper 746 describes a new atomic emission and ion source with versatile sampling capabilities.” Zhanxia Zhang shared a similar view.
Annemie Bogaerts added, “This atmospheric-pressure glow discharge (APGD) in flowing afterglow mode, also called ‘flowing atmospheric-pressure afterglow’ (FAPA), 746 can be used for organic mass spectrometry. When mixing the species produced by the APGD with ambient air, reagent ions are created (including ionized water clusters and NO+), that give rise to ionization of gaseous organic compounds, allowing many different compounds to be ionized.”
Ionization matrix effects in plasma-based ADI–MS – Shelley and Hieftje, 747 J. Anal. At. Spectrom., 25 (2010) 345–350
Annemie Bogaerts commented, “This paper 747 describes the study of three different plasma-based ADI–MS sources, i.e., flowing atmospheric-pressure afterglow (FAPA), Direct Analysis in Real Time (DART®), and low temperature plasma probe, in terms of ionization-related matrix effects. The authors 747 reported that the FAPA was the least affected by ionization matrix effects. In addition, DART® exhibited no matrix effects when the proton affinity of the matrix species was below that of the analyte, both FAPA and low temperature plasma probe still suffered from some matrix effects in this case. It is clear that matrix effects are important for both qualitative and quantitative analyses with ADI–MS.” Zhanxia Zhang shared a similar view.
Tunability of the ionization modes of the flowing atmospheric-pressure afterglow (FAPA) ADI–MS source – Badal, Michalak, Chan, You, and Shelley, 748 Anal. Chem., 88 (2016) 3494–3503
This paper 748 was recommended by Annemie Bogaerts, who remarked, “FAPA is an interesting source for ambient desorption/ionization MS. 748 By tuning the ‘hardness’ of the ionization, either molecular ion, fragment ion, or possibly atomic ion mass spectra can be obtained.”
Modeling of atmospheric-pressure glow discharge (APGD) – Martens, Mihailova, van Dijk, and Bogaerts, 749 Anal. Chem., 81 (2009) 9096–9108
As recounted by Annemie Bogaerts, “This paper presents modeling of an APGD in helium, showing typical calculation results, such as the potential and electric field distributions, density profiles of the various plasma species, mean electron energy, and the rates of the various collision processes. 749 It discusses the similarities and differences with low-pressure glow discharges. The main differences are a very small cathode dark space region and a large positive column, as well as the dominant role of molecular ions. Some characteristic features of the APGD, such as the occurrence of the different spatial zones in the discharge, were linked to experimental observations. This paper was selected as one of the ‘highlights’ of Analytical Chemistry.”
Analytical Atomic Spectrometry with Other Plasmas (e.g., Microwave-Induced Plasma and Microplasmas)
Microwave-induced plasma (MIP)
Overview and characterization of different types of resonators for MIP – (a) Skogerboe and Coleman, 750 Anal. Chem., 48 (1976) 611A–622A; (b) Beenakker, Bosman, and Boumans, 751 Spectrochim. Acta Part B, 33 (1978) 373–381; (c) Zander and Hieftje, 752 Appl. Spectrosc., 35 (1981) 357–371
As noted by Nicolas Bings, “The use of low-power microwave plasmas as excitation sources in spectrochemistry can be advantageous for a number of analytical problems compared to the application of the well-established ICP. Relatively simple emission spectra are comprised primarily of lines emitted by transitions to the ground state and their inexpensive price are among the advantages. This was considered in detail in the 1970s, which is also the subject of the manuscript by Skogerboe and Coleman. 750 Here, basic developments of various resonators for sustaining microwave discharges are considered and compared with respect to their analytical performance. In detail, the capacitively coupled microwave plasma as well as different Evenson cavities are described and their characteristics are highlighted. The manuscript by Beenakker et al. 751 is of similar focus: The performance of the Beenakker resonator (TM010), which was probably the most widely used microwave resonator at that time in spectrochemistry, is investigated regarding emission spectrometric analysis of liquid samples. From today's point of view, it is interesting to see that such ‘promising’ excitation sources are almost only used in combination with detectors in gas chromatography.”
Michael Blades shared a different paper and commented, “It is a seminal paper 752 on the use of microwave plasmas or MIPs for elemental analysis. In 1981 there were three plasma methods that were being developed for spectrochemical analysis – the ICP, the direct current plasma, and the microwave plasma. The ICP was dominant in terms of numbers and applications but many were intrigued by the compact and inexpensive microwave source. This paper 752 detailed the evolution and potential applications of the microwave plasma and was required reading for a complete understanding of plasma elemental analysis. Many researchers were inspired to build and explore MIPs in their own labs and some made careers from their work.”
MIP with Beenakker cavity – (a) Beenakker, 753 Spectrochim. Acta Part B, 31 (1976) 483–486; (b) Beenakker, 754 Spectrochim. Acta Part B, 32 (1977) 173–187
Gary Hieftje said, “I had the opportunity to review the paper by Kaas Beenakker, 753 later published in Spectrochimica Acta Part B, in which he first described the design and use of his TM010 microwave cavity. Unlike the common Evanson and Broida cavities that were in common use at the time, the Beenakker cavity employed a standing magnetic wave rather than a standing electric wave. As a consequence, the electric field was greatest in the center of the cavity. Moreover, because the standing magnetic wave defined the width of the cavity and not its thickness, the cavity could be as thin as desired, and the electrical field in the center could be raised almost at will. Beenakker demonstrated that this high field could be used to sustain a helium plasma at atmospheric pressure, something unheard of at the time. I immediately contacted Kaas personally and asked that he permit me to fabricate a duplicate cavity. Not only did we later publish a number of papers based on it, but also the highly successful Hewlett–Packard element-selective detector for gas chromatography appeared to be derived from it.”
José Broekaert noted, “A low-power microwave-induced plasma was described, which turned out to be a powerful source for elemental analysis using dry analyte vapors by optical emission spectrometry. The paper 753 first describes a unique source used for element specific detection in gas chromatography especially.”
José Costa-Fernández added, “Low pressure plasmas (e.g., MIP) have constituted a very active research field some decades ago. This paper 753 constitutes an illustrative example of instrumental development in such field. Here, a cavity is designed to produce a MIP in argon and helium at atmospheric pressure using a low-power microwave generator. Further, the MIP is coupled to a gas chromatograph as a selective OES detector for chemical speciation.”
Nicolas Bings expanded the list and shared a similar view, “These two papers753,754 contain the original descriptions of the ‘Beenakker resonator’ to sustain a plasma discharge in He and Ar at atmospheric pressure for elemental analysis by optical emission spectroscopy, e.g., in combination with gas chromatography.”
MIP by a magnetic pinch – Goode and Pipes, 755 Spectrochim. Acta Part B, 36 (1981) 925–929
Alexander Scheeline recommended this article and noted, “In the 1970s, a number of groups recognized that pulsed magnetic fields could heat and confine plasmas, potentially altering the behavior of atomic emission plasmas. The first group to publish was Scott Goode's group at the University of South Carolina. While the approach he and Pipes took 755 (low voltage, high capacitance, microwave discharge) did not end up leading to follow-up developments, their demonstration that excitation temperature could be increased by applying a pulsed magnetic field to a pre-existing plasma was the first in the analytical literature.”
High power MIP for solution analysis – Leis and Broekaert, 756 Spectrochim. Acta Part B, 39 (1984) 1459–1463
José Broekaert recounted, “A microwave plasma torch in which wet aerosols can be introduced was shown to be a useful source for the optical emission spectrometric analysis of solutions. 756 This plasma is operated in a two concentric tube arrangement positioned in a rectangular cavity at up to 800 W and it uses two gas flows. The inner gas flow is argon. For ignition the outer flow is argon as well but is soon switched to nitrogen. Wet aerosols as generated by pneumatic nebulization go centrally through the discharge. The detection limits are about one order of magnitude higher than in ICP–AES, especially for elements with refractory oxides, as are the easily ionized element effects. Nevertheless, the device is a useful alternative to the ICP. It is cheap in operation and later was further developed to a commercially available practical source.”
MIP as detector for gaseous samples in gas chromatography – (a) Sullivan and Quimby, 757 J. High Resolut. Chromatogr., 12 (1989) 282–286; (b) Wylie and Quimby, 758 J. High Resolut. Chromatogr., 12 (1989) 813–818
As noted by Gary Hieftje, “Perhaps the only truly successful element-selective detector for gas chromatography was marketed by Hewlett–Packard. Its design, seemingly based on the TM010 cavity of Beenakker, 753 is described in the paper by Sullivan and Quimby 757 and its application in Wylie and Quimby. 758 The design exploits the feature of the TM010 cavity in that its thickness can be reduced to raise the electrical field in the cavity center. Sullivan and Quimby at Hewlett–Packard achieved an even thinner zone by using a ‘re-entrant’ cavity, in which the outer region was thicker than the center. Although apparently highly successful, production of the Hewlett–Packard detector ended some years ago but a similar system is now being marketed by another firm.”
Microchip-based MIP – Engel, Bilgic, Haase, Voges, and Broekaert, 759 Anal. Chem., 72 (2000) 193–197
José Broekaert recalled, “A low-power microwave-induced plasma sustained in helium flowing through a channel in a quartz chip and powered through microstrips was shown to enable a high-sensitivity determination of mercury through the cold-vapor technique. The paper 759 is a first version of a plasma on a chip with high stability and usefulness for practical analysis.”
Microwave-sustained, inductively coupled, atmospheric-pressure plasma – Schwartz, Cheung, Jevtic, Pikelja, Menon, Ray, and Hieftje, 760 J. Anal. At. Spectrom., 31 (2016) 440–449
Carsten Engelhard recommended this article 760 and said, “Alternative plasma sources always fascinated me. Schwartz et al. 760 reported a microwave-sustained inductively coupled plasma in 2016, which is based on a source concept by the RADOM corporation (Hales Corners, Wisconsin, USA). A dielectric resonator ring is coupled with a 2.45 GHz microwave field to produce a magnetic field that is capable of sustaining an annular plasma. In a proof-of-principle study with optical emission spectrometry detection, limits of detection in the µg L−1 range for solution analysis were reported.”
Thin film plasma and theta pinch discharge
Production and initial characterization of imploding thin film plasma and theta pinch discharge sources for atomic spectrometry – (a) Kamla and Scheeline, 761 Anal. Chem., 58 (1986) 923–932; (b) Kamla and Scheeline, 762 Anal. Chem., 58 (1986) 932–939; (c) Carney and Goldberg, 763 Anal. Chem., 58 (1986) 3108–3115; (d) Carney and Goldberg, 764 Anal. Chem., 58 (1986) 3115–3121
This series of articles is suggested by Alexander Scheeline with annotations: “Nearly simultaneously, my group761,762 and Goldberg's group763,764 published work on the two most-studied types of magnetically constricted discharges. The theta pinch collapsed an argon plasma onto a mandrel composed of or supporting a powder of an analyte, while a Z pinch vaporized a powder off the surface of a vaporized metal film and then compressed the resulting plasma. Both sought improved means to quantify high-melting metals and refractory compounds. Both had similar temporal, electrical, and optical properties. Both dissipated kilojoules in microseconds, giving gigawatt instantaneous power. These papers were ripe with possibility but did not provide analytical figures of merit. Subsequent publications, as cited in immediately following sections of this review, showed that the Z pinch could provide quantitative results for powdered refractory samples, while the theta pinch lacked sufficient vaporization capacity to be generally applicable.”
Analytical performance of theta pinches – (a) White, Lee, and Scheeline, 765 Appl. Spectrosc., 43 (1989) 991–997; (b) Scheeline, Lee, and White, 766 Appl. Spectrosc., 44 (1990) 1183–1187
Alexander Scheeline recounted, “These two papers765,766 looked at the analytical performance of theta pinches. While high excitation temperatures were achieved, emission performance was poor. Two factors were at work. First, an initial discharge firing sintered the sample surface, making vaporization on repeated discharges difficult. Second, the mandrel had higher thermal conductivity than the surrounding plasma. Thus, the sample drained energy from the pulsed discharge without necessarily vaporizing sample. A more careful modeling of thermal energy transfer, heat capacity, and thermal diffusivity might have demonstrated that the mandrel would dissipate heat faster than the plasma could produce it, and such sampling as did occur would be over such a large volume that light collection would be inefficient. Hindsight is clearer than foresight!”
Design and characterization of a theta-pinch imploding thin film plasma source for atomic emission spectrochemical analysis – Navarre and Goldberg, 767 Appl. Spectrosc., 65 (2011) 26–35
According to Alexander Scheeline, “This work 767 was performed while Navarre was a graduate student, completing work in 2002. The much-delayed publication is the definitive study of the use of low thermal mass atomization sources, compressed with a pulsed theta pinch, for atomic emission measurements. The imploding thin film liberates sufficient heat to efficiently vaporize powders, and the theta pinch reheats the vapor thus produced. The heat-transfer problems of using a plasma to heat a bulk solid are thus avoided, at the cost of requiring a finely powdered sample. LIBS, with spatially confined, simultaneous vaporization and excitation, has proven to be what pinch discharges were intended to be – a means to sample anything and obtain atomic emission independent of melting point. However, many LIBS users continue to be baffled that the relative rate of heat transfer from the vaporizing laser to the solid support can lead to fractional melting and vaporization, with concomitant matrix effects. All these effects have previously been seen in DC arc and pulsed pinch spectroscopies.”
Other plasma or discharge
Furnace atomic non-thermal excitation spectrometry (FANES) – Falk, Hoffmann, and Lüdke, 768 Spectrochim. Acta Part B, 36 (1981) 767–771
Heinz Falk recalled, “The FANES emission source separates the atomization and excitation processes, getting the detection power of the graphite furnace AAS in a simultaneous multielement mode. 768 The FANES technique stimulated several further analytical experiments with separated atomization and excitation, for example with the use of tunable lasers.”
Gary Hieftje added, “Although other related activities (see below) preceded it, this paper 768 is responsible for popularizing the name and concept of a ‘tandem source’, in which two sources are combined to yield performance better than either source by itself. Most such tandem sources follow the design of FANES, with the first source selected and optimized to achieve better sample atomization and a second to provide superior excitation or ionization.”
High-frequency excitation of spark-sampled metal vapor – Coleman, Sainz, and Butler, 769 Anal. Chem., 52 (1980) 746–753
Alexander Scheeline notes that while RF excitation of spark-sampled material never developed into a common technique, as did FANES, Coleman's publication 769 on a tandem-source approach precedes Falk's. 768 He added, “While reviewing the current compilation, I learned that both Hieftje and I had overlooked even earlier work. See Sections 16.1.1 and 16.1.3 that describes LIBS plus spark dual excitation in the 1960s! Philosophically, separated sampling and excitation seeks to have each plasma's strengths optimally exploited. Sparks are good at sampling conductors; ICPs are good for exciting sufficiently small particulates. Similarly, lasers are good for sampling any solid, while other plasmas are efficient for excitation. Having two sources is costly in engineering, power, and maintenance. The problem faced by all such methods is the cost-benefit tradeoff.”
Exploding wires and exploding thin films – Holcombe and Sacks, 770 Spectrochim. Acta Part B, 28 (1973) 451–467
Alexander Scheeline explained, “When Richard Sacks moved to the University of Michigan in 1969, it was widely understood that elemental analysis of refractory, nonconductive solids should be performed by mixing powdered samples with graphite and exciting the sample with a DC or AC arc. Sacks's program looked at exploding wires 770 and exploding thin films as a substitute for the arc. He, long-time collaborator Stephen Brewer, and his students published a series of papers from 1973 to 1990, describing how electrically vaporized metallic films771,772 and wires, 773 in some cases modified with surrounding magnetic fields, 774 could excite powders 775 and solution residues 776 with little sample preparation and negligible matrix effects. These papers have fallen into obscurity as the technology was not commercialized. However, the sub-part-per-million detection limits (corresponding to solution detection limits below parts-per-billion) and simple sample preparation warranted greater recognition than was achieved.”
Gary Hieftje recalled, “Dick Sacks was one of the most daring of atomic spectrometrists and had the admiration of most of the community for devising, creating, and evaluating a group of extremely high-power, dangerous sources for producing and exciting atomic vapor. Not only exploding wires and films 770 but also elevated-pressure shock tubes were tested in his laboratory. A tongue-in-cheek suggestion was once made to Dick that he evaluate use of a thermonuclear device as a pulsed light source for atomic fluorescence.”
Atomic Fluorescence, Laser-Enhanced Ionization Spectrometry, and Other Analytical Spectroscopy with Wavelength-Tunable Lasers
Atomic fluorescence spectrometry (AFS)
AFS as a means of chemical analysis – (a) Winefordner and Vickers, 777 Anal. Chem., 36 (1964) 161–165; (b) Winefordner and Staab, 778 Anal. Chem., 36 (1964) 165–168
The article by Winefordner and Vickers 777 was recommended by several scientists including Ove Axner, Michael Blades, WingTat Chan, Stanley Crouch, and Gary Hieftje. As noted by Stanley Crouch, “The Winefordner–Vickers paper 777 was the first description of atomic fluorescence spectroscopy for chemical analysis. The atomic fluorescence technique has found many uses including determining mercury by cold vapor methods and other elements through hydride generation.” Michael Blades expressed a very similar view and noted that it is “a seminal paper 777 on the use of atomic fluorescence for chemical analysis by the pioneer in its application.”
Ove Axner commented, “It was early recognized that AFS is a sensitive and promising technique for detection of atomic species. Pioneering development of the technique into the field of spectrochemical analysis was made by Winefordner et al., first dealing with non-laser fluorescence 777 and then with laser induced fluorescence (LIF) in flames. 779 ”
Gary Hieftje added, “Through both calculations and experiment, the Winefordner group777,778 showed the potential benefits of AFS for elemental analysis. Like emission, fluorescence is isotropic, so can readily be used for multielement measurements. Its sensitivity is inherently higher than for AAS; it is a low-background method and, indeed, it was one of the first methods to demonstrate single-atom detection capability. However, it has failed to acquire a cadre of adherents, in part because of the foothold of AAS by the time of Winefordner's (and others’) publications, and in part because a truly useful tunable laser or other AFS primary source has never appeared. Despite the lack of current activity, these publications represent an important milestone in the development of methods for elemental analysis and Jim Winefordner remains one of the giants in the field.”
WingTat Chan remarked, “The two articles777,778 provide the theory and experimental results of the method of atomic fluorescence flame spectrometry. The first article 777 discusses the theoretical principles and experimental requirements. The second article 778 demonstrates the determination of trace elements in ppm range with large dynamic range using zinc and cadmium Osram lamps and a mercury vapor lamp as excitation sources for atomic fluorescence. Atomic fluorescence is viewed as a complementary method to atomic absorption and emission spectrometry. Elements that emit in the UV region and give poor results by atomic emission could be analyzed using atomic fluorescence. Analytes with weak absorption but appreciable quantum efficiency may fluoresce strongly. The variety of possible sources for excitation that are less expensive than the hollow-cathode lamps (HCLs) is an additional advantage.”
AFS with conventional primary sources and optical filters – (a) Warr, 780 Talanta, 17 (1970) 543–548; (b) Larkins, 781 Spectrochim. Acta Part B, 26 (1971) 477–489; (c) Larkins and Willis, 782 Spectrochim. Acta Part B, 26 (1971) 491–503; (d) Vickers, Slevin, Muscat, and Farias, 783 Anal. Chem., 44 (1972) 930–935; (e) Montaser and Fassel, 784 Anal. Chem., 48 (1976) 1490–1499; (f) Demers, 785 Spectrochim. Acta Part B, 40 (1985) 93–105; (g) Jansen and Demers, 786 Analyst, 110 (1985) 541–545
This set of articles on non-dispersive AFS (NDAFS) systems780–783 was recommended by Alessandro D’Ulivo, who commented, “In flame NDAFS, the use of optical filters limiting the spectral response of solar-blind PMT has been investigated780,783 with the aim to reduce contributions from the background emission of flames. Depending on the type of flame, significant improvements of S/N can be achieved. The development of simple and inexpensive flame NDAFS, based on the availability of solar-blind photomultipliers (160–320 nm spectral response), was described in this two-part article.781,782 Sensitivity is improved due to high optical throughput and simultaneous detection of AFS lines for elements that have fluorescence lines in the UV region. The background emission of flame gases (e.g., OH radicals), a factor limiting the sensitivity, was largely lowered by using nitrogen-shielded flames. The use of conventional, broadband response PMTs combined with optical filters improved the sensitivity in flame NDAFS for elements that have fluorescence lines in the range from 300 nm to about 400 nm. Furthermore, AFS detectors, in particular NDAFS, can be conveniently employed as simple and sensitive element-specific detectors in combination with separation techniques such as chromatography (liquid or high-performance liquid, gas)787,788 using HCLs or high intensity HCL light sources. The combination of separation techniques allows the use of more convenient atomization systems and greatly reduces the risk of interference, scattering and allows for better control of quenching effects.”
The Montaser and Fassel paper, 784 in which a microwave-excited electrodeless discharge lamp was used as the excitation source, was recommended by José Broekaert and Alessandro D’Ulivo. José Broekaert commented, “The use of discharge lamps as primary sources in the case of an ICP as atom reservoir has been shown to enable multi-element trace determinations in solutions. The paper 784 describes the basis and the analytical features of multi-element atomic spectrometry with hollow cathodes as primary sources and an ICP as atom reservoir.”
Alessandro D’Ulivo added, “In order to overcome the problems of flame atomizers in AFS (background emission, scattering and quenching), ICP was proposed 784 as an atomizer for AFS.”
The pair of articles on HCL-excited ICP–AFS was selected by Alessandro D’Ulivo, who noted, “A second, commercially available, multi-element NDAFS used ICP (Baird Corporation, USA) instead of flame atomization, and HCLs as excitation sources.785,786 In spite of these developments, commercially available atomic fluorescence spectrometers were not competitive with other commercially available atomic spectrometric techniques, such as graphite furnace AAS for single element determinations, and ICP–AES or, later, ICP–MS for multi-element determination.”
Multielement AFS through sequentially excited atomic fluorescence – (a) Mitchell and Johansson, 789 Spectrochim. Acta Part B, 25 (1970) 175–182; (b) Zybin, Schnürer-Patschan, and Niemax, 790 Spectrochim. Acta Part B, 47 (1992) 1519–1524
The article by Mitchell and Johansson was recommended by Alessandro D’Ulivo, who remarked, “The first ‘short-lived’ commercially available instrument (AFS-6, Technicon Instrument Corporation, New York) combined the multi-element detection capabilities of AFS with the favorable characteristics of non-dispersive flame AFS + optical filters, and it was the evolution of a prototype developed by Mitchell and Johansson. 789 ”
Gary Hieftje remarked, “Doug Mitchell worked with Baird to develop the AFS-6 spectrometer, based on his work at the New York State Department of Health. Like the original, 789 it sported an array of six (hence, AFS-6) hollow-cathode lamps (HCLs) positioned symmetrically around a flame into which the sample solution was sprayed and in which sample atoms were produced. The HCLs were pulsed sequentially and synchronized with a time-gated detection system, so multielement information could be acquired. The system was never a commercial success, perhaps because of a limitation in the number of elements that could be determined without changing a HCL and perhaps because AAS had already been adopted by so many routine-analysis labs.”
Ove Axner supplemented with an article on the use of diode lasers as the fluorescence excitation sources 790 and commented, “While most systems for laser induced fluorescence (LIF) in graphite furnaces (GF), also often referred to as laser excited atomic fluorescence spectrometry in electrothermal atomizers (ETA), have utilized pulsed ns-long excimer or Nd:YAG pumped dye-lasers, some realizations have utilized other types of lasers, e.g., diode lasers and optical parametric oscillators. This paper 790 provides a demonstration of, and a scrutiny of the advantages (and disadvantages) of, using diode lasers for LIF–GF/–ETA.”
Laser for selective excitation spectroscopy – Measures, 791 J. Appl. Phys., 39 (1968) 5232–5245
The joint explanation offered by Nicoló Omenetto and James Winefordner on the significance of this paper by Measures 791 is: “We would consider this paper 791 as being one of the first theoretical descriptions of the advantages of using lasers in analytical plasma spectroscopy. All the most important concepts describing the interaction of tunable laser radiation with an atomic system can be found here: just to cite a few examples, the saturation of the two levels coupled by the laser, the response time of the system to the excitation function, the time behavior of the excited state population, the importance of the spectral profiles of the excitation and absorption processes, and the conditions necessary to achieve saturation. On the application side, the paper 791 foresees several time- and space-resolved diagnostic possibilities (temperature and electron number density, collisional excitation rates and cross sections). Potassium and barium were chosen for the experimental demonstration of the theory. We recounted that in the early eighties, Measures participated in a conference in Orlando (Florida). At that time Omenetto was visiting the Winefordner labs at University of Florida, and remembers organizing a trip to Orlando with several of Jim's graduate students to meet Measures and discuss with him our laser excited fluorescence experiments in the ICP. We soon found out that Measures was not only a prolific researcher, but also a very tutorial professor sharing ideas and enjoying the research excitement created.”
Early use of tunable dye lasers as excitation sources for AFS – (a) Denton and Malmstadt, 792 Appl. Phys. Lett., 18 (1971) 485–487; (b) Fraser and Winefordner, 779 Anal. Chem., 43 (1971) 1693–1696; (c) Fraser and Winefordner, 793 Anal. Chem., 44 (1972) 1444–1451
Stanley Crouch recommended these two papers779,792 with comments “These two papers,779,792 published nearly simultaneously, describe the first uses of tunable dye lasers as excitation sources for atomic fluorescence spectrometry. Advantages and limitations of laser excitation are discussed.” The Fraser–Winefordner paper 779 was also suggested by Ove Axner, who noted: “This paper 779 together with the one suggested earlier by Winefordner and Vickers 777 have served as the basis for much of the subsequent development of the LIF technique for spectrochemical analysis applications.”
Mikhail Bolshov offered a detailed background and explained the importance of the two articles by Fraser and Winefordner779,793: “Great hopes in the elemental analytical community were aroused after invention of the lasers with smoothly tunable wavelength – dye lasers, tunable diode lasers, optical parametric oscillators. Different laser-based analytical techniques were proposed and developed: LIF, laser-enhanced ionization (LEI), resonance ionization spectroscopy (RIS), and laser opto-acoustic spectroscopy. The spectral brightness of tunable lasers exceeded the brightness of the classical sources of resonance radiation used in atomic absorption (like hollow-cathode lamps or electrodeless discharge lamps) by many orders of magnitude. High spectral brightness of the excitation radiation obviously provides an increase in analytical sensitivity. In many cases the laser intensity is sufficient for saturation of the corresponding optical transition, resulting in the maximum level of the analytical signal and reducing the influence of intensity fluctuations of the excitation source on the analysis precision. Several years were spent to estimate the real advantages of the tunable laser-based spectrometric techniques. Among the laser-based techniques for elemental analysis, LIF demonstrated the most impressive results. In these two papers,779,793 the first application of tunable lasers for atomic fluorescence spectrometry are reported. The pulsed dye laser pumped by a N2-laser covered the spectral range from 350 to 630 nm, and thus allowed the detection of a number of analytes with sufficient resonance lines in the above spectral range. A flame was used as the atomizer. The main advantage of LIF was pointed out – possibility to reduce laser stray light if the atomic level structure of an analyte allows direct-line fluorescence on the shifted spectral line. Increases in signal-to-noise ratios up to ten times for direct-line fluorescence as compared to resonance fluorescence were demonstrated.”
Theory and processes in laser saturated atomic resonance fluorescence – (a) Piepmeier, 794 Spectrochim. Acta Part B, 27 (1972) 431–443; (b) Piepmeier, 795 Spectrochim. Acta Part B, 27 (1972) 445–452; (c) Bolshov, Zybin, Koloshnikov, and Koshelev, 796 Spectrochim. Acta Part B, 32 (1977) 279–286
As highlighted by Mikhail Bolshov, “In these tandem publications by Piepmeier,794,795 some aspects of the resonance fluorescence of atoms in the field of resonance laser radiation are theoretically investigated. At that time, the majority of the experiments on LIF were performed with different flames as the atomic reservoirs. The steady-state behavior of LIF in steady-state conditions of a flame defined the theoretical model used in both papers.794,795 The approach of rate equations was applied to describe the behavior of an arbitrary three-level atom in the resonance field. Quenching and non-quenching collisions were investigated and the laser intensities providing fluorescence saturation were estimated for different sets of atomic level parameters. It was found that non-quenching collisions that change the Doppler shift of an excited atom may decrease by one or two orders of magnitude the laser intensity necessary to achieve a given degree of saturation. In this work from my own group, 796 non-steady state behavior of a three-level atomic scheme in a pulsed laser field was investigated using Pb as an example. Different modes of the fluorescence intensity saturation were considered. The mode of the so-called pseudo-saturation in a weak laser field was found. This regime is possible only in the case when the third atomic level is a metastable, which is the case for Pb. Under this scheme, all atoms will be accumulated at the final metastable level and the intensity of the fluorescence will not depend on the excitation laser intensity. The process mainly depends on the laser pulse duration. Optimal laser intensity for realization of the minimal LOD for different sources of noise was also found. In the case where scattered laser radiation is the main source of noise, the optimal excitation laser intensity is about ½ of the saturation intensity. If the limiting noise is not defined by scattered laser radiation, the maximal attainable laser intensity can be used. Furthermore, the experimentally measured dependence of the fluorescence intensity on the laser intensity was fitted by numerical calculations for different sets of the reported atomic parameters. Accumulation of Pb atoms at the metastable level was experimentally investigated by the pump–probe technique. Fluorescence was excited by the first laser pulse; the second laser pulse was delayed for 40 ns to probe the saturated atomic cloud. It was shown that about 40% of Pb atoms were transferred into the metastable level within 5 ns, with a 10 MW cm−2 laser pulse.”
Coincidently, Nicoló Omenetto and James Winefordner recommended this three-article set794–796 and remarked, “These two papers794,795 have set the theoretical background for the description of the saturation behavior of atoms present in a highly collisional medium (flame) under the influence of a parallel monochromatic laser beam. With such a system, the atomic population is divided into Doppler intervals and the different types of collisions (quenching and non-quenching). The important message is that non-quenching collisions have a significant effect on the irradiance necessary to reach saturation. The two papers794,795 must be read together.”
Nicoló Omenetto and James Winefordner continued, “The Bolshov group have previously reported unprecedented detection sensitivity of ∼250 atoms cm−3 of lead 797 by laser saturated fluorescence measurements. In this work, 796 the authors pointed out and demonstrated experimentally the role of the lifetime of the levels involved in the excitation–fluorescence process in the magnitude of saturation spectral power density798,799 in the case of lead atoms, where the fluorescence radiation ends in a long-lived metastable level. In this case, saturation can occur at much lower laser irradiance (weak field saturation); the authors 796 use the term pseudo-saturation to describe the process.”
Modeling, fundamental characteristics, and properties of laser saturated AFS – (a) Omenetto, Benetti, Hart, Winefordner, and Alkemade, 800 Spectrochim. Acta Part B, 28 (1973) 289–300; (b) Omenetto, Hart, Benetti, and Winefordner, 801 Spectrochim. Acta Part B, 28 (1973) 301–307; (c) Sharp and Goldwasser, 802 Spectrochim. Acta Part B, 31 (1976) 431–457; (d) Olivares and Hieftje, 798 Spectrochim. Acta Part B, 33 (1978) 79–99; (e) Olivares and Hieftje, 799 Spectrochim. Acta Part B, 36 (1981) 1059–1079; (f) van Dijk, Omenetto, and Winefordner, 803 Appl. Spectrosc., 35 (1981) 389–396; (g) Omenetto, van Dijk, and Winefordner, 804 Spectrochim. Acta Part B, 37 (1982) 703–711
This cluster of articles798–804 was jointly recommended by Nicoló Omenetto and James Winefordner with a detailed note: “The above series of papers798–804 together with these two articles796,805 discussed elsewhere in this compilation deal with the different aspects of laser-induced saturation in analytical atomic vapors, both from the point of view of modeling the experimental findings as well as of predicting the analytical advantages (e.g., improved linearity of calibration curves and unprecedented detection sensitivity resulting from its application to chemical analysis). The papers796,798–805 have been selected because, all together, have triggered the interest of the analytical community by projecting the advantages of saturated fluorescence measurements in typical atomizers (flames, graphite furnaces and ICPs), as well as the intriguing time-resolved diagnostic possibilities of measuring fundamental plasma parameters (e.g., quantum efficiency and total number density of species). The theoretical approach of the rate equations, rather than the quantum mechanical approach, has largely been used by the analytical spectroscopists. As pointed out by Sharp and Goldwasser, this was mostly because ‘the abstract nature of mathematics does not always readily provide the physical interpretations which can be used as guiding rules for routine work.’ 802 On the other hand, as it results from reading the above papers, the rate-equations approach suffers from several limitations, and in some cases cannot explain the large discrepancy between experimental results and the theoretical predictions. Regarding the radiant power necessary to reach saturation, for example, Sharp and Goldwasser 802 consider the possibility that coherence effects between excited atoms may exist during the excitation step, leading to coherent emission of radiation, called superradiance (see R.H. Dicke 806 ).”
Nicoló Omenetto and James Winefordner continued, “A very comprehensive time-resolved and time-integrated model, followed by its experimental applications, was reported by Olivares and Hieftje.798,799 The key parameter of the study was the characterization of the saturation spectral power density parameter, its theoretical prediction in both steady state and transient irradiation conditions, in the presence of collisions, and for both resonant and non-resonant excitation. In particular, the lifetime of the levels involved in the excitation–fluorescence process play a significant role in the magnitude of saturation spectral power density. This was also pointed out and demonstrated experimentally by Bolshov et al. (see the discussion on paper 805 for more detail). The model described by Olivares and Hieftje 798 is far more general than those reported previously. Particularly relevant is the authors’ conclusion that ‘an accurate determination of saturation spectral power density is extremely tedious and must be performed with great care.’”
James Winefordner further added, “The above considerations were echoed in the two papers from my own research group803,804 in which the effect of integration over a specified time segment of the fluorescence pulse on the saturation curve was investigated. After further analysis of the saturation parameter for 2- and 3-level systems, the authors re-emphasized that such parameter can only be correctly defined and measured if steady state conditions are warranted, and that for very short excitation pulses, deviations from the true behavior occurs as soon as the laser irradiance is decreased, warning that the saturation parameter cannot be evaluated from the fluorescence saturation curve.”
Importance of spatial uniformity in the laser excitation–observation geometry – Daily, 807 Appl. Opt., 17 (1978) 225–229
As jointly noted by Nicoló Omenetto and James Winefordner, “This paper 807 demonstrates the importance of verifying experimentally the assumption of ‘spatially uniform illumination’ often assumed for the laser profile interacting with the atoms: this is clearly not the case for a focused laser beam characterized by a Gaussian beam profile. The paper considers a two-level and a three-level system under two different excitation/detection geometries (vertical and horizontal slit arrangements). The author then revisits the results obtained in the paper by Sharp and Goldwasser, 802 and argues that some of the large discrepancy in the saturation irradiance reported might be explained by the lack of spatial uniformity in the laser excitation/observation geometry. We note that the author 807 gives credit to an earlier paper by Rodrigo and Measures, 808 for pointing out the importance of uniform illumination. Spatial homogeneity is important, but so are temporal and particularly spectral uniformity. In this article by Matveev and Omenetto, 809 several carefully performed experiments showed that, for the specific excimer-pumped dye laser used, the temporal distribution of the laser pulse varied significantly when different spatial sections of the beam were measured. Even more unusual, the peak wavelength of the laser was shifted by a quantity larger than the absorption width of the line investigated, making it impossible to unequivocally correlate the experimentally observed saturation effects with the laser intensity. We stress again how one needs to be careful when interpreting saturation measurements in atomic absorption and fluorescence experiments.”
Anomalous saturation curves in laser-induced fluorescence (LIF) – Alkemade, 810 Spectrochim. Acta Part B, 40 (1985) 1331–1368
The joint comments from Nicoló Omenetto and James Winefordner on this paper 810 are: “For anyone interested in an authoritative, complete theoretical treatment focused on saturation effects in fluorescence, this paper 810 should not be missed. Written with his usual tutorial, and yet critical, style Alkemade reviews the basic parameters involved in the definition of saturation curves, together with the assumptions necessary to make such definitions meaningful and amenable to experimental verification. The message learned here is that, while the vast amount of studies devoted to this topic in the period 1972–1982 has approached maturity, it has certainly not yet reached ‘saturation’. This paper 810 is an extended version of a seminar held in 1984 at the Ames Laboratory of the Iowa State University, upon invitation of Velmer A. Fassel, another giant in analytical spectroscopy. Perhaps it is worth adding to this narrative a personal recollection of Nicoló Omenetto, who always felt that one of the best compliments to Alkemade's talks was the following statement of Velmer Fassel: ‘Gee, I wish I would have said that!’”
Intermodulated fluorescence and harmonic saturated fluorescence for correction of scattering – (a) Sorem and Schawlow, 811 Opt. Comm., 5 (1972) 148–151; (b) Frueholz and Gelbwachs, 812 Appl. Opt., 19 (1980) 2735–2741; (c) Omenetto, Hart, and Winefordner, 813 Appl. Spectrosc., 38 (1984) 619–624; (d) Hart, Alkemade, Omenetto, and Winefordner, 814 Appl. Spectrosc., 39 (1985) 677–688
The three articles on intermodulated fluorescence811,813,814 were jointly recommended by Nicoló Omenetto and James Winefordner with the note: “This seminal 1972 paper by Sorem and Schawlow 811 introduces the term ‘intermodulated fluorescence’ to describe a method involving the use of two co-linear, counter-propagating laser beams passing through an iodine fluorescence cell. The two beams are chopped at different frequencies and the saturated fluorescence measurement taken at the sum frequency. It has been repeatedly said that Alkemade greatly influenced analytical spectroscopy not only with his basic knowledge of the physics involved, but also with his instrumental skill and creativity in experimental design. A good example of the second characteristics is illustrated in this work.813,814 The experiment in fact originated from a conference talk in which he described a dual-chopper modulation approach for scatter correction in saturated atomic fluorescence experiments with flame atomizers. The idea was based on the different frequency content of the non-linear fluorescence and the linear scattering signal. Being in the audience, and on his way to Gainesville after the conference, Omenetto brought back the scheme to Winefordner laboratory, where a very talented graduate student (Lucas Hart) set up and successfully tested the proposed scheme. 813 Alkemade then participated as co-author in an extended, more refined version of the work. 814 ”
Nicoló Omenetto suggested also the work on harmonic saturated spectroscopy 812 and remarked, “In 1980, Frueholz and Gelbwachs 812 pointed out that a single laser beam, sinusoidally modulated at a frequency fo, and capable of saturating the interaction process, will enhance the harmonic content of the fluorescence signal, thereby introducing frequency components at higher harmonics of fo, which will be measured by phase-sensitive detection. The scattering signal, which responds linearly to the laser intensity, will therefore be discriminated.”
Laser-excited AFS in gas cell – (a) Fairbank, Hänsen, and Schawlow, 815 J. Opt. Soc. Am., 65 (1975) 199–204; (b) Bolshov, Zybin, Koloshnikov, and Vasnetsov, 816 Spectrochim. Acta Part B, 36 (1981) 345–350
Mikhail Bolshov recommended the article by Fairbank et al. 815 and explained, “LIF of free Na atoms located in a specially designed cell with well stabilized temperature was excited by a continuous-wave-pumped (Ar) dye laser. The linewidth of the continuous-wave-dye laser was about 250 MHz, which permits resolution of the hyperfine splitting (1772 MHz) of the Na ground state. This linewidth of laser radiation limited the interaction with only ∼1/30 of the velocity distribution of the free Na atoms. Continuous-wave excitation of the two-level free Na atoms provides practically cyclic interaction of the resonance radiation with the atomic ensemble at stable parameters in the cell. In this case, each excited atom radiates about 106 photons per second, providing extremely high sensitivity for Na atom detection. Dependence of Na atom concentration on the temperature was experimentally measured. The vapor-pressure curve differs from the Nesmeyanov curve for T < 400 K. Construction of the cell and two extra diaphragms reduced stray light from the excitation radiation to a level equal to the fluorescence radiation of about 102 atoms cm−3. This publication 815 had definitely warmed up the interest in the analytical applications of LIF.”
Mikhail Bolshov also recounted his own contribution 816 : “In the experiments with a specially designed evacuated cell, 816 the detection capability of LIF was examined. The lowest Pb concentration of about 250 atoms cm−3 or 30 atoms in the irradiated volume was estimated in the experiments with saturated vapor of Pb atoms in the evacuated cell. This LOD was realized for the ‘three-level’ atomic system without cyclic interaction as in the case of Na. 815 The mean number of fluorescence photons emitted by a single Pb atom was estimated to be 0.4. The efficiency of the free atom formation in the version of the graphite cup atomizer used was estimated to be about 5 × 10⁻³.”
A similar view on this article 816 was shared by Igor Gornushkin, with a comment: “The 1970s through the 1990s was the time when record-low detection sensitivities were achieved by a number of methods. One of those methods is LIF. A detection limit as low as 250 atoms cm−3 or 30 atoms of lead per analytical volume was achieved by Bolshov et al. 816 ”
Laser-excited AFS with flame atomizer – (a) Omenetto, Hatch, Fraser, and Winefordner, 817 Spectrochim. Acta Part B, 28 (1973) 65–78; (b) Weeks, Haraguchi, and Winefordner, 818 Anal. Chem., 50 (1978) 360–368
Mikhail Bolshov recommended the paper by Omenetto et al. 817 and elaborated, “The first results of LIF generated misplaced optimism concerning the real potential of tunable-laser-based spectrometric techniques. Extremely high sensitivity of LIF was demonstrated in experiments with free Na atoms in evacuated cells or in low-density atomic beams (for example, in the work by Fairbank et al. 815 ). However, the situation changes dramatically when one needs to detect an analyte concentration in solid or liquid samples because of the atomization step. Real-world atomizers offer atom-formation efficiencies (number of free atoms of an analyte in the gas phase compared to the total number of vaporized analyte atoms from the sample) usually lower than unity. Graphite tube atomizers are the most efficient, as the evaporated and atomized free atoms of an analyte are located inside the tube and contribute to the absorption of the resonance radiation. Unfortunately, LIF cannot be realized in a tube because the fluorescence is optimally collected only at some angle to the tube axis. The situation is different for graphite-cup atomizers; the analytical volume is located above the cup and atomized free atoms expand into the cooler room temperature environment. We estimated the efficiency with such a geometry to be about 5 × 10⁻³ even in an argon atmosphere. 816
“Additionally, thermal radiation emitted from the hot parts of an atomizer seriously raises the background and hence increases the LOD. This article 817 is one of the first publications on laser excited atomic fluorescence in a flame. Several analytes were determined and LODs were obtained with a dye laser excited by a pulsed nitrogen laser. Different fluorescence excitation schemes – resonance fluorescence or direct-line fluorescence – were probed. The attained LODs were mostly worse (except for Sc and Nb) than the best reported AAS LODs available at that time. Strong scattering of the exciting laser radiation was found to be the primary source limiting the background.”
WingTat Chan shared a different paper 818 and remarked, “The article 818 describes laser-excited atomic fluorescence with a pulsed-nitrogen-laser-pumped tunable dye laser and flame atom sources. As stated in the article: ‘a pulsed source with high spectral irradiance combined with gated detection should be a nearly optimal analytical system for improvement of detection limits and signal-to-noise (S/N) ratios in atomic fluorescence.’ 818 The experimental setup achieved detection limits of ng mL−1 and linear dynamic ranges of 5 to 7 orders of magnitude, which are equivalent to those of the ICP–AES (the benchmark at that time). Practical considerations of experimental parameters, such as slit widths versus S/N, saturation of PMT anode current, and type of transition (resonance versus nonresonance fluorescence) are discussed. The authors 818 also conjectured that the detection limits and linear dynamic range could be improved by up to 4 orders of magnitude by optimization of the experimental setup and operating parameters.”
Laser-excited AFS with electrothermal atomizer – (a) Neumann and Kriese, 819 Spectrochim. Acta Part B, 29 (1974) 127–137; (b) Bolshov, Zybin, Zybina, Koloshnikov, and Majorov, 820 Spectrochim. Acta Part B, 31 (1976) 493–500; (c) Bolshov, Zybin, and Smirenkina, 805 Spectrochim. Acta Part B, 36 (1981) 1143–1152
Mikhail Bolshov recommended these three articles805,819,820 and explained, “The first paper in my selection list 819 is one of the first publications on the use of electrothermal atomizers (ETA) for laser-excited atomic fluorescence (LIF). The most important advantages of ETA over flames were pointed out – neutral atmosphere in the analytical zone minimizes the loss of excited atoms due to quenching, and higher atom concentrations in the analytical volume provide higher sensitivity. The best LOD ∼2 × 10⁻¹³ g was realized – the lowest to date. My second selected article 820 is the first publication with the lowest (to date) LODs for Fe (25 pg mL−1) and Pb (2.5 pg mL−1) with primitive visual detection of the amplitude of the fluorescence signal on an oscilloscope screen. The calibration curves were linear over 5 orders for Fe and 6 orders for Pb. The difference in the atomic spectra of the two elements and efficient quenching of free Fe atoms provided linear dependence of Fe fluorescence on excitation laser energy, while saturation was achieved for Pb. In my third selected article, 805 optimal laser intensities for fluorescence excitation under different types of noise were estimated. Results of the analysis of different real liquid and solid samples (including agricultural samples) are presented. No dramatic improvement of LODs for LIF as compared to GF–AAS was found and was explained from the viewpoint of sample atomization in a relatively cold analytical zone above the graphite cup in our version of graphite atomizer as compared to the hot zone inside the graphite tubes in GF–AAS. Most LODs for LIF were obtained by extrapolation of the linear calibration curve to the fundamental noise level defined by detuning the laser excitation wavelength off the resonance. Experimental LODs were defined by the purity of the distilled water used in the experiments and were, for many analytes, orders of magnitude worse. The correctness of such extrapolation was proved in some years in the joint experiments with French colleagues when pure deionized water was used for calibration.”
Ove Axner offered an expanded view: “The work of Bolshov et al. 820 constitutes the first demonstrations of LIF–GF/–ETA. In this work, 820 frequency-doubled radiation of a dye laser excited by the second harmonic radiation of a Nd:YAG laser was used as a light source for atomic fluorescence detection of Pb and Fe in a graphite-tube atomizer. Already at this time impressive limits of detection (LODs) could be obtained; 25 and 2.5 pg ml−1 for Fe and Pb, respectively, corresponding to absolute LODs of 0.75 and 0.075 pg. The follow-up work 805 constitutes an early demonstration that the technique can be applied to a multitude of elements (in this case, Pb, Fe, Na, Pt, Ir, Eu, Cu, Ag, Co, and Mn). Over the years, LIF–GF/–ETA has been performed with a variety of furnaces. Even though the mostly used ones have been graphite tubes, a number of other types have also been used or scrutinized, e.g., platinum furnaces, 821 side-heated furnaces, 822 and graphite cups. 823 The paper by Ljung et al. 824 constitutes a detailed comparison between different types of furnaces whereas Jiang et al. 825 addresses a furnace–flame tandem system.”
Different excitation–detection schemes for LIF – Omenetto and Winefordner, 826 Appl. Spectrosc., 26 (1972) 555–557
As explained by Ove Axner, “Omenetto and Winefordner 826 provided an extensive description of, and a consistent terminology for, possible excitation–detection schemes for the LIF technique. More specifically, they defined five basic types of excitation–detection schemes for detection of atoms, of which the three most fundamental ones are: resonance fluorescence, in which both the radiative excitation and de-excitation transitions comprise the same lower and upper levels; direct line fluorescence, in which the upper level (but not the lower levels) of the two transitions involved in the radiative excitation and de-excitation processes is the same; and stepwise line fluorescence, in which dissimilar upper levels are involved in the radiative excitation and de-excitation processes. In addition, they described sensitized fluorescence as excitation–detection schemes in which one species is radiatively excited (referred to as the donor) but transfers its (excitation) energy to an atom of the same or another species (called the acceptor), either of which de-excites by emission of a photon; and multiphoton fluorescence, in which two (or more) identical photons excite an atomic species to a state from which a photon is emitted. It is concluded that each of the excitation–detection schemes has its own advantages and disadvantages and that the most suitable one to use is often dictated by the atomic structure of the analyte to be investigated.”
Double-resonance excitation for LIF – Vera, Stevenson, Smith, Omenetto, and Winefordner, 827 J. Anal. At. Spectrom., 4 (1989) 619–623
Ove Axner commented, “Out of the many possible excitation–detection schemes for the LIF technique, 826 of special importance is the concept of double resonant excitation in which the atoms are excited step-wise by two photons in the visible wavelength region, while fluorescence is detected in the UV, where there is virtually no black-body radiation, by a solar blind detector, which is insensitive to visible light. 827 This mode of operation has given rise to LODs in the low femtogram range.”
Optimization of light collection, background correction, and other aspects of laser-excited AFS in furnace atomizers – (a) Dougherty, Preli, McCaffrey, Seltzer, and Michel, 828 Anal. Chem., 59 (1987) 1112–1119; (b) Farnsworth, Smith, and Omenetto, 829 Spectrochim. Acta Part B, 45 (1990) 1151–1166; (c) Smith, Farnsworth, Cavalli, and Omenetto, 830 Spectrochim. Acta Part B, 45 (1990) 1369–1373; (d) Yuzefovsky, Lonardo, and Michel, 831 Anal. Chem., 67 (1995) 2246–2255
As thoughtfully explained by Ove Axner, “Most early experimental setups directed the fluorescence into the spectrometer in a right-angle mode of detection. To increase the volume of illuminated atoms seen by the spectrometer and reduce so-called post-filtering effects, so as to increase the sensitivity of the technique, later setups used front-surface detection with a pierced mirror. 829 Using thallium as a test species, based on a discussion around limiting sources of noise, this paper 830 presents a number of aspects that need to be taken into consideration when LIF–GF/–ETA instrumentation with optimal performance is to be designed, not least regarding suitable modes of excitation and detection. The paper by Yuzefovsky et al. 831 concludes that there are five main requirements for an efficient optical system for LIF, namely: (i) a high light-collection efficiency in both the UV and visible regions; (ii) a good ability to discriminate between background and analytical signals; (iii) minimal losses of the analytical signal at the detection wavelength; (iv) easy-to-align optics; and (v) inexpensive and commercially available optical components. To eliminate the limiting effect of scattered laser light and background fluorescence from concomitant species, over the years a number of means that address these concepts have been developed. A possible way is to use a multichannel detection device, for example an intensified CCD for detection of the fluorescence. 832 Other background-correction techniques also have been developed, e.g., Zeeman based background correction. 828 Yuzefovsky et al. 831 also demonstrated that spatial discrimination can be used to reduce scattered laser light.”
Analytical characteristics of laser-excited AFS with electrothermal atomizers – (a) Gonchakov, Zorov, Kuzyakov, and Matveev, 833 J. Anal. Chem.-USSR, 34 (1979) 1792–1795; (b) Bolshov, Boutron, and Zybin, 834 Anal. Chem., 61 (1989) 1758–1762; (c) Masera, Mauchien, and Lerat, 835 Spectrochim. Acta Part B, 51 (1996) 543–548
Mikhail Bolshov recommended article, 834 which highlighted the application of LIF to ultra-trace analysis in environmental samples and recounted, “Direct detection of lead traces in ancient Antarctic deep ice cores at sub-pg g−1 level by LIF is reported. 834 Experimentally attainable LOD of 0.2 pg ml−1 by LIF was demonstrated using synthetic standard solutions prepared in a clean laboratory in the LGGE Institute (Grenoble, France), which proved the extrapolated LODs presented in our previous publication. 805 Sophisticated procedures for sample collection in Antarctica, sample transportation to Grenoble and later to Moscow, sample decontamination and pretreatment, and final analysis by isotope dilution mass spectrometry and LIF are described. Fairly good agreement on the results obtained by the two techniques was demonstrated. One sample of 200 mL at a concentration level near the LOD was analyzed by isotope dilution mass spectrometry for a measurement time of about 4 h. The same level of concentration was analyzed by LIF in a sample of 20 µL in about 3 min.”
Ove Axner expanded the selection of articles on this topic833–835 and commented, “As is exemplified in these two papers,833,835 the LIF–GF/–ETA technique provides, in general, both high sensitivity and low detection limits, in pure water solutions, often in the pg ml−1 or fg range. A fairly recent compilation of LODs for LIF, both in flames and in GF/ETA, is given in the encyclopedic article. 836 The LIF technique has not only high sensitivity, it has also a large dynamic range (often five to seven orders of magnitude). In addition, since laser light most often has a narrow linewidth and the technique often uses a dispersive element for detection of the fluorescence (most often a spectrometer), it has also a ‘doubled selectivity’. This makes the LIF–GF/–ETA technique very useful for real-life trace element analysis of a variety of samples. An early example of its applicability was detection of lead in Antarctic ice. 834 Since then, a number of demonstrations of its applicability have followed, dealing with a large variety of samples, predominantly of environmental, biological, and medical interest.”
LIF as a technique to probe fundamental processes in electrothermal atomizer – (a) Falk and Tilch, 837 J. Anal. At. Spectrom., 2 (1987) 527–531; (b) Gornushkin, Smith, and Winefordner, 838 Spectrochim. Acta Part B, 51 (1996) 1679–1693
According to Ove Axner, “To improve on the performance of electrothermal atomizers, due to their extraordinary properties (high sensitivity and good spatial resolution), the LIF technique has also been used to scrutinize a number of physical processes related to vaporization and atomization in furnaces. For example, Falk and Tilch 837 estimated the atomization efficiency of electrothermal atomizers using cup or tube geometries by model calculations and concluded that tube atomizers operated at atmospheric pressure can have an efficiency of more than 50% whereas that of low-pressure systems and cup atomizer is typically less than 5%. The minimum number of analyte atoms detectable within the atomizers using GF–AAS, furnace atomization non-thermal excitation spectrometry (FANES), and LIF–GF/–ETA was estimated to be in the 104–109 region with LIF being the most sensitive. Finally, they concluded that gas-phase interferences should be less using the cup and low-pressure atomizers compared with the usual tube furnace because of the longer residence time in the latter. Gornushkin et al. 838 used the LIF technique to study atomization and diffusion mechanisms in a novel diffusive graphite tube atomizer. Fluorescence versus time profiles for three elements (Cu, Ag, and Ni) evaporating out of the atomizer were obtained within the temperature range of 1400–2600 K. Rate constants of specific atomization processes were measured from the decay portions of the fluorescence signals under the assumption of first-order kinetics.”
How close is AFS from the intrinsic limit of detection and to single atom detection? – (a) Omenetto, Smith, and Winefordner, 839 Spectrochim. Acta Part B, 43 (1988) 1111–1118; (b) Winefordner, Smith, and Omenetto, 840 Spectrochim. Acta Part B, 44 (1989) 1397–1403
The first article 839 was recommended by James Winefordner, who recounted, “This paper 839 makes use of the theoretical insights and definitions available in the literature to compare the detection limits obtained by laser-excited non-resonance fluorescence of thallium and lead atoms produced by electrothermal atomization with the calculated intrinsic detection limit (when the limiting noise is attributed only to the fluctuations of atoms in the observation volume). Four laser-pumped tunable dye laser systems were used. The results show that, under the experimental conditions used, none of the systems reached the intrinsic limits, leading the authors 839 to conclude that strenuous efforts are needed to eliminate the extrinsic causes of noise observed. Such conclusion can be interpreted on the positive side, since it means that there is still room for improvement.”
Ove Axner suggested a different paper 840 and noted, “This paper 840 discusses critically the ultimate performance of laser-based techniques in general and LIF in particular for analytical atomic spectrometry, including addressing the question ‘How close to single atom detection?’ More specifically, it discusses the potential capability of reaching the intrinsic limit of detection of both LIF and ionization spectrometry in various atom reservoirs (flames, graphite furnaces, plasmas, and low-pressure glow discharges) using a variety of tunable dye lasers (pumped by N2, Nd:YAG, excimer, Cu vapor lasers, and flashlamps). They conclude that none of the LIF-based approaches can satisfy the requirement of a true single atom detection technique; single atom detection can though possibly be achieved using ionization spectrometry applied to atomization in vacuum.”
Laser-excited AFS with ICP – Epstein, Nikdel, Bradshaw, Kosinski, Bower, and Winefordner, 841 Anal. Chim. Acta, 113 (1980) 221–226
As explained by Mikhail Bolshov, “An inductively coupled argon plasma was tested as the atomic reservoir for LIF technique. 841 In spite of the much higher temperature of an ICP compared to flames, the LODs realized 841 were not greatly improved. Amazingly, one of the reasons for this lack of LOD improvement is the too-high temperature of the plasma. At the high temperature of the ICP, the resonance level, which is probed by exciting laser radiation, might be strongly depopulated to the above low-lying energy levels and the high degree of ionization also reduces the usefulness of the ICP as an atomic reservoir for LIF. Background emission from the plasma is also a serious limiting factor for the unexpectedly poor analytical results.”
Mikhail Bolshov continued and offered an elaborated view on the development of the LIF technique: “Summarizing the above reviewed publications on the development of flame–LIF technique, 817 one should stress that these first papers had demonstrated great potential of the lasers with tunable wavelengths as the sources of resonance excitation in elemental analysis. Several advantages of the pulsed lasers were found and discussed in these experiments: reduction of noise due to pulsed excitation in combination with gated fluorescence detection; more ‘pure’ spectrum as compared to classical sources like hollow-cathode lamps, which provided for many elements the possibility of direct-line fluorescence resulting in a dramatic decrease of the excitation radiation stray light; saturation of the fluorescence signal for the appropriate laser intensities, which minimizes fluorescence signal fluctuations caused by fluctuation of laser intensity. At the same time, the inherent problems of flames as the atomic reservoirs did not allow realization of the full advantages of lasers as the excitation sources. Relatively low temperature, strong thermal radiation of the flames, pronounced quenching of the excited atoms, chemical reactions between the excited atoms of an analyte and species (e.g., organic components) in the flames – all these factors produced a not very impressive decrease of the LODs for LIF as compared to non-laser based AFS or AAS. Noteworthy, even the much hotter atomizer – an ICP – has not provided substantial improvements for LIF analytical capabilities because of the strong background emission from the plasma and depopulation of the ground state atoms. The next step in the development of LIF is connected with the use of non-flame atomization.”
Tutorial reviews on principles, methodologies, and applications of AFS – (a) Winefordner and Elser, 842 Anal. Chem., 43 (1971) 24A–42A; (b) Omenetto, Fraser, and Winefordner, 843 Appl. Spectrosc. Rev., 7 (1973) 147–182; (c) Winefordner, 844 J. Chem. Educ., 55 (1978) 72–78; (d) Omenetto and Winefordner, 845 Prog. Anal. At. Spectrosc., 2 (1979) 1–183; (e) Sjöström, 846 Spectrochim. Acta Rev., 13 (1990) 407–465
The A-page article by Winefordner and Elser 842 published in 1971 was suggested by Mikhail Bolshov, who highlighted, “The review 842 summarized the work on atomic fluorescence as an analytical technique in the ‘before-laser epoch’. Different regimes of the fluorescence are examined for continuous wave and pulsed excitation sources.” In addition, Mikhail Bolshov also suggested the review by Omenetto, Fraser, and Winefordner 843 and commented, “In this review, 843 the peculiarities of atomic fluorescence excited by pulsed sources of resonance radiation are discussed. Different strategies for fluorescence excitation and detection are examined. Different pulsed sources, including tunable pulsed lasers as the excitation source are reviewed with the emphasis on attaining the best signal-to-noise ratio (S/N) and hence the best LODs. The S/N improvement with a pulsed source and gated detector is possible if the fluorescence signal and noise depend linearly on the excitation intensity. In such a case, assuming Poisson statistics, the S/N increase will be proportional to the square root of the product of pulse duration and repetition rate.”
As explained by Ove Axner, the importance of these three tutorial articles844–846 on AFS is: “Over the years, the principles of AFS and LIF for analytical applications have been carefully scrutinized and described in numerous prominent and often-cited papers. This article by Winefordner 844 represents an early description that serves as a good introduction to the practical aspects and the applicability of both conventional-source AFS and LIF. The paper by Omenetto and Winefordner 845 constitutes a contemporary review that expands on the discussion about the basic properties of the techniques and provides an extensive description of the field. The publication by Sjöström 846 constitutes an early review that specifically focuses on LIF–GF/–ETA, and clearly illustrates the fundamental principles, typical instrumentation, modes of excitation and detection, and contemporary figures of merit.”
José Broekaert recommended the tutorial review by Omenetto and Winefordner 845 and remarked, “The theory of fluorescence spectrometry, including the models for obtaining saturation of the excited level and the corresponding possibilities especially in the case of atomic fluorescence for element determinations, were discussed. The paper 845 gives a thorough treatment of the theory of all kinds of atomic fluorescence spectrometry.”
Laser-enhanced ionization (LEI) spectrometry
Opto-galvanic spectroscopy – (a) Foote and Mohler, 847 Phys. Rev., 26 (1925) 195–207; (b) Green, Keller, Schenck, Travis, and Luther, 848 J. Am. Chem. Soc., 98 (1976), 8517–8518; (c) Green, Keller, Luther, Schenck, and Travis, 849 Appl. Phys. Lett., 29 (1976) 727–729
As noted by Stanley Crouch, “Although the titles of these papers848,849 contained phrases like ‘(opto)-galvanic detection’, they were the first descriptions of the technique now called laser-enhanced ionization (LEI) spectrometry.” Ove Axner provided more details and added, “It was the first paper 848 that presents a spectroscopic detection technique that probes the presence of a specific element in a weakly ionized plasma such as a flame by measuring the enhanced ionization rate that follows when the atoms under study are excited by tunable laser light. In this work, 848 the technique was denoted opto-galvanic spectroscopy, although it was thereafter referred to as LEI. The technique has been shown to be able to produce ppb–ppt limits of detection for a number of species in liquid solution aspirated into a flame by the use of a nebulizer.”
Alexander Scheeline was a postdoctoral associate under several of the authors of these papers848,849 and heard the story of how and why opto-galvanic spectroscopy became LEI. He recounted, “The opto-galvanic effect had first been observed as early as 1925. 847 Shortly after the cited papers848,849 were published, someone commented to NBS (now NIST) management that the supposed discovery (or rediscovery) of the opto-galvanic effect should be regarded as a great embarrassment to NBS because of the earlier literature. Management berated the authors and strongly recommended that work on opto-galvanic spectroscopy be terminated. By renaming the technique as LEI, the then hot topic of laser spectroscopy became management's focus and support continued. ‘What's in a name?’ asked Shakespeare. In this case, it was the difference between continued research and termination.”
LEI in analytical flames – (a) Turk, Travis, DeVoe, and O’Haver, 850 Anal. Chem., 50 (1978) 817–820; (b) Turk, Travis, DeVoe, and O’Haver, 851 Anal. Chem., 51 (1979) 1890–1896
Ove Axner recommended the first article 850 and commented, “This article 850 contains a first description of the mechanisms and an early experimental realization of LEI in flames for analytical applications. The atoms to be detected are excited to higher lying states by the use of a pulsed dye laser tuned to a resonant transition. Based on the fact that collisional induced thermal ionization of atoms is more probable if the atoms are in excited states than in the ground state, the paper 850 suggests that the mechanism of the enhanced ionization in LEI is collisionally induced ionization of the excited atoms. The increased number of charges in the flame that results from the excitation is sensed by the use of a pair of tungsten rods placed on each side of the flame in its upper part at a negative potential with respect to the burner head while the current through the burner head is measured.”
José Broekaert recommended the other paper 851 and remarked, “Selective excitation of atomic levels by the absorption of laser radiation as a means to promote ionization which is measured as the analytical signal has been described as a powerful new type of atomic spectrometry. The paper 851 describes the basis of LEI spectrometry as a new type of detection.”
Multiple-color stepwise excitation LEI – (a) Turk, DeVoe, and Travis, 852 Anal. Chem., 54 (1982) 643–645; (b) Magnusson, Axner, and Rubinsztein-Dunlop, 853 Phys. Scr., 33 (1986) 429–433
According to Ove Axner, “It was early found that, by exciting two or several consecutive transitions in the element addressed, referred to as stepwise excitation, the atoms’ ionization rate and thereby the LEI signal could be increased. As is shown by Turk, DeVoe and Travis, 852 by this arrangement the sensitivity of LEI for elements with medium or high ionization limits could be significantly enhanced. Magnusson, Axner and Rubinsztein-Dunlop 853 demonstrate additionally that by delicately adjusting the powers of the laser fields, two-step excitation can also reduce one of the inherent problems of LEI, viz. that of spectral interferences, which predominantly come from easily ionized elements (EIEs).”
Light–matter interactions and excitation mechanisms of LEI in flames – Axner and Sjöström, 854 Appl. Spectrosc., 44 (1990) 864–870
Ove Axner recounted, “To characterize the LEI technique and to be able to optimize its performance, some light–matter interactions and excitation mechanisms pertinent to the technique have been particularly addressed. This work 854 deals specifically with anomalous contributions to the signal from scattered laser light that under some conditions can cause the interaction region to be significantly larger than anticipated and give rise to unexpectedly large signals and unconventional line shapes. It was found that when high-intensity light was used in LEI spectroscopy to address Sr atoms, a significant part of the signal could be attributed to ionization of atoms outside of the geometrically defined interaction region (the region traced out by the laser beam). The reason for this was attributed to scattered laser light. This phenomenon was especially significant when small beam diameters were used (since the number of atoms outside of the geometrically defined interaction region then is considerably larger than that inside) and when the flame was run fuel rich.”
The work was also suggested by Nicoló Omenetto, who added the following reasons for his choice: “The authors 854 focused their attention on the so called ‘scattered contribution’ to the LEI signal and postulated that in fact this contribution should not only be restricted to scattering from particles in the flame (an example would be the presence of soot particles in fuel-rich air–acetylene flames) but should also include atomic fluorescence emitted in the laser-interaction region, and spurious different diffraction effects caused by small apertures located outside the flame. This is the first time that the above definition of ‘scattering’ was used and experimentally tested in LEI measurements.
“The experimental results were obtained by scanning a dye laser of different intensities across the resonant transition of Sr atoms and recording the expected saturation behavior, namely the non-linear dependence of the signal peak with an increase in laser intensity. 854 Such behavior was indeed observed; it was found that the peak signal increased by a factor of 2 when the laser intensity was raised by a factor of 40. Interestingly, however, saturation theory predicts also a broadening of the signal shape when the laser intensity increases; such behavior was not observed, leading the authors 854 to speculate that the reason for the failure of the saturation theory in this case could be the existence of scattered laser light outside the true interaction region. Subsequent ‘ad hoc’ experiments using two narrow laser beams (2 mm diameter) were then designed to demonstrate the difference between the signals obtained from the true interaction region and those originating from the ‘scattered’ laser light.
“From the results obtained, the authors 854 could conclude that diffracted light from the narrow opening in front of the laser, as well as fluorescence from atoms in the interaction region could not be the cause of the observed effects. As expected, they suggested that more experimental work was necessary. Regardless, I believe that this 35-year-old work is still worth careful scrutiny.”
Ionization mechanisms of LEI in flames – (a) Axner and Berglind, 855 Appl. Spectrosc., 43 (1989) 940–952; (b) Axner and Sjöström, 856 Appl. Spectrosc., 44 (1990) 144–147; (c) Axner, 857 Spectrochim. Acta Part B, 45 (1990) 561–579
As explained by Ove Axner, “A number of works dealing with ionization mechanisms of excited atoms in flames have been performed. This article 855 assesses the ionization efficiencies of excited atoms in a flame. The paper 856 provides an explanation of the advantages regarding sensitivity and selectivity of stepwise laser-enhanced (collisional) ionization as compared to photo-ionization in flames, while the work 857 presents an assessment of the optimum conditions for one-step laser-enhanced ionization spectrometry in flames for a set of elements.”
Processes related to signal generation and collection in LEI – (a) Schenck, Travis, and Turk, 858 J. Phys. Colloq., 44 (1983) C7-75–C7-84; (b) Havrilla, Schenck, Travis, and Turk, 859 Anal. Chem., 56 (1984) 186–193; (c) Magnusson, 860 Spectrochim. Acta Part B, 42 (1987) 1113–1123; (d) Travis and Turk, 861 Fundamental mechanisms of laser-enhanced ionization: Signal detection, in Laser-enhanced ionization spectroscopy, John Wiley and Sons (1996)
Ove Axner noted, “A number of papers858–861 describing and modeling the signal collection process have been published. After providing a description of the electrical field distribution in the flame, the models provide a description of how the light electrons and heavy ions that are produced as a consequence of the laser excitation and the collisional ionization move and induce the currents to (or from) the charge collectors (the burner head or electrodes) that constitute the LEI signal.”
Methods to reduce matrix ionization interference in LEI – Turk, 862 Anal. Chem., 53 (1981) 1187–1190
Ove Axner explained, “Despite many attractive features, LEI has been difficult to apply to the analysis of many types of complex samples because of a susceptibility to thermal ionization interferences that change the distribution of the electrical field, and thereby the charge collection efficiency, in the flame. By using a water-cooled cathode placed in the flame, and directing the laser beam as close to its surface as possible, the tolerances of the LEI signal collection to a matrix of sodium in an air–acetylene flame could be significantly improved (from 300 up to 3000 ppm). Following this paper, 862 it has repeatedly been demonstrated that the immersed cathode clearly outperforms the external cathodes when samples with substantial amounts of EIEs are analyzed.”
LEI as a tool to characterize the flame, processes therein, and for fundamental studies – (a) Schenck, Travis, Turk, and O’Haver, 863 Appl. Spectrosc., 36 (1982) 168–171; (b) Turk, 864 Anal. Chem., 64 (1992) 1836–1839; (c) Omenetto, Berthoud, Cavalli, and Rossi, 865 Appl. Spectrosc., 39 (1985) 500–503; (d) Axner and Berglind, 866 Appl. Spectrosc., 40 (1986) 1224–1231
According to the comments provided by Ove Axner, “The LEI technique has also been used to characterize flames and processes in such. For example, by utilization of the temporal and spatial depletion of the neutral atom density that follows laser-enhanced ionization, Schenck et al. could characterize the flow velocity of flame gases in a laminar flow flame to within 2%. 863 Turk developed a technique that, by spatial control of the flame volume sampled by the ionization detection electrodes by variation of the applied voltage (thus by forming an image of the LEI active volume), can determine where, within a flame, laser-enhanced ionization actually takes place. 864 By utilizing step-wise delayed LEI, Omenetto et al. demonstrated, by measurements on thallium and lead in an air–acetylene flame, that the lifetimes of metastable states are significantly shortened in a flame as compared to natural lifetimes. 865 Axner et al. thereafter used the same methodology to systematically assess the collisionally dominated lifetimes of nine metastable states of six elements in a similar type of flame. 867 They found that the metastable states that are of the same parity as the ground configuration (Au, Bi and Pb) in general have longer (collisional) lifetimes (85 ns to 3.1 μs) than those that are forbidden to decay to the ground configuration only by violation of spin conservation (Cd, Mg and Sr) (5 to 33 ns). The finding that the lifetimes depend on the height in the flame and the flame composition (but not the electron concentration) led to a subsequent development of a methodology for mapping local stoichiometric conditions in a flame. 868 Finally, since Rydberg atoms, i.e., atoms in high principal quantum numbers, are, by the Stark effect, extraordinarily sensitive to electrical fields, and since the ionization efficiency of high-lying states in flames is high (often close to unity), Axner and Berglind 866 showed that the LEI technique can be used to non-intrusively map spatially the electrical field distribution in a flame exposed to an external electrical field.”
Simultaneous laser-enhanced ionization (LEI) and laser-induced fluorescence (LIF) measurements – (a) Omenetto, Turk, Rutledge, and Winefordner, 869 Spectrochim. Acta Part B, 42 (1987) 807–817; (b) Turk and Travis, 870 Spectrochim. Acta Part B, 45 (1990) 409–419
As explained by Ove Axner, “To characterize the excitation, de-excitation, and detection processes in flames in more detail, and as a tool for flame and plasma diagnostics, simultaneous detection of LEI and LIF has been studied.869,871 The first work in the field 869 coined the phrase ‘fluorescence dip’, defined as the decrease in the fluorescence signal when a second excitation step is applied. Based on a description of an atomic system exposed to two excitation steps, the authors concluded that, by defining an intensity saturation parameter as the intensity at which the asymptotic behaviors of the linear (low) and constant (high) power dependences of the second step intercept, the fluorescence dip can be used to assess the oscillator strength of the second transition. A subsequent work 871 predicted, based on an extended theoretical model and verified by experiments performed in Sr under various conditions, that the fluorescence dip could, together with the LEI enhancement (defined as the increase in the ionization signal when a second excitation step is applied), be used to also assess the depletion of the number of atoms during the interaction, the amount of photoionization, and the degree of trapping in the atomic system.
“As a means to investigate to what extent laser-based detection techniques of atoms in flames can be improved by simultaneous LEI and LIF detection, a noise correlation study of LEI and LIF signals was performed. 870 The authors found, when sodium was addressed, that there is a greater degree of noise correlation between the LEI and the LIF signals than between either technique and the laser power fluctuations. This implies that the noise correlation between the two signals could be utilized to cancel noise in the interfering background signal from one of the signals. The authors 870 proposed and demonstrated a background correction method in which the LIF signal of the background-inducing interfering element is subtracted from the combined LEI signals from analyte and interferent.”
Resonance ionization spectroscopy (RIS)
Pioneering work in RIS – (a) Hurst, Payne, Nayfeh, Judish, and Wagner, 872 Phys. Rev. Lett., 35 (1975) 82–85; (b) Payne, Hurst, Nayfeh, Judish, Chen, Wagner, and Young, 873 Phys. Rev. Lett., 35 (1975) 1154–1156; (c) Hurst, Payne, Kramer, and Young, 874 Rev. Mod. Phys., 51 (1979) 767–819
Mikhail Bolshov provided a detailed background as well as the importance of this pair of pioneering articles:872,873 “Alternative techniques – resonance ionization spectroscopy (RIS) in particular – had been developing in parallel with LIF in the 1970s to 1980s. The technique is based on the efficient ionization of a free excited atom in strong resonance laser fields. Laser resonance excitation prior to the last step of photoionization could be performed in three different ways – one-photon excitation, two-photon excitation followed by collisional ionization, and multiphoton excitation to a high-lying Rydberg state. The last step of ionization can be performed either through a photon or an external electric field. ‘Pure’ photoionization was developed by the research group of G. Hurst; both versions with ‘pure’ photoionization and ionization in a strong electric field were developed by the research group of V. Letokhov. The main advantage of RIS over LIF is the possibility to ionize an excited atom with a probability close to unity and thus the feasibility to obtain an analytical signal from each atom. A conventional detector, like a secondary electron multiplier, detects the ions. In contrast, the low efficiency of photon detection in which only a small fraction of the photons radiated by the excited atoms (α/4π, where α is the solid angle of the fluorescence collection) is an inherent drawback for fluorescence. Anyway, the utmost results – single atom detection – were attained both by RIS and LIF. This pair of articles872,873 is the first publications on the new spectroscopic technique RIS. The potential of RIS was demonstrated by detection of a single atom of He in a selected quantum state. The quantum state of a He (2 1S) atom was resonantly excited by the radiation of a dye laser and a second laser photon ionized the excited state. 872 Another scheme was tested in the second publication 873 – He (2 1S) was excited to the He (3 1P) state by a resonance photon of the dye laser and then ionized by collisions. For a laser pulse energy above 0.1 J cm−2, saturation of ionization was observed for a helium pressure between 15 and 100 torr. In both publications,872,873 detection of a single atom in the specific quantum state by different schemes of RIS technique was demonstrated.”
Nicoló Omenetto and James Winefordner jointly remarked on another article by Hurst et al. 874 as “An excellent, basic reading for gaining a panoramic view of the physics and other fundamental aspects of RIS. A unique feature of this article 874 is the availability of a RIS-adapted periodic chart of the elements indicating the ionization schemes that can be chosen for each element: only four elements (He, Ne, F, Ar) are missing. The article treats exhaustively the fundamental theory of excitation processes, physical line broadening, laser characteristics (coherence time), selectivity, sensitivity, and spatial-temporal resolution achievable. In conclusion, an article not to be missed. One last thing related to the periodic chart of the elements: Omenetto remembers that in the 1990s, Spectrochimica Acta Part B used to publish regularly a ‘RIS-resonance ionization MS (RIMS) Data Service’ prepared by E.B. Saloman (NBS), in which data sheets were provided containing atomic data, saturation energies and ionization schemes for the elements. This was very useful not only to the RIS-RIMS community but also to those pursuing laser-enhanced ionization research in flames and plasmas.”
Different ionization schemes for RIS – (a) Ivanov and Letokhov, 875 Kvantovaya Elektron. (Moscow), 2 (1975) 585–590; (b) Hurst, Nayfeh, and Young, 876 Appl. Phys. Lett., 30 (1977) 229–231; (c) Hurst, Nayfeh, and Young, 877 Phys. Rev. A, 15 (1977) 2283–2292
As explained by Mikhail Bolshov, “In this publication by Ivanov and Letokhov, 875 the scheme of efficient atom ionization through the high-lying Rydberg state was proposed for the first time. Theoretical estimations proved that, with reasonable laser intensities and strength of the electric field, the probability of single atom ionization and detection can be close to unity. This scheme was further mostly used in investigations by V. Letokhov's group and particularly in the analytical applications of RIS. Different RIS schemes for efficient photoionization of a free atom are discussed by Hurst et al.876,877 – one-photon resonance excitation followed by non-resonance photoionization by a second photon from the same laser; two-step resonance excitation of an atom followed by non-resonance photoionization or ionization by collisions were proposed and investigated. The levels of required laser intensities are roughly estimated for efficient ionization by RIS. The developed RIS method allowed detection of a single Cs atom in the presence of 1019 foreign atoms. Density fluctuations of less than 100 Cs atoms in a small volume were detected. The potential of RIS to detect rare atoms or rare events is discussed. These two publications876,877 were well referred to and have initiated new research and publications.”
Please note that there is an erratum 878 to the Ivanov–Letokhov article, 875 and an English translation is available for the paper 879 and the erratum. 880
Analytical characteristics of RIS for elemental analysis – (a) Bekov, Letokhov, Matveev, and Mishin, 881 Opt. Lett., 3 (1978) 159–161; (b) Bekov and Letokhov, 882 Appl. Phys. B, 30 (1983) 161–176; (c) Fassett and Travis, 883 Spectrochim. Acta Part B, 43 (1988) 1409–1422; (d) Hurst and Letokhov, 884 Phys. Today, 47 (1994) 38–45
The first two articles881,882 were selected by Mikhail Bolshov, who stated, “The potential of free atom detection by RIS was demonstrated using the excitation of a high-lying Rydberg state of Yb (17p state) followed by electric field ionization. 881 Three-step excitation by three different lasers was used. A synchronized electric pulse of above 12 kV cm−1 efficiently ionized ytterbium atoms from the 17p Rydberg state. The ion counting mode of the detector enabled investigation of the statistics of atoms in the zone of interaction. A survey of different RIS schemes for real analytical applications is presented in this article by Bekov and Letokhov. 882 A sample was atomized in a graphite cup atomizer and the analyte atoms in the analytical volume above the atomizer were detected by RIS. Mainly resonance excitation to the Rydberg state followed by ionization in a synchronously energized pulsed electric field of about some kV was used. Analytical applications of RIS were demonstrated. Some very optimistic speculations concerning the future of elemental analysis by RIS were declared.”
The article by Fassett and Travis 883 was recommended jointly by Nicoló Omenetto and James Winefordner with comments: “This paper 883 provides a perspective on the role of RIMS in analytical chemistry, RIMS being succinctly defined as one technique in the general field of inorganic mass spectrometry providing new, powerful and complementary capabilities. The work (performed at NBS) focuses on application areas of noble gas (Kr) measurements, isotope dilution MS (being regarded as the ‘definitive method’ due to its inherently high accuracy) for geochronology studies on 2.7-billion-year-old rocks using the Re–Os isotopic system, and direct solid sampling analysis using sputtering atomization, which overcomes the duty cycle mismatch suffered in thermal ionization. The authors 883 make an interesting conclusive remark by quoting, and agreeing with, an editorial on single atom detection by Herbert Laitinen, 885 who concluded that ‘age-old questions of signal-to-noise ratio and matrix effects no doubt would remain to plague the practical analyst’ and that ‘RIMS will take its place in the kit bag of the profession to be used in specialized applications.’ But these specialized applications will represent solutions to important problems in science and technology.”
Nicoló Omenetto and James Winefordner also suggested the article by Hurst and Letokhov 884 with a discussion that reads: “Several years after the first seminal papers on RIS, the authors 884 reviewed the achievements and further possible applications. This paper 884 is worth reading because the authors summarize in a table the ultimate theoretical limits of RIS. Looking at these impressive limits in terms of sensitivity (single atom/molecule), selectivity (1010–1020), spatial resolution (de Broglie wavelength of atom/ion), spectral resolution (1 MHz–1 THz), time resolution (1 µs–100 fs), and versatility (any atom/molecule), one wonders whether there is a need for other analytical techniques, and tends to forget that impressive are also the demands imposed on laser sources, efficiency of ionization schemes, solid sampling, not to mention the essentially monoelement detection capability.”
Isotopic selectivity of RIS – (a) Keller, Bomse, and Cremers, 886 Laser Focus, 17 (1981) 75–80; (b) Schumann, Wendt, and Bushaw, 887 Spectrochim. Acta Part B, 60 (2005) 1402–1411
As jointly noted by Nicoló Omenetto and James Winefordner, the article by Keller et al. 886 is “a unique analytical example of how a dedicated combination of laser-induced fluorescence and ion mass spectrometry can solve the extremely challenging problem of detecting a very low number of atoms of a particular isotope in the presence of a thousand-fold excess of atoms of the same atomic mass but different atomic number, and an excess of 1012 to 1014 atoms of different isotopes of the same element. The authors refer to the measurement of the time-integrated flux of neutrinos, which relies on detection of 205Pb atoms, formed by neutrino impact on 205Tl, in the presence of a 1000 times higher concentration of 205Tl and 1014 larger abundance of 206Pb (a natural impurity in thallium ore).”
Nicoló Omenetto expanded the discussion and noted that the article by Schumann et al. 887 is “a first demonstration of how ionization measurements using a three-step, three-color photoionization scheme with spectrally narrow, continuous-wave lasers allow the experimental study of autoionization resonances in atomic uranium vapor. Three lasers, i.e., a ring dye laser (415 nm), a ring titanium sapphire laser (707–724 nm), both pumped by Ar-ion lasers, and an extended-cavity diode laser seeding a diode tapered amplifier chip (829 nm) were operated in single mode with ∼1 MHz linewidth (∼10−6 nm at 700 nm). The optical isotopic selectivity was sufficient to study the rare isotope 236U. Note that this is not an analytical (in the strict sense of the word) paper, but a unique experimental study of ionization pathways, level configuration assignments, hyperfine structures, and isotope shifts; nevertheless, it shows that trace isotope ratio analysis could be feasible.”
Atomic absorption with diode or mode-locked laser
Pioneering work in diode laser atomic absorption spectrometry (DL–AAS) – Hergenröder and Niemax, 888 Spectrochim. Acta Part B, 43 (1988) 1443–1449
This article 888 was recommended by Ove Axner, Mikhail Bolshov, and Ralph Sturgeon. Ralph Sturgeon noted, “Application of tunable single-mode semiconductor diode lasers as sources for AAS is discussed in general. 888 The use of several diode lasers, periodic modulation of the laser powers and Fourier analysis of the absorption signals allow background-corrected multi-element AAS with extended dynamic range and internal standardization.” Mikhail Bolshov shared a similar view.
Ove Axner added, “Absorption spectrometry represents a mode of detection that interacts primarily with species in lower-lying states that are not substantially affected by the environment (e.g., by quenching). This gives the technique a high accuracy and a good quantitative capability. Diode lasers provide tunable narrow-linewidth light sources that have proven to be useful for absorption spectrometry of both atomic and molecular constituents in the gas phase. Although it is often termed tunable diode laser absorption spectrometry (TDLAS) when applied to detection of molecules, when used for spectrochemical analysis of atomic species it has appeared under a variety of names, e.g., diode-laser (atomic) absorption spectrometry, wavelength modulation (diode laser) (atomic) (absorption) spectrometry. The work by Hergenröder and Niemax provides a thorough review of the use of single-mode semiconductor diode lasers for absorption spectrometry in general and analytical purposes in particular. 888 ”
Modulation techniques for DL–AAS measurements – (a) Schnürer-Patschan, Zybin, Groll, and Niemax, 889 J. Anal. At. Spectrom., 8 (1993) 1103–1107; (b) Ljung and Axner, 890 Spectrochim. Acta Part B, 52 (1997) 305–319; (c) Zybin, Schnürer-Patschan, and Niemax, 891 J. Anal. At. Spectrom., 10 (1995) 563–567; (d) Liger, Zybin, Kuritsyn, and Niemax, 892 Spectrochim. Acta Part B, 52 (1997) 1125–1138; (e) Gustafsson, Schmidt, Guerra, and Axner, 893 Spectrochim. Acta Part B, 59 (2004) 67–92
As explained in detail by Ove Axner, “The main disadvantage of absorption spectrometry is that it relies on a measurement of a small change of a signal on top of a large level of unabsorbed light. Any noise introduced by the light source or the optical system, so-called 1/f noise, will deteriorate the detection ability of the technique. A common means to reduce the influence of this is to modulate the signal at a high frequency, where there is little noise, and perform detection at a harmonic of this high frequency. For practical reasons, absorption spectrometry has often been combined with wavelength modulation. As is illustrated by these two works,889,890 this detection arrangement can reduce the influence of noise in the system significantly so as to make sensitive detection of elements in both pure solutions (1 pg ml−1 Rb in deionized water) 889 and in various types of standard reference samples (Rb in ng g−1 or ng ml−1 concentrations in corn bran and various types of water, e.g., riverine, estuarine, and sea waters). 890 To also reduce the influence of background signals that originate from changes/drifts in the optical transmittance, which most often appear as a consequence of multiple reflection between various optical components in the system, often referred to as etalons, a number of means have been developed, e.g., elimination of optical surfaces that are perpendicular to the direction of the laser beam, the use of antireflection coatings, replacement of parallel plates with wedges, and dithering the position of any of the surfaces that give rise to etalons. As is illustrated in these two works,891,893 an alternative is to introduce an additional level of modulation (at a frequency different from that modulating the laser wavelength), modulating either the atomization process 891 or the population of the states interrogated by the diode laser. 893 Yet another possible means is to utilize a double-beam arrangement with logarithmic amplification and subtraction of sample and reference detector, by which shot noise limited detection of 2×10⁻⁷ absorption units has been demonstrated. 892 ”
The article by Zybin et al. 891 was also recommended by Igor Gornushkin, who noted, “Zybin et al. 891 introduced double modulation laser atomic absorption spectrometry that allowed measurements of absorbances as low as 10−7. This allowed improvement of the detection limits in gas chromatography and GF–AAS down to low parts-per-trillion level.”
Dynamic range of DL–AAS – (a) Zybin, Liger, and Kuritsyn, 894 Spectrochim. Acta Part B, 54 (1999) 613–619; (b) Gustafsson, Chekalin, Rojas, and Axner, 895 Spectrochim. Acta Part B, 55 (2000) 237–262
Ove Axner, who recommended these two articles,894,895 explained, “The dynamic range of DL–AAS can be significantly larger than that of conventional AAS. As is demonstrated by Gustafsson et al., 895 owing to its high sensitivity, it can demonstrate a dynamic range three orders of magnitude below the characteristic concentration of AAS. Moreover, since the modulation parameters can be adjusted, it is also possible to increase the dynamic range far above the characteristic concentration with virtually no risk for decreased accuracy. As is shown by Zybin et al., 894 the use of logarithmic signal processing can alternatively provide a linear calibration curve up to three orders of magnitude above the characteristic concentration. This implies that the overall dynamic range of DL–AAS can be as large as six orders of magnitude.”
DL–AAS as a tool for study of fundamental processes in furnace atomizers – Hadgu, Gustafsson, Frech, and Axner, 896 Spectrochim. Acta Part B, 53 (1998) 923–943
As noted by Ove Axner, “Due to a combination of high spatial resolution and high sensitivity, wavelength modulated DL–AAS can be used as a probe for characterization of atom distributions and interferences effects in graphite furnaces under ordinary conditions. For example, Hadgu et al. 896 performed a study on Rb in transversely heated graphite atomizers that showed that there was a significant amount of atoms outside the end of the graphite tube, accounting for about 6% of the total signal. It was concluded that the atoms residing outside the ends of the tube show significantly lower recoveries than those inside the tube, which provides a direct confirmation of enhanced non-spectral interference effects caused by matrix vapors residing outside the tube ends.”
Noise-immune cavity-enhanced analytical atomic spectrometry (NICE-AAS) – Axner, Ehlers, Hausmaninger, Silander, and Ma, 897 Spectrochim. Acta Part B, 100 (2014) 211–235
The NICE-AAS technique is based on a combination of two important concepts: frequency modulation spectroscopy for reduction of noise, and optical cavity enhancement for prolongation of the interaction length between the light and the sample. 897 As noted by Annemie Bogaerts, “This paper 897 reports on a combination of frequency modulation spectroscopy and cavity enhancement, in order to minimize measurement noise and to provide a longer interaction of the sample with the light. This method was applied here for graphite furnace atomization spectroscopy, achieving very low detection limits.”
Ove Axner added to the discussion: “To enhance the interaction length in absorption spectrometry, various types of cavity enhancement techniques have been developed and employed. The most successful approach for molecular detection is to combine it with frequency modulation as is done in the noise-immune cavity enhanced optical-heterodyne molecular spectroscopy technique. This approach provides a number of advantages, not only an increased interaction length and a reduced amount of noise, but also an immunity to laser frequency noise and a possibility to detect sub-Doppler signals. The technique has demonstrated both Doppler broadened and sub-Doppler shot-noise-limited detection of molecules in the gas phase in the low 10–14 Hz–½ range. However, despite its many appealing properties, the technique has not yet been applied to spectrochemical analysis. On the other hand, its performance for detection of atoms, then referred to as NICE-AAS, has been estimated and, when combined with a graphite furnace, found to be in the few atom range. 897 ”
The joint comments from Nicoló Omenetto and James Winefordner on this paper 897 read: “This paper shows that, among the most promising future developments of single atom detection (SAD) approaches, one should take advantage of the well-known detection of ultra-trace molecular species with the laser technique called noise-immune cavity enhanced optical-heterodyne molecular spectroscopy. The appealing idea, presented here 897 for the first time, is to extend the concept and instrumentation to the detection of atoms and to benefit from the same detection power (ultra-trace atomic analysis). The technique, referred to as NICE-AAS, is based upon the two concepts (well-known to laser physicists) of frequency modulation spectroscopy to minimize noise, and cavity enhancement to increase the optical absorption length by increasing the interaction length between the photons and the sample. The authors 897 estimate that it should be feasible to detect Hg in the gas phase down to 25 atoms cm−3 and Na from a liquid solution down to 15 atoms (assuming 10 µL sample volume deposited in a graphite furnace). Both figures are orders of magnitude better than those of any other laser-based absorption detection at atmospheric pressure. The authors 897 also state that they see no technically unsurmountable problems or reasons why NICE-AAS instrumentation could not be realized. ‘But not all the analysts are also laser physicists…’, Omenetto added.”
Analytical applications of tunable diode lasers in the near- and mid-infrared wavelength range
Measurement of temperature of a gas medium – (a) Arroyo and Hanson, 898 Appl. Opt., 32 (1993) 6104–6116; (b) Sanders, Wang, Jeffries, and Hanson, 899 Appl. Opt., 40 (2001) 4404–4415
As noted by Mikhail Bolshov, “Noticeable analytical applications involve spectroscopy with tunable diode lasers in the near- and mid-infrared wavelength range. Contrary to elemental analysis reviewed in other parts of this compilation, the goal of this type of analysis is the detection of simple molecules or diagnostics of some important parameters of a gas medium or chemical reactions. One of the most popular analytical techniques is absorption spectroscopy with tunable diode lasers – TDLAS. Compact construction of a diode laser, minimal energy consumption, possibility of fast (up to MHz) tuning of the laser wavelength, and relatively low prices, all make tunable diode lasers very attractive sources for analytical spectroscopy and diagnostics. In the paper by Arroyo and Hanson, 898 a typical scheme of TDLAS for the detection of the various parameters (e.g., concentration, temperature, and line-shape parameters) of a gas medium is described. The basic principles of TDLAS are briefly described, the experimental arrangement and measurement technique are presented. In all TDLAS applications, target parameters of the gaseous sample under test are obtained by fitting the experimental and simulated spectra. Theoretical spectra are simulated with the use of tabulated spectroscopic parameters of the test molecules. In this paper, 898 the precision of some of these parameters is discussed and the results for several spectral lines of H2O were experimentally measured with an absolute accuracy of 5% or better. One of the drawbacks of TDLAS is the lack of spatial information – the experimental absorption spectra are measured along the whole pass in the probing zone as well as outside the zone on the way from the laser to the recording system. In practical situations, the distribution of temperature and absorbing species is non-uniform, which seriously affects the registered absorption spectra. Without corrections, only a ‘mean’ temperature along the probing laser beam pass can be calculated. In another paper, 899 new strategies in experimental arrangement and data processing were proposed and discussed to obtain the temperature distribution. A tunable diode laser with smooth wavelength tuning in a spectral interval of about 30 cm−1, which allows the detection of many absorption lines of a test molecule, should be used to solve the problem of inhomogeneity of the gas parameters.”
Laser Induced Plasma, Laser Induced Breakdown Spectroscopy (LIBS), and Laser Microprobe Mass Spectrometry
Development of LIBS as an analytical tool
Birth of laser microprobe emission spectroscopy – (a) Brech and Cross, 900 Appl. Spectrosc., 16 (1962) 59; (b) Schuch and Brech, 901 US Patent 3 680 959 (1972)
In the days shortly after the laser (initially dubbed the “ruby maser”) was first experimentally demonstrated, it resulted in a flurry of fundamental and commercial activity in the analytical chemistry community. Alexander Scheeline noted, “This is the original report 900 of what was originally called laser microprobe spectroscopy and later became known as laser-induced breakdown spectroscopy. It is one of the earliest examples of laser-based chemical analysis (laser Raman scattering and laser induced fluorescence were essentially demonstrated at the same time by other groups).”
Richard Russo commented, “To the best of our knowledge, this article 900 is the first reported use of ‘maser ablation’ for analytical purposes. Note the use of ‘maser’. Not clear if it is an article or abstract from a conference. This reference is valuable for the community to know the beginning of the field.”
A similar view was shared by Vincenzo Palleschi, who highlighted, “Going into the specifics of the LIBS technique, for historical reasons it is worth mentioning the first ‘LIBS’ paper by Brech and Cross 900 (although it is not exactly a paper, but an abstract presented to the Colloquium Spectroscopicum Internationale X held in 1962 in College Park, Maryland, USA).”
Igor Gornushkin agreed and added, “The work by Brech 900 is interesting from an historical perspective; it foresees the development of another now popular technique that is LIBS. Brech 900 used a ruby laser to ablate and vaporize metallic and non-metallic targets. The vapor was excited by an auxiliary electric spark and emission spectra were measured. The new sampling method for solid materials was thus born that did not require a lengthy sample preparation.”
Gary Hieftje recalled, “Fred Brech reportedly delivered more than one conference presentation on the use of a ‘ruby maser’ to volatilize sample material for direct excitation by the laser-induced plume or indirectly through use of an auxiliary discharge. In at least one version, the discharge was a high-voltage spark, triggered by the appearance of the sample vapor between a pair of electrodes held at elevated voltage (1–3 kV). Although few details of these pioneering experiments have survived, an early patent, 901 filed in February, 1963, provides additional useful experimental details and performance metrics. From this patent and its claim #13, it is clear that Schuch and Brech successfully analyzed samples both by direct ‘maser’ vaporization and excitation (i.e., similar to modern-day LIBS) and by means of ‘maser’ volatilization with auxiliary spark excitation. It is particularly noteworthy that the work by Brech and co-workers must have begun almost immediately after the birth of the ruby laser, which was first postulated theoretically in 1958 44 and demonstrated successfully only in 1960. 45 ”
Detlef Günther noted, “The explosion in research activity involving laser vaporization and excitation resulted in an early monograph 902 (English translation 903 is available) that cited some of the pioneering fundamental studies and the efforts directed at commercializing the new systems.” Additional details about the early commercial instruments are provided in Section 16.1.2.
Historical review on LIBS – Baudelet and Smith, 904 J. Anal. At. Spectrom., 28 (2013) 624–629
Richard Russo remarked, “This article 904 gives a nice overview or history on the initial use of laser plasmas for analytical elemental spectrochemistry. Many of the same fundamental questions that we address today and photos of the first instruments that were commercialized in these 1960s publications are highlighted in this overview. Especially interesting is the complexity of the emission spectra versus laser parameters, and the interest in secondary excitation to enhance the laser plasma properties.”
Early development of laser probe in spectrochemical analysis – (a) Runge, Minck, and Bryan, 905 Spectrochim. Acta, 20 (1964) 733–736; (b) Scott and Strasheim, 906 Spectrochim. Acta Part B, 25 (1970) 311–332; (c) Scott and Strasheim, 907 Spectrochim. Acta Part B, 26 (1971) 707–719; (d) Felske, Hagenah, and Laqua, 908 Spectrochim. Acta Part B, 27 (1972) 1–21; (e) Felske, Hagenah, and Laqua, 909 Spectrochim. Acta Part B, 27 (1972) 295–300; (f) van Deijck, Balke, and Maessen, 910 Spectrochim. Acta Part B, 34 (1979) 359–369
Reinhard Noll recommended five articles905–909 and provided a detailed account of the importance of each article as follows: “Runge et al. 905 show an optical arrangement (Figure 1 therein) with a Q-switched ruby laser tightly focused on steel samples for laser emission spectrometry, which is basically what we now call LIBS. They measured analytical curves for nickel and chromium (8% to 20% by mass) in high-alloyed steel samples and determined crater dimensions. The rod-like samples are rotated to provide a new surface for the excitation. Scott and Strasheim 906 reported an extensive study (22 pages) of laser-induced plasmas for analytical spectroscopy of the copper content of aluminum alloy standards with different modes of laser operation (free running, semi-Q-switched, and giant pulse mode). Comparative analytical studies indicated that significant improvement in the slopes of the analytical curves can be obtained by spatial and temporal selection of the plasma emission. In a follow-up work, they 907 studied a Q-switched Nd:YAG laser with 6.25 pulses per second as a spectrochemical source. Line intensities and line-intensity ratios as a function of the focus position or as a function of number of pre-lasing pulses irradiated onto the target were investigated. Felske et al. 908 studied line emission caused by a sequence of electrical sparks and compared these with a sequence of laser excitations for metallic targets (steel samples). For laser excitation, they recommended use of emission lines where the lower energy level is not the ground state (i.e., non-resonance lines). Analytical curves for V, Cu, Mn, Si, and Mo for laser and spark excitation are discussed. In the follow-up paper, 909 the authors reported the analyses of non-metallic samples: analytical curves for Al in glass and for Ni, Cr in aluminum oxide were measured.”
Laser-vaporization work with auxiliary spark excitation was also noted by Reinhard Noll, who commented, “A laser probe with a spark excitation was found to be useful for qualitative spectrochemical analysis of microsamples and inclusions. 911 A scheme for vaporization by laser and spark excitation of the sample vapor was provided in a follow-up study. 912 The authors studied multi-spike and single-spike laser outputs and measured their reproducibility. Analytical curves for more than 12 elements in a variety of matrices were measured and discussed.”
Richard Russo shared a different article 910 and noted, “An excellent early (1979) manuscript laying out many of the issues with laser ablation that would soon become international research efforts. I especially appreciate the last sentence of the abstract ‘The use of the laser microprobe (employing cross-excitation) in quantitative analyses is therefore to be dissuaded.’ 910 ”
Trace (element) analyzer based on laser ablation and selectively excited radiation – Measures and Kwong, 913 Appl. Opt., 18 (1979) 281–286
Reinhard Noll commented, “Measures and Kwong 913 demonstrate a technique termed trace (element) analysis based on laser ablation and selectively excited radiation – a combination of laser ablation and selective excitation of the evaporated material by a tuned dye laser. They report a sensitivity of 1 ppm for Cr detection in steel.”
Modern adoption of LIBS as a tool for chemical analysis – (a) Loree and Radziemski, 914 Plasma Chem. Plasma Proc., 1 (1981) 271–279; (b) Radziemski and Loree, 915 Plasma Chem. Plasma Proc., 1 (1981) 281–293; (c) Radziemski, Loree, Cremers, and Hoffman, 916 Anal. Chem., 55 (1983) 1246–1252; (d) Cremers and Radziemski, 917 Anal. Chem., 55 (1983) 1252–1256; (e) Cremers, Radziemski, and Loree, 918 Appl. Spectrosc., 38 (1984) 721–729
As concisely summarized by Vincenzo Palleschi, “these are the two papers914,915 where the LIBS acronym was firstly introduced.” Gary Hieftje indicated, “Although the work by Fred Brech 900 inaugurated the field of laser-microprobe emission spectrometry, the field was re-opened and popularized largely because of studies by the groups of Lee Radziemski at New Mexico State University914,915 and Dave Cremers from Los Alamos National Laboratory. 917 They introduced the term ‘LIBS’ and performed a number of seminal studies.”
Alexander Scheeline shared his view on two articles916,917 in this cluster: “While Radziemski and co-workers had published conference proceedings 919 at least as early as 1981 on the use of laser-induced breakdown spectroscopy, these two papers916,917 launched the modern adoption of LIBS as they were published in the premier journal in analytical chemistry and thus were widely seen.”
Stanley Crouch shared a similar view and noted, “This paper 916 was the first elucidation of laser-induced breakdown spectrometry (LIBS) for aerosols. LIBS is now a widely used analytical technique, with an instrument package present in the ChemCam 920 suite on the Mars rover Curiosity and its successor, Perseverence.”
Benjamin Smith opined, “Aside from several highly cited reviews, this early LIBS paper, 916 together with the review by Bloembergen 921 covering the first decade of laser–material interaction research, are the most cited in the analytical LIBS literature. This paper, 916 by Leon Radziemski and colleagues, is the best early example of a valuable analytical application, particle detection, but also includes a wide range of pertinent fundamental diagnostics including temporal characteristics, spatial profile, energy deposition, temperature and electron number density, and one-dimensional radiation-coupled-hydrodynamics modeling of the laser-induced air plasma. Analytical data for 5 elements is given with some excellent limits of detection, even by modern standards. This paper 916 serves as an outstanding introduction to analytical LIBS for anyone approaching it for the first time.”
As noted by David Hahn, “The authors916,918 describe a novel use of laser-induced breakdown spectroscopy for the analysis of liquids and aerosols in air, presenting a detailed analytical approach for quantitative analysis, presenting calibration curves and limits of detection for a range of analyte species, including sodium and mercury.”
Reinhard Noll offered a different viewpoint and stated, “Cremers et al. 918 studied the effect of two laser pulses focused inside transparent water solutions, where the second laser pulse hits the interior of the bubble generated by the first pulse.”
Development of stand-off LIBS analysis – Cremers, 922 Appl. Spectrosc., 41 (1987) 572–579
As noted by Reinhard Noll, “Cremers 922 reported on LIBS experiments over distances between 0.5 and 2.4 m and their perspectives for identification of metals (sorting) and real-time analysis of molten metal streams for process control.”
LIBS analysis with isolated droplet aerosols – Archontaki and Crouch, 923 Appl. Spectrosc., 42 (1988) 741–746
Reinhard Noll remarked, “Nd:YAG laser pulses interacting with isolated droplets (one to three) having a volume in the nanoliter range were reported in this work. 923 Detection limits for Li, Na, Mg, Ca, Mn, and Al in the range <8 ppm were determined. Picogram quantities of elements can be detected.”
LIBS as a portable analytical technique – (a) Yamamoto, Cremers, Ferris, and Foster, 924 Appl. Spectrosc., 50 (1996) 222–233; (b) Gornushkin, Amponsah-Manager, Smith, Omenetto, and Winefordner, 925 Appl. Spectrosc., 58 (2004) 762–769
This paper on the detection of metals in the environment using a portable LIBS instrument 924 was recommended by Reinhard Noll, who gave a detailed account of the work: “Yamamoto et al. 924 described for the first time the concept and performance of a portable LIBS instrument, and employed this instrument to study paint samples, soil samples, and particles on filters. In the 1990s, LIBS equipment was usually bulky and heavy, consisting of a set of separate instruments mounted, for example, on an optical table in a laboratory. This paper 924 pointed the way to a much more compact set-up, and thus, the capability for on-site analyses by a portable laser spectroscopic system. At that time, portable X-ray fluorescence instrumentation had been established as a field-screening tool for bulk analysis, which is averaged over several square centimeters of a flat target object and required measurement times of 3 to 10 min. Yamamoto and co-workers 924 pointed out the differences in requirements for a portable LIBS analyzer in contrast to laboratory equipment. They made clear that semi-quantitative information gained in the field within a short time (from a few up to 60 s) instead of laborious sample taking and transport to a laboratory has an application potential. As an example, they studied the detection of metals in the environment, such as lead in paint or metal contaminations in soil and particles collected on filters.”
Noll continued, “Yamamoto and co-workers 924 explored the use of passively Q-switched lasers in a parameter range of low pulse energies and repetition rates (10–20 mJ, 0.5 Hz). The plasma emission was collected directly with an optical fiber having a wide acceptance angle and thus reduced the requirements with respect to the repeatability of the spatial location of the plasma. The portable LIBS analyzer set-up by Yamamoto et al. 924 was split into two units: (i) an equipment case with spectrometer, a non-gated CCD detector, power supplies, and (ii) a sampling probe with integrated laser head and the entrance aperture of the fiber-optic cable. It took nearly two decades until the portable LIBS concept was brought to the commercial market. In 2023, several companies offer handheld LIBS instruments in a single unit, where the components of laser source, spectrometer, and power supply are all integrated into a single device. 926 A competitive market arose in which various models of handheld LIBS systems are offered and are presented in trade fairs and international conferences [starting for example, at LIBS 2016, SciX (The Great Scientific Exchange) 2016 and EMSLIBS (Euro-Mediterranean Symposium on LIBS) 2017]. The total weight (including battery) of these instruments ranges from 1.5 to 2.4 kg (Yamamoto's prototype weighed nearly 15 kg). Repetition rates now go up to the kHz range and mechanisms for raster scans to allow for spatial averaging are incorporated. Quantitative analytical capabilities have been significantly enhanced partly based on the use of inert gas flows and advanced data analyses. 926 Obviously, short working distances allow the formation of a LIBS plasma at much lower laser pulse energies, opening the possibility of using handheld analyzers for industrial applications. On the other hand, the limit to downscaling distances and laser pulse energy has to be carefully assessed by quantitative LIBS measurement. In 2019, a LOD (3-sigma criterion) of 34 µg g−1 was shown for carbon in steel with a compact set-up suited for handheld LIBS units. 927 Such levels of performance were previously limited to much more bulky equipment. We can be curious what further R&D efforts will bring about for LIBS as a portable analytical technique.”
Igor Gornushkin remarked, “A compact LIBS with a 7 μJ/pulse microchip laser was tested by Gornushkin et al. 925 that was a prototype of future hand-held LIBS instruments. It was recognized that a new miniature laser source with excellent lasing characteristics such as sub-nanosecond pulse duration, high beam quality, low pulse-to-pulse variation, and kHz repetition rate, in combination with a miniature spectrometer, can revolutionize LIBS instrumentation, moving it from a laboratory to a measurement site. It was shown that microchip laser ablation results in a micrometer-sized crater, several nanograms of removed mass, and several nanoseconds plasma persistence; these characteristics allow identification and analysis of metallic samples.”
LIBS with femtosecond laser – (a) Margetic, Pakulev, Stockhaus, Bolshov, Niemax, and Hergenröder, 928 Spectrochim. Acta Part B, 55 (2000) 1771–1785; (b) Eland, Stratis, Gold, Goode, and Angel, 929 Appl. Spectrosc., 55 (2001) 286–291
The advantage of using a femtosecond laser, as summarized by Igor Gornushkin is that “LIBS with a femtosecond laser was first realized by Margetic et al. 928 ; it showed better reproducibility and absence of fractionation upon ablation, i.e., reduced matrix effect.” David Hahn added, “This paper 928 examines the use of femtosecond lasers for optical emission spectroscopy with a focus of understanding the fundamental mechanisms as compared to more conventional nanosecond lasers, with goals of mitigating fractionation.”
Mikhail Bolshov explained, “The processes of material removal are completely different for femtosecond pulses and for longer pulses. For a laser pulse longer than a few ps, the material ablation is mainly thermal in nature and most of the material is evaporated from molten metal. For laser pulses of about 100 fs and shorter, material removal has dominantly the character of a ‘phase explosion’, which avoids preferential volatilization (fractionation) of different elements, such as is common in ns-ablation. These features of fs-lasers apply regardless of the detection scheme that follows ablation 928 – for example, LIBS, ICP–AES/MS, TOF-MS.”
Richard Russo recommended these two papers928,929 and indicated, “This paper 928 delves into the spectral and physical characteristics of ns versus fs laser plumes, addressing the timely topic of an ‘ideal laser source’ for a particular application – in this case the ablation of brass which was known to be a difficult case representing the fractionation of Zn and Cu. The different behaviors of ns versus fs plasmas were shown in the persistence of the atomic/ionic lines, their intensity ratios, their dependence on pressure, and the crater profiles. A fundamental overview of ns and fs excitation processes was discussed. Experiments showed that the laser parameters (energy, energy density) could be established for both the ns and fs pulses to mitigate Zn/Cu fractional vaporization. This fractionation issue has been debated throughout the entire history of LA, with remaining questions as to its origin – either at the ablation site, during transport, or in a secondary source (ICP). Likewise, the article by Eland et al. 929 also is one of the early papers to investigate LIBS using a 140 fs laser pulse. The difference in plasma persistence time was highlighted as well as the crater profiles versus energy. To the best of my knowledge, this paper 929 was the first to discuss the possible use of non-gated LIBS detection, because of the high repetition rate and plasma characteristics using fs lasers.”
Nanoscale LIBS with near-field scanning optical microscopy – Kossakovski and Beauchamp, 930 Anal. Chem., 72 (2000) 4731–4737
According to Richard Russo, “Topographical and chemical microanalysis of surfaces with a scanning probe microscope and LIBS was described in this article. 930 A fiber-optic scanning probe microscope with LIBS in a single instrument is presented for sub-micron spatially resolved chemical imaging. Surface topography is analyzed by scanning a sharp fiber-optic probe across the sample using shear force feedback. Femtosecond LIBS using a near-field optical microscope for excitation with far-field optical detection was demonstrated. 931 The limit of measurement for Na was from a crater with a 120 nm diameter equal to about 220 attograms of mass ablated. A crater with diameter less than 30 nm was produced but optical emission was not measured. It is not clear at this level if a plasma existed or if the far-field optics were not appropriate to measure emission induced in the near-field.”
Laboratory LIBS instrument with high degree of control – Motto-Ros, Negre, Pelascini, Panczer, and Yu, 932 Spectrochim. Acta Part B, 92 (2014) 60–69
As stated by Jin Yu, “This paper 932 discussed several important aspects of a LIBS setup that can sensitively influence the repeatability of LIBS measurements, and proposed technical solutions to improve the stability of a laboratory LIBS instrument. These aspects included the position and the inclination of the sample surface, the position of the focal point of the laser beam with respect to the sample surface, the morphology of the induced plasma, and the position of the emission collection optical fibre with respect to the volume of the laser-induced plasma. A configuration for a laboratory LIBS instrument with a high degree of control was described in detail. Implementation of such a configuration was realized and tested with a set of glass samples with satisfactory results.”
Nicoló Omenetto has added some considerations and elaborated, “The explosive increase in LIBS applications to many analytical fields during the years 2005–2015 should be contrasted with critical issues regarding analytical precision and accuracy, which were not at the same levels as those provided by other well established analytical methods. In this respect, the famous quote made by Browner and Boorn 933 that ‘sample introduction was the Achilles’ heel of atomic spectroscopy’ was adapted to LIBS. What that implied was that more attention had to be specifically devoted to controlling the various parameters associated with laser–sample interaction, an issue per se more complicated (and somewhat frustrating) than using well established diagnostic tools for measuring electronic excitation temperature and electron number densities of the plasma. As clearly stated by the authors, 932 such tight control did not mean understanding the complex laser–sample interaction and plasma evolution, but rather was an empirical optimization of the LIBS excitation and detection systems.”
Nicoló Omenetto summarized the above situation with two quotes, one from the astrophysicist Chandrasekhar: “Striving for completeness and striving for understanding need to be balanced,” and by Richard Russo: “Understanding the processes or controlling them?” and stated that the second quote describes well the motivation of this paper. 932
Terms and notations for LIBS – Noll, 934 Anal. Bioanal. Chem., 385 (2006) 214–218
As elaborated by Reinhard Noll, “This paper 934 provides terminology and defines quantities for a clear and comprehensive description of experimental parameters and measurement results for LIBS. From my reviewing experience, I have recognized that, with the increasing number of publications on LIBS in the new century (for example in the year 2005, the number of publications on LIBS surpassed 150 for the first time), there was a multitude of inconsistent nomenclatures used by authors to describe their experimental set-ups and the employed parameters. For a newcomer, this inconsistency is confusing and comparing results of different publications is hindered or even impossible because essential experimental parameters are not given in an unambiguous way or are even omitted.”
Noll further explained, “Using different terms for the same thing complicates the comparison of individual papers and renders literature searches more difficult. Examples are the use of the terms ‘dual pulse’ or ‘double pulse’ (see the discussion in Section 16.6.2 in this compilation), or ‘LIPS (laser induced plasma spectroscopy)’ and ‘LIBS’ or – and this example shows the confusion that can be generated – the definition of the beam waist position in relation to the surface of a target object. In this article, 934 this beam waist position is denoted with Δs and Δs>0 means that the beam waist lies inside the target object (i.e., beneath the surface of the target object). This definition is proposed, because in most cases a beam waist position chosen inside a target object has a ‘positive’ analytical benefit (the polarity being chosen as a mnemonic). Obviously, the beam waist position and also the beam propagation ratio (expressed as the ratio between the waist diameter of the focused actual beam and that of a perfect Gaussian beam; it is commonly referred also to the Quality Factor and reported as the M2 value of a beam) have a crucial impact on the irradiance interacting with the target object and thus on the LIBS process. Yet, in numerous papers these quantities are not given at all or a definition is missing when the term ‘beam waist position’ is used that is just the opposite (i.e., negative values correspond to positions inside the target object). Likewise, the terms used to describe double or multiple pulses as well as the number of pre-pulses and measuring pulses are often not given in a clear and traceable way. This paper 934 proposes unambiguous terminology. It is believed to be the first proposed basis for unified terms and notations for the scientific LIBS community. For newcomers in the field, it can serve as a guideline for a clear description of experimental parameters and measurement results. Of course, future approaches and methods might require further definitions of tailored terms and notations considering novel features of experimental set-ups, measurement parameters and measurement results.”
LIBS (reviews) – (a) Rusak, Castle, Smith, and Winefordner, 935 Crit. Rev. Anal. Chem., 27 (1997) 257–290; (b) Rusak, Castle, Smith, and Winefordner, 936 Trends Anal. Chem., 17 (1998) 453–461; (c) Hahn and Omenetto, 937 Appl. Spectrosc., 64 (2010) 335A–366A; (d) Hahn and Omenetto, 938 Appl. Spectrosc., 66 (2012) 347–419
The two-part review by Hahn and Omenetto937,938 was recommended by several scientists including David Hahn, Vincenzo Palleschi, Steven Ray, Richard Russo, Elisabetta Tognoni, and Zhanxia Zhang. As concisely summarized by Vincenzo Palleschi, “For a comparison of LIBS with other spectrochemical techniques, we can refer to these two review papers by Hahn and Omenetto937,938 as well as the other one by Winefordner et al. 939 ” Likewise, Steven Ray said, “This two-part review937,938 is essential reading for students and practitioners of laser-induced breakdown spectroscopy. The fundamental and experimental aspects of the technique are lucidly explained.” David Hahn added, “This Focal Point article 937 addresses the fundamental physics and associated plasma diagnostics associated with laser-induced breakdown spectroscopy as an analytical technique, with a goal of guiding readers to the relevant literature and in providing a physics-based understanding of LIBS such that the performance of LIBS is improved over a wide range of applications.”
Elisabetta Tognoni remarked, “Omitting these two review papers937,938 is not possible because of the many important issues they touch. Among them, I just want to mention Figure 6 in Part II of the review, 938 where the effects of choosing concentration units in weight fraction or mole fraction in plotting calibration curves are displayed.”
Richard Russo also shared his view: “The manuscript 937 provides a comprehensive overview of the science and issues that have been discussed related to LIBS for over 50 years. Thorough discussion of the fundamental and diagnostics aspects of laser-induced plasmas. Part II of this series 938 summarizes the current state-of-the-art of analytical LIBS, providing a contemporary snapshot of LIBS applications, and highlighting new directions in laser-induced breakdown spectroscopy.”
Zhanxia Zhang commented, “Various areas of LIBS, including its fundamental and diagnostics aspects as well as new directions in LIBS, were well presented in the reviews by Hahn and Omenetto.937,938 The authors, in the final assessment of LIBS, showed that the LIBS technique will be a mature method for analysis of solid samples as well as gaseous and liquid samples.”
Mikhail Bolshov offered another view and recommended a pair of reviews by Rusak, Castle, Smith, and Winefordner935,936 with the note: “Both reviews935,936 discuss fundamental aspects of LIBS and try to predict its future. These reviews935,936 have great impact and were widely referred to because of the growing interest in the analytical community for direct analysis of solids and liquids, thereby avoiding the step of sample pretreatment. 1990s and 2000s were the time when laser ablation (LA) and specifically LIBS experienced the new phase of hectic growth. In both reviews,935,936 the authors summarized the so-far accumulated results on the theoretical models and experimental applications of LIBS and predicted the main trends in the developments of the technique. The authors focused on the analytical aspects of the interactions of laser radiation with a solid or liquid sample, avoiding the discussion of the physical processes of plasma formation and material removal. The majority of representative publications on the analysis of gaseous, liquid and solid samples were mentioned and briefly discussed. The authors avoided critical evaluation of the references and just presented the final results.”
Quantitation and signal processing in LIBS
Curve-of-growth methodology applied to LIBS – Gornushkin, Anzano, King, Smith, Omenetto, and Winefordner, 940 Spectrochim. Acta Part B, 54 (1999) 491–503
According to Elisabetta Tognoni, “While the concept of curve of growth was investigated back in 1913 by Ladenburg and Reiche, 941 to my knowledge, this paper 940 is the reference for its use in the LIBS area. Another reference on the use of curve of growth with a more analytical flavor is this article 942 by Aragón, Bengoechea, and Aguilera.”
Vincenzo Palleschi provided more detail and commented, “In LIBS measurements, the re-absorption of the plasma optical emission by the same plasma (self-absorption) might produce non-linearity in the calibration curves affecting adversely, if not properly dealt with, the trueness of the LIBS analytical results. The self-absorption effect in the (laser-)plasma is introduced and discussed using the curve-of-growth approach in the paper. 940 The paper presents a model of plasma emission and re-absorption which is now widely used for determining and, eventually, correcting the LIBS signal by compensating for the self-absorption. It is worth noting that self-absorption is an unavoidable effect characteristic of the plasma optical emission; this effect should not be confused with the self-reversal effect, which manifests itself in a narrow dip at the line emission maximum. Self-reversal occurs in non-homogeneous plasmas, when the colder, outer plasma layer absorbs the emission of the inner, hotter core.”
Nicoló Omenetto and James Winefordner jointly recommended this article 940 and opined, “The concept, methodology and diagnostical aspects of the curves-of-growth approach to analytical emission curves is presented and discussed here. This paper 940 is recognized by the analytical plasma community to be the first theoretical and experimental paper to add to the determination of electron number density and plasma temperature, the calculation of total atom number density (by matching the theoretical and experimental curves of growth and also applying the duplication factor method), and the onset of self-absorption effects from the intersection of the initial and final asymptotes of the curve of growth. Moreover, the damping constant (a-factor) is calculated together with the line profile of an atomic Cr transition in a stainless steel matrix. Worth noting is that the calculated profiles matched the experimental values obtained by scanning a narrow Ti-sapphire laser across the transition.”
Calibration-free LIBS measurements – (a) Ciucci, Corsi, Palleschi, Rastelli, Salvetti, and Tognoni, 503 Appl. Spectrosc., 53 (1999) 960–964; (b) Tognoni, Cristoforetti, Legnaioli, and Palleschi, 943 Spectrochim. Acta Part B, 65 (2010) 1–14
The article by Ciucci et al. 503 was recommended by several scientists including Igor Gornushkin, Nicoló Omenetto, Vincenzo Palleschi, Elisabetta Tognoni, and James Winefordner. As noted by Elisabetta Tognoni, “The calibration-free approach to the quantitative analysis of LIBS spectra was initially proposed in 1999. 503 This approach implies several assumptions; stoichiometric ablation is the starting point. The plasma is also assumed to be spatially homogeneous; thus, the relative composition of the observed plasma is the same as the sampled target surface. It is also necessary that the plasma is in LTE; thus, what is spectrally emitting is measured and what cannot be measured (the population of the fundamental states) can be extrapolated from the measured emission. Refinements are possible to account for self-absorption. The calibration-free LIBS method is aimed to determine, in principle, the whole sample composition from its spectrum. In practice, it will be possible to determine the relative concentration of a subset of elemental components. To include as many elements as possible, spectra have to be collected in as wide as possible spectral range. Thus, the relative spectral response of the detection system must be known as accurately as possible in the same wide range.”
Igor Gornushkin expanded the discussion and shared his views, “The idea of absolute analysis, originally from GF–AAS, 365 was later implemented in LIBS through the pioneering work by Ciucci et al. 503 The method was tabbed calibration-free LIBS and developed into a rapid semi-quantitative method of analysis. It is now used in many research laboratories and some industries. By introducing a one-point calibration into a calibration-free calculation routine,944,945 calibration-free analysis was brought closer to quantitative. However, by now, both calibration-free methods (AAS and LIBS) remain quite inaccurate for low concentrations.”
As commented by Nicoló Omenetto and James Winefordner, the article by Ciucci et al. 503 is the “first seminal paper proposing a calibration-free procedure to calculate the composition of a sample quantitatively without establishing a calibration curve. The authors outline the basic details of the approach, the physical and instrumental requirements for its correct use and its limitations. The paper 503 gave birth to a series of publications from different groups active in the field describing improvements, modifications, and extensions of the original algorithm developed.”
Vincenzo Palleschi explained, “In LIBS, the line intensities are usually associated with the elemental concentration of the analytes using some simplifying assumptions, which may be more or less important depending on the method of analysis. The calibration-free LIBS approach, presented in its original formulation, 503 links the line intensities in the LIBS spectrum to the concentration of the species using the basic equation of a plasma in LTE (Boltzmann equation for describing the population of the energy levels in the atoms/ions and Saha equation for the equilibrium between neutral and ionized species, with the same temperature). This seminal paper 503 has triggered the interest of several research groups, leading to a large number of papers describing modifications and improvements of the original procedure. A hybrid approach to calibration-free analysis, where a single reference sample is used for gaining information about experimental parameters that otherwise are difficult to determine, is introduced and discussed. 946 The paper 946 is inspired by the ‘fundamental parameter’ approach which is used in X-ray fluorescence for quantitative analysis. In this framework, the information gathered from the analysis of the reference sample is used for determining key instrumental parameters (usually matrix dependent) which would be otherwise difficult to obtain in a pure calibration-free approach.”
The review article by Tognoni et al. 943 was suggested by Nicoló Omenetto, who noted, “After 11 years of the first presentation to the analytical atomic spectroscopic community of the calibration-free procedure, 503 this review 943 presents a much needed analysis of the state-of-the-art of the approach. The paper should be read not only by all those who have already used the method, but especially by those who plan to use it for the first time; in fact, the authors discuss not only its intrinsic limitations but also the problems added by its non-optimal experimental application. A highly recommended reading.”
Factors influencing the precision of LIBS measurements – (a) Schechter, 947 Anal. Sci. Technol., 8 (1995) 779–786; (b) Castle, Talabardon, Smith, and Winefordner, 948 Appl. Spectrosc., 52 (1998) 649–657; (c) Carranza and Hahn, 949 Spectrochim. Acta Part B, 57 (2002) 779–790
As noted by David Hahn, “From an analytical perspective, the LIBS method has always been characterized by significant shot-to-shot variations. These three papers947–949 address spectral fluctuations associated with various sample systems, from pure gases, to solids, to aerosols, suggesting statistical approaches to mitigate such variations. The first paper by Schechter 947 explores the large variations in spectra for aerosol analysis in particular, noting that not every laser pulse hits an aerosol particle, that multiple particles may be sampled at once, and that the mass composition and size may vary. Schechter then proposes a ‘rejection algorithm’ based on the absence of elemental emission lines, continuum emission that is too weak, or generally weak spectra. Improvements in calibration plot performance was demonstrated with Zn-based aerosol particles, although limitations were noted when single-shot spectra produced weak emission-line intensity. Castle et al. 948 continue the exploration of shot-to-shot precision for analysis of pressed copper pellets or pure copper disks, with a goal to identify and quantify the variables affecting LIBS measurements. They explored the dependence on sample movement/translation, number of laser shots, laser pulse-to-pulse stability, detector gate delay, sample surface roughness, and precision of background correction. Laser pulse energy and sample-movement velocity had the greatest effect on the resulting relative standard deviation (RSD) for both inter-measurement and intra-measurement precision. Finally, Carranza and Hahn 949 explored LIBS statistics in pure gaseous and in aerosol-seeded flows. They reported a ‘saturation’ point with regard to laser pulse energy, above which increasing pulse energy coupled the same percentage of energy (60%) into the plasma. Precision of LIBS metrics, including the RSD of the continuum emission, analyte emission lines and peak-to-base ratios was best in the saturation regime; increasing pulse energy in this regime required optimization of the temporal delay time.”
Precision improvement with shot-to-shot data processing – Mermet, Mauchien, and Lacour, 950 Spectrochim. Acta Part B, 63 (2008) 999–1005
As noted by Elisabetta Tognoni, “This paper 950 has the merit of bringing the topics of accuracy, repeatability and trueness to the attention of the LIBS community. Accumulation and averaging of many single shot spectra may not necessarily lead to RSD improvement. Even if focused in this case on microprobe LIBS analysis, the systematic investigation of the sources of noise in LIBS spectra is an example of good practice that should be followed in the lab (and in offline analysis).”
George Chan commented, “This paper 950 provides an outstanding example and procedure on how one can analyze and break down the different sources of signal fluctuation (flicker and shot noise, and drift) in a logical and step-by-step approach. Although LIBS was used as an example, a similar procedure can be applied to other spectrometric sources. It also showed a working example on how to compensate time-correlated noise with internal standardization and drift correction with polynomial fitting.”
Data analysis for discrete particle detection – Hahn, Flower, and Hencken, 951 Appl. Spectrosc., 51 (1997) 1836–1844
As commented by Elisabetta Tognoni, “How to deal with a very low loading rate, with the average number of particles sampled by each laser pulse that is less than unity? Spectral averaging would decrease the signal-to-noise ratio instead of improving it. In this paper, 951 a conditional analysis is proposed, wherein single shot ‘hits’ spectra are processed while single-shot ‘missed’ spectra are discarded.”
David Hahn recounted, “This paper 951 focuses on the analysis of aerosol systems using LIBS, addressing the discrete nature of individual aerosol particles in the context of a finite laser-induced plasma volume. The authors 951 establish a statistical-based methodology for conditional analysis, enabling quantitative analysis of individual particles and analysis of aerosol concentrations at extremely low concentrations by sorting spectra based on the presence or absence of targeted analyte lines. They detail the statistical sampling problem for LIBS-based aerosol analysis in terms of aerosol particle size and number density, the plasma sampling volume, and the Poisson distribution, demonstrating that particle sampling rates can fall well below percentages where ensemble-averaging is statistically viable. Using Monte Carlo simulations, they suggest that single-shot sampling of as few as 20 particles can provide a reasonable estimate of a mean aerosol volume and sampling frequency. A follow-on paper 952 extended the conditional analysis to quantify single-shot LIBS spectra for particle analyte mass using a calibration technique based on monodisperse iron-containing particles of a known iron mass composition. Hahn and Lunden 953 continued the LIBS detection of single aerosol particles, including direct comparison with a commercial laser aerosol spectrometer (i.e., light-scattering based) and found them to be in excellent agreement. Absolute single-particle mass detection limits for magnesium and calcium-based aerosols of approximately 3 femtograms was reported.”
Chemometrics for LIBS spectra processing – (a) Clegg, Sklute, Dyar, Barefield, and Wiens, 954 Spectrochim. Acta Part B, 64 (2009) 79–88; (b) Amato, Cristoforetti, Legnaioli, Lorenzetti, Palleschi, Sorrentino, and Tognoni, 955 Spectrochim. Acta Part B, 65 (2010) 664–670
Nicoló Omenetto recommended this paper by Clegg et al. 954 on multivariate analysis of LIBS spectra and provided an in-depth discussion, “A relevant paper 954 dedicated to a detailed discussion of the matrix effects in LIBS of rocks, focusing on a newer, promising method for LIBS data evaluation and interpretation using multivariate analysis to extract quantitative elemental compositions and determine the likely rock-type or sample classification. Apart from the interest of the work for remote sensing analysis of Martian rocks, there is a section (mole fraction versus weight %) in which the authors draw the readers’ attention to the possible different conclusions which can be reached when concentration (weight %) or atom number density (cm−3) are used in the construction of calibration curves in (laser-induced) emission spectroscopy. Despite the potential analytical relevance of the different resulting plots, the practice of using concentration units has not been abandoned. This section was suggested to the authors by the 2009 journal editor (N. Omenetto). In the geochemist and planetary scientist community, no use is made of mole fractions (rather than weight %), in the construction of calibration curves. The issue brings to mind an interesting background that seems worth sharing with readers. To the editor's knowledge, the only publication reporting a calibration curve with both mole fraction and weight percent was a contribution from the University of Florida, 956 in which reference 20 is listed as: R.J. Krupa, Thermo-Jarrell Ash, private communication. The paper 956 is in fact a spin-off of a presentation given by Robert Krupa at the Colloquium Spectroscopicum Internationale (Melbourne, 1997) and of the ensuing discussion with Omenetto, who was also present at the meeting and who later brought the issue to the attention of the Winefordner group. Krupa should then be given full credit for bringing this to the attention of the analytical spectroscopic community. The final question still remains: Should the elemental composition be reported as atomic fractions or weight percent? The key point is that different signals obtained for the same weight fraction, but different mole fractions, of an element in two different matrices can be mistakenly attributed to the presence of a matrix effect.”
Vincenzo Palleschi recommended the article on automatic ranking techniques for element identification from LIBS spectra by Amato et al. 955 and noted, “The above paper 955 is worthy of being included in an essential LIBS bibliography since it describes a method for the automatic identification of elements in LIBS spectra. In fact, as strange as it may seem, the correct identification of the emission lines in a LIBS spectrum is still a problem, especially for people with limited experience in the technique. The above paper presents a method, based on the Google PageRank algorithm, for automatic labeling of the emission lines in a LIBS spectrum. Besides the algorithm, the paper is important for its statement that the identification should not be done using one line at a time but should instead consider the typical patterns that each elemental species is producing in the LIBS spectrum.”
Fundamentals of laser–material–plasma interactions and plume dynamics
Early work on diagnostics of laser–material interactions – (a) Ready, 957 Appl. Phys. Lett., 3 (1963) 11–13; (b) Bloembergen, 921 IEEE J. Quantum Electron., 10 (1974) 375–386
Reinhard Noll recommended the article by Ready 957 and noted, “This paper 957 is one of the first publications showing time-resolved diagnostics of the interaction of a Q-switched laser pulse with a solid carbon target using a high-speed framing camera. First insights on the dynamics and temperature of the evolving plume are gained.”
Benjamin Smith shared a different view and opted for the article by Bloembergen 921 with an annotation: “Bloembergen's paper 921 is an early review of laser plasma physics, covering the first decade of laser–material interaction research. The focus is fundamental, addressing such issues as breakdown thresholds and damage thresholds in various transparent optical materials and also discusses the phenomenon of self-focusing and filament formation. The difficulties of studying such processes in the 1960s included poor reproducibility in the temporal and spatial behavior of early lasers, especially in multimode operation, and the relative impurity of materials, especially with respect to microscopic inclusions. Taken together, this paper 921 and the one by Leon Radziemski and colleagues 916 provide an excellent overview of LIBS from two very different early perspectives.”
Effect of gas environment (gas identity and pressure) and ambient conditions – (a) Leis, Sdorra, Ko, and Niemax, 958 Microchim. Acta, 98 (1989) 185–199; (b) Iida, 959 Spectrochim. Acta Part B, 45 (1990) 1353–1367; (c) Sdorra and Niemax, 960 Microchim. Acta, 107 (1992) 319–327; (d) Yalçin, Crosley, Smith, and Faris, 961 Appl. Phys. B, 68 (1999) 121–130
This pair of articles958,959 was recommended by Reinhard Noll, who remarked, “This paper 958 described a detailed study of time-resolved spectra to determine Si and Cr in low-alloyed steel samples in an inert gas atmosphere at different pressures. Detection limits, according to the 3σ-criterion, of 24 µg g−1 for Cr and 30 µg g−1 for Si were reported. Iida 959 studied the effects on time-resolved emission spectra caused by the ambient atmosphere in a pressure range from a few torr to atmospheric pressure and the gases air, argon, helium. He showed that the emission characteristics of laser-induced plasmas and the amount of sample vaporized are strongly influenced by the ambient atmosphere. Gas breakdown before the sample vaporization decreases the amount of vaporized sample and worsens analytical performance.”
Elisabetta Tognoni suggested these two articles959,960 and commented, “Iida 959 shows that the emission characteristics of laser-induced plasmas as well as the amount of sample vaporized are appreciably influenced by the ambient atmosphere. The paper by the group of Institut für Spektrochemie und Angewandte Spektroskopie 960 aims to provide the reader with some sort of recipe for optimizing the experimental conditions, and thus the analytical results, whereas Iida, 959 in his paper, seems to be more concentrated on understanding the mechanisms at play.”
David Hahn recommended the article by Yalçin et al. 961 and opined, “The authors 961 explore in detail the influence of analytical environments associated with LIBS, including gas composition, humidity, particulate loadings, and laser energy. A range of spectroscopic methods were employed to quantify their analysis, including Stark broadening, Saha–Boltzmann analysis, and Abel inversion.”
Vincenzo Palleschi complemented the discussion by stating “In the LTE approximation, the equilibrium temperature (at a given point in the evolution of the plasma) can be determined using the Boltzmann plot method or the Saha–Boltzmann plot method. The latter was introduced in the above paper 961 for the analysis of LIBS plasmas.”
Plasma shielding, preferential vaporization, and phase explosion in laser–material–plasma interactions – (a) Mao, Chan, Caetano, Shannon, and Russo, 962 Appl. Surf. Sci., 96–98 (1996) 126–130; (b) Yoo, Borisov, Mao, and Russo, 963 Anal. Chem., 73 (2001) 2288–2293
Vincenzo Palleschi commented, “For application of the calibration-free LIBS methods, the composition of the sample and of the plasma must be the same (stoichiometric ablation). In LIBS, as well as in other laser-ablation techniques, non-stoichiometric effects can be produced by fractionation. The above paper by Mao et al. 962 explains clearly how fractionation may be important at low laser irradiances.”
As recounted by Richard Russo, “The craters resulting from high-irradiance single-pulse laser ablation of single-crystal silicon show a dramatic increase in volume at a threshold irradiance. Time-resolved shadowgraph images show ejection of large particulates from the sample above this threshold irradiance. A numerical model was used to estimate the thickness of a superheated layer near the critical state. This paper by Yoo et al. 963 proposes a mechanism that induced transparency promotes the formation of a deep superheated layer, and explosive boiling within this layer leads to particulate ejection from the sample.”
Expansion of the laser ablation vapor plume into a background gas – (a) Wen, Mao, Greif, and Russo, 964 J. Appl. Phys., 101 (2007) 023114; (b) Wen, Mao, Greif, and Russo, 965 J. Appl. Phys., 101 (2007) 023115
As noted by Alessandro De Giacomo, “This two-part paper964,965 gives a clear view of shockwave formation during laser ablation and shows, from both experimental and theoretical points of view, the repartition of energy between the sample and the background gas. This is one of the few works dealing with the formation and the characteristics of the plasma in the first tens of ns after the laser–matter interaction.” Related material on gas-expansion dynamics can be found in Section 16.6.2.
Nicoló Omenetto elaborated, “As in other examples of literature cited in this compilation, these two papers964,965 need to be considered together: As a general comment, the reader should be aware that any theoretical analysis of the complex ablation dynamics per se (without experimental follow-up) will have a less profound impact on understanding the behavior of the essential parameters governing the overall process. This two-part detailed analysis, where theory 964 and experiments 965 are described in sequence, is well worth careful reading and should not be missed. Fundamental previous literature that focused on essential parameters of the overall process (in particular, energy conversion efficiency and on the quantity of sample vaporized) is listed, perhaps with the caveat that some of the quoted literature may be difficult to find. The reader will benefit from becoming acquainted with the basic terminology and theoretical equations pertinent to these types of studies. To mention a few, density, temperature and pressure distributions, energy transfer between the laser and the plume formed, with the welcome result of determining parameters not amenable to direct measurement. The authors have chosen a multi-stage approach for their presentation, discussing the sequence of events that, when taken together, allow a complete description of the time and space evolution of the overall process. As expected, the two papers964,965 collect all the mathematical expressions pertinent to the sequence of fundamental events. This is intended to highlight the role of the various physical parameters; even if intimidating at first, the reader will benefit from such a collection, since it allows immediate access to the pertinent theoretical expressions related to a more fundamental discussion of the laser-created plume dynamics. These theoretical predictions 964 are tested experimentally in the second paper, 965 using shadowgraphy and spectral line emissions from a copper target ablated by a Nd:YAG laser, in three different gas environments. Useful practical considerations are finally presented, linking the knowledge obtained to the goal of the planned experiment: for example, high laser-energy conversion efficiency dictates the optimal choice of the gas environment.”
Jin Yu added, “A theoretical model based on the conservation of mass, momentum, and energy is developed in this paper by Wen et al. 964 to describe the propagation of shockwaves initiated following the incidence of a nanosecond laser pulse onto the surface of a solid target. The amount of laser energy transferred to the vapor plume and the surrounding ambient gas, as well as the mass of the vaporized sample material, determine the positions of the shockwaves and the contact surface boundary separating the compressed ambient gas and the vapor plume. In addition, the internal shockwave propagation within the vapor plume was observed; the interaction of the internal shockwave with the sample may be one of the mechanisms inducing ejection of liquid phase material during laser ablation. In the follow-up paper, 965 the authors presented their observations on the early stage expansion of a laser-induced plasma on a metal surface with shadowgraphy. Time-resolved spectral images further showed internal shockwaves striking the sample surface at tens of ns after the beginning of the ablation and vortex rings appearing several hundred ns after the incidence of the laser pulse.”
LIBS plasma confinement: Hydrodynamics, instrumental, and analytical implications – (a) Corsi, Cristoforetti, Hidalgo, Iriarte, Legnaioli, Palleschi, Salvetti, and Tognoni, 966 Appl. Spectrosc., 59 (2005) 853–860; (b) Shen, Sun, Ling, and Lu, 967 J. Appl. Phys., 102 (2007) 093301; (c) Popov, Colao, and Fantoni, 968 J. Anal. At. Spectrom., 25 (2010) 837–848; (d) Yeates and Kennedy, 969 J. Appl. Phys., 108 (2010) 093306
Nicoló Omenetto has suggested a group of papers966–969 dealing with the phenomenon of plasma confinement, and commented, “The selection was restricted mostly to papers involved more in the spectroscopic aspect and analytical benefits of the hydrodynamic effect of confinement rather than in its fundamental fluidodynamic description. Those interested in the rigorous physico-mathematical aspects of plasma dynamics in cavities will find other pertinent material related to this topic in other parts of Section 16.3. In simple terms, when a laser generates a plasma in a gaseous medium, a shock wave is produced that expands and travels at high speed (expansion stage). When an obstacle is present in its expansion path, the shock wave is reflected back to the plasma center, causing the plasma to shrink, its temperature to increase and the emission intensity of the ablated material to be significantly enhanced. Attaining plasma confinement conditions can therefore be advantageous for analytical applications. The above justifies the attention devoted to this topic by several research groups, who created on purpose the confinement by the use of small (∼few mm) chambers, 968 pipes with curved ends tightly attached to the cylindrical target face, 967 and rectangular, 969 cavities. The paper by Yeates and Kennedy 969 is particularly recommended for a detailed description of the time history of the various phases of the overall process (from confinement to decay), supported by the corresponding experimental determination of time-resolved profiles of electron number densities and ionization temperatures from selected ionic transitions.”
Nicoló Omenetto continued and emphasized, “One word of caution: the enhancement of temperature and collisional excitation resulting in stronger signals does not necessarily yield enhanced analytical precision and accuracy. As shown by Popov et al., 968 the RSD of the analytical signal is strongly dependent upon the position of the laser focus with respect to the sample surface. Compared to a free-expanding plasma, the LODs for several elements in soils were found to be 2 to 5 times better only by careful adjustments of the laser-focus position. Corsi et al. 966 pointed out that plasma confinement effects within craters are dictated by the crater walls, making signals strongly dependent on the crater depth; as a result, the use of several successive laser shots creating deeper and deeper craters could then induce errors in quantitative depth profiling analysis.”
Internal structure of laser-induced plasma by time-resolved differential spectroscopic imaging – (a) Motto-Ros, Ma, Grégoire, Lei, Wang, Pelascini, Surma, Detalle, and Yu, 970 Spectrochim. Acta Part B, 74–75 (2012) 11–17; (b) Ma, Motto-Ros, Bai, and Yu, 971 Appl. Phys. Lett., 103 (2013) 204101
According to Jin Yu, “This paper by Motto-Ros et al. 970 describes in detail the technique of dual-wavelength differential spectroscopic imaging, with which time-resolved images of a laser-induced plasma according to a specific emission line of a given species (neutral or ionized form of an element) in the plasma can be acquired. In the work by Ma et al., 971 the internal structures of the plasmas induced by nanosecond laser pulses with different wavelengths at 355 nm (UV) and 1064 nm (IR) on the surface of an aluminum target in an ambient gas of argon were studied with time-resolved dual-wavelength differential spectroscopic imaging. Such a structure is determined by the post-ablation interaction of the plasma with the tailing part of the laser pulse. The observations showed a spherical form for UV pulse-induced plasmas with different species distributed in a layered structure, with an appearance similar to a combustion wave. The similarity can be viewed from the perspective that the energy supporting a chemical combustion wave comes from oxidation reactions whereas in a laser induced plasma, it is from the absorption of laser energy by the gas. For IR pulse-induced plasmas, an elongated form was observed with a large zone of mixture between ions from the ablated vapor and those from the ambient gas, which is the consequence of a laser-supported detonation wave.”
Fundamental characterization and spectrophysics in LIBS
Non-equilibrium and equilibrium problems in laser-induced plasmas – Capitelli, Capitelli, and Eletskii, 972 Spectrochim. Acta Part B, 55 (2000) 559–574
As noted by Alessandro De Giacomo, “This paper 972 is one of the first papers on LIBS which introduces, in a very simple way, non-equilibrium issues in laser induced plasmas and adapts typical considerations of a non-equilibrium plasma to the case of laser induced plasmas. The paper clearly shows the coexistence of the Maxwellian form of the electron energy density function and the recombination character of the plasma in LIBS-like plasmas.”
Characterization of LIBS emission in absolute terms – (a) Rieger, Taschuk, Tsui, and Fedosejevs, 973 Spectrochim. Acta Part B, 58 (2003) 497–510; (b) Taschuk, Godwal, Tsui, Fedosejevs, Tripathi, and Kearton, 974 Spectrochim. Acta Part B, 63 (2008) 525–535
Nicoló Omenetto recommended this pair of articles973,974 and stated, “The group of Fedosejevs at the University of Alberta (Canada) has made several important contributions to the development of laser-induced plasmas, and these two papers973,974 are an example. By emphasizing the necessity of characterizing the performance of different setups in absolute terms, a more meaningful comparison could result. Indeed, with an absolute calibration, one could extract data that would reflect the plasma behavior rather than the combined plasma-equipment behavior. An additional merit of the paper is a detailed discussion of signal and noise using radiometric units.”
Comparison of line-of-sight and local determined atom and ion excitation temperatures in LIBS – Aguilera and Aragón, 975 Spectrochim. Acta Part B, 59 (2004) 1861–1876
Elisabetta Tognoni commented, “The authors 975 used Abel inversion to obtain radially resolved spectra from line-of-sight integrated spectra of the plasma. Temperature values separately obtained from atomic and ionic emission lines of the same radially resolved spectrum were locally the same within experimental error, differently from what resulted from line-of-sight integrated spectra. According to the authors, 975 temperature values obtained by using spatially integrated emission lines should be considered as ‘population-averaged’ or apparent temperature values, due to the different conditions present in different plasma regions. While the implications of choosing time resolved or time integrated spectral acquisition are quite well known, the spatial structure of the plasma is often disregarded. This work 975 sheds light on this important topic.”
The role of continuum radiation in LIBS – De Giacomo, Gaudiuso, Dell'Aglio, and Santagata, 976 Spectrochim. Acta Part B, 65 (2010) 385–394
According to Alessandro De Giacomo, this paper 976 is important because, “It, for the first time, establishes how continuum radiation works in LIBS, 976 including the effect of high density. In most articles on LIBS, continuum radiation has been treated with great confusion using low density plasma interpretation or, in the worst cases, ascribing its features to background noise. On the contrary, this paper shows, with studying continuum radiation, how the recombination character of the plasma produces excited states and how to retrieve temperature from the continuum. The paper is largely used also in material science for investigating high density laser induced plasma processes.”
Modeling of LIBS
Kinetic processes, collisional–radiative model of LIBS – (a) Colonna, Pietanza, and Capitelli, 977 Spectrochim. Acta Part B, 56 (2001) 587–598; (b) Ribière and Chéron, 978 Spectrochim. Acta Part B, 65 (2010) 524–532; (c) Pietanza, Colonna, De Giacomo, and Capitelli, 979 Spectrochim. Acta Part B, 65 (2010) 616–626; (d) Morel, Bultel, and Chéron, 980 Spectrochim. Acta Part B, 65 (2010) 830–841
This set of three papers977,979,980 was recommended by Alessandro De Giacomo with comments, “The three papers977,979,980 adapt the collisional–radiative model of a plasma to the case of a laser-induced plasma. These theoretical approaches, based on the collisional–radiative model, investigated how the transient nature of the laser-induced plasma, determined by the expansion features, directly affect the electron energy distribution function and consequently the population of excited states and the distribution of emission lines, including non-equilibrium effects that are generally not discussed in experimental approaches.”
Nicoló Omenetto reinforced the above comments by pointing out the tutorial aspect of the cited papers and explained, “Collisional–radiative models of plasmas have indeed been amply described in the past (see, for example, the book Plasma Diagnostic Techniques edited by Huddlestone and Leonard 981 and Section 7.3 of this compilation). These three papers977,979,980 show that much experimental care and careful data scrutiny are needed when using spectroscopic methodologies to calculate ionization-recombination coefficients, temperatures, and electron number densities in LIBS plasmas if one wants to avoid erroneous conclusions about the existence of thermodynamic equilibrium. A typical example is offered by the misuse of the validity of the McWhirter criterion to demonstrate the existence of local thermodynamic equilibrium (LTE) 169 (see Section 7.3.3).”
Omenetto added the paper by Ribiere and Chéron 978 to this section and opined, “The intriguing aspect of this work 978 is the use of absorption measurements, providing absolute total number densities, as opposed to excited state number densities provided by emission measurements, and a comparison of the experimental results with theoretical calculations based on radiation transfer theory. Experimentally, two pulsed Nd:YAG lasers are used, one to create the analytical plasma under study and the second, fired at variable short delays from the first, to provide the plasma serving as the UV continuum backlight primary absorption source. Two additional welcome features of the approach are that neither LTE assumptions nor calibration of the system are required. The authors have convincingly demonstrated the usefulness of the approach by reporting temporal and spatial evolutions of absolute plasma populations for selected elements in metallic alloys, showing that the proposed approach was accurate. One last comment for readers interested in this topic: as mentioned by the authors, 978 the use of a laser-induced plasma as a primary source for absorption is not new, see for example Novak and Windsor. 982 This kind of light source can be used in the vacuum-UV spectral region as demonstrated by Costello et al. 983 ”
Modeling the dynamics of emitted radiation in LIBS – (a) Gornushkin, Stevenson, Smith, Omenetto, and Winefordner, 984 Spectrochim. Acta Part B, 56 (2001) 1769–1785; (b) Gornushkin, Kazakov, Omenetto, Smith, and Winefordner, 985 Spectrochim. Acta Part B, 59 (2004) 401–418; (c) Gornushkin, Kazakov, Omenetto, Smith, and Winefordner, 986 Spectrochim. Acta Part B, 60 (2005) 215–230
Alessandro De Giacomo recommended this cluster of articles on the modeling of radiation dynamics in LIBS because, “This set of three papers984–986 deals with the effect of dynamics of the emitted radiation in a laser induced plasma. The developed approach allows a simple physical interpretation of the spectral effects observed of the line radiation, the self-reversal of spectral lines, and the appearance of further spectral spikes inside a self-reversal signal. Moreover, these works, being aimed to link the transport of radiation to the initial conditions of the plasma, may indicate the possibility of absolute intensity estimation and in turn absolute analysis. Although the papers investigate a binary system under vacuum conditions, the effect of laser induced plasma parameters on observed radiation features is of general interest for the understanding of radiation dynamics in LIBS experiments.”
Vincenzo Palleschi specifically recommended this article 986 and commented, “An alternative interpretation of the calibration free-LIBS method (Monte Carlo LIBS) is presented in the above paper, 986 in which Igor Gornushkin and his co-authors discussed the modeling of the optical emission of the plasma by varying its important physical parameters (electron temperature and number density) and resulting effects on the composition using Monte Carlo optimization.”
Modeling chemistry in laser-induced plasmas – Shabanov and Gornushkin, 987 Appl. Phys. A, 124 (2018) 716
As recounted by Igor Gornushkin, “A novel approach is proposed by Shabanov and Gornushkin 987 to calculate formation of molecules in laser induced plasmas. This work is important in view of the ever-increasing interest in detection of molecules by LIBS. A universal algorithm was developed for solving the multi-reaction chemical equilibrium based on first principles. The algorithm was embedded in a hydrodynamic code and allowed the prediction of space- and time-resolved plasma composition. The algorithm was tested on Ca–Cl and C–Si–N chemical systems and demonstrated, among other things, the advantages and limitations of determination of ‘difficult’ elements (e.g., Cl) via the emission of molecular radicals (e.g., CaCl).”
Laser-induced breakdown spectroscopy (LIBS) with configurations beyond a single laser pulse
Early report on double-spike laser ablation – Piepmeier and Malmstadt, 988 Anal. Chem., 41 (1969) 700–707
Stanley Crouch commented, “The Piepmeier–Malmstadt paper 988 is an early report on laser ablation describing the absorption of energy by the plasma formed by vaporizing an aluminum alloy.” Reinhard Noll noted, “Piepmeier and Malmstadt 988 reported temporally and spatially resolved spectrometric observations with single- and multiple-spike, Q-switched laser plumes. They especially considered a solid sample immersed in a gas such as air. Craters generated by single-spike and double-spike (pulse separation of 0.5 µs) laser pulses were studied.”
Double-pulse LIBS (with a single laser source) – (a) Sattmann, Sturm, and Noll, 989 J. Phys. D: Appl. Phys., 28 (1995) 2181–2187; (b) St-Onge, Sabsabi, and Cielo, 990 Spectrochim. Acta Part B, 53 (1998) 407–415; (c) Noll, Sattmann, Sturm, and Winkelmann, 991 J. Anal. At. Spectrom., 19 (2004) 419–428
Double-pulse LIBS can be performed either with a single laser source or with multiple laser sources. The first approach offers experimental simplicity and enables in-line LIBS applications, especially in industry, while the second provides additional flexibility for fundamental studies. Reinhard Noll recommended two articles989,991 on this topic and recalled, “Sattmann et al. 989 studied the effect of collinear double and multiple pulses on mass ablation and plasma characteristics for steel samples and showed the achievable enhancement of detection limits for trace elements. Material ablation was studied for single, double, and four-pulse bursts at different ambient gas pressures and for varying burst energies. Enhancements of the material ablation by double pulses versus single pulses (both having the same total pulse energy) by more than an order of magnitude were demonstrated. The work by Noll et al. 991 is a study on the dynamics of the plasma evolution and shock wave propagation of plasmas induced by single and collinear double pulses using high-speed framing and streak photography of the expansion phase of the luminous plasma and Mach–Zehnder interferometry combined with framing and streak photography to measure directly the refractive index distribution caused by the evolving shock wave and plasma. The effect of collinear double pulses is a local transient reduction of the particle density in the vicinity of the sample surface caused by the first pulse. Due to this effect, the ablation caused by the second pulse is enlarged and fills the pre-formed adjacent void (volume of reduced particle density generated by the first pulse) within a short time (propagation speed of the luminous front is by about a factor of 2 higher). Higher plasma temperatures are achieved, line emissions are enhanced and last longer. In contrast to the orthogonal configuration, the collinear double pulse approach has a decisive advantage: it can be implemented in a much more compact way – such as in cylindrical probe heads, measurement lances – which is very important for in-line measurement tasks as, for example, in industrial applications.”
Reinhard Noll continued, “At the time we started the research work leading to this paper, 989 our motivation was to improve the analytical performance of LIBS to enable practical applications. Our intuition was that we should modify the temporal shape of the laser pulse in order to optimize the plasma generation and to drive the plasma into a physical state that is advantageous for optical emission spectrometry. In another research project, which we conducted a few years earlier, we used double pulses of a ruby laser for double pulse holographic interferometry to measure vibration patterns of mechanical components. Hence we got some experience in modulating the Q-switch operation of solid-state lasers. That was the trigger point to study the effect of time-modulated laser pulses as, for example, double pulses for LIBS.”
Igor Gornushkin recommended another article 990 and noted, “LIBS went through many instrumental modifications, all in close connection with the development of excitation sources (laser sources) and detectors (e.g., ICCD). Double-pulse LIBS was employed by St-Onge et al. 990 to enhance plasma emission and reduce analysis error. Double-pulse operation was achieved by double-triggering a Q-switched laser. The results of this investigation revealed that the double-pulse plasma was not much hotter or denser than a single-pulse plasma at the same laser energy; the enhancement came from a larger ablated mass and larger emitting volume.”
Nicoló Omenetto commented, “The above paper by Noll et al. 991 clarifies the meaning of double or dual pulse operation versus single pulse operation by considering that double-pulse operation does not necessarily imply the use of two laser sources, but can be experimentally achieved by using a single laser source, by controlling the Q-switch within a single flashlamp discharge, or by spatially superimposing the two beams obtained with two independent laser sources. Using two laser sources offers more flexibility in choosing the wavelengths of the two pulses and their spatial orientation (collinear or orthogonal; different beam diameters). Furthermore, double-pulse LIBS based on single laser-beam splitting in combination with an optical delay was also reported. 992 ”
Double-pulse versus single-pulse LIBS: experimental and theoretical comparison – (a) Corsi, Cristoforetti, Giuffrida, Hidalgo, Legnaioli, Palleschi, Salvetti, Tognoni, and Vallebona, 993 Spectrochim. Acta Part B, 59 (2004) 723–735; (b) Asgill, Brown, Frische, Roquemore, and Hahn, 994 Appl. Opt., 49 (2010) C110–C119
Vincenzo Palleschi shared the article by Corsi et al. 993 and commented, “A fuller explanation of the phenomenon in double-pulse LIBS was given in the above paper 993 and the associated comments.995,996 The density of the ambient gas behind the shock wave front, after the first laser pulse, can be calculated taking account of the pressure (which is higher than the ambient; the shock wave is expanding, in fact) and the gas temperature (which is higher than the ambient, because of the presence of the plasma produced by the first laser pulse). The net result of these two effects is a reduction of the air gas density which can reach values very close to the optimum ones observed in typical nanosecond LIBS experiments (about 1/10 of the gas density at room conditions, for measurements in air).”
Nicoló Omenetto recommended another paper 994 and commented, “The paper by Asgill et al. 994 deals with a comparison of single- and double-pulse experiments in the study of atmospheric aerosol streams using elemental carbon as the analyte. While the main analytical goal of most double-pulse studies was the achievement of better sensitivity and detection limits, the interesting outcome of the work 994 was that the trend experimentally observed in the double-pulse enhancement, calculated from the experimental double-pulse/single-pulse ratio, was related to the phase of the analyte. For both laser platforms used (two ns-pulsed lasers for platform 1 and a ns–fs combination for platform 2), the authors argue that an optimization of the timing of both pulses will improve the double-pulse/single-pulse ratio and maximize the difference between the analyte responses in the two phases. These experimental results will improve the understanding of the dynamics of analyte response in plasmas, adding further knowledge (rates of dissociation, as well as heat and mass transfer rates) to the field of aerosol studies and laser-particle interactions.”
Underwater LIBS with dual pulse excitation – (a) Casavola, De Giacomo, Dell’Aglio, Taccogna, Colonna, De Pascale, and Longo, 997 Spectrochim. Acta Part B, 60 (2005) 975–985; (b) Lazic, Laserna, and Jovicevic, 998 Spectrochim. Acta Part B, 82 (2013) 42–49; (c) Lazic, Laserna, and Jovicevic, 999 Spectrochim. Acta Part B, 82 (2013) 50–59
As noted by Annemie Bogaerts, “This work998,999 utilizes fast photography to study the plasma and vapor bubble formation and evolution after a nanosecond laser pulse delivered to aluminum targets under water, as well as investigation of double-pulse excitation and inter-pulse delay, and optimization of the optical collection system. In paper, 998 the evolution and propagation of the initial shockwave and its reflections were measured by Schlieren photography. The authors 998 reported that the primary plasma develops in two phases: (i) the first μs gives rise to violent particle expulsion and ionization, which is (ii) followed by slow plasma growth. Part II of the work 999 reported the effect of time delay between the two laser pulses. Optical absorption by the growing bubble was found to be not significant, but a drop in the refractive index was noted, which resulted in defocusing of both the incident beam and resulting plasma radiation. Therefore, optimization of the optical collection system was discussed.”
The article by Casavola et al. 997 was added by Nicoló Omenetto, who pointed out that, “The above three papers997–999 together cover the necessary basic theoretical, instrumental and experimental features of single- and double-pulse underwater LIBS, from the bubble formation and expansion to its collapse, with a lucid discussion on the effects that the delay between the first and second pulse have on the plasma dynamics, including that produced by the chemical reactions between the underwater target and the environment inside the bubble. In addition, the articles997–999 provide an exhaustive coverage of the previous literature, and should be beneficial to anyone involved (or even just interested) in planning underwater LIBS experiments.”
Nanoparticle-enhanced LIBS – (a) De Giacomo, Gaudiuso, Koral, Dell'Aglio, and De Pascale, 1000 Anal. Chem., 85 (2013) 10180–10187; (b) De Giacomo, Gaudiuso, Koral, Dell'Aglio, and De Pascale, 1001 Spectrochim. Acta Part B, 98 (2014) 19–27
The use of nanoparticles to enhance LIBS signals is an innovative approach developed in the last decade. José Costa-Fernández commented, “A key research trend in analytical chemistry nowadays is the search for signal amplification. This article 1000 demonstrates the synergistic combination between nanotechnology and analytical developments. Here, an increase of one to two orders of magnitude in laser-induced breakdown spectroscopy signals was obtained by depositing silver nanoparticles on metal samples. It could serve as an example of the useful incorporation of new developments in the young area of nanotechnology into current developments in spectroscopic techniques and methods, illustrated here through the significant improvement in performance of a well-consolidated LIBS spectroscopy induced by inorganic nanoparticles.”
Igor Gornushkin noted, “Nanoparticle-enhanced LIBS was proposed by De Giacomo et al.; 1000 it was capable of enhancing optical emission signals due to strengthening the laser field by nanoparticles.”
Vincenzo Palleschi explained, “One of the most exciting improvements of the LIBS technique is the nanoparticle-enhanced LIBS approach proposed in 2013, 1000 and modeled theoretically in 2018, 1002 by the group of Alessandro De Giacomo. According to the current interpretation of the phenomenon, a layer of nanoparticles deposited on a metallic surface may produce a large enhancement of the laser pulse electric field, thus increasing the atomization and excitation of the ablated material. Nanoparticle-enhanced LIBS can be also applied to non-metallic samples, where the nanoparticles have been demonstrated to effectively reduce surface damage in LIBS analysis.”
Annemie Bogaerts suggested another paper 1001 on this topic with comments: “This paper 1001 studies the basic mechanisms of the strong LIBS emission signal enhancement, obtained by depositing nanoparticles on the sample surface of conductors by drying a micro-drop of colloidal solution. The authors 1001 explained the enhancement by faster and more efficient production of seed electrons.”
Simultaneous LIBS and laser ablation–ICP measurements – (a) Fernandez, Mao, Chan, Shannon, and Russo, 1003 Anal. Chem., 67 (1995) 2444–2450; (b) Latkoczy and Ghislain, 1004 J. Anal. At. Spectrom., 21 (2006) 1152–1160
As recounted by Richard Russo, “This paper 1003 became the foundation for our tandem concept where we use both the ICP and laser-induced plasma signals for analysis and for correlation. For both conducting and non-conducting samples, the ICP–AES and laser-induced plasma emission intensity followed similar behavior versus laser energy, both showing an increase and roll off with higher energy. The importance of the correlation was viewed as a means to compensate or mitigate the influence of emission fluctuations in the ICP–AES emission and improve precision.”
Vincenzo Palleschi added, “Among the many recent applications of the LIBS technique it's worth mentioning the combined use of LIBS and LA–ICP–MS, 1004 in which the LIBS information can be used to complement the mass spectrometry data for the elements difficult to detect in a standard LA–ICP–MS configuration.”
Nicoló Omenetto expanded these thoughts by indicating, “The underlying concept behind such investigations is strictly analytical on one hand, 1004 showing the complementarity of the instrumental approaches in terms of figures of merit (sensitivity and detection limit achievable, precision and accuracy, range of applicability) and fundamental on the other, 1003 in the sense that the simultaneous observation of the effects resulting from changes in the key parameters affecting the various stages of the sampling (ablation), transport and excitation–ionization processes in the plasma could result in the identification of correlations leading to normalization procedures benefitting both analytical precision and accuracy.1003,1004 While agreeing with Palleschi, I find the advantage of analytical complementarity of the tandem approach to be unnecessarily restrictive, and would like to emphasize the far-reaching value of simultaneous diagnostic studies. Recall that, in the (admittedly simpler) case of LIF versus LEI in flames, the question of choosing the former versus the latter technique (i.e., measuring photons or ions) became irrelevant if one considered the advantages offered by the simultaneous use of both approaches. In a chapter published in the book Laser-Enhanced Ionization Spectrometry edited by J.C. Travis and G.C. Turk, 1005 Omenetto and Farnsworth opted therefore for the title ‘Ions and Photons…’, showing how fundamental parameters (e.g., ionization yield, cross sections, and absolute number densities) could be calculated from simultaneous data collection. As another example, Turk and Travis 870 investigated random signal fluctuations and showed how noise correlation between LEI and LIF could be used to cancel the noise in the interfering background signal. Should similar studies with the tandem LIBS and LA–ICP–MS approach be feasible, they are certainly worth pursuing.”
Novel LIBS instrumentation
Space exploration and the Mars science laboratory rover – (a) Knight, Scherbarth, Cremers, and Ferris, 1006 Appl. Spectrosc., 54 (2000) 331–340; (b) The ChemCam Team, 920 Spectrochim. Acta Part B, 82 (2013) 1–27; (c) The ChemCam Team, 1007 Spectrochim. Acta Part B, 130 (2017) 82–100
As commented by Elisabetta Tognoni, “This article 1006 describes the potential of LIBS as a stand-off analytical technique for space exploration, taking into account the reduced ambient gas pressure and the different kind of ambient gas.”
Annemie Bogaerts recommended the two articles on the Mars rovers920,1007 and noted, “The ChemCam team,920,1007 i.e., the French–USA group of researchers involved in LIBS studies of Mars, allowed determination of the compositions of different types of geological samples (basalts, calcium and magnesium sulfates, opals and apatites) covering a range of targets observed on Mars, by means of a laboratory replica of the LIBS instrument on board the Curiosity rover. In particular, hydrogen was measured at the surface of Mars. 1007 The authors 1007 reported that several factors can affect the standoff LIBS signal, including laser parameters, conditions of the atmosphere and differences in target properties. Therefore, they performed dedicated laboratory tests, to compensate for these effects, so that the laboratory calibration could be applied to the Mars data, and demonstrated that the calibration curve was more or less independent of the sample type.”
Igor Gornushkin added, “This paper 920 (and others by the same group) provides a gold standard for thoroughness in treatment of experimental results. A great example of systematic approach to the solution of a problem, in which failure is not an option, is the processing of data for the ChemCam LIBS instrument, designed for the Mars rover laboratory.”
Filament-induced stand-off LIBS – Rohwetter, Stelmaszczyk, Wöste, Ackermann, Méjean, Salmon, Kasparian, Yu, and Wolf, 287 Spectrochim. Acta Part B, 60 (2005) 1025–1033
Jin Yu recounted, “In this paper, 287 with intense femtosecond laser pulses propagating in filaments formed inside of a non-focused beam, LIBS spectra from a metallic target situated at increasing distances from the container hosting the laser system up to 90 m were acquired. When the initial chirp of the output laser pulses was adjusted to optimize the intensities of the filaments on the surface of the target, LIBS spectrum intensity from the plasma induced on the target was kept constant while the target distance increases. The detection with a telescope situated in the laser container showed a decrease of LIBS signal according to 1/R2, as the distance R increases, dictated by the solid angle of the used telescope. In addition, ablation with femtosecond laser filaments of an aluminium target situated at a distance of 180 m from the container was demonstrated with the detection of emission from the Al I 394.4 nm line by a detector placed near the target. A microphone was used in the experiment to measure the position, the length, and the strength of the filaments.”
Characterization of single micro- and nano-particles by optical catapulting–optical trapping–LIBS – Fortes, Fernández-Bravo, and Laserna, 1008 Spectrochim. Acta Part B, 100 (2014) 78–85
As summarized by Annemie Bogaerts, this work 1008 describes a “study on LIBS detection of single nanoparticles at very low quantities (femtogram range) by optical catapulting–optical trapping, thus confirming the extreme sensitivity of LIBS for this application.”
Nicoló Omenetto also suggested this article 1008 and opined, “In this paper, 1008 the authors isolate and characterize the mass of a single particle in the nano–micro size region using known laser-based methods (optical catapulting and trapping) at an accurately determined position in space. The particle is then vaporized in a plasma emitting state by another laser. The plasma emission is collected and transferred to the detector. The purpose of the experiment is to gain fundamental information on the plasma–particle versus laser–particle interaction dynamics. The unique feature of this methodology is that the signal photons detected originate from a known amount of mass (atoms), therefore allowing an absolute calibration (photons detected per atom emitting) of the overall collection–detection chain.”
Direct mass-spectrometric detection of laser-induced plasma
Laser microprobe mass spectrometry – Hillenkamp, Unsöld, Kaufmann, and Nitsche, 1009 Appl. Phys., 8 (1975) 341–348
As pointed out by Wei Hang, “This is the first paper 1009 that emphasized the use of a laser as a microprobe for mass spectrometry specifically. Initially, it was intended for application in biomedical and physiological research for thin section specimen of micron thickness. The microplasma generated from the irradiated volume was analyzed in a time-of-flight mass spectrometer. Laser micro-sampling has the advantages of ease of use and manipulation, no matter what kind of specimen is being analyzed. Laser microprobe mass spectrometry has a comparable sensitivity to that of secondary-ion mass spectrometry. Several commercial laser microprobe mass spectrometers appeared in the 1980s, basically inspired by this work.”
Analytical capability of laser-ionization time-of-flight mass spectrometry – (a) Sysoev and Sysoev, 1010 Eur. J. Mass Spectrom., 8 (2002) 213–232; (b) Margetic, Niemax, and Hergenröder, 1011 Anal. Chem., 75 (2003) 3435–3439; (c) Huang, Yu, Li, Lin, Hang, He, and Huang, 1012 Mass Spectrom. Rev., 30 (2011) 1256–1268
As commented by Wei Hang, “The article by Sysoev and Sysoev 1010 is a well-written paper about use of a laser ablation and ionization source for direct elemental analysis of solid samples. The authors 1010 cleverly used an energy window to deal with the large kinetic energy distribution of ions, which marked an advancement in high irradiance laser ablation and ionization mass spectrometry. The paper by Huang et al. 1012 is a milestone paper about a high irradiance laser ablation and ionization source for mass spectrometry. The authors 1012 used buffer gas in the source to diminish the large kinetic energy distribution of ions. Furthermore, a buffer gas initiates 3-body recombination, which greatly reduces the interference from multiply charged ions.”
The paper by Margetic, Niemax, and Hergenröder 1011 was suggested by George Chan and Zhanxia Zhang. As summarized by Zhanxia Zhang, “In this paper, 1011 femtosecond-laser ablation TOF-MS is shown to be a promising technique for rapid in-depth profiling with good lateral resolution of various multilayer thin film samples.” George Chan added, “In the early 2000s, several research groups used femtosecond lasers for spectrochemical analysis, mostly for laser ablation sampling (e.g., see Section 18.5.9 in this compilation) and LIBS (e.g., see Section 16.1.9). In those studies, the focus was mainly on the use of a femtosecond laser to reduce elemental fractionation. Here, Margetic et al. 1011 focused on another great advantage of femtosecond laser ablation, namely, improved depth profiling due to its non-thermal ablation mechanism. Although Margetic et al. published another paper on this topic 1013 about two years earlier than this work, 1011 this particular paper is chosen because it contains a theoretical discussion on laser fluence and it shows a significant improvement in depth profiling. In this work, 1011 the authors showed depth profiling of alternating Cr–Ni layers, with five Cr and four Ni layers each with a thickness of 56 nm and 57 nm, respectively (NIST SRM 2135c). The sample was placed inside the ion-extraction region of a time-of-flight mass spectrometer and the femtosecond laser served as both the ablation sampling and ionization source. The Cr and Ni ion signals are well resolved with the number of laser pulses for the first six to seven alternating layers of the thin film, and depth resolution of the order of 10 nm with laser ablation was claimed.”
Optical Isotopic Analysis
Physics of isotope splitting in optical band spectra – (a) Mulliken, 1014 Phys. Rev., 25 (1925) 119–138; (b) Mulliken, 1015 Phys. Rev., 25 (1925) 259–294; (c) Mulliken, 1016 Phys. Rev., 26 (1925) 1–32
This series of articles by Mulliken1014–1016 is recommended by Richard Russo, who summarized their key points as, “These three papers1014–1016 describing isotope splitting in optical band spectra form the basis of our laser ablation molecular isotopic spectrometry (LAMIS) technology. It is critical to point out the value of early work that is often missed. These papers1014–1016 delved into the fundamental constants of vibrational spectra and their importance for showing enhanced isotopic splitting compared to atomic or atomic-ion optical emission.”
Early work on optical isotopic analysis with diatomic molecular spectrometry – Elliott, 1017 Z. Phys., 67 (1931) 75–88
As remarked by George Chan, “To the best of my knowledge, this is the first full journal article on analytical isotopic analysis with optical spectrometry. 1017 The analysis was performed with molecular spectra rather than atomic spectra. One advantage of molecular over atomic spectra for optical isotopic analysis is the much-magnified isotopic shifts in diatomic molecules than in atoms as a result of additional and much larger contributions to isotopic shifts by the vibrational and rotational motions of the molecule. As a result, elements not at the immediate two ends of the periodic table also exhibit comparatively large isotopic shifts in diatomic molecular spectra, thus providing the physical basis and feasibility for optical isotopic analysis. In this very early example, 1017 the isotope system under measure was 10B and 11B through the BO molecular band.”
Early work on optical isotopic analysis with atomic emission spectrometry – (a) Brody, Fred, and Tomkins, 1018 Spectrochim. Acta, 6 (1954) 383–412; (b) Artaud, Blaise, and Gerstenkorn, 1019 Spectrochim. Acta, 10 (1957) 110–118
As noted by George Chan, “These two papers1018,1019 from two renowned research groups on high-resolution atomic spectroscopy, mainly on studying optical isotopic effects and hyperfine structure, are early-day examples on isotopic analysis with atomic spectroscopy. Although isotopic shifts – the shifts in wavelength between different isotopes of the same element – in atomic spectra were well known in the physics community in the early 1930s (in fact, the discovery of deuterium was through this optical means), the use of isotopic shift in atomic spectra for analytical purposes happened at a much later time. In these two early examples,1018,1019 atomic emission was used and 6Li and 7Li was the analytical system.”
Early work on optical isotopic analysis with atomic absorption spectrometry – (a) Osborn and Gunning, 145 J. Opt. Soc. Am., 45 (1955) 552–555; (b) Goleb and Yokoyama, 1020 Anal. Chim. Acta, 30 (1964) 213–222
George Chan commented, “The use of atomic absorption for isotopic analysis is based on the same principle as in atomic emission, namely spectral shifts between different isotopes of the same element. Because the isotopic shift is extremely small, spectral selectivity normally cannot rely on the optical spectrometer, but derive from the radiation source in atomic absorption. The paper by Osborn and Gunning 145 used an electrodeless discharge tube containing 202Hg as the emission source and quantified the 202Hg isotope in elemental Hg samples through atomic absorption with the resonance line at 253.7 nm. No special atomizer (e.g., flame or furnace) was needed in this special case for Hg; the atom reservoir was simply a Hg vapor cell thermostatted to a temperature within 0.1°C. This paper 145 is important not only because it is one of the very early studies (if not the earliest) on the use of atomic absorption for isotopic analysis, but also it serves as an excellent educational example demonstrating good experimental practice and several other principles of spectrochemical analysis. First, it showed that the fractional transmittance (or its equivalent, absorbance) depends on the operating conditions (e.g., mounting position, cooling water temperature) of a non-ideal emission source; as such, the importance of the line profile and width of the emission source in absorption measurement was demonstrated. Second, the authors 145 provided a clear and careful argument showing that there was no spectral overlap between the 202Hg emission line and absorption lines of other Hg isotopes. In their argument, the authors 145 also walked the readers through an example on how one can determine the linewidth ratio between the emission and the absorption line profiles through the absorption curve-of-growth (more detail can also be found in the discussion on the paper by Zemansky 143 in this compilation). Third, no calibration standard was needed; instead, the work 145 practiced absolute analysis. In brief, because the Hg vapor pressure (i.e., Hg atom number density) at a given temperature, the absorption coefficient of the Hg line, and the optical path length of the absorption cell were all known, the total absorbance from all the Hg isotopes can be calculated readily. Consequently, direct conversion of the measured 202Hg absorbance to 202Hg concentration in the sample became feasible. The authors 145 also cross-validated their results obtained from optical isotopic measurement with mass spectrometry, and the results from the two techniques agreed within 2% relative. It was claimed that the optical method suffered no memory effect and needed a sample size of only a few micrograms, which was 1000× less than that required for measurement with mass spectrometry (at that time). 145 ”
George Chan continued, “The paper by Goleb and Yokoyama 1020 demonstrated one of the very early examples of utilizing a pair of isotopically enriched discharge tubes, one with 6Li and another with 7Li, as the radiation sources for isotopic AAS. In this case, calibration with isotopically enriched standards was needed. Similar work for isotopic analysis of uranium was reported by the same group two years later with a pair of 235U-depleted and highly 235U-enriched emission sources. 1021 Of course, if atomic absorption is able to detect isotopes, elemental analysis with AAS would be in error if (a) the isotopic composition of the sample differs from that in the radiation source 1022 (e.g., hollow-cathode lamp), or (b) the isotopic compositions between the sample and the calibration standard are different. 1023 ”
Isotope-ratio measurement with diode laser absorption – (a) Lawrenz, Obrebski, and Niemax, 1024 Anal. Chem., 59 (1987) 1232–1236; (b) Wizemann, 1025 Spectrochim. Acta Part B, 54 (1999) 1267–1278; (c) Liu, Quentmeier, and Niemax, 1026 Spectrochim. Acta Part B, 57 (2002) 1611–1623
According to Ove Axner, “Since laser light produced by single mode diode lasers has a frequency width in the MHz range, DL–AAS can be used for isotope detection when applied to low pressure atomizers or atom compartments in which the collisional broadening is reduced (potentially to the Doppler limit). 1024 As is shown by Wizemann, 1025 in cases when the isotope shifts are extraordinarily large (in the GHz range), e.g., as is the case for Li, isotopically selective detection can be performed under atmospheric-pressure conditions, for example in graphite furnaces.”
The article by Liu, Quentmeier, and Niemax 1026 was suggested by Richard Russo and Zhanxia Zhang. Zhanxia Zhang commented, “It is a pioneering work using the laser-induced plasma ignited by a Nd:YAG laser 1026 to measure simultaneously the isotopes 235U and 238U. The analytical results improved by a factor of two compared with those obtained by using the sequential measurement with a single laser diode.”
Richard Russo shared a similar view and noted, “This is a good paper 1026 showing the use of laser ablation with diode-laser based atomic absorption for uranium isotope measurements. The work addresses the spatial and temporal evolution of the laser plasma to include electron number density and its influence on the absorption line profiles. By using two diode lasers, the accuracy and precision of uranium isotopic analysis was improved compared to using one diode laser and scanning its frequency during the transient laser plasma evolution.”
Isotope-ratio determination by laser induced breakdown spectroscopy (LIBS) – (a) Pietsch, Petit, and Briand, 1027 Spectrochim. Acta Part B, 53 (1998) 751–761; (b) Smith, Martinez, Veirs, and Cremers, 1028 Spectrochim. Acta Part B, 57 (2002) 929–937
These two articles1027,1028 are recommended by Richard Russo, who commented “The article by Pietsch et al. 1027 is one of the initial demonstrations showing the use of LIBS for U isotope ratio measurements. Based on available components (nominal spectrometer resolution), it was shown that a low ambient pressure could provide suitable precision (<5%) for the 235U/238U isotope ratio. The precision also was improved with higher 235U enrichment levels. Work performed at reduced pressure opened the door to further work at atmospheric pressure. Isotope shift of 25 pm (one of highest) between 235U and 238U was demonstrated as an ideal line to follow. The influence of different relevant plasma parameters on the measured line width is discussed. LIBS also was used to measure plutonium isotope ratios, again with the sample at reduced ambient pressure. 1028 The Pu emission line at 594.52202 nm was measured, which has an isotope shift between 239Pu and 240Pu of about 12.5 pm.”
Laser ablation molecular isotopic spectrometry (LAMIS) – Russo, Bol'shakov, Mao, McKay, Perry, and Sorkhabi, 1029 Spectrochim. Acta Part B, 66 (2011) 99–104
The LAMIS work 1029 was recommended by several scientists including Annemie Bogaerts, George Chan, Igor Gornushkin, Vincenzo Palleschi, Martín Resano, Richard Russo, and Frank Vanhaecke.
As recounted by Richard Russo, “LAMIS 1029 was presented as a novel approach to performing optical isotopic analysis of condensed samples in ambient air and at ambient pressure. LAMIS, like LIBS, is based on measuring excited transitions in the laser induced plasma, from molecular or atomic/ionic emission, respectively. The LAMIS approach benefits from the enhanced isotopic splitting in molecular emission compared to that from the atomic and ionic transitions, with several orders of magnitude increases for the lighter element-isotope pairs. Example measurements of hydrogen, boron, carbon, and oxygen were shown to demonstrate the LAMIS approach.”
As noted by Vincenzo Palleschi, “LIBS applications to isotopic analysis have been proposed, exploiting the larger isotopic shifts that are characteristics of molecular emission with respect to elemental emission. The LAMIS technique 1029 is applicable in a limited number of cases (both isotopic shift and isotope concentration should be large enough to allow the LIBS detection) but the idea of using molecular emission as a proxy for the determination of elemental concentrations is useful for the analysis of elements whose atomic emission is difficult to detect in standard LIBS.”
Frank Vanhaecke commented, “The authors 1029 introduce a new technique – LAMIS – for measuring isotope ratios. The approach is based on isotopic shifts in molecular emission spectra generated by laser ablation. The capabilities of this approach are demonstrated via isotopic analysis of the light elements H, B, C, and O based on the emission spectra of diatomic molecules in which they occur.” Likewise, Martín Resano shared a similar comment.
Igor Gornushkin added, “A capability of LIBS to analyze isotopes via molecular rather than atomic spectroscopy was demonstrated by Russo et al. 1029 ; the technique was dubbed LAMIS. With LAMIS, molecular isotopes containing elements from the middle of the periodic chart can be discerned and quantified with a medium resolution spectrometer.”
As pointed out by George Chan, “Although optical isotopic analysis through molecular emission had been demonstrated at least as early as in 1931 (see Section 17.2), the recent development of this technique termed LAMIS 1029 by the Russo group made the use of diatomic molecular emission for optical isotopic analysis popular again. The laser-induced plasma is an effective excitation source as well as a reactor creating the atoms or radicals necessary for formation of the molecules. When the plasma cools, molecules are formed. LAMIS can be performed at atmospheric pressure in ambient air. Another advancement is that modern-day computer power greatly facilities the extraction of isotopic information from complex and highly overlapping molecular spectral features. Calibrations nowadays can be readily performed through chemometrics (e.g., partial least squares) or multivariate nonlinear spectral fitting. This paper 1029 is the first publication of LAMIS demonstrating the concept, example spectra, and calibration methods.”
Annemie Bogaerts commented, “This paper 1029 presents LAMIS as a novel approach for accurate isotopic analysis which provides mainly molecular emission bands rather than narrow atomic lines. The combination of laser-induced plasma emission spectrometry and ambient pressure operation allows a drastic change for isotopic analysis, based on larger isotopic shifts in molecular than in atomic spectra. Furthermore, analysis can be performed in real time and from a distance, and there is no need for pre-treatment or sample preparation. The paper 1029 illustrates the technique based on the detection of the isotopes of several elements, including hydrogen, boron, carbon, and oxygen. In a follow-up work, 1030 the boron isotope abundance was quantitatively determined, and it was demonstrated that requirements for spectral resolution are greatly relaxed when determining the isotope abundance ratio from chemometric spectra analysis, and that sensitivity can be improved when a second slightly delayed laser pulse is used in combination with the expanding plume created by the first ablation pulse. Furthermore, the authors demonstrated the isotopic resolution for strontium isotopes, using multivariate calibration of spectra. 1031 ”
Extending remote distance for LAMIS analysis with femtosecond filament-LAMIS (F2-LAMIS) – Hou, Chan, Mao, Zheng, Zorba, and Russo, 288 Spectrochim. Acta Part B, 113 (2015) 113–118
As remarked by Annemie Bogaerts, this article 288 describes a “combination of femtosecond laser filamentation with LAMIS for isotopic analysis of samples at a distance, in ambient air and at ambient pressure conditions. The authors 288 studied the properties of the filament-induced plasma created for different filament propagation distances, and demonstrated semi-quantitative isotope analysis without the need of calibration standards. This method is very promising for remote isotope-ratio measurements.”
Isotopic determination through molecular absorption spectrometry with diatomic molecules – Nakadi, da Veiga, Aramendía, García-Ruiz, and Resano, 1032 J. Anal. At. Spectrom., 30 (2015) 1531–1540
This article was recommended by Ralph Sturgeon, who commented, “High-resolution continuum source AAS enables isotopic information to be obtained by modeling the observed spectrum of diatomic molecules that exhibit an isotopic shift large enough to be detected. 1032 This study utilizes principles similar to those developed by Russo and colleagues for LAMIS emission. 1029 The relative isotopic abundance of chlorine was quantitated through measurement of stable AlCl spectra in the graphite furnace.”
Martín Resano recalled, “The background story for this article 1032 was a stay that the then PhD student, Nakadi, intended to carry out in my laboratory. Nakadi asked for the topic of the visit, and I responded that it could be the isotopic analysis of chlorine using a high-resolution continuum source graphite furnace AAS instrument, employed to monitor the molecular absorption of some Cl molecules. Nakadi replied, a bit surprised, indicating that he did not know that such an application was even feasible, to which I replied, ‘I do not know if it is feasible either, but I guess we’ll find out.’ To his credit, Nakadi accepted the challenge, came to the University of Zaragoza, and got the job done.”
Sample Introduction Techniques in Spectrochemical Analysis
Overview on sample introduction
Sample introduction: The Achilles’ heel of atomic spectroscopy? – (a) Browner and Boorn, 933 Anal. Chem., 56 (1984) 786A–798A; (b) Browner and Boorn, 1033 Anal. Chem., 56 (1984) 875A–888A
The viewpoint article with the title “Sample Introduction: The Achilles’ Heel of Atomic Spectroscopy?” 933 is a classic with several recommendations, including from Nicolas Bings, Stanley Crouch, Gary Hieftje, Vassili Karanassios, Kenneth Marcus, Steven Ray, Richard Russo, and José-Luis Todolí. As noted by Stanley Crouch, “Browner and Boorn 933 review sample introduction methods for atomic spectroscopy including the basic methods and mechanisms for aerosol generation.” Vassili Karanassios highlighted that it is a paper containing “a key review of the mechanisms and of the remaining issues with pneumatic nebulization sample introduction. 933 ” Kenneth Marcus similarly noted, “The ‘Achilles’ Heel’ article 933 is the classic monograph in describing conceptually the need to properly mate sample introduction techniques and plasma sources. By the same token, it points to avenues for advances to be made.”
Richard Russo provided more detail and commented, “This paper 933 was one of the first I read when I was just starting my career at Berkeley and assessing timely issues in analytical spectroscopy. The paper states that ‘one of the oldest adages in analytical chemistry is that the analysis can only be as good as the sample. By analogy, in atomic spectroscopy the analysis can only be as good as the sample introduction. The sample introduction process largely determines the accuracy of the analysis.’ 933 Excellent overview of 1984 understanding of basic mechanisms and the problems that remain to be confronted in sample introduction. They describe nebulizers and other instrumental techniques.”
The views from Steven Ray are: “As intoned in the title, 933 sample introduction remains the Achilles’ heel of atomic spectrometry, as well as of many other analytical methods. This excellent development of the difficulties and advantages of sample introduction techniques for atomic spectrometry reviews the principles of operation, typical performance, and critically evaluates each approach. As importantly, the shortcomings are presented as opportunities for improvement.”
José-Luis Todolí added, “It is a key paper 933 that explains the most important drawbacks and limitations of the introduction of liquid samples into ICP. Many of the comments included therein have inspired numerous studies and, even nowadays, the problems associated with the introduction of samples into high temperature media are still unsolved.” Gary Hieftje shared a similar view.
Nicolas Bings agreed and expanded, “These two Anal. Chem. A-page articles933,1033 cover various sample introduction techniques and present an excellent discussion of the related problems in atomic spectrometry. They contain very convincing and impressive presentation of the fact that ‘in atomic spectroscopy the analysis can only be as good as the sample introduction.’”
Nebulizers and spray chambers
Scott double-pass spray chamber – Scott, Fassel, Kniseley, and Nixon, 422 Anal. Chem., 46 (1974) 75–80
As Gary Hieftje indicated, “Richard Browner opined in 1984 that sample introduction is the ‘Achilles’ Heel’ of atomic spectrometry. 933 That this situation remains the same today is apparent from the fact that new nebulizers, spray chambers, and other sample-introduction devices and accessories are introduced each year, each with its own strengths and weaknesses, and each with the hope of displacing existing units. It is all the more surprising, then, that the double-pass spray chamber described by Scott, Fassel, Kniseley, and Nixon 422 is still one of the most common devices found in commercial ICP–AES instruments. Its design and use were first described in this important publication. 422 ”
Zhanxia Zhang similarly noted, “The Scott double-pass spray chamber designed by Scott, Fassel, Kniseley, and Nixon 422 is still one of the most common devices found in commercial ICP–AES instruments. Moreover, this component is readily adaptable to simultaneous multi-element trace analysis.” This paper is also recommended by Michael Blades and Nicolas Bings; their comments can be found in Section 11.1.3 of this compilation.
Ultrasonic nebulization – (a) West and Hume, 1034 Anal. Chem., 36 (1964) 412–415; (b) Kirsten and Bertilsson, 1035 Anal. Chem., 38 (1966) 648–649; (c) Owen, 1036 An investigation of improved sample handling procedures in ultrasonic nebulization techniques (Report AFML-TR-68-354), (1968)
Gary Hieftje noted, “According to the authoritative book by Burriel-Martí and Ramírez-Muñoz, 1037 ultrasonic nebulization (then frequently termed ‘ultrasonic atomization’) had already been employed for flame-emission spectrometry (‘flame photometry’) for some time before its publication (1957). Further, ultrasonic nebulization has been used for plasma spectrometry at least since the 1960s. One of the first publications in this area was by West and Hume, 1034 who described an entire instrument designed for radiofrequency plasma emission spectrometry. The 500 W system employed nitrogen as the support gas and an ultrasonic nebulizer derived from a room humidifier. This arrangement, like most earlier ones used with chemical flames, required batch sampling; that is, each sample (10–30 mL volume) had to be added to the nebulizer chamber and discarded before the next sample solution could be introduced. A more modern and efficient system was described by Kirsten and Bertilsson 1035 in 1966. In it, the sample solution was deposited directly onto the surface of an ultrasonic transducer and dispersed directly into an aerosol. A stainless-steel capillary was found to be suitable for depositing the solution and could be used for extended periods. By 1968, a commercial ultrasonic nebulization system designed by the itinerant spectrochemist Louie Owen was being offered under his company named ‘Tomorrow Enterprises’. Louie, a most interesting person, deserves more than a casual mention here; he roamed in a minivan from one laboratory to another, often fabricating at each one a new nebulizer for the next of his clients on his nation-wide itinerary. A description of the nebulizer can be found in a government report 1036 prepared for the Air Force Materials Laboratory Wright-Patterson Air Force Base, Ohio.”
High efficiency nebulizer – Olesik, Kinzer, and Harkleroad, 1038 Anal. Chem., 66 (1994) 2022–2030
Comments from José-Luis Todolí on this paper 1038 are: “A high efficiency nebulizer is systematically and fully characterized as a low sample consumption device for ICP. Discussions about aerosol transport phenomena, aerosol drop size, plasma excitation characteristics, vertical emission profiles, and analytical figures are included throughout the study. 1038 ”
Characterization of aerosol production, transport, and vaporization – (a) Skogerboe and Freeland, 1039 Appl. Spectrosc., 39 (1985) 916–920; (b) Skogerboe and Freeland, 1040 Appl. Spectrosc., 39 (1985) 920–925; (c) Skogerboe and Freeland, 1041 Appl. Spectrosc., 39 (1985) 925–930
Recommended by Nicolas Bings, “This three-paper series1039–1041 describe fundamental investigations designed to better understand the factors affecting aerosol production, transport, vaporization, and atomization in analytical spectroscopy systems. They focus on factors controlling both the aspiration of aqueous solutions and the resulting aerosol size distribution. The influence of matrix constituents on the aforementioned parameters is described in the third paper. 1041 ”
Aerosol characterization with light-scattering interferometry – Clifford, Ishii, Montaser, and Meyer, 1042 Anal. Chem., 62 (1990) 390–394
Nicolas Bings commented, “The authors 1042 present an interesting approach to measure simultaneously droplet-size and droplet-velocity distributions using dual-beam, light-scattering interferometry. Five different nebulization systems commonly used in ICP spectrometry were compared and the mentioned technique was used to characterize the corresponding tertiary aerosols.”
Steady-state acid effects with solution nebulization – (a) Greenfield, McGeachin, and Smith, 1043 Anal. Chim. Acta, 84 (1976) 67–78; (b) Todolí, Mermet, Canals, and Hernandis, 1044 J. Anal. At. Spectrom., 13 (1998) 55–62; (c) Todolí and Mermet, 1045 J. Anal. At. Spectrom., 13 (1998) 727–734
José-Luis Todolí recommended this set of three articles1043–1045 and explained, “The paper by Greenfield et al. 1043 describes the first attempt to understand the effect of inorganic acids on ICP performance. Following this study, many others have tried to better characterize this kind of interference both in ICP–AES and ICP–MS. The experiments described in the second article in this set 1044 concluded that the effects caused by inorganic acids are more severe at low than at conventional liquid flow rates. Results described in the study 1044 have made it possible to understand that the processes taking place inside the spray chamber are the origin of this observation. Among them, the fission of the droplets caused by electrical charge repulsion might explain why aerosols at the exit of the spray chamber are finer in the presence of acids than for water whereas primary aerosols are similar for both water and dilute acid matrices. Similar trends have been later observed for other inorganic matrices containing sodium or calcium. The third article 1045 deals with acid effects in the ICP with micronebulizer-based sample introduction systems. After understanding the matrix effects caused by inorganic acids, 1044 a new direction to mitigate them is established in this study: to work at low liquid flow rates using sample introduction systems that make the analyte transport efficiency independent of the acid type and concentration. 1045 On this subject, two main approaches have been evaluated: direct introduction of the primary aerosol into the plasma and the use of a desolvation system. The experimental results 1045 suggest that the plasma thermal state must be kept at a robust level, which is hardly observed when working with the former system.”
Transient acid effects with solution nebulization – Stewart and Olesik, 1046 J. Anal. At. Spectrom., 13 (1998) 843–854
The key points of this article, 1046 as summarized by José-Luis Todolí, are: “The signal temporal evolution when switching between two solutions containing different acid concentrations is characterized. 1046 Variables such as the difference in acid concentration, the plasma state, characteristics of the analyte are studied both in ICP–AES and ICP–MS. A mechanism based on the preferential evaporation of the matrix from either the aerosol droplets or the chamber walls is proposed.”
George Chan shared a similar view and added, “The transient acid effect is very important from both fundamental and application viewpoints, but is often overlooked. It had been known for some time before the publication of this work 1046 that a change in sample acid concentration could affect the ICP signal over several minutes. The transient effect can undershoot or overshoot the steady state signal levels. Although the phenomenon was known for a while, the effect was only acknowledged at best. This work 1046 aimed to understand the phenomenon in greater depth. A key learning point is the appreciation to paying attention to details, careful and thoughtful consideration and experiment design that were put into this work. 1046 ”
Aerosol ionic redistribution – (a) Chesselet, Morelli, and Buat-Menard, 1047 J. Geophys. Res., 77 (1972) 5116–5131; (b) Borowiec, Boorn, Dillard, Cresser, Browner, and Matteson, 1048 Anal. Chem., 52 (1980) 1054–1059
Michael Blades reported, “The concept of aerosol ionic redistribution or ionic fractionation originated with Chesselet and co-workers. 1047 The authors studied size-fractionated aerosols over the open sea by means of graphite furnace atomic absorption and found that there was an enrichment in K/Na, Ca/Na and Mg/Na ratios in aerosols relative to the ratio in bulk seawater from which the aerosols originated. The effect showed a dependence on the size of the aerosol particles, making the results highly relevant to spray-chamber aerosols.”
José-Luis Todolí expanded the discussion to include, “Aerosol ionic redistribution is studied 1048 as a possible mechanism explaining the effects caused by inorganic matrices and has been further applied to explain effects caused by concomitants, such as inorganic acids and easily ionized elements, on the mass of analyte delivered to the plasma. In order to understand the aerosol ionic redistribution process, it should be considered that ions, initially dissolved in a liquid droplet, are arranged according to an electrical double layer whose structure consists of water molecules having their oxygen atoms exposed to the surrounding gas, and with their hydrogen atoms oriented towards the liquid bulk. The polarization charge leads to the formation of the double layer. Hydrogen atoms attract anions, and a consequent diffuse layer of cations appears below those anions. Pneumatically generated droplets may be dispersed into smaller ones through multistage processes. Thus, fractionation of one droplet into two progeny ones takes place by means of the formation of a liquid layer between them created by stripping off the liquid bulk. Smaller droplets are thus formed. Ions having high mobility (small hydrated diameter) may migrate more efficiently towards the double layer than bigger, less mobile ions. This leads to a redistribution of ions according to the solution depth. Consequently, an enrichment of high-mobility ions is produced in small droplets with respect to coarser ones.”
Segmented flow injection and heated spray chamber – Sánchez, Todolí, Lienemann, and Mermet, 1049 J. Anal. At. Spectrom., 27 (2012) 937–945
José-Luis Todolí commented, “The concept of universal calibration is applied to the analysis of very different samples. 1049 According to this principle, a single calibration line can be used for quantitative analysis of samples having extremely dissimilar physical properties (e.g., boiling point, viscosity, density, surface tension…). The method is based on the establishment of a robust plasma and the removal of the differences in the mass of analyte delivered to the plasma as a function of the sample nature. This is achieved thanks to the introduction of small sample volumes and the promotion of solvent evaporation from the aerosol inside a small, heated single-pass spray chamber. This system, called torch integrated sample introduction system, has proven to be useful for the analysis of samples in the field of fuel, clinical, food, environmental and industrial analysis. This paper is the result of previous studies from our research group. The concept developed in the torch integrated sample introduction system is currently being used in several research laboratories.”
Effect of the chemical form of the analyte on sample-introduction efficiency – Sánchez, Todolí, Lienemann, and Mermet, 1050 J. Anal. At. Spectrom., 24 (2009) 391–401
José-Luis Todolí commented, “The effect of the chemical form of the analyte 1050 is systematically studied. A set of 18 different silicon compounds are studied and the sensitivity is measured for a given analyte concentration. It is observed that the analytical signal can vary by a factor as high as about 18 depending on the silicon compound. Every component of an ICP–AES system is evaluated from the point of view of its contribution to the effect finally observed. It is demonstrated that the processes occurring in the spray chamber are mainly responsible for the observed trends. Therefore, this study justifies use of a high temperature spray chamber in order to minimize the impact of the silicon chemical structure on the ICP analytical figures of merit.”
Evaporation characteristics of organic solvent aerosols – Boorn, Cresser, and Browner, 1051 Spectrochim. Acta Part B, 35 (1980) 823–832
According to José-Luis Todolí, “This is a complete study 1051 related to solvent evaporation from droplets when organic matrices are present in the sample. Key aspects, such as evaporation factor and the prediction of droplet evaporation with time when dealing with droplets having different initial diameters, are studied for a set of common organic solvents. The concept of tolerance of plasmas to organic solvents is also discussed.”
Modeling of sample-droplet heat-transfer controlled desolvation in flame and ICP spectrometry – Clampitt and Hieftje, 1052 Anal. Chem., 44 (1972) 1211–1218
WingTat Chan recommended this article on droplet desolvation in flame spectrometry 1052 and commented, “The article 1052 presents an extended model of heat transfer from the flame to the single droplets of aerosols for the prediction of droplet desolvation rate. The model was developed with consideration of both experimental desolvation rates of solvents of different polarity and physical principles of heat conduction and thermal properties of the solvents. Excellent correlation between theoretical prediction and experimental results was achieved. Practical methods were discussed in detail for the calculation of thermal parameters of heat capacity and thermal conductivity at high temperature, which are essential for the prediction of desolvation rates in flames.”
A model for sample droplet acceleration in an air–acetylene flame – Russo and Hieftje, 1053 Anal. Chim. Acta, 118 (1980) 293–299
Richard Russo stated, “This is the first article 1053 published in my career that taught me how to write, publish manuscripts and the value of publications in a scientific career. The article 1053 demonstrates the innovative use of a droplet generator to study fundamental properties in flames, in this case the vertical acceleration of droplets into a parabolic flame velocity profile. The same droplet generator approach evolved and was used by many groups to study fundamental processes in the ICP and other plasma sources.”
Modeling of solute-particle vaporization in flame and ICP spectrometry – (a) Hieftje, Miller, Pak, and Wittig, 1054 Anal. Chem., 59 (1987) 2861–2872; (b) Childers and Hieftje, 1055 Anal. Chem., 65 (1993) 2753–2760; (c) Childers and Hieftje, 1056 Anal. Chem., 65 (1993) 2761–2765; (d) Horner and Hieftje, 1057 Spectrochim. Acta Part B, 53 (1998) 1235–1259; (e) Horner, Chan, Lehn, and Hieftje, 1058 Spectrochim. Acta Part B, 63 (2008) 217–233
WingTat Chan recommended these two articles1054,1058 and opined, “Heat-transfer-limited and mass-transfer-limited models are developed to simulate the vaporization of single alkali chloride particles and droplets in analytical flames 1054 or plasmas. 1058 Mathematical expressions are given to enable researchers to calculate particle vaporization rates or vaporization times. The articles1054,1058 are essential references for computer modeling of single particle vaporization in the plasma.”
Annemie Bogaerts recommended another article, 1057 in which its importance was summarized as, “a computer study of particle melting, boiling and vaporization inside the ICP. 1057 More specifically, two types of simulations were performed: single-aerosol droplet and many-droplet studies. The authors 1057 revealed that the dominant mechanism for solute-particle vaporization in the ICP is small-particle mass transfer. The many-droplet simulation allowed direct comparison with experiments.”
Gary Hieftje added, “The validity of the developed models for solute-particle vaporization in analytical flames and plasmas was underscored by a heroic experimental study by Al Childers.1055,1056 The instrument employed for this investigation was based on light scattering from an Ar-ion laser. 1055 An isolated-droplet generator served to introduce uniform-size droplets into an air–acetylene flame; evaporation of the droplets then yielded similarly uniform-size solute particles, which volatilized reproducibly as they travelled upward in the flame. Determination of the particle size as a function of time and space in the flame permitted solute-particle vaporization rates to be determined. The particle-sizing instrument was calibrated by means of light scattering from standard latex microspheres. For alkali-chloride (KCl, NaCl, CsCl) particles below 0.25 μm radius, typical of particles expected in a flame or plasma, the particle diameter was found to decline linearly with time, 1056 suggesting that vaporization is controlled by the rate at which mass can leave the particle surface. 1056 ”
Review on aerosol generation and transport – (a) Sharp, 1059 J. Anal. At. Spectrom., 3 (1988) 613–652; (b) Sharp, 1060 J. Anal. At. Spectrom., 3 (1988) 939–963; (c) Browner, 1061 Microchem. J., 40 (1989) 4–29
This two-part review by Sharp focuses on aerosol generation (i.e., nebulizers) 1059 and transport (i.e., spray chambers). 1060 José-Luis Todolí highlighted the importance of the work as follows: “Although this contribution 1059 falls within the category of ‘review’, it contains many important aspects that thoroughly describe, from a physical and engineering point of view, the pneumatic aerosol generation. There are many issues described in this article that have been taken as reference for further work (liquid and gas interaction efficiency, aerosol droplet number density, gas velocity calculations, etc.). It can be said that this contribution gave theoretical support to the liquid sample introduction step in ICP techniques. Furthermore, this article led to an additional one dealing with aerosol transport phenomena 1060 that contributed to understand the processes taking place inside the spray chamber.”
Frank Vanhaecke shared a similar view and stated, “Authoritative twin set of comprehensive review papers1059,1060 discussing sample introduction via a combination of a pneumatic nebulizer and a spray chamber in ICP-based techniques.”
The article by Browner 1061 reviews the various aspects of interfacing aerosols with many types of analytical instrumentation. According to Kenneth Marcus, “The Browner laboratory was the preeminent group in the 1980–90s in terms of understanding the importance of sample introduction modalities on the response of spectrochemical source performance (for example, see the classic ‘Achilles’ Heel’ article 933 ). The Browner group made tremendous inroads, having done fundamental measurements into the design of new nebulizer approaches, many of which found application in atomic and mass spectrometries. This review 1061 summarizes some unique properties of aerosols which give them a special value for interfacing with many types of analytical instruments.”
Review on techniques for nebulizer diagnostics – McLean, Minnich, Iacone, Liu, and Montaser, 1062 J. Anal. At. Spectrom., 13 (1998) 829–842
As explained by Kenneth Marcus, “In order to effectively develop new sample introduction hardware for atomic spectrometric analyses, one must first be able to characterize the nebulization process on a first-principles level. The Montaser group 1062 developed a comprehensive tool box that could be applied to aerosol characterization. Many of the methods were borrowed from the areas of aerosol and particle atmospheric sciences. Those capabilities were parlayed into a number of nebulizer designs which found wide commercial success.”
Electrothermal vaporization (ETV) as a means for sample introduction
Tantalum filament and graphite rod electrothermal vaporization device for ICP – (a) Nixon, Fassel, and Kniseley, 1063 Anal. Chem., 46 (1974) 210–213; (b) Gunn, Millard, and Kirkbright, 1064 Analyst, 103 (1978) 1066–1073; (c) Millard, Shan, and Kirkbright, 612 Analyst, 105 (1980) 502–508
José Broekaert recommended the article by Nixon et al. 1063 and highlighted, “Evaporation of dry residues of solution aliquots from metal filaments has been described as a useful technique for the analysis of micro-amounts of liquid samples by plasma atomic spectrometry. The paper 1063 is one of the first ones describing vaporization of dry solution residues from a tantalum filament as a sample introduction technique for atomic spectrometry.”
This two-part article612,1064 is on sample introduction with a graphite rod ETV device for ICP and covers instrumental assembly and performance characteristics, 1064 and matrix, inter-element, and sample transport effects. 612 According to Ralph Sturgeon, “Part I of the work 1064 represents the first attempt to utilize an electrothermal device for introduction of analyte into an ICP source to take advantage of enhanced sensitivity and detection power arising from the increased sample transport efficiency and shorter signal registration time compared to conventional solution nebulization. A consideration of analyte transport losses with this tandem arrangement is discussed for the first time in Part II of the article. 612 A radioanalytical method with 113Cd as a tracer was used. Matrix and concomitant elements altered transport efficiency of Cd and As and were shown to be caused by variations in pre-vaporization loss of analyte and analyte transport efficiency to the plasma. Addition of selenium(VI) improved sample transport efficiency, paving the way for future investigations of matrix modifiers as useful agents as in Kirkbright and Snook. 531 ”
Halogen assisted electrothermal volatilization of refractory elements – (a) Kirkbright and Snook, 531 Anal. Chem., 51 (1979) 1938–1941; (b) Matousek, Satumba, and Bootes, 1065 Spectrochim. Acta Part B, 44 (1989) 1009–1020; (c) Kántor, 1066 Spectrochim. Acta Part B, 55 (2000) 431–448
As noted by Ralph Sturgeon, “The impact of addition of volatile halocarbons to the Ar carrier gas passing through the furnace in enhancing the volatility and release of refractory elements such as B, Zr, Mo, Cr, and W is reported by Kirkbright and Snook. 531 Matousek, Satumba, and Bootes used free halogen gas, which was determined to be superior to use of halocarbon atmospheres noted in the previous work. 531 A 1 ml volume of 5% Cl2 in Ar was injected into the graphite furnace (CRA-63) at a flow of 0.5 ml s−1 during the atomization event to promote efficient volatilization of chlorides of Cr, V, Ti, W, and Zr, thereby enhancing their emission response as well as minimizing matrix effects. 1065 The focus of the paper by Kántor 1066 is on a comparison of relative efficiencies for analyte transport from the ETV when vapors are removed from the central dosing hole (as in Gray and Date 530 ) versus removal from one end of the longitudinally heated furnace containing no dosing hole. The latter caused a 40% reduction in transport efficiency due to vapor condensation on cooler peripherals but when CCl4 was added to the transport gas flowing through the heated tube, volatile chlorides formed which equalized the two modes of transport, thus supporting the use of such gases for nucleation or stable molecule formation.”
Interpretation of thermal dispersion methods used for sample introduction – Kántor, 1067 Spectrochim. Acta Part B, 43 (1988) 1299–1320
As explained by Ralph Sturgeon, “A tutorial approach to factors affecting the efficiency of analyte introduction for tandem sources based on a consideration of vaporization of samples from an ETV (or indeed laser or spark ablation), its optimal physical design, condensation of aerosol due to thermal and chemical effects, and the impact of other sample concomitants on the transport efficiencies is comprehensively discussed 1067 with examples drawn from the literature. This is a ‘foundational’ paper 1067 which provides the basic explanation for many previously observed and future reported data using ETV for sample introduction. Another article 1068 details the construction of an ETV graphite furnace based on some of the principles outlined by Kántor. 1067 Transport efficiencies were improved using an Ar sheathing gas to promote condensation and specially designed extraction interface, yielding values in the range 26–57%, established using radiotracer techniques.”
Kinetics of carbon and carbon monoxide release in ETV – Gilmutdinov, Staroverov, Grégoire, Sturgeon, and Chakrabarti, 1069 Spectrochim. Acta Part B, 49 (1994) 1007–1026
Ralph Sturgeon recounted, “Time-dependent fluxes of O2, CO, and C desorbed from a commercial graphite tube ETV were determined using the ICP–MS as a detector. 1069 Because plasma-induced dissociation of CO is negligible, signals arising from C do not have to be deconvoluted from those of CO. Early (low temperature) release of CO corresponds to surface desorption of adsorbed oxidants whereas sublimation of C accounts for its exponentially dependent thermal release at later times. Older tubes provide a ready source of C which aids in aerosol transport when the ETV is used in a tandem source configuration. These basic considerations and modeling aid in understanding the time-dependent sources of carbon-based spectroscopic interferences in ETV–ICP–MS.”
Electrothermal vaporization as a thermochemical reactor – Sturgeon and Lam, 1070 J. Anal. At. Spectrom., 14 (1999) 785–791
This article 1070 was recommended by Martín Resano, Ralph Sturgeon, and José-Luis Todolí. As summarized by José-Luis Todolí, “Chemical processes occurring in the ETV furnace are revisited. 1070 Also interesting is the possibility for in-situ speciation that this technique offers. This possibility is based on a thermal separation of the species of interest.” Martín Resano added, “Critical review 1070 that coined the term ‘thermochemical reactor’ for the electrothermal vaporizer and highlights the main strategies that could be used to obtain the best performance from ETV–ICP–MS.”
As recounted by Ralph Sturgeon, “This review on use of ETV for sample introduction with ICPs 1070 examines select literature to highlight its varied beneficial impacts, including alleviating space charge interference effects, minimizing polyatomic and isobaric ion interferences, enhancing effective resolution, permitting direct speciation of trace element fractions in samples as well as serving as a ‘crucible’ for sample preparation. It serves as a guide to facilitate further exploration of more opportunities for use based on the general principles discussed.”
Particle size distribution of sample transported from an electrothermal vaporizer – Sparks, Holcombe, and Pinkston, 1071 Spectrochim. Acta Part B, 48 (1993) 1607–1615
Ralph Sturgeon noted, “Particles exiting a commercial graphite furnace ETV were size characterized. 1071 Assuming all the particles were graphitic, approximately 0.1 μg of material exited the ETV with few larger than 1 μm and the majority below 0.1 μm (measurements limited to particle size above 0.1 μm). Changes in heating rates, gas flow and transport tube variations induced no major alteration in number of particles or size distribution.”
Transport efficiencies in ETV sample introduction – (a) Kántor and Güçer, 623 Spectrochim. Acta Part B, 54 (1999) 763–772; (b) Grégoire and Sturgeon, 1072 Spectrochim. Acta Part B, 54 (1999) 773–786; (c) Bernhardt, Buchkamp, Hermann, and Lasnitschka, 1073 Spectrochim. Acta Part B, 55 (2000) 449–460; (d) Friese, Wätjen, and Grobecker, 1074 Fresenius J. Anal. Chem., 370 (2001) 843–849; (e) Ertas and Holcombe, 1075 Spectrochim. Acta Part B, 58 (2003) 1597–1612
This cluster of articles on transport efficiencies in ETV was recommended by Ralph Sturgeon, and detailed notes highlighting the importance of each work were enclosed. The comment of Ralph Sturgeon on the article by Kántor and Güçer is, “Transport efficiencies are estimated 623 for use of a modified conventional Massmann longitudinally heated graphite atomizer wherein vapors exit a central dosing hole and are directed in a flow of Ar to the ICP. The furnace is enclosed in a gas-tight glass cylinder fitted with a port to allow sample introduction and vapor extraction. Efficiencies of 67% and 76% for medium volatility elements (Cu, Mn and Mg) and 32–38% for volatile elements (Cd and Zn) are achieved. Addition of CCl4 vapor to the internal argon flow increased the transport efficiency to 67–73% for all the elements studied, likely due to carbonaceous nucleation centers facilitating physical transport of analyte.”
Ralph Sturgeon highlighted the key point of the second article 1072 on analyte transport efficiency with ETV–ICP–MS as, “Transport efficiencies for low, medium and high thermal volatility analyte species were determined 1072 using a commercial (Perkin–Elmer HGA-600MS) electrothermal vaporizer fitted with a device to plug the central sample dosing hole while directing vapors through an end valve to the plasma. Absolute transport efficiencies for Mo, In, Tl, and Bi were determined using experimental conditions typical of those applied to real analysis by ETV–ICP–MS. Vaporization of realistic sample masses of a few ng or less were investigated to reflect minimal self-nucleation processes. In the presence of a carrier such as seawater or a matrix modifier or use of an aged graphite tube to provide condensation sites, analyte transport to the plasma was approximately 20%, with the major amount lost within the switching valve and transport line.”
The third article 1073 in this cluster involved the use of an electrostatic deposition technique and Ralph Sturgeon noted, “Collection of analyte streaming from the end of a sealed longitudinally heated Massmann furnace was achieved 1073 by electrostatic deposition onto the surface of a L’vov platform within a second HGA-type graphite furnace. Transport efficiencies in the range of 20% for Cu, Fe and Mn and up to 35% for Pb during atomization of real sample matrices were determined, in line with other techniques applied for this purpose in similar furnaces and supporting the range of 20–50% for ETV sample introduction. The study was limited to low transport flow rates of Ar due to loss in deposition efficiency at flow rates >150 ml min−1.”
For the fourth article 1074 in this set, which is also on analyte transport efficiencies in ETV–ICP–MS, Ralph Sturgeon commented, “A modified Grun graphite furnace was used to assess transport efficiencies under conditions where the sample vapor was simply forced from one end of the tube under an internal Ar gas flow (standard method) and when that end was fitted with a custom nozzle designed to enhance particle nucleation. 1074 Higher efficiencies were achieved using the nozzle and further enhancements (factors ≥1.5) were observed for As, Cd, Co, Cu, Fe, Pb, Se, and Zn with the use of a reactive gas. The transport efficiencies achieved on addition of 2.0 mL trifluoromethane min–1 were 70–100%. Efficiencies were calculated from relative signals from solution nebulization and ETV sample introduction.”
For the article by Ertas and Holcombe, 1075 Ralph Sturgeon opined, “A corona discharge electrostatic precipitator placed in line between a conventional Massmann type graphite furnace (longitudinally heated) and the plasma permitted particles to be precipitated onto a grounded Pt foil, from which analyte could be leached. 1075 Precipitator efficiency was determined to be greater than 90% using simple in-line measurements for removing the aerosol and examining the ICP–MS signal with the corona on and off. Absolute transport efficiencies for Cd, Pb, Bi, In, and Be ranged from 25–50% for vaporization of realistic sample masses of a few ng or less to reflect minimal self-nucleation processes. Addition of conventional modifiers such as Pd and NaCl enhanced efficiencies by typically 1.2- to 1.5-fold. An excellent summary of past literature is presented.”
Ralph Sturgeon summarized, “Taken as a whole, this suite of investigations623,1072–1075 provides a consistent and comprehensive foundation for sample introduction efficiency estimates associated with ETV-coupled techniques frequently quoted in the literature. The use of varied independent approaches, experimental designs, different ETV configurations, and aerosol extraction techniques accounts for the success and universal applicability of the results of these studies. The data account for a number of recurrent observations in the literature, including the impact of analyte mass, the presence of concomitant matrices and the non-linearity of calibration functions in the low mass range and provide a basis for the practical utility of chemical modifiers.”
Promotion of condensation and extraction interface, and concept of particle carrier to improve ETV transport efficiency – Ediger and Beres, 1076 Spectrochim. Acta Part B, 47 (1992) 907–922
As noted by Martín Resano, “This article 1076 explores the different role of chemical modifiers in ETV–ICP–MS, highlighting their importance as particle carriers.” Ralph Sturgeon added, “This article 1076 unifies in practice many of the observations made concerning transport efficiencies with ETV, including non-linear calibration curves and the presence or absence of sample matrix on response. Standard matrix modifiers conventionally used for GF–AAS serve to provide additional physical nucleation centers to reduce transport losses, consistent with the theory developed by Kántor. 1067 ”
Examples of coupling ETV to different analytical plasma sources – (a) Volland, Tschöpel, and Tölg, 1077 Spectrochim. Acta Part B, 36 (1981) 901–917; (b) Guzowski, Broekaert, and Hieftje, 1078 Spectrochim. Acta Part B, 55 (2000) 1295–1314; (c) Broekaert and Siemens, 1079 Anal. Bioanal. Chem., 380 (2004) 185–189; (d) Peschel, Andrade, Wetzel, Schilling, Hieftje, Broekaert, Sperline, Denton, Barinaga, and Koppenaal, 613 Spectrochim. Acta Part B, 61 (2006) 42–49; (e) Jiang, Chen, Zheng, and Hou, 1080 Anal. Chem., 86 (2014) 5220–5224
This series of five articles,613,1077–1080 showing the versatility of ETV sample introduction, was suggested by Ralph Sturgeon, who commented, “The first article 1077 is the first report of coupling a graphite ETV device to a TM010 resonator He MIP with sampling based on electrodeposited analytes onto the graphite tube surface. The second paper 1078 is the first description of an ETV coupled with a helium-supported gas sampling GD–TOF-MS for the analysis of small volumes of aqueous solutions. Modulation of the GD discharge conditions permitted sequential collection of atomic and molecular mass spectra of an organometallic compound (ferrocene). The third paper 1079 is a mini-review of microplasmas wherein the role of the ETV as a sample introduction device is presented, highlighting their obvious analytical advantages compared to other methods of sample introduction. The fourth paper 613 is the first reported coupling of an ETV system to a 128 Faraday strip array detector ICP–Mattauch–Herzog-MS instrument to demonstrate the inherent advantages of simultaneous multi-isotope registration for characterization of transient signals, achieving 100% duty factor. The fifth paper 1080 describes a performance evaluation of the first tandem coupling of a W-coil ETV to a low power He DBD for emission detection of a suite of elements. The ETV circumvents the problem of liquid sample introduction quenching the discharge. A discussion of possible field applications is presented.”
Electrothermal vaporization for sample introduction (reviews) – (a) Kántor, 1081 Spectrochim. Acta Part B, 56 (2001) 1523–1563; (b) Resano, Vanhaecke, and de Loos-Vollebregt, 1082 J. Anal. At. Spectrom., 23 (2008) 1450–1475
Ralph Sturgeon commented on the review article by Kántor 1081 as “a comprehensive review 1081 of the fundamentals of sample vaporization (not only for electrothermal vaporization, but also on laser ablation sample introduction) and a clear formulation and unification of the various concepts which evolved over the previous two decades of research in this field.”
Ralph Sturgeon highlighted the other review 1082 as “an excellent summary 1082 of literature covering fundamentals and analytical applications of ETV sampling for conventional AAS measurements as well as a tandem source for coupling with a variety of plasmas, including ICPs, MIPs, GDs, capacitively coupled plasmas for optical and mass spectrometric detection.”
The second review article 1082 was also suggested by Zhanxia Zhang with a note, “The present possibilities of electrothermal–AAS, ETV–ICP–AES and ETV–ICP–MS for analysis of solid samples, slurries, and complex matrices were fully reviewed. An overview of the most relevant advances in instrumentation, methodology, and fundamentals are also presented.”
Hydride and volatile chemical vapor generation and introduction
Conventional chemical vapor generation (CVG) of traditional hydride-forming elements
Early vapor generation studies – (a) Hatch and Ott, 1083 Anal. Chem., 40 (1968) 2085–2087; (b) Holak, 1084 Anal. Chem., 41 (1969) 1712–1713
As explained by Ralph Sturgeon, “The paper by Hatch and Ott 1083 was the first publication to introduce the most widely used procedure for chemical vapor generation of mercury – originally based on application of an acidic solution of tin chloride to effect reduction; subsequent publications utilized tetrahydridoborate(1−) (THB) or other aqueous phase alkylating agents (ethyl- and propyl-borates) to determine total and speciated forms of mercury.”
Alessandro D’Ulivo shared a similar view and noted, “The work by Hatch and Ott 1083 is the first application of vapor generation technique 1083 to mercury determination by AAS with SnCl2 employed as reductant.” Alessandro D’Ulivo added the paper by Holak 1084 and regarded it as “the first application of the hydride generation technique for the AAS determination of As through arsine generation, based on the earlier Zn/HCl method of Marsh.”
Tetrahydridoborate(1−) (THB) for hydride generation – (a) Braman, 1085 Anal. Chem., 43 (1971) 1462–1467; (b) Braman, Justen, and Foreback, 1086 Anal. Chem., 44 (1972) 2195–2199; (c) Thompson and Thomerson, 1087 Analyst, 99 (1974) 595–601
Alessandro D’Ulivo recommended these three articles,1085–1087 and commented, “The introduction of chemical generation of volatile species of some metals (Hg) 1085 and semimetals (As and Sb), 1086 by replacing SnCl2 and Zn/HCl reduction with aqueous NaBH4, greatly improved the analytical performance of atomic emission and atomic absorption techniques, as shown in the two articles by Braman and co-workers.1085,1086 The IUPAC name of the BH4– ion should be tetrahydridoborate(1−), but it is also common in the literature to refer it as tetrahydroborate or borohydride. This new derivatization technique proved decisive in future development of simple and sensitive non-dispersive atomic fluorescence spectrometry instrumentation. Furthermore, CVG of Sb, As, Bi, Ge, Pb, Se, Te, and Sn volatile hydrides 1087 was employed as a sample introduction technique for AAS as shown by Thompson and Thomerson. 1087 Conventional premixed flames were replaced by externally heated quartz tube atomizers, which would become the most popular hydride atomizer for CVG–AAS. The introduction of amine boranes as alternative reagents to THB for CVG, 1088 indicates the possibility to generate volatile hydrides using mild reducing agents. Amine boranes, as useful reagents for diagnostic purposes, are used for studies on the mechanism of generation of volatile hydrides.”
Alkylating agents for vapor generation – Rapsomanikis, Donard, and Weber, 1089 Anal. Chem., 58 (1986) 35–38
According to Alessandro D’Ulivo, “The introduction of alkylborates 1089 allowed the aqueous phase alkylation of simple inorganic and organometallic substrates using reaction systems similar to those employed for CVG by THB. The reaction system replaces the use of Grignard reagents. For some elements, alkyl derivatives are more stable than the corresponding hydrides. Improvements of speciation methods using hyphenated techniques were demonstrated. 1089 ”
Ralph Sturgeon added, “Rapsomanikis, Donard, and Weber 1089 were the first to report on aqueous phase ethylating agents to enhance the efficiency of chemical vapor generation of lead (and by way of example, other hydride forming elements and mercury), but also provide a direct and simple route to permit speciation of alkylated forms of a number of elements present in natural samples, including the inorganic ion, its methylated and ethylated derivatives.”
THB for reduction coupled with CO for complexation – Rigin, 1090 Anal. Chim. Acta, 283 (1993) 895–901
As noted by Ralph Sturgeon, “This publication by Rigin 1090 is the first on the use of THB for reduction and carbonylation of Fe, Co, and Ni to generate high yields of their volatile carbonyls. This paper 1090 is often overlooked in references to this technique.”
Flow-cell for gaseous hydride generation for analytical atomic spectrometry – Thompson, Pahlavanpour, Wilton, and Kirkbright, 1091 Analyst, 103 (1978) 568–579
José Broekaert noted, “Hydride generation as a technique for the conversion of several elements into their volatile species has been shown to be very useful for the determination of trace concentrations in solutions by plasma atomic spectrometry. The paper 1091 describes flow-cell hydride generation used in many works on the determination of the volatile hydride forming elements by atomic spectrometry.”
Mechanisms of conventional hydride generation – (a) Robbins and Caruso, 1092 Anal. Chem., 51 (1979) 889A–898A; (b) Brindle and Le, 1093 Anal. Chim. Acta, 229 (1990) 239–247
According to Ralph Sturgeon, “This classical publication by Robbins and Caruso
1092
is frequently cited as postulating the basic mechanism for formation of volatile hydrides via reaction of the analyte with ‘nascent’ hydrogen, generated through acidic hydrolysis of the THB reductant. Although still often cited, it has been shown to be an erroneous assumption (as noted elsewhere
1094
). The publication by Brindle and Le
1093
is significant, not so much for the means by which interferences were reduced for the determination of Ge by hydride generation, but rather it is the first application of 11B-NMR to elucidate the mechanism involved, demonstrating complex formation between added
Alessandro D’Ulivo added, “This paper 1093 is the first one which shed a new light on the chemistry involved in CVG by aqueous NaBH4. L-cysteine was demonstrated to be an effective masking agent for interference control in CVG. 1093 Thiols can act on CVG mechanisms by modifying the reagent through thiolate-borane complexes [RSBH3]−. Another paper 1095 reported that hydrolysis of THB ion generates hydridoboron species, which play a decisive role in the generation of volatile species (hydrides and Hg0). Follow-up work 1096 reported studies on the mechanism of action of chemical additives in CVG of volatile hydrides. Additives can act on the mechanism of CVG through modification of both the structure of the analytical substrate and of the hydrolysis products of boranes. 1096 ”
Mechanistic studies of CVG with mass spectrometry – (a) D’Ulivo, Mester, and Sturgeon, 1097 Spectrochim. Acta Part B, 60 (2005) 423–438; (b) D’Ulivo, Mester, Meija, and Sturgeon, 1098 Anal. Chem., 79 (2007) 3008–3015
As noted by Ralph Sturgeon, “This publication 1097 is the first one outlining a mass spectrometric approach to the investigation of CVG reaction mechanisms based on detection of intermediates and products generated in the gas phase during reaction of metal ions with THB reductant and employing deuterated reagents.”
Alessandro D’Ulivo recommended this article, 1098 and opined, “In this work, 1098 mixed NaBH4 + NaBD4 reagents combined with deconvolution of mass spectra was used for the determination of isotopologues of volatile hydrides (EH n D3–n, E = As, Sb, Bi, n = 0–3). The unambiguous identification of the mechanism of hydrogen transfer from reaction environment to analytical substrate ruled out previously postulated mechanisms 1092 of hydride formation.”
Mechanisms in chemical hydride generation (reviews) – D’Ulivo, Dědina, Mester, Sturgeon, Wang, and Welz, 1094 Pure Appl. Chem., 83 (2011) 1283–1340
Ralph Sturgeon commented, “The importance of this IUPAC technical document 1094 is that it is the first report on the clarification of the fundamental aspects of CVG of metal hydrides with borane complexes. The model developed explains the reactivity of a CVG system and clarifies numerous controversial and erroneous aspects embedded in the CVG literature. The subsequent review by D’Ulivo 1099 updates CVG reaction mechanisms published since the earlier comprehensive report. 1094 ”
Interference in conventional hydride/vapor generation – (a) Smith, 1100 Analyst, 100 (1975) 300–306; (b) Dědina, 1101 Anal. Chem., 54 (1982) 2097–2102; (c) Welz and Melcher, 1102 Analyst, 109 (1984) 573–575; (d) Welz and Schubert-Jacobs, 1103 J. Anal. At. Spectrom., 1 (1986) 23–27; (e) Hulanicki, Bulska, and Wałcerz, 1104 Fresenius Z. Anal. Chem., 332 (1988) 176–177; (f) Ding and Sturgeon, 1105 Anal. Chem., 69 (1997) 527–531; (g) Tao and Sturgeon, 1106 Spectrochim. Acta Part B, 54 (1999) 481–489
Alessandro D’Ulivo recommended a total of five articles1100–1104 in this set and noted, “The article by Smith 1100 is the first systematic study of interferences in CVG of hydrides by aqueous THB, proposing the possible mechanism of interferences whereas the one by Dědina 1101 provided categorization of interferences in CVG of volatile hydrides as well as study on the mechanisms of mutual interference in CVG of hydrides by radiotracer techniques. In addition, study of the mechanisms of transition metal ions in CVG of Se are reported by Welz and Melcher. 1102 The depressive effect can be mainly attributed to the products of metal + borane, whereas the ionic form of the metal hardly affects CVG efficiency. In contrast, the reaction conditions (e.g., concentrations of acid and NaBH4) can have a dramatic effect on the control of the magnitude of interference effects. 1103 Furthermore, a new approach termed twin-channel flow system, 1104 which allows discrimination between liquid-phase and atomization (gas-phase) interferences, was described for the interference among hydride forming elements.”
Ralph Sturgeon recommended these two articles,1105,1106 and explained, “In this article, 1105 rapid mixing of analyte and reductant solutions at the tip of a modified concentric nebulizer provides conditions for minimal condensed phase interactions and rapid phase separation of volatile products, demonstrating a significant tolerance to elevated levels of condensed phase generation interferences. A new hydride generation approach is described by Tao and Sturgeon 1106 delivering minimization of transition element interferences and is based on use of a modified Meinhard nebulizer in which a capillary tube was inserted into the sample introduction channel to allow simultaneous delivery and mixing of both an acidified sample and a THB reductant solution. Rapid mixing occurs just prior to nebulization with rapid gas-liquid separation occurring in a conventional Scott double-pass spray chamber. Due to the extremely short reaction time and fast phase separation, high concentrations of transition metals can be tolerated without interference.”
L-cysteine as a modifier for the reduction of interferences in conventional hydride generation – Chen, Brindle, and Le, 1107 Anal. Chem., 64 (1992) 667–672
As noted by Alessandro D’Ulivo, “Whereas Brindle and Le
1093
already demonstrated the potential of
Volatile vapor generation (review) – Sturgeon and Mester, 1108 Appl. Spectrosc., 56 (2002) 202A–213A
As recounted by Ralph Sturgeon, “This article 1108 remains as one of the most comprehensive and ‘recent’ to summarize all fields of vapor generation using all techniques, including chemical, ultrasound, thermal, chelate, photochemical, electrochemical, and plasma-assisted approaches.”
Chelate vapor generation
Volatile chelates as a form of sample introduction for direct detection of metals by plasma emission – (a) Runnels and Gibson, 1109 Anal. Chem., 39 (1967) 1398–1405; (b) Black and Browner, 1110 Anal. Chem., 53 (1981) 249–253
These two articles on sample introduction of metal species in the form of volatile metal chelates (e.g., β-diketonates) into analytical plasma sources (e.g., MIP 1109 and ICP 1110 ) are recommended by Ralph Sturgeon, who commented, “The paper by Runnels and Gibson 1109 appears to be the first use of a plasma for the detection of metals introduced as their volatile acetylacetonates, trifluoroacetylacetonates or halides via evaporation from a heated tungsten filament on which discrete volumes of solutions in organic solvents were deposited. Transient emission response from Fe, Cr, Co, Mn, Al, Cu, Ag and even the halogens was detected to achieve LODs of 10–12–10–10 g absolute. The article by Black and Browner 1110 is the first reported use of volatile metal chelate generation for enhanced detection of metals by ICP–AES. Direct chelation of Fe, Zn, Co, Mn, and Cr to form their volatile β-diketonates in samples of bovine liver and human blood serum was accomplished in an on-line reaction chamber which formed part of a sampling loop where metal chelate synthesis occurred at 120 °C for 5–10 min before the chamber was flushed with Ar to carry the volatile metal species to an Ar ICP for OES detection. LODs for Fe, Zn, Mn, and Co were enhanced 10-fold relative to conventional solution nebulization. An improved batch injection method of extracted chelates of Al, Be, Cr, Cu, and Fe 1111 over that described by Browner 1110 is described. Chelated metals were extracted into an organic solvent and microliter volumes of the organic extract vaporized in a heated chamber and mixed with a heated carrier stream of Ar saturated with chelating agent prior to their in-line transfer to the base of the torch, thereby minimizing sample deposition on the transfer lines. Impedance matching to minimize the impact of the co-injected solvent vapor was critical to operation. Sub-ng LODs were achieved.”
Gas chromatography–atomic absorption spectrometry for metal separation and detection – Wolf, 1112 Anal. Chem., 48 (1976) 1717–1720
According to Ralph Sturgeon, “This study 1112 reports the first coupling of GC sample introduction of volatile Cr (as the trifluoroacetylacetonate complex) into a flame for AAS detection. A LOD of 1.0 ng is achieved with sampling/detection times of 1 min. Effluent from the GC was directed into a port drilled into the side of a nitrous-oxide acetylene burner head. The approach is a natural evolution of earlier work with use of GC coupled to a variety of detectors (electron capture, flame ionization and thermal conductivity) to enhance detection of metals through formation of their volatile chelates. 1113 ”
On-line continuous generation of volatile metal chelates – Duan, Sun, and Fang, 1114 Spectrochim. Acta Part B, 128 (2017) 11–16
Ralph Sturgeon commented, “This is the first report 1114 of formation of a volatile zinc chelate species generated by the on-line continuous merging of an acidified sample solution with an aqueous solution of sodium diethyldithiocarbamate followed by its rapid transfer to the gas phase using a frit-based bubble gas-liquid separator at room temperature. Determination was by atomic fluorescence spectrometry. Generation efficiency was as high as 85%. The methodology was successfully applied to a number of other elements in subsequent publications by this group of authors and opened up a new area for research and application.”
Vapor generation for transition metals
Transition-metal vapor generation with carbon monoxide – Lee, 1115 Anal. Chem., 54 (1982) 1182–1184
As outlined by Ralph Sturgeon, “The paper by Lee 1115 is the first reported analytical application of this methodology. In this method, Ni(CO)4 in aqueous samples saturated with CO was generated by reduction of Ni(II) with THB and purging the mixture with He to transfer the product to a cryogenic trap. The carbonyl was released by warming and atomized in a heated quartz tube with AAS detection. Another paper 1116 reported the first application of the high efficiency generation of Ni(CO)4 with direct trapping of the analyte in a preheated graphite furnace for enhanced GF–AAS detection power and a greatly simplified procedure compared to that developed by Lee. 1115 ”
Transition-metal vapor generation with THB – (a) Sanz-Medel, Valdes-Hevia y Temprano, Bordel Garcia, and Fernandez de la Campa, 1117 Anal. Chem., 67 (1995) 2216–2223; (b) Sturgeon, Liu, Boyko, and Luong, 1118 Anal. Chem., 68 (1996) 1883–1887; (c) Luna, Sturgeon, and de Campos, 1119 Anal. Chem., 72 (2000) 3523–3531; (d) Moor, Lam, and Sturgeon, 1120 J. Anal. At. Spectrom., 15 (2000) 143–149
Ralph Sturgeon recommended four key papers1117–1120 and highlighted, “The paper by Sanz-Medel et al. 1117 is the first report of generation of free Cd atoms for spectrometric detection following reduction of Cd(II) in solution by THB. Numerous subsequent publications by others attempted to improve on the generation conditions. This paper by Sturgeon et al. 1118 is the second report of vapor generation of a transition metal for enhanced analyte introduction into atomic spectrometric sources. Reduction of Cu(II) by merging flowing thin films of sample and THB provided a transportable species for gas phase introduction into an ICP–AES. Although the vapor species was stable and transportable at room temperature, it was not identified. The follow-up study by Luna et al. 1119 is the first report of production of volatile species of additional transition metals during reduction of aquo ions by THB under conditions permitting rapid phase separation. AAS detection in a heated quartz tube suggested stable molecular species, based on the need for air (oxygen) enhancing response, similar to conventional hydride forming elements. Moor et al. 1120 reported a novel, robust hydride generation system based on a short reaction time (60 ms) and a rapid separation of the reaction products by mixing the acidified sample and THB reductant solution at the tip of a cross-flow nebulizer. The rapid reaction and phase separation approach are as outlined in articles,1105,1106 and this is the first paper 1120 to demonstrate the advantages of this approach for analytical application. Such conditions are conducive to the generation of volatile species of Cu, Rh, Pd, Ag, In, Au, Hg, Tl, and Pb. This is the first report 1120 of efficient generation of volatile forms of a number of transition and noble metals by CVG using solution nebulization techniques. Further investigation of CVG of transition metals is reported here 1121 using a parallel path nebulizer to achieve rapid generation and phase separation. It is shown that vapor phase species of Rh, Pd, Au, and Cu can be collected in a slightly acidic aqueous trap with subsequent release for ICP–MS detection, suggesting stable molecular species were formed during CVG.”
Alessandro D’Ulivo suggested this article, 1119 and summarized its importance as “the scope of CVG was expanded from classical hydride forming elements and mercury to transition and noble metals.”
José-Luis Todolí noted, “In this report, 1120 a system adapted to the spray chamber has been successfully used to generate selenium vapor species (a principle that was demonstrated previously 1110 ) and to drive them to the plasma. Furthermore, volatile species of Cu, Rh, Pd, Ag, In, Au, Hg, Tl, and Pb were reported to also be produced. In this follow-up work, 1122 a Burgener nebulizer is used to introduce transition metals as vapor species into ICP–MS. This is a commercially available device permitting rapid reagent mixing and further gas-liquid separation. In this study, the nebulizer was modified to be operated under either aerosol or no-aerosol generation modes. The second mode permitted the detection of elements in gaseous phase. Formerly unreported volatile species of elements such as Mn, Ti, Pt, and Ir were detected. These two papers1120,1122 could be good examples of a research field that has given rise to a dramatic decrease in the limits of detection for some elements as well as to further commercialization of developments such as the multimode sample introduction system. 1123 The idea of determining both hydride-forming and non-forming elements together was already anticipated in an earlier work. 1124 ”
Mechanistic studies on transition-metal vapor generation – Musil, Kratzer, Vobecký, Hovorka, Benada, and Matoušek, 1125 Spectrochim. Acta Part B, 64 (2009) 1240–1247
As noted by Ralph Sturgeon, “Musil et al. 1125 reported generation of volatile species of Ag by reaction with THB and subsequent transport to a heated quartz tube atomizer. Transmission electron microscopy revealed silver nanoparticles (8 ± 2 nm) sampled from the gas phase, the first report of identification of the generated species which may possibly summarize the state of products similarly generated from all transition and noble metals. The first attempt to delineate the mechanisms of CVG of transition and noble metals induced by reduction with THB was reported by Feng et al. 1126 Silver, Au, and Rh were selected as model species. Possible products were speculated to include hydrido metal complexes as well as free atoms and nanoparticles.”
Vapor generation of anions
Alkylation with trialkyloxonium tetrafluoroborates for vapor generation of inorganic anionic species – (a) King, Gazzola, Blakeley, and Zerner, 1127 Inorg. Chem., 25 (1986) 1078; (b) D’Ulivo, Pagliano, Onor, Pitzalis, and Zamboni, 1128 Anal. Chem., 81 (2009) 6399–6406
According to Ralph Sturgeon, “This is the first 1128 of several subsequent reports by these authors on the use of aqueous phase alkylating agents for quantitation of I−, Br−, Cl−, S2−, CN−, SCN−, NO2−, and NO3−. This work is significant in that it offers simple, rapid, matrix-free and selective means of enhancing detection power for these species using emission and mass spectrometries. The resulting alkylated derivatives, RI, RBr, RCl, R2S, RCN, RSCN, RONO, and RONO2 (R = Me, Et) are sufficiently stable for their manipulation by GC–MS at ultratrace levels.”
Alessandro D’Ulivo commented, “While the understanding of the mechanism of CVG by means of aqueous boranes occurred about 35 years after the first application, and after the publication of thousands of application articles, the idea of possible use of trialkyloxonium salts (Merweein reagents) as alkylating agents in aqueous phase arose from a one-page article reporting on their alkylation mechanism. 1127 ”
Electrochemical vapor generation
Introduction of the concept of electrochemical vapor generation – Rigin and Verkhoturov, 1129 Zh. Anal. Khim., 32 (1977) 1965–1968
As commented by Ralph Sturgeon, “This article 1129 and the follow-up1130,1131 (English translation1132–1134 is available) comprise the first reports of analytical use of electrochemical vapor generation for sample-introduction with atomic spectrometry for detection of tin and arsenic by AAS and AFS.”
Flow injection–electrochemical hydride generation (EC-HG) – (a) Lin, Wang, Yuan, Yang, Huang, and Zhuang, 1135 J. Anal. At. Spectrom., 7 (1992) 287–291; (b) Schaumlöffel and Neidhart, 1136 Fresenius J. Anal. Chem., 354 (1996) 866–869
These two articles were recommended by Ralph Sturgeon, who remarked, “The work by Lin et al. 1135 describes a thin-layer electrolytic flow-through cell for hydride generation that was used in a flow injection system coupled to an electrically heated T-tube atomizer for AAS detection of As, Se, and Sb. The article by Schaumlöffel and Neidhart 1136 is the earliest mention of the use of EC-HG for detection by AAS when utilizing the standard heated quartz tube as an atomizer.”
Continuously operating EC-HG cell – Brockmann, Nonn, and Golloch, 1137 J. Anal. At. Spectrom., 8 (1993) 397–401
As outlined by Ralph Sturgeon, “This paper 1137 describes a miniaturized continuously operating EC-HG cell with Pt anode and cathode compartments separated by a Nafion membrane. Operation in a flow injection mode enables detection by both AAS and ICP–AES.” Alessandro D’Ulivo also selected this article, 1137 and noted that “electrochemical hydride generation 1137 coupled as a sample introduction method serves as an alternative to CVG using aqueous borane derivatization.”
EC-HG system coupled to graphite furnace with preconcentration – (a) Ding and Sturgeon, 1138 J. Anal. At. Spectrom., 11 (1996) 225–230; (b) Schickling, Yang, and Broekaert, 1139 J. Anal. At. Spectrom., 11 (1996) 739–745
As explained by Ralph Sturgeon, “This is the first report 1138 of the coupling of an EC-HG system to a graphite furnace for in-situ collection of the analyte vapors and AAS detection. A continuous flow system was used in combination with reduced Pd as a sequestering agent on the graphite tube surface to preconcentrate the generated analyte. The paper from the Broekaert group 1139 is the first reported coupling of EC-HG for introduction of evolved arsine into an argon and helium MIP operated in a surfatron and in a TE101 resonator for OES detection. The TE101 resonator was connected to a Pd-coated graphite furnace for in-situ preconcentration of the AsH3, allowing reliable determinations of As in various digested biological samples at the 0.05–10 µg g−1 level.”
Electrochemical vapor generation (review) – Laborda, Bolea, and Castillo, 1140 Anal. Bioanal. Chem., 388 (2007) 743–751
Ralph Sturgeon commented, “This review 1140 of EC-HG comprehensively addresses all fundamental aspects of the technique. Special attention is paid to the role of the configuration of the cathodes and their material composition on the efficiency of hydride generation and on interferences from concomitant species. This paper serves as the ‘go-to’ reference for EC-HG due to its insights into the capabilities and future evolution of the technique.”
Thermochemical vapor generation
Microwave-enhanced vapor generation of Hg – Wu, Long, Liu, Zhou, Lee, and Zheng, 1141 Talanta, 94 (2012) 146–151
As noted by Ralph Sturgeon, “In the presence of formic acid, inorganic mercury and total mercury (inorganic and methylmercury) can be converted to mercury atomic vapor (Hg0) by heating the sample during its flow through a microwave oven without and with added H2O2, respectively. This is the first report 1141 of the thermolysis of the 10% formic acid yielding reducing radicals (•H and •CO2−) which are powerful enough to reduce both the inorganic and organo-mercury species to their elemental Hg0 state.”
Oil-bath heated vapor generation of mercury – Sturgeon and Luong, 1142 J. Anal. At. Spectrom., 28 (2013) 1610–1619
Ralph Sturgeon noted, “The significance of achieving reduction of both inorganic and methylmercury species in samples prepared in a 2% formic acid medium by simply heating the solution to nominally 85°C is demonstrated, 1142 opening the door to further research using this approach for other metals. The generation of reducing radicals (•H and •CO2−) arising from the thermolysis of formic acid is responsible for this process.”
Sonochemical vapor generation – (a) Korn, Andrade, Borges, Sousa, and Oliveira, 1143 J. Braz. Chem. Soc., 14 (2003) 254–258; (b) Gil, Lavilla, and Bendicho, 1144 Anal. Chem., 78 (2006) 6260–6264
As detailed by Ralph Sturgeon, “The article by Korn et al. 1143 is the first report of in-situ reagent generation assisted by ultrasonic irradiation, as evidenced by successful synthesis of arsine. Free radical formation by sonolysis of water generated •OH, which reacted with metallic Zn to produce •H, leading to reduction of As(III) and generation of arsine. In the article by Gil et al., 1144 reduction of Hg(II) was achieved in water driven by radicals generated during the ultrasonic cavitation process. The presence of formic acid enhanced the reaction, but no application was presented. The first demonstration of ultrasonic driven cold vapor generation from both Hg2+ and CH3Hg+ in solutions of formic and acetic acids as well as tetramethylammonium hydroxide was reported by Ribeiro et al. 1145 As reduction of CH3Hg+ occurs only at relatively high ultrasonic field density, speciation of mercury is feasible by altering the power density during the measurement process. A real sample of river water was used, illustrating proof of principle of this alternative method of mercury cold vapor generation.”
The article by Gil, Lavilla, and Bendicho 1144 was also recommended by Alessandro D’Ulivo with similar comments.
Photochemical vapor generation (PVG)
Photochemical vapor generation – (a) Guo, Sturgeon, Mester, and Gardner, 1146 Anal. Chem., 75 (2003) 2092–2099; (b) Guo, Sturgeon, Mester, and Gardner, 1147 Anal. Chem., 76 (2004) 2401–2405; (c) Angeli, Ferrari, Longo, Onor, D'Ulivo, and Bramanti, 1148 Anal. Chem., 83 (2011) 338–343
Ralph Sturgeon commented, “This paper 1146 is the first report of use of a low pressure mercury lamp as a UV source for photochemical vapor generation (PVG). Alkyl selenium species generated in high yield in formic and acetic acid media were identified by GC–MS and GC–ICP–MS. This article opened the field for a series of studies which subsequently established PVG as a viable analytical alternative to conventional chemical vapor generation techniques. The first analytical application of PVG for quantitation of Se in several environmental matrices was reported in another paper. 1149 Interferences, figures of merit, efficiencies and speculation of a radical mechanism of generation under optimal generation conditions were investigated.”
Alessandro D’Ulivo shared a slightly different view, recommended these three articles,1146–1148 and remarked that, “Photochemical vapor generation using UV radiation and low molecular weight organic acids 1146 represents a convenient and green alternative to CVG for the derivatization of some trace elements to volatile species. The scope of PVG was expanded to the element-forming volatile hydrides, to some transition and noble metals and some non-metals (I and S). 1147 In this paper, 1148 PVG as a useful interface between high-performance liquid chromatography and NDAFS for the on-line oxidation and generation of volatile species of mercury is reported. It also describes the use of a microwave Hg lamp for the simultaneous irradiation of the sample with microwave and UV radiation. 1148 ”
PVG with photocatalyst – (a) Sun, Chang, and Su, 1150 Anal. Chem., 78 (2006) 2640–2645; (b) Zheng, Wu, Ma, Lv, and Hou, 1151 J. Anal. At. Spectrom., 23 (2008) 514–520
As noted by Ralph Sturgeon, “This is the first reported use of a photocatalyst (nano-TiO2) for conversion of Se(VI) to Se(IV) to effect on-line quantitative detection of both species following their ion chromatographic separation. 1150 High efficiency was achieved and the method applied to analysis of several reference materials. This work highlighted the significant potential role of photocatalysts in moving the new PVG methodologies forward.”
Alessandro D’Ulivo suggested another article 1151 on this topic and noted “the introduction of photocatalysts 1151 in PVG improved the analytical applications of this technique in atomic and mass spectrometry.”
PVG with photosensitizers – Gao, Xu, Sturgeon, Mester, Shi, Galea, Saull, and Yang, 1152 Anal. Chem., 87 (2015) 4495–4502
Ralph Sturgeon recalled, “This is the first report 1152 of use of a homogeneous photochemical mediator (added metal ion) to enhance the efficiency of a PVG process. Subsequent studies have validated such applications to other elements such as Cl, which is otherwise not amenable to efficient PVG.”
Solution thin-film reactor for PVG – Zheng, Sturgeon, Brophy, and Hou, 1153 Anal. Chem., 82 (2010) 3086–3093
The key points of this paper, 1153 as summarized by Ralph Sturgeon, are: “The significance of operation of PVG reactors in a thin-film format was highlighted in this study. 1153 Implications for enhanced efficiency, reduced interferences and faster throughput were emphasized.”
Plasma-assisted vapor generation
Plasma-assisted vapor generation with a “microarc” – (a) Layman and Hieftje, 1154 Anal. Chem., 46 (1974) 322–323; (b) Layman and Hieftje, 1155 Anal. Chem., 47 (1975) 194–202
Gary Hieftje recalled, “Microwave plasmas, traditionally operated at modest power levels, had always had difficulty handling samples in the form of nebulized solutions; for that reason, the greatest success has usually been with samples that are naturally volatile (for example, in GC detection) or when the MIP is coupled with a pre-vaporization device such as a graphite furnace or a metal-filament thermal vaporizer. Unfortunately, graphite furnaces ordinarily demanded rather high power levels, and hot filaments did not always function efficiently with refractory samples of low volatility. Larry Layman devised a clever alternative in the form of a device he dubbed the ‘microarc’, 1155 which was later proven really to be an atmospheric-pressure glow discharge. The device consisted of two electrodes, the negative of which was a hairpin-shaped loop of tungsten and on which a microliter or so of sample solution was deposited via a GC syringe. The counter electrode (anode) was simply a stainless-steel hypodermic needle, through which flowed a stream of helium, which served as the MIP support gas. When the microarc was struck, by means of an automobile ignition coil, a pulsating, high-voltage, low-current DC (unipolar) discharge was formed, so sample vapor was released from the cathodic tungsten wire and carried by the He stream directly into the MIP. The combination microarc-MIP offered picogram detection limits, good precision, a low background, and minimal matrix effects. 1155 ”
Hieftje continued, “Unfortunately, it was found that the efficiency of solution transfer from the GC syringe to the tungsten cathode was irreproducible, so Larry devised a clever solution: he warmed the tungsten loop by a constant current to a temperature somewhat below the boiling point of the sample solvent, and monitored the voltage across the filament. With a constant current flowing through it, the filament reached a fixed temperature and therefore maintained a constant resistance which, in turn, yielded a stable voltage. When a droplet of sample solution was deposited on the filament, its temperature dropped, which produced a lower filament voltage. This voltage then remained stable until the solvent was fully evaporated, at which time the voltage returned to its original level. Larry found that the length of time the filament voltage remained at its lower level was directly proportional to the volume of the sample droplet, and could be used to find the volume actually transferred to the tungsten cathode. 1154 The microarc was later coupled also to an ICP 1156 and to a microwave-induced nitrogen discharge at atmospheric pressure. 1157 ”
Plasma-assisted vapor generation with atmospheric-pressure glow discharge with sample solution as an electrode – (a) Zhu, Chan, Ray, Zhang, and Hieftje, 1158 Anal. Chem., 80 (2008) 7043–7050; (b) Liu, Zhu, He, Zheng, Gan, Belshaw, Hu, and Wang, 1159 J. Anal. At. Spectrom., 31 (2016) 1089–1096
According to Ralph Sturgeon, “The first article in this cluster 1158 is the first report of the use of an atmospheric-pressure solution-cathode discharge for the reduction of mercury to generate cold vapor for subsequent detection by ICP–AES. It laid the groundwork for an extensive subsequent investigation into such applications. The second article 1159 is the first report of the enhanced performance of use of a liquid anode for the analyte solution versus liquid cathode for vapor generation.”
Plasma-assisted vapor generation with dielectric barrier discharge (DBD) – Wu, Yang, Liu, Hou, and Zheng, 1160 J. Anal. At. Spectrom., 26 (2011) 1204–1209
Ralph Sturgeon noted, “This is the first report 1160 of several similar subsequent ones utilizing DBDs with varying modes of sample introduction to elicit reduction of metal ions in solution via plasma processes due to direct reduction or via photogenerated radical-induced reduction with simultaneous excitation in the discharge for OES detection.”
Hydride trapping/preconcentration
Hydride trapping and preconcentration on graphite furnace – (a) Drasch, Meyer, and Kauert, 1161 Fresenius Z. Anal. Chem., 304 (1980) 141–142; (b) Lee, 1162 Anal. Chem., 54 (1982) 1682–1686; (c) Sturgeon, Willie, and Berman, 1163 Anal. Chem., 57 (1985) 2311–2314; (d) Sturgeon, Willie, and Berman, 1164 Fresenius Z. Anal. Chem., 323 (1986) 788–792
This series of articles1161–1164 includes some of the early work on hydride trapping and preconcentration on a GF. The importance of each article is explained in detail by Ralph Sturgeon as “The article by Drasch, Meyer, and Kauert 1161 is the first reported application of the standard heated graphite furnace for collection of generated arsine by transporting the analyte through a quartz diffuser tube inserted into one end of the heated furnace (at 370°C) after manually removing the end window cap. After the generation process, the quartz transfer line was removed, the window replaced, the furnace purged with Ar and then the collected sample atomized at 2400°C. The methodology was cumbersome but useful. The paper by Lee 1162 is the second report on the collection of a hydride generated species in the graphite furnace for enhancement of detection power of the technique. Bismuthine, generated by reduction with THB, was collected with high efficiency in a carbon rod atomizer by passing the analyte gas through a channel drilled into a side contact electrode to permit access to the heated tube. Note that Drasch et al. 1161 was not referenced in this study such that it appears to be the first report. The third article 1163 launched a series of subsequent studies aimed at furthering this methodology, and elucidating its reach of application as well as fundamental operation. The major difference in the approach taken by Sturgeon was the direct introduction of the hydride via the sample dosing hole using a quartz tube that permitted ease of operation with an autosampler. These publications generated sufficient interest amongst instrument companies that Perkin–Elmer introduced a commercially supported automated set-up to achieve collection of hydrides in their furnaces. The three publications1161–1163 were seminal papers in this regard and have been summarized in paper 1164 and the theoretical foundation for such collection laid out in subsequent papers.1165,1166 This follow-up article 1164 is significant as it generalized the hydride trapping approach within furnaces, demonstrating a rapid, simple, accurate and precise multielement approach for their determination. Methods are described for the interference free determination of As and Se in seawater as well as marine tissues and sediments based on the generation of AsH3 and SeH2 using NaBH4 with subsequent trapping in a graphite furnace at 600°C.”
With a very similar view, the article by Drasch, Meyer, and Kauert 1161 was also recommended by Alessandro D’Ulivo.
Theoretical and mechanistic studies of hydride trapping and preconcentration on graphite furnace – (a) Sturgeon, Willie, Sproule, and Berman, 1165 J. Anal. At. Spectrom., 2 (1987) 719–722; (b) Sturgeon, Willie, Sproule, Robinson, and Berman, 1166 Spectrochim. Acta Part B, 44 (1989) 667–682
Ralph Sturgeon recounted, “The focus of this paper 1165 is thermal decomposition and deposition of externally generated metal hydrides of As, Sb, Se, and Sn onto a graphite tube surface to achieve their preconcentration and enhance limits of detection by graphite furnace atomic absorption spectrometry. Arrhenius energies, Auger electron microprobe spectroscopy, and electron microscopy with energy-dispersive X-ray fluorescence were used to characterize the sample deposits, and their mechanisms of atomization were shown to be the same as with conventional introduction of these elements in aqueous solutions. In a subsequent study, 1166 efficient trapping of the volatile hydrides of As, Sb, Se, Bi, and Sn on Pd and other platinum group metals occurs at a relatively low temperature (200°C) due to catalytic dissociative chemisorption on the platinum group metals. These studies established the fundamental basis for the commercial methodology/hardware introduced to take advantage of this ultratrace analytical technique.”
Coupling of electrothermal vaporization for preconcentration with determination by other analytical sources – Sturgeon and Grégoire, 1167 Spectrochim. Acta Part B, 49 (1994) 1335–1345
As noted by Ralph Sturgeon, “This is the first report 1167 on the coupling of an ETV with ICP–MS for the enhanced determination of hydride forming elements by their generation and collection in the graphite furnace on a film of reduced Pd. Significant benefits accrue from the absence of co-generated hydrogen perturbing the plasma, as well as decreased spectral interferences due to the specificity of the generation process and detection limits that are readily enhanced 10–100-fold over conventional hydride generation steady-state introduction techniques. Multielement determinations of As, Se, Sb, Sn, and Bi were demonstrated.”
Headspace single-drop microextraction – Fragueiro, Lavilla, and Bendicho, 1168 Talanta, 68 (2006) 1096–1101
The key points of this paper, 1168 as summarized by Ralph Sturgeon, are: “This is the first report 1168 of preconcentration of generated hydrides using headspace single-drop microextraction. Advantage was taken of the ability of a small volume of an aqueous solution of Pd(II) to sorb SeH2 from a closed vessel wherein it was generated by reduction with THB to yield a preconcentration factor of 25.”
Hydride trapping in externally heated quartz tube atomizers – Kratzer and Dědina, 1169 J. Anal. At. Spectrom., 21 (2006) 208–210
As commented by Ralph Sturgeon, “This is the first 1169 in a series of subsequent publications that reports on the successful trapping of generated hydrides within a multiple micro-flame quartz tube atomizer. Bismuthine chemistry was manipulated so as to cause deposition of the oxide onto the quartz surface of the inlet arm in the presence of excess oxygen while desorbing and atomizing the deposit by introduction of an excess of hydrogen sufficient to carry the atoms to the optical arm of the atomizer for AAS detection.”
Atomizers for the analysis of metal- or metalloid-containing vapor
Dispersive atomic-fluorescence spectrometry – (a) Thompson and Reynolds, 1170 Analyst, 96 (1971) 771–775; (b) Thompson and Godden, 1171 Analyst, 100 (1975) 544–548; (c) Thompson, 1172 Analyst, 100 (1975) 307–310
Alessandro D’Ulivo noted, “This pair of papers1170,1171 is the first application of cold vapor generation to Hg determination by AFS which results in a dramatic improvement in sensitivity with respect to CVG–AAS, despite the atomic fluorescence system being developed by alteration of a commercial AAS spectrophotometer. This article 1172 reported dispersive AFS coupled with CVG of volatile hydrides (Sb, As, Se, and Te) by aqueous NaBH4 and resulted in 5–30 times improvement in LODs compared with CVG–AAS when a small argon–hydrogen diffusion flame supported in a simple glass tube was employed as an atomizer.”
Non-dispersive atomic-fluorescence spectrometry (NDAFS) – (a) Tsujii and Kuga, 1173 Anal. Chim. Acta, 72 (1974) 85–90; (b) Tsujii and Kuga, 1174 Anal. Chim. Acta, 97 (1978) 51–57
Alessandro D’Ulivo explained the importance of these two papers1173,1174 by Tsujii and Kuga, and NDAFS in general: “In spite of some favorable features of AFS supported by many studies, the commercial application of AFS is limited to simple NDAFS employing vapor generation as a sample introduction technique, for example, as an element specific detector for chromatography, and vapor generation as an interface between liquid chromatography and NDAFS element specific detectors. The work by Tsujii and Kuga published in 1974 shows the first application of CVG to NDAFS using AsH3 generation by Zn/HCl, 1173 which highlighted the analytical potential of vapor generation techniques coupled to simple NDAFS apparatus based on a mechanically modulated microwave excited electrodeless discharge lamp and argon–hydrogen-entrained air flame. The miniaturization of a hydrogen diffusion flame on a burner of particular design, as detailed in their follow-up work, 1174 allowed improvements in S/N and LODs. In a set of three articles,1175–1177 investigation of different NDAFS apparatus coupled with CVG1175–1177 of hydrides, hydrogen-diffusion flame atomizers and reduction systems, the good analytical potential of CVG–NDAFS for trace and ultratrace analysis was confirmed. The results indicated CVG–NDAFS was competitive with both CVG–AAS and CVG–ICP–AES, giving better LODs (about one order of magnitude better) and maintaining the wide dynamic range of emission techniques (3–5 decades). Multielement NDAFS apparatus (up to four elements)1178,1179 dedicated to CVG was developed for the simultaneous detection and determination of hydride-forming elements using pulsed commercially available RF-electrodeless discharge lamps and miniature hydrogen diffusion flames and a solar blind PMT without filters. The same multielement NDAFS apparatus can be employed as an element-specific detector for gas chromatography, indicating the ability of miniature hydrogen diffusion flames to efficiently atomize alkylated species of metals/metalloids, in addition to hydrides. These two articles1180,1181 describe a prototype of a commercial NDAFS spectrometer (PS Analytical, UK) dedicated to the CVG of mercury using SnCl2 reduction 1180 and hydride-forming elements using NaBH4 reduction. 1181 ”
Quartz tube hydride atomizers (QTAs) – (a) Chu, Barron, and Baumgarner, 1182 Anal. Chem., 44 (1972) 1476–1479; (b) D’Ulivo, Lampugnani, and Zamboni, 1183 J. Anal. At. Spectrom., 5 (1990) 225–229
As explained by Ralph Sturgeon, “Quartz tube atomizers (QTAs) and flame-in-tube atomizers as well as hydrogen diffusion flames are widely used for AAS and AFS detection, respectively, of volatile metal or metalloid species. In Holak's paper, 1084 a gas-sampling technique for arsenic determination by flame AAS was described. The first use of the hydrogen diffusion flame for atomization of hydrides makes reference to the paper by Kahn and Schallis 1184 and suggests it is in use. The classical hydride-generation technique relying on the conversion of an analyte to its volatile hydride was first adopted for use with AAS detection and based on the Marsh reaction to generate arsine which was atomized in an air–acetylene flame (and implicated to be atomized in a heated quartz tube). The paper by Chu et al. 1182 is the first ‘open literature’ publication of the use of a QTA for atomization of hydride-forming elements with AAS detection (the earlier paper by Kahn and Schallis 1184 is assumed to be a less available industrial publication).”
Alessandro D’Ulivo also highlighted the development of an electrothermally heated quartz tube-flame atomizer, specifically designed for application with hydride generation AFS 1183 and commented, “This atomizer employed the hydrogen evolved during the hydrolysis of NaBH4 in the hydride reaction cell and required no external hydrogen gas supply but only carrier gas (Ar) for operation. Detection was by non-dispersive atomic fluorescence. Noteworthy was that although this atomizer could have become useful for future applications in commercial prototypes, its development was triggered by restrictive safety measures within the research institute which prohibited the use of hydrogen gas in the laboratory for safety reasons.”
Mechanisms of hydride atomization in heated quartz cell – (a) Dědina and Rubeška, 1185 Spectrochim. Acta Part B, 35 (1980) 119–128; (b) Dvořák, Talába, Kratzer, and Dědina, 1186 Chem. Sci., 10 (2019) 3643–3648
As noted by Alessandro D’Ulivo, “The mechanism of atomization of hydrides in cool hydrogen diffusion flames, based on the reaction of hydrides with hydrogen radicals, was first proposed in 1980. 1185 It has been the subject of several debates. Direct evidence of this proposed mechanism through determination of the concentration and spatial distribution of H radicals in a quartz hydride atomizer by two-photon absorption laser-induced fluorescence was published only in 2019 1186 – after four decades of investigations. The measured concentration of H radicals is about four orders of magnitude above the typical analytical concentration of hydride. This evidence confirmed the mechanism of hydride atomization proposed by Dědina and Rubeška. 1185 It also ruled out the model of atomization interferences in quartz tube atomizers which is based on the incomplete atomization of hydride due to an insufficient number of H radicals. 1187 ”
Ralph Sturgeon commented, “This paper by Dědina and Rubeška 1185 contains the first description of the radical mechanism of non-thermal atomization of hydride-forming elements in a hydrogen–oxygen diffusion flame used for AAS detection. The work by Welz and Melcher 1188 further detailed development of a mechanism for non-thermal atomization of hydride elements in a hydrogen diffusion flame, consistent with the theory developed by Dědina and Rubeška. 1185 ”
Inter-element interference effect in atomizer – Welz and Melcher, 1187 Anal. Chim. Acta, 131 (1981) 17–25
Ralph Sturgeon highlighted this paper 1187 as the “first publication detailing an explanation for the mutual interferences of co-generated hydrides caused by excess consumption of radicals in a hydrogen diffusion flame.” Alessandro D’Ulivo noted that “Although Welz and Melcher 1187 first proposed that atomization interferences arise because H radicals are preferentially consumed by interfering hydride(s) present in excess with respect to the analyte hydride, the first evidence against this mechanism was reported by D’Ulivo and Dědina, 1189 who proposed a different mechanism. They used a purposely designed microflame-in-quartz tube atomizer with which it was demonstrated that the magnitude of interference depends on the distance of the point of atomization from the point of detection, independently of atomization conditions controlling the production of H radicals. The limited spatial distribution of H radicals (the so called ‘H radical cloud’), not their concentration, is at the origin of interferences. Analyte free atoms present outside the cloud recombine, forming diatomic, polyatomic species… up to particles. Remaining free atoms are then efficiently captured on particle surfaces, which presents itself as a rollover of calibration graphs. Molecular species and particles can be efficiently reatomized by reaction with H radicals. These results were confirmed by the evidence reported by authors in Section 18.4.11.6. The purposely designed atomizer noted above developed into the microflame in-gas-shield device. 1190 ”
Gas flow patterns and longitudinal distribution of free atoms in QTA – (a) Matoušek, Dědina, Johansson, and Frech, 1191 Spectrochim. Acta Part B, 55 (2000) 151–163; (b) Matoušek and Dědina, 1192 Spectrochim. Acta Part B, 55 (2000) 545–557
Ralph Sturgeon recommended this pair of articles1191,1192 and commented, “This paper 1191 reports Schlieren visualization of the gas dynamics in QTAs and the impact of experimental variables on performance. Laminar flow is established with turbulent regions at the ends and center and T-junction where sample is injected. Patterns are unchanged for room temperature and flame-heated tubes and for flame-in-tube arrangements. All free atoms disappear before reaching the ends of the tube and with a flame-in-tube arrangement, where diffusion flames are ignited at the tube ends, free atom densities increase. In this follow-up study, 1192 the longitudinal distribution of Se free atoms in externally heated quartz tube hydride atomizers was studied under analytical conditions, showing highest concentration of free atoms near the middle of the optical tube, where atomization proceeds and all free atoms disappearing before they reach the ends of the atomizer. The effect of re-atomization at the tube ends where a diffusion flame occurs improves sensitivity and reduces non-linearity of the calibration graph. This observation paves the way for the introduction of the multiple microflame quartz tube atomizer. 1193 ”
Shielded hydrogen–oxygen diffusion microflame and multiple microflame QTA – (a) Dědina and D'Ulivo, 1190 Spectrochim. Acta Part B, 52 (1997) 1737–1746; (b) Dědina and Matoušek, 1193 J. Anal. At. Spectrom., 15 (2000) 301–304
According to Alessandro D’Ulivo, “This paper 1190 described a new hydride atomizer based on an argon-shielded, highly fuel-rich, hydrogen–oxygen diffusion microflame with a design which is suitable for application to CVG coupled with AFS detection. Comparison of miniature diffusion hydrogen flame and gas-in-flame shield atomizer atomic fluorescence spectra for hydride-forming elements was reported in this article. 1194 The optimization of flame in gas shield atomizers contributed to the development of very sensitive NDAFS detection for the speciation of elements forming volatile hydrides.”
Ralph Sturgeon noted, “A further consequence of these various earlier studies 1190 (see also Sections 18.4.11.5 and 18.4.11.6) directly led to the development of the more robust multiple microflame quartz tube atomizer as a means of minimizing interference effects from concomitant elements in the sample. 1193 Based on their studies, 1192 Dědina and Matoušek 1193 redesigned the standard QTA to permit realization of multiple micro diffusion flames burning throughout the length of the optical arm to provide an enhanced supply of hydrogen radicals and retain the most important advantage of the commonly employed externally heated QTA while substantially reducing the poor resistance to atomization interferences and unsatisfactory linearity of calibration graphs.”
Dielectric barrier discharge atomizers – (a) Miclea, Kunze, Musa, Franzke, and Niemax, 1195 Spectrochim. Acta Part B, 56 (2001) 37–43; (b) Kunze, Miclea, Franzke, and Niemax, 1196 Spectrochim. Acta Part B, 58 (2003) 1435–1443
Alessandro D’Ulivo noted, “This paper 1195 is the first that reported the potential of DBD plasmas for analytical atomic spectrometry. The ability of the DBD to dissociate gaseous molecular species was demonstrated for halomethanes (CCl2F2, CClF3, and CHClF2) 1195 and in its implementation as an element-selective detector for GC (halogenated and sulfurated hydrocarbons) using DL–AAS. 1196 Further studies 1197 demonstrated the capability of a DBD to atomize arsine and methylated arsines, and DBD atomizers started to find application in CVG–AAS, 1197 CVG–AFS and CVG–OES. 1198 Numerous applications and diagnostic studies since 2006 indicate that DBD can be considered as a simple and convenient alternative atomizer for CVG optical atomic spectrometry. 1199 ”
Laser ablation (LA) for sample introduction
Early work on laser ablation for solid sample introduction into ICP – (a) Thompson, Goulter, and Sieper, 1200 Analyst, 106 (1981) 32–39; (b) Carr and Horlick, 1201 Spectrochim. Acta Part B, 37 (1982) 1–15; (c) Gray, 1202 Analyst, 110 (1985) 551–556; (d) Arrowsmith, 1203 Anal. Chem., 59 (1987) 1437–1444; (e) Arrowsmith and Hughes, 1204 Appl. Spectrosc., 42 (1988) 1231–1239
The first two papers in this group1200,1201 report the early use of LA as a means for solid-sample introduction into ICP–AES whereas the third one 1202 is for ICP–MS. As noted by Michael Blades, the paper by Thompson, Goulter, and Sieper 1200 contained “the first application of laser ablation sampling for ICP–AES.” Richard Russo also considered this paper 1200 as a “good early manuscript using LA–ICP–AES. 1200 Simple chamber, good analytical calibration curves. Reminder that LA sample introduction existed with ICP–AES before the ICP–MS was available.”
Vassili Karanassios recommended the paper by Carr and Horlick 1201 for a similar reason as “it is one of the earliest descriptions of using a laser as a vaporizing-probe to introduce from solid samples the ablated material into an ICP–AES system.” Richard Russo agreed and said, “The article by Carr and Horlick 1201 is one of the initial articles I read at Berkeley that strengthened my interest in LA. The instrument was called a laser vaporization–inductively coupled plasma system for the direct analysis of solid metal samples. 1201 Note the use of ‘vaporization’ which would not be the ideal process to remove mass. Now described as ‘ablation’. Optical emission was used at this time as MS was only now being introduced to the community. System parameters were investigated including ICP emission signal duration, number of laser shots to be used for a determination, the time between laser shots, free running or Q-switched laser operation, and the effect of laser focus. Analytical curves are presented for aluminum and brass samples.”
Many scientists including José Costa-Fernández, Detlef Günther, Norbert Jakubowski, Jorge Pisonero, Martín Resano, José-Luis Todolí, and Frank Vanhaecke recommended the paper by Gray. 1202 As noted by Detlef Günther, “Based on the work on LA–ICP–AES, Alan Gray 1202 recognized the strength of direct solid analysis using mass spectrometry. The manuscript 1202 touched almost all problems which have been studied within the past 40 years. Today, this technique belongs to the most widely used techniques for direct solid sampling.”
Comments from José Costa-Fernández are: “This article 1202 constitutes probably the first application of laser-ablation inductively coupled plasma–mass spectrometry and marked the creation of one of the most versatile direct solid-sampling techniques for both qualitative and quantitative analysis in the past decades. The article describes the results of a preliminary study of the mass spectrometry of solid samples using a ruby laser to ablate the sample into an ICP–MS system.” Norbert Jakubowski expressed a similar opinion.
Jorge Pisonero also shared his comment on Gray's paper 1202 and noted, “Laser-ablation inductively coupled plasma–mass spectrometry (LA–ICP–MS) is a technique that provides direct solid analysis with high spatial resolution, and high sensitivity. It is applied in different research fields (e.g., geology, biochemistry, material science) for elemental and isotopic analysis, providing also 2-D and 3-D imaging capabilities. LA–ICP–MS was first introduced by Gray in 1985. 1202 In this manuscript, 1202 Gray already highlighted some of the most important drawbacks of this method (e.g., aerosol deposition on the sample, ICP scanning not sufficient, insufficient linear dynamic range, more sensitivity for volatile elements, clogging effects on the sample cone, need for an internal standard, quantification extremely difficult), some of them still being considered hot topics in this field. Furthermore, in the conclusions, Gray advanced the progress of LA–ICP–MS: ‘Against this, however, must be set the advantage of working directly on the solid sample, which for certain applications may be paramount. It is certainly considered that these preliminary results justify further development of the technique along the lines suggested.’ 1202 ”
José-Luis Todolí summarized his viewpoint on Gray's paper 1202 as “First report on the use of LA for the direct analysis of solid materials at atmospheric pressure using a different source for analyte ionization, namely, the plasma. In this case, 1202 a ruby laser is used to introduce ablated material from pelletized rock samples. The paper shows interesting data as, for example, a multielement spectrum obtained from a single shot. Additionally, calibration issues are explored and some problems still existing in currently used LA instruments (solid deposit formation, transient signal nature, etc.) are addressed.”
Similarly, Frank Vanhaecke noted, “This paper 1202 by one of the founding fathers of ICP–MS introduces laser ablation as an alternative means of sample introduction into an ICP–MS instrument, permitting direct analysis of solid samples. Ultimately, LA–ICP–MS has become an established technique for bulk and spatially resolved analysis (including depth profiling analysis and imaging applications) of solid materials.”
The two papers by Arrowsmith et al.1203,1204 were recommended by Richard Russo, who commented, “Two articles by Arrowsmith1203,1204 provide timely discussion of critical issues of LA–ICP concerning chamber wash out, pulse rate, fractionation, calibration and other relevant issues. Analytical curves obtained for NBS microprobe steel standards showing precision and accuracy are approximately ±5%.”
Quantitative analysis with LA–ICP–MS – Jackson, Longerich, Dunning, and Freyer, 1205 Can. Mineral., 30 (1992) 1049–1064
As noted by Detlef Günther, “This paper 1205 describes the first quantitative analysis of minerals by LA–ICP–MS using a 1064 nm Nd:YAG laser and has been the starting point of new developments for analyzing minerals. Furthermore, it showed that the microanalysis provided comparable results to solution nebulization ICP–MS.”
Richard Russo commented, “To the best of my knowledge, this 1205 is one of the first articles to address LA–ICP–MS for microsampling of minerals in petrographic sections. Even using the 1064 nm wavelength of the Nd:YAG laser beam, differences in ablation yield, drift, and matrix effects could be compensated by using major-element internal standards. The laser-ablation microprobe was compared to solution-based ICP–MS analyses of titanite, zircon, apatite, uraninite, and garnet, and promoted as an ideal approach for measuring depth profiles in geologic materials.”
Dual gas-flow sample introduction system for LA–ICP calibration – Chenery and Cook, 1206 J. Anal. At. Spectrom., 8 (1993) 299–303
According to José-Luis Todolí, “Calibration is performed by using a dual gas-flow sample introduction system, 1206 with an aqueous aerosol being sent into the second channel. This is a clever solution in which the aerosol leaving a conventional sample introduction system (i.e., pneumatic nebulizer adapted to a spray chamber) and that originating from the ablation system are merged before the ICP torch. As a result, a wet aerosol is delivered to the plasma and, hence, calibration with aqueous standards can be easily carried out and the plasma can be tuned as it is routinely done when aqueous samples are analyzed. The method overcomes the severe limitations of the laser ablation technique when solid standards are not available. This methodology has been followed by many different key researchers 1207 and, for many applications, liquid calibration has led to accurate results.”
Internal standard-independent calibration for LA–ICP–MS with ablation yield correction factor – Liu, Hu, Gao, Günther, Xu, Gao, and Chen, 1208 Chem. Geol., 257 (2008) 34–43
The key points of this paper, 1208 as summarized by José-Luis Todolí, are: “Accuracy is an important challenge in LA–ICP coupling. The present work 1208 shows a successful method for the analysis of solid samples by means of this methodology. Its principle is based on the normalization of the metal oxides and the correction for the different ablated mass as a function of the matrix composition.”
Transient signal data acquisition and analyte concentration calculation in LA–ICP–MS – Longerich, Jackson, and Günther, 1209 J. Anal. At. Spectrom., 11 (1996) 899–904
This article by Longerich, Jackson, and Günther 1209 was recommended by Mikhail Bolshov, Vassili Karanassios, Jorge Pisonero, and Martín Resano.
As pointed out by Jorge Pisonero, “A detailed study on how to deal with transient ion signals originating from LA–ICP–MS analyses was first described by Longerich, Jackson, and Günther. 1209 Optimum data acquisition parameters as well as a specific quantification method for this kind of time-resolved data were originally suggested, resulting, for a long period of time, in a very much appreciated reference manual for multiple labs. This quantification approach included the use of internal standards to compensate for potential matrix effects and signal drifts.”
Martín Resano added, “Critical article 1209 that deals in detail with the best strategies to acquire data when using LA–ICP–MS. The work had a tremendous influence at a time when LA–ICP–MS was starting to be adopted by more labs and the acquisition of transient data by ICP–MS devices (particularly quadrupole-based) was more limited than today.”
Vassili Karanassios shared a similar view and said, “This well-cited paper 1209 describes the use of LA for sample introduction into an ICP and measurement by MS. It also discusses transient signal acquisition and data processing of LA–ICP–MS signals and it offers calibration strategies.”
Mikhail Bolshov remarked, “The methodology of the data acquisition and processing in case of pulsed character of the analytical signals are discussed in this work. 1209 For LA–ICP–MS, this strategy differs significantly from the case of conventional ICP–MS analysis of liquid samples with continuous sample introduction and data acquisition. Nowadays, many results and recommendations look evident, but in 1996, they provided great impact in the analytical community, which is reflected in the number of citations.”
Fractionation in LA-based analysis – (a) Fryer, Jackson, and Longerich, 1210 Can. Mineral., 33 (1995) 303–312; (b) Cromwell and Arrowsmith, 1211 Appl. Spectrosc., 49 (1995) 1652–1660; (c) Longerich, Günther, and Jackson, 1212 Fresenius J. Anal. Chem., 355 (1996) 538–542; (d) Russo, Mao, Borisov, and Liu, 1213 J. Anal. At. Spectrom., 15 (2000) 1115–1120; (e) Guillong and Günther, 1214 J. Anal. At. Spectrom., 17 (2002) 831–837; (f) Kroslakova and Günther, 1215 J. Anal. At. Spectrom., 22 (2007) 51–62
As noted by José-Luis Todolí, “Fractionation in LA-based analysis leading to a change in the time resolved elemental signal ratios was introduced by studies such as that from Fryer, Jackson, and Longerich. 1210 Furthermore, these authors 1210 anticipated the power of LA as a means for spatially resolved analysis of geological samples. The characterization of fractionation phenomena has been of capital importance in order to evaluate the most important variables affecting its extent. Fractionation effects were characterized by Longerich et al. 1212 and their significance was demonstrated to depend on the particular analyte. This finding gives more insight on the proper selection of an element as internal standard to correct for matrix effects. Within this field, the report by Kroslakova and Günther 1215 is of high relevance because discussions on the relationship between the volatility of the elements, the number of laser pulses and the fluence, on the one hand, and fractionation effects, on the other, are included. Note that fractionation is still one of the most important sources of inaccuracy within the field of LA. Papers such as those mentioned helped to recognize them as well as to understand the role of the key variables influencing the magnitude of these detrimental phenomena.”
Richard Russo recommended this pair of articles1212,1213 with annotations: “Longerich et al. 1212 addresses the issue of fractionation among elements in NIST SRM 612, and uses cluster analysis to show that there are suites of elements that fractionate with similar behavior. The correlated behavior is believed to be matrix independent. Our work 1213 demonstrated that fractionation during ablation of NIST glasses existed independent of the UV incident-laser wavelengths (157 nm, 213 nm, and 266 nm). This was a first instrument to combine a Nd:YAG laser with an excimer laser. Although fractionation was observed for all wavelengths, its extent depended on the laser-beam irradiance and the number of laser pulses at the sample location during crater formation.”
Mikhail Bolshov selected the article by Cromwell and Arrowsmith 1211 on this topic and remarked, “This paper 1211 is one of the first publications which attracted attention to the problem of evaporation of solid samples during laser ablation. Due to the different thermodynamic properties of the elements, the stoichiometric composition of the ablated material in the gas phase above the sample surface can differ from the bulk composition. This problem seriously affects the accuracy of analytical techniques based on laser ablation and was later thoroughly investigated in a great number of publications.”
Martín Resano recommended another article 1214 from the Günther research group on this topic, and stated that it is an “authoritative article 1214 that studies the different contributions to elemental fractionation in LA–ICP–MS, highlighting the difficulties of the ICP to properly digest particles of large size.” Likewise, David Hahn also suggested this article 1214 as “the work carefully investigated the complex processes of analyte dissociation and ionization within the ICP and the influence on the resulting MS signals.”
Deep/vacuum UV wavelength for laser ablation – Günther, Frischknecht, Heinrich, and Kahlert, 1216 J. Anal. At. Spectrom., 12 (1997) 939–944
This article by Günther, Frischknecht, Heinrich, and Kahlert 1216 was recommended by Mikhail Bolshov, Jorge Pisonero, Martín Resano, and Frank Vanhaecke. As explained by Jorge Pisonero, “Fractionation effects produced during the ablation process and in the ICP have been investigated in detail. Initial studies demonstrated that fractionation effects required matrix-matched standards for quantitative applications although these effects were partially reduced using shorter wavelengths (e.g., UV instead of IR). In this sense, ArF* excimer lasers, with a fundamental wavelength at 193 nm (deep UV), were considered to have a great potential for LA–ICP–MS analysis with reduced fractionation effects. A milestone in the development of a proper ArF* laser ablation system was achieved by Günther et al., 1216 who developed a novel optical system that provided a homogenized UV laser beam. Making use of a modified petrographic microscope, Gaussian energy laser beam profiles were converted into flat-top energy laser beam profiles, which resulted in homogenous ablation processes of great interest for elemental imaging and for depth profile applications.”
Frank Vanhaecke added, “Introduction of the ArF* excimer-based laser ablation system provided a deep-UV high-energy laser beam with a wavelength of 193 nm. As a result of a homogenized beam profile and a strong reduction of heating effects, even transparent materials can be efficiently ablated, leaving craters with a flat bottom and straight walls. This type of LA-system 1216 has become the standard for ‘high-end’ geological applications and bio-imaging.” Martín Resano shared a similar view.
Mikhail Bolshov expanded the discussion and remarked, “In this paper, 1216 real depth analysis was demonstrated using a beam homogenizer, which produces a flat-top distribution of the ablating laser beam spatial profile. In many publications on depth profile analysis of chemical composition of solid samples by LA–ICP–MS, the problem arising from the spatial distribution of the laser energy across the beam profile was just ignored. As a result, erroneous data were published because of the quite different ablation rates between the center portion and the periphery of the focused laser spot, which caused a bell-shaped intensity profile of a typical laser beam. The original optical scheme for homogenizing the beam profile of the excimer laser is presented and briefly discussed. 1216 With the use of a homogenizer, perfect flat-topped distribution of the ablating laser beam was produced. 1217 With such a beam profile, real measurements of the thickness of Ti-based coatings on steel and W carbides were performed and reported in the work by Bleiner et al. 1217 A depth resolution of 0.2 µm was realized with optimal laser pulse energy.”
The advantageous use of helium for LA–ICP–MS – Günther and Heinrich, 1218 J. Anal. At. Spectrom., 14 (1999) 1363–1368
Martín Resano noted, “This article 1218 reports a fundamental study of the carrier effect of Ar and He in LA–ICP–MS. Three different set-ups are compared: Ar only, a moderate flux of He as sampling gas (going through the cell) plus moistened Ar added after the cell, and a high flux of He as sampling gas plus dry Ar added after the cell. The use of He as sampling gas was demonstrated to be beneficial to improve particle transport efficiency from the ablation cell to the ICP–MS, leading to at least a 2–3-fold increase in analyte signal intensities. In terms of the background intensities, the use of a high flux of He is also beneficial, resulting in a decrease of detection limits by at least an order of magnitude compared with a conventional argon set-up. The addition of moistened Ar, on the other hand, leads to higher background values. After the publication of this article, 1218 the addition of helium inside the ablation cell as carrier became the standard mode of operation in LA–ICP–MS.”
LA with femtosecond laser – (a) Russo, Mao, Gonzalez, and Mao, 1219 J. Anal. At. Spectrom., 17 (2002) 1072–1075; (b) Poitrasson, Mao, Mao, Freydier, and Russo, 1220 Anal. Chem., 75 (2003) 6184–6190; (c) Bian, Garcia, Koch, and Niemax, 1221 J. Anal. At. Spectrom., 21 (2006) 187–191; (d) Koch and Günther, 1222 Anal. Bioanal. Chem., 387 (2007) 149–153
Several scientists recommended the first article in this cluster by Russo et al., 1219 including David Hahn, Vassili Karanassios, Jorge Pisonero, Richard Russo, and José-Luis Todolí. As noted by José-Luis Todolí, “Femtosecond laser for LA–ICP–MS is first introduced in this work. 1219 Fractionation is further examined in these two studies with femtosecond lasers.1219,1220 The use of a fs-laser appears to severely mitigate the extent of these unwanted effects that are one of the most important sources of error in LA.”
Vassili Karanassios shared a similar view that “the Russo paper 1219 provides a fundamental understanding of the significance of using fs-duration pulses to sample solid materials for introduction into an ICP–MS.” Jorge Pisonero expanded the viewpoint and said, “Another way to reduce elemental fractionation when dealing with conductive or thermally sensitive materials is the use of pulsed lasers with shorter pulse durations (e.g., fs instead of ns). It is considered that if the surface explodes before the photon energy is dissipated as heat in the lattice, the ablation process should produce stoichiometric vapor (elemental fractionation should be negligible or significantly reduced). The Russo group 1219 was one of the pioneers in the application of femtosecond laser ablation for direct solid sample chemical analysis. In their work, they demonstrated that fluence (laser energy/spot area) has a significant influence on the amount of mass ablated and on the degree of fractionation; and that infrared femtosecond laser ablation of NIST glasses produced similar characteristics to UV nanosecond laser ablation.”
Viewpoints as shared by Richard Russo are: “The use of femtosecond laser pulses for ablation 1219 demonstrated that fractionation could be mitigated but like the ns case, the degree of fractionation depended on the laser fluence. These early data showed the potential of using fs laser pulses for minimizing thermal damage to the sample substrate, achieving shallower depth resolution, and increased efficiency for converting ablated mass to signal in the ICP–MS. Furthermore, in another article, 1221 by using near-infrared femtosecond laser ablation ICP–MS, the authors demonstrated that non-matrix matched calibration was possible. Different material property standard reference materials were shown to follow a straight calibration graph for the Zn/Cu ratio, using several laser fluences. This manuscript 1221 was a good presentation of the issues related to the ICP–MS sampling causing error in the elemental ratio, and influence of laser parameters. Fluence was found to be one of the major laser ablation parameters influencing performance. Fluence changes the amount of mass ablated which requires re-optimization of the ICP–MS.”
David Hahn recommended these two articles1219,1222 and noted, “These papers1219,1222 together with the one mentioned earlier 928 examine the use of femtosecond lasers for ablation subsequent to ICP–MS1219,1222 and optical emission spectroscopy 928 with a focus of understanding the fundamental mechanisms as compared to more conventional nanosecond lasers, with goals of mitigating fractionation.”
Transport efficiency of ablation cells in femtosecond LA–ICP – Garcia, Lindner, and Niemax, 1223 Spectrochim. Acta Part B, 62 (2007) 13–19
As commented by Richard Russo, “This paper 1223 provides an excellent discussion of transport efficiency during laser ablation – a somewhat misunderstood process among the entire LA community. Mass transport efficiencies were measured for ablation using near-IR fs pulses in different chambers at various flow rates of He. As expected, washout times changed with chamber volume and flow, but the same absolute transport efficiency of about 77% was found for all chambers. Transport efficiency is a critical metric for driving the sensitivity of the ablation process.”
LA with an ICP–TOF-MS – Mahoney, Li, and Hieftje, 1224 J. Anal. At. Spectrom., 11 (1996) 401–405
As noted by Vassili Karanassios, “To my knowledge, this paper 1224 provides the first description on a laser-ablation system coupled to a quasi-simultaneous ICP–MS – an ICP–TOF mass spectrometer. Fast data acquisition considerations are discussed in detail.”
Direct atmospheric sampling for laser ablation – (a) Nishiguchi, Utani, and Fujimori, 1225 J. Anal. At. Spectrom., 23 (2008) 1125–1129 (b) Kovacs, Nishiguchi, Utani, and Günther, 1226 J. Anal. At. Spectrom., 25 (2010) 142–147
Ralph Sturgeon indicated, “Sampling of atmospheric contaminants by ICP–MS in real time is difficult due to the limited tolerance of the plasma toward air. Apart from resorting to incorporation of expensive differential mobility analyzers as a gas exchanger, this issue was cleverly circumvented by Nishiguchi and colleagues 1225 by using a nested arrangement of a porous silica inner tube (0.1 µm pore size) to transmit an air sample and a borosilicate glass outer tube flushed with a 10-fold higher flow of Ar in the concentric space defined by the two tubes. The device operated in a manner similar to that employed for moisture removal from aerosolized samples via its permeation through a porous membrane. A reported efficiency of > 97% was achieved for removal of N2 at an intake flow of 500 mL min−1 and its replacement by Ar, thereby enabling the direct sampling of air for particulate species in real time without perturbation of the plasma. Although the authors 1225 cautioned that further studies were required/underway to demonstrate practicality for quantitative analysis, most noteworthy is the obvious implication of use of this inexpensive device to enable rapid gas exchange during laser ablation of samples too large to be conveniently housed in closed cells.”
Frank Vanhaecke remarked, “For solid sampling using laser ablation, the sample to be investigated needs to be placed in an ablation cell, thus causing limitations for the analysis of larger precious samples. By using a gas exchanger to exchange air for Ar, the authors 1226 report on a set-up allowing in-air ablation, thus removing sample size restrictions.”
Visualization of the aerosol formation processes – (a) Vogel and Venugopalan, 1227 Chem. Rev., 103 (2003) 577–644; (b) Koch, Schlamp, Rösgen, Fliegel, and Günther, 1228 Spectrochim. Acta Part B, 62 (2007) 20–29; (c) Koch, Wälle, Schlamp, Rösgen, and Günther, 1229 Spectrochim. Acta Part B, 63 (2008) 37–41; (d) Koch, Heiroth, Lippert, and Günther, 1230 Spectrochim. Acta Part B, 65 (2010) 943–949
Igor Gornushkin recommended the review by Vogel and Venugopalan 1227 on mechanisms of pulsed LA of biological tissues and commented, “Imaging of physical phenomena often provides the key to their understanding. The work by Vogel and Venugopalan 1227 elucidated mechanisms of pulsed ablation in biological tissues; a great help here was for visualization of the processes by state-of-the-art Schlieren imaging.”
The key points of this cluster of work,1228–1230 as summarized by Annemie Bogaerts, are that “laser scattering and shadowgraphic imaging experiments are used to study the expansion of aerosols generated by ns and fs near-IR LA of metals at atmospheric pressure and in different gas atmospheres. A pulsed laser was used to obtain good temporal and spatial resolution. In this work, 1228 the aerosol expansion in argon versus helium was compared and found to be clearly different, due to the different viscosity. In addition, ns and fs near-IR LA were compared, showing that fs-LA gave rise to highly dynamic expansion patterns. In a subsequent article, 1229 it was shown for fs-LA that aerosols were captured in symmetric vortices when striking a solid boundary during their expansion stage, resulting in only minor losses in ablation cells. Finally, in this paper, 1230 three independent shockwave fronts were observed, due to the instantaneous compression of ambient gas in the initial stage of fs-LA, a secondary compression by material ejection, and air breakdown above the target surface. These studies1228–1230 are important to determine the most appropriate ablation protocol and for the design of optimum ablation cells.”
Particle behavior in LA–ICP – (a) Perdian, Bajic, Baldwin, and Houk, 1231 J. Anal. At. Spectrom., 23 (2008) 325–335; (b) Perdian, Bajic, Baldwin, and Houk, 1232 J. Anal. At. Spectrom., 23 (2008) 336–341
This pair of back-to-back published articles was recommended by Richard Russo, who commented, “These two articles1231,1232 nicely address a critical issue in LA–ICP–MS: the influence of particle size and size distribution on signal intensity spikes. Large particles are considered as a major cause of fractionation, as the time behavior for vaporization, atomization, and ionization in the ICP is particle-size dependent. The first article 1231 addresses the laser pulse duration (fs versus ns), clearly demonstrating that the fs laser pulses significantly reduce the signal spikes (smaller particles and narrower particle size distribution). The second article 1232 shows how sample composition and morphology influenced the spiking. Helium transport gas significantly decreased large positive signal spikes, an indication of the fundamental expansion process during laser ablation that governs the particle size and its distribution.”
Computer modeling for laser ablation for analytical sampling – Bogaerts, Chen, Gijbels, and Vertes, 1233 Spectrochim. Acta Part B, 58 (2003) 1867–1893
This paper was recommended by Annemie Bogaerts, Alessandro De Giacomo, Igor Gornushkin, and Richard Russo. As remarked by Alessandro De Giacomo, “This is an extensive theoretical paper 1233 reporting a theoretical model for laser ablation as well as plasma formation and laser–plasma interaction. The authors were able to estimate the target temperature, the initial plasma density and the effect of laser heating and all the plasma parameters as functions of time. The results are extremely useful because many of these physical aspects cannot be investigated experimentally.”
Annemie Bogaerts offered a similar view and noted, “This work describes the first comprehensive model of laser ablation, including laser–sample interaction yielding heating, melting and vaporization, vapor plume expansion, plasma formation, and laser–plasma interaction. The paper 1233 also gives a nice overview of the underlying mechanisms of laser ablation.”
Igor Gornushkin added, “A model of laser induced plasma that included both the laser–target interaction and the plasma stage was developed by Bogaerts et al. 1233 The paper bridges complicated processes of laser–matter interaction, laser ablation, and plasma evolution by using simple physics and thus establishes a framework for further deepening the model if anyone wishes doing that.”
Richard Russo commented, “The paper 1233 presents a nice overview of analytical applications and different modeling approaches available for laser ablation. Very nice theoretical treatment of laser evaporated plume expansion in vacuum or in a background gas, as well as about the different mechanisms for particle formation in the laser ablation process. Modeling results are in reasonable agreement with calculated and measured data from literature.”
Computer modeling of LA-aerosol transport and optimization of laser ablation cell setup – (a) Bleiner and Bogaerts, 1234 J. Anal. At. Spectrom., 21 (2006) 1161–1174; (b) Lindner, Autrique, Pisonero, Günther, and Bogaerts, 1235 J. Anal. At. Spectrom., 25 (2010) 295–304
In a series of articles, computer modeling on the transport of LA-aerosols as well as simulations and optimization of the design of LA chambers and cells for the ICP are described. Annemie Bogaerts provided detailed accounts on each study: “The first paper 1234 describes fluid dynamics simulations for laser ablation sample introduction. It was shown that the flow characteristics of the carrier gas affect the sample introduction and signal intensity. The temporal signal profiles were modeled, considering the aerosol filling and elution rates in the setup, the whole setup dimensions, the transport efficiency, and the particle sizes. In addition, transient signals were modeled for repeated laser shot analysis, calculating the convolution of a single shot profile with the laser pulse sequence profile. In the more recent work, 1235 the study of a specific laser ablation cell, i.e., the high efficiency aerosol dispersion cell, by means of computational fluid dynamics simulations, was reported. The particle transport was analyzed, as well as the critical velocity for the onset of particle losses. The transport efficiency through the Venturi chamber was investigated for different sample gas flow rates. Small particles were predominantly lost at low flow rates, while large particles were mainly lost at higher flow rates. A modified high efficiency aerosol dispersion cell was proposed, based on the simulation results, which resulted in extremely short calculated washout times. As this laser ablation cell consists of different modular parts, the results are also interesting for other ablation cells.”
Laser ablation and its pyrolysis products for organic polymeric samples – Todolí and Mermet, 1236 Spectrochim. Acta Part B, 53 (1998) 1645–1656
As explained by José-Luis Todolí, “This paper 1236 demonstrates that, contrary to what would be expected, carbon cannot be considered as a good internal standard for LA–ICP work with organic polymers. This is due to the fact that carbonaceous compounds suffer from pyrolysis leading to the generation of volatile species. The present study 1236 proves it for the first time based on thermal desorption–GC–MS and LA–ICP–AES experiments.”
Vaporization of laser-produced aerosols and diffusion losses in ICP–MS – Flamigni, Koch, and Günther, 1237 Spectrochim. Acta Part B, 76 (2012) 70–76
This paper 1237 on experimental and theoretical investigations about the vaporization of laser-produced aerosols and individual particles inside ICP–MS was recommended by Annemie Bogaerts, who summarized its key point as: “This paper 1237 is on the evaporation process of laser-produced aerosols and the subsequent diffusion losses inside the ICP, by means of 2-D OES and ICP–quadrupole MS of individual particles. Later, the authors reported that larger particles may vaporize incompletely or at different axial positions inside the ICP because of composition-dependent melting and vaporization enthalpies.”
Fluorescence imaging of ion distributions in the ICP with LA sample introduction – (a) Moses, Ellis, Jones, and Farnsworth, 1238 Spectrochim. Acta Part B, 105 (2015) 47–59; (b) Moses and Farnsworth, 1239 Spectrochim. Acta Part B, 113 (2015) 54–62; (c) Moses and Farnsworth, 1240 Spectrochim. Acta Part B, 113 (2015) 138–146
As summarized by Annemie Bogaerts, “This set of papers focuses1238–1240 on LA sample introduction into the ICP, reporting fluorescence imaging of ion distributions 1238 and particle size distributions with ultra-violet nanosecond laser ablation and their relative contributions to ion densities. 1239 Images from LA were compared with those from a pneumatic nebulizer, and the effect of water added to the LA aerosol was studied. 1238 Aerosol properties were correlated with ion distributions in the ICP, and it was found that most of the LA–ICP–MS signal originates from particles larger than 1 μm. 1239 In addition, the effect of gas composition on the plasma and the ablation characteristics was studied, as well as the ion-cloud characteristics in the ICP. 1240 In particular, using He yielded lower ion densities in the ICP. Finally, changes in ablation process were distinguished from changes in the ICP. 1240 ”
Common reference material for LA – Jochum, Weis, Stoll, Kuzmin, Yang, Raczek, Jacob, Stracke, Birbaum, Frick, Günther, and Enzweiler, 1241 Geostand. Geoanalytical Res., 35 (2011) 397–429
This work 1241 reports the determination of reference values for NIST SRM 610–617 glasses following International Organization for Standardization guidelines. Its importance is highlighted by Jorge Pisonero: “One of the most commonly employed set of standard reference materials in LA–ICP–MS is the series of NIST 610–617 glasses. Their references values are of great interest as they are used for the quantification of multiple samples and for multiple fundamental studies. In this paper, 1241 a new set of reference values for these reference materials was presented, following the requirements of International Organization for Standardization guidelines and the International Association of Geoanalysts’ protocol. Moreover, the extent of inhomogeneity of some elements (e.g., Ni, Se, Pd, and Pt) was included in the determination of uncertainties.”
Solid matrix transformation with molten ammonium bifluoride salt as digesting reagent for LA–ICP–MS – Zhang, Hu, Liu, Chen, Gao, and Gaschnig, 1242 Anal. Chem., 84 (2012) 10686–10693
As noted by Richard Russo, “A holy grail of an analytical technique is a consistent matrix, and that is the underlying success of acid digestion and liquid sample introduction. With LA–ICP–MS, the analyte is usually a minor component in a sample matrix, and therefore the technology has to deal with matrix effects. Although LA–ICP–MS is generally promoted as a ‘no sample preparation’ technique, use of NH4HF2 (ammonium bifluoride) is demonstrated as a simplified solid sample digestion approach to make the sample part of a consistent matrix. 1242 In addition, the solid matrix transformation enables the introduction of spikes as tracers or internal standards. 1243 Matrix effects and lack of standards have been the Achilles’ heel of LA and can be mitigated by using ammonium bifluoride.”
Chemical imaging with single- or sub-micrometer resolution with LA–ICP–MS – (a) Wang, Grolimund, Giesen, Borca, Shaw-Stewart, Bodenmiller, and Günther, 1244 Anal. Chem., 85 (2013) 10107–10116; (b) Van Malderen, van Elteren, and Vanhaecke, 1245 J. Anal. At. Spectrom., 30 (2015) 119–125; (c) Douglas, Managh, Reid, and Sharp, 1246 Anal. Chem., 87 (2015) 11285–11294
José-Luis Todolí recommended the paper by Wang et al. 1244 and commented, “This paper 1244 describes a new ablation cell that minimizes the aerosol dispersion and, hence, improves the spatial distribution by minimizing the peak tailing observed when single laser shots are considered. In fact, the full width at 1% peak maximum is as short as 30 milliseconds. With this chamber design, resolutions of a few micrometers are achieved for microstructured metallic films, whereas subcellular analysis is possible because, for this kind of sample, the spatial resolution is close to one micrometer. This level of resolution is hampered by the somewhat low sensitivity of the spectrometer, which is the limiting component to perform efficiently this kind of analysis.”
Frank Vanhaecke recommended all three articles1244–1246 in this set and remarked, “In these papers, three research groups1244–1246 describe the development of low-dispersion ablation cells that – by a combination of minimizing the volume of the aerosol-capturing device and optimizing the gas flow regime – lead to an improvement of the ‘washout’ behavior by approximately two orders of magnitude. These devices hence allow much faster mapping (e.g., for imaging applications), while the higher signal-to-background ratio also permits laser beams with a smaller diameter to be used, thus improving the spatial resolution.”
Laser ablation (reviews) – (a) Russo, 1247 Appl. Spectrosc., 49 (1995) 14A–28A; (b) Günther and Hattendorf, 1248 Trends Anal. Chem., 24 (2005) 255–265; (c) Garcia, Lindner, and Niemax, 1249 J. Anal. At. Spectrom., 24 (2009) 14–26; (d) Russo, Mao, Gonzalez, Zorba, and Yoo, 1250 Anal. Chem., 85 (2013) 6162–6177
As outlined by Elisabetta Tognoni, “Russo 1247 here describes at an introductory level different regimes of laser–sample interaction observed at varying irradiance during solid sampling; the paper also introduces the concept of plasma shielding by inverse bremsstrahlung.” Norbert Jakubowski recommended the 2013 review by Russo et al. 1250 and mentioned, “The 2013 review 1250 on laser ablation applied for analytical purposes is a very comprehensive coverage of all types of laser studies used for analytical purposes. This feature article 1250 discusses current issues in fundamental physics of the interaction of photons with solid matter and how this interaction can be used for microchemical analysis. From this interaction, photons from the ablation site can be detected by LIBS and by LAMIS directly or, alternatively, particles can be transported to an ICP–MS for multielement analysis. The authors 1250 claim that a combination of all these techniques can provide a full multielement, molecular and isotopic analytical picture of the sample of interest.”
Richard Russo recounted, “This paper 1247 describes laser ablation as it is used with analytical spectroscopy for chemical analysis, and its relation to experimental parameters and fundamental properties. The paper 1247 shows our first experience of using repetitive pulses instead of a single pulse as a way to improve analytical performance and to study laser–material interactions. The paper shows the effect of fluence on mass ablation rate – and how the mechanism changes into various linear regions with changes in slope. It also shows for the first time a correlation between ICP–AES and laser-induced plasma spectroscopy. Significantly, even though the ablation rate changes with parameters, as long as parameters are constant under a method, good analytical chemistry can be achieved – excellent calibration graph for quantitative analysis. Our 2002 review 1251 described up-to-date research on fundamental and applied aspects of laser ablation with over 150 relevant references. Topics covered include experimental parameter influence on ablation processes, sample parameter effects, crater formation, calibration and optimization, fractionation, and a summary of applications. In line with the theme of our 2002 article, 1251 this 2013 manuscript 1250 discussed current issues in fundamental and applied research with 175 references. The review covered the physics of the ablation process, shock waves, plasma formation and persistence, and aerosol particle characteristics for nanosecond and femtosecond pulses. LIBS and LAMIS were reviewed with state-of-the-art data analytics for using optical spectra for characterization analysis and isotopics. Near-field sub-diffraction limited sampling and filament beam propagation for remote sensing were also discussed. The review paper by Koch and Günther 1252 addressed current aspects of LA–ICP–MS including aerosol formation and transport, chamber flow patterns, particle vaporization in the ICP, fractionation, and calibration. An emphasis was placed on the performance of femtosecond LA and stated to be one of the most important advancements made over the past years.”
Mikhail Bolshov shared the review by Günther and Hattendorf 1248 and opined, “The results of the intensive investigations of fractionation in laser ablation during at least a decade are summarized and critically reviewed in this article. 1248 Different processes at different steps of the analytical signal formation: material sampling, aerosol transport, vaporization, atomization and ionization within the ICP all contribute to fractionation and affect the accuracy of the analysis. Some developed strategies to account for and minimize fractionation are presented in the review. 1248 One way to reduce fractionation, at least during material removal, is through the use of femtosecond lasers.”
The review by Garcia, Lindner, and Niemax 1249 was recommended by Zhanxia Zhang and David Hahn. As noted by Zhanxia Zhang, “The paper 1249 discusses the influences of the wavelength, fluence and pulse width of the laser, the form of the ablation cell, the cell gas, the particle transport and atomization in the ICP on LA–ICP–MS response. Proposals to map out strategies for optimum LA–ICP–MS analyses are suggested.”
David Hahn added, “The results of matrix effects with laser ablation–inductively coupled plasma–mass spectrometry can be attributed to non-stoichiometric ablation, transport, and ICP–analyte interactions. This perspective article by Garcia, Lindner and Niemax, 1249 together with the previously cited article by Guillong and Günther, 1214 carefully investigate the complex processes of analyte dissociation and ionization within the ICP and the influence on the resulting MS signals.”
Other sample introduction means
Flow injection analysis – (a) Betteridge, 1253 Anal. Chem., 50 (1978) 832A–846A; (b) Ruzicka, 1254 Anal. Chem., 55 (1983) 1040A–1053A
Comments from Nicolas Bings on this set of papers regarding flow injection analysis are “The Betteridge paper 1253 shows the very first demonstration of the concept of flow injection analysis and description of the unique features of flow injection analysis, which significantly changed the concept of solution handling in the chemical laboratory. 1254 Outstanding papers! The papers convincingly show that flow injection analysis makes chemical analyses truly compatible with modern tools and allows the design of so called ‘microchemielectronic’ devices.”
Direct sample insertion into ICP – Salin and Horlick, 1255 Anal. Chem., 51 (1979) 2284–2286
Comments from José Broekaert on this paper include, “Direct insertion of graphite cups or rods with microamounts of powders or dry solution residues into the ICP has been described and shown to be useful for microanalyses by plasma atomic spectrometry. The paper 1255 describes a new and practical way for analyzing powder as well as dry solution residue microsamples with plasma spectrometry.”
Viewpoints, Perspectives, Theoretical, and Philosophical Discussions
The chemical analysis of things as they are – Lundell, 1256 Ind. Eng. Chem. Anal. Ed., 5 (1933) 221–225
This 1933 article by Lundell is a classic on the philosophy of chemical analysis. It is nominated as reading material by several scientists, including Vassili Karanassios, David Koppenaal, and Alexander Scheeline. Comments from Alexander Scheeline on this article are: “Chemical analysis is not about detecting pure substances in pristine matrices; it concerns identifying and quantifying analytes in complex, real world matrices. This paper 1256 was often cited by Velmer Fassel. Characterizing analytical methods in simple matrices such as distilled water or clean buffer is not the same as using those methods in the real world, where matrices are often irreproducible, interferences can take unanticipated forms, and purification techniques can be poisoned by inconveniently present concomitants. Fundamental studies with clean specimens may provide insight, but only when a method works in actual matrices such as farm soil, sea water, crude oil from a variety of sub-surface pools, and blood plasma from people with varying diets, diseases, and demographics, can the method be regarded as useful, accurate, or precise.”
Viewpoints from Vassili Karanassios are: “This well-written paper 1256 identifies potential sources of misconception when using (or developing) an analytical method and (in general) it provides a conceptual framework for chemical analysis. It should be placed on the must-read list of those who practice analytical chemistry and those who use analytical results as part of their profession. I consider it essential reading, especially for the younger generation of analytical chemists. Highly relevant to this day.”
David Koppenaal added, “A thought-provoking article 1256 that stresses the viewpoint of the title and not its opposite, i.e., the chemical analysis of things as they are not, which the author feels is an outcome of too much analytical specialization. Note the date of this article – 1933!”
Analytical chemistry as a discipline – (a) Findeis, Wilson, and Meinke, 1257 Anal. Chem., 42 (1970) 26A–38A; (b) Lewenstam and Żytkow, 1258 Fresenius Z. Anal. Chem., 326 (1987) 308–313; (c) Cammann, 1259 Fresenius J. Anal. Chem., 343 (1992) 812–813; (d) Valcarcel, 1260 Fresenius J. Anal. Chem., 343 (1992) 814–816
This set of articles1257–1260 was recommended by Ulrich Panne, who detailed, “Wilhelm Ostwald described in his textbook 1261 (English translation 1262 is available) on the role of analytical chemistry in chemistry as ‘handmaiden’. Since then, analytical chemistry or analytical sciences as a scientific discipline stays a ‘contest concept’. This paper 1257 summarizes many positions on the changing role of analytical chemistry in a fundamental dialogue. One of the most concise and rigorous analyses of analytical chemistry as a discipline torn between deductive and inductive science, this paper 1258 introduces the fine difference between determinator and analyst, too. These two articles1259,1260 are, respectively, in the first 1259 and second 1260 place of an unparalleled competition within the scientific community on the definition of analytical chemistry, two ageless descriptions covering all relevant aspects of the field.”
The seven ages of an analytical method – Laitinen, 1263 Anal. Chem., 45 (1973) 2305
This one-page editorial article written by Laitinen 1263 is a classic and appears on many scientists’ key-paper list, such as Michael Blades, WingTat Chan, and Vassili Karanassios. Michael Blades commented, “Not strictly speaking an atomic spectroscopy paper, but in my 40+ years as an analytical spectroscopist, this article 1263 is one of the most often cited papers in analytical talks. All of the big stars have given a conference talk based on the contents of this analytical classic. It is a cornerstone paper that provides a perspective on the evolution of analytical instrumentation.”
Vassili Karanassios noted, “This one-page editorial 1263 is critically important to students (and potentially future practitioners) because it sensitizes them to the fact that today's state-of-the-art analytical methods and instrumentation will become obsolete sometime in the future. In many respects, it promotes continued innovation.”
WingTat Chan remarked, “The classification still applies today. ‘It might be an interesting exercise for the student to classify a number of analytical techniques according to their phases of development, and to look for resurgences in their histories.’ 1263 ”
Principals and principles, as well as past, present, and future, of spectrochemical analysis – (a) Meggers, 10 Spectrochim. Acta, 3 (1947) 5–17; (b) Meggers, 1264 J. Opt. Soc. Am., 36 (1946) 431–448
As explained by Benjamin Smith, “Often referred to as the ‘Dean of American Spectroscopists’, William F. Meggers was a towering figure in 20th century American spectroscopy and his 140 publications from 1918 to 1978 contributed a great deal to fundamental and applied aspects of spectrochemistry. His life's work was the preparation of the monumental NBS Monograph 32, Tables of Spectral-Line Intensities, published in 1961 with Charles Corliss and Bourdon Scribner. These two papers,10,1264 written at mid-century, are good examples of his ability to review, summarize and forecast the field. The first paper 10 provides one of the best concise summaries of the development of spectrochemical methods that I have seen. It also presents a good overview of the state-of-the-art at mid-twentieth century and concludes with a discussion of his choices for the five general principles of spectroscopy that are directly applicable to spectrochemical analysis. The second paper, 1264 given as an invited lecture at the winter 1946 meeting of the Optical Society of America, sets out a starting point for research going forward after the conclusion of the war. He again summarizes very well the important developments in the first half of the 20th century, lays out the state-of-the-art in 1946 and concludes with some important problems and expectations for the future.”
Sensitivity of emission spectral analysis – Mandelstam and Nedler, 1265 Spectrochim. Acta, 17 (1961) 885–894
As suggested by José Broekaert, “The paper 1265 treats the theoretical basis of the absolute power of detection of optical emission spectrometry in a unique way. The obtainable sensitivities and detection limits in optical emission spectrometry can be estimated on an absolute basis from the source and instrument characteristics.”
Science versus fiction in atomic absorption – Alkemade, 1266 Appl. Opt., 7 (1968) 1261–1269
This paper was recommended by Michael Blades, George Chan, and Stanley Crouch. As outlined by Stanley Crouch, “In this paper, 1266 Alkemade discusses some of the persistent statements in the literature regarding several reputed advantages of atomic absorption as compared to atomic emission spectrometry. Theoretical and experimental factors are considered.”
Michael Blades commented, “This paper 1266 was required reading material back in my day as a graduate student in that it contains a lot of valuable information on the basics of AAS and AES and the shape of analytical working curves. It was the basis for my understanding of the advantage of using a hollow-cathode lamp to isolate particular spectral lines and defined my understanding of the underlying basis for the differences in instrumentation used for AAS and AES. A classic and timeless paper!”
George Chan added, “This paper by Alkemade 1266 convincingly showed how one can provide, through arguments based on fundamental spectrophysics, a fair comparison on a controversial topic, which to some sounds like comparing apples and oranges. Specifically, based on arguments from noise theory and spectral line width, Alkemade 1266 clarified some misconceptions of atomic absorption and compared atomic absorption and emission spectrometry. The conclusion that AAS is superior to AES, in terms of sensitivity, only if the spectral radiance of the light (lamp) source exceeds that of a blackbody at the temperature of the atomic reservoir (flame) and at the wavelength of the analysis line, is an important one. In addition, the experiment and associated reasoning that he described to argue against a common belief at that time that interference between K and Rb is due to collisional excitation (sensitized fluorescence) is simple and beautiful.”
Atomic absorption spectroscopy, stagnant or pregnant? – Walsh, 1267 Anal. Chem., 46 (1974) 698A–708A
This article was recommended by several scientists including Nicolas Bings, Stanley Crouch, and Vassili Karanassios. Stanley Crouch noted, “Walsh 1267 discusses the status of atomic absorption spectroscopy as of 1974 including historical matters, current research, and possible future developments.” Nicolas Bings stated, “After 1955 the development of atomic absorption spectrometry was at first slow, as described by Walsh. 1267 Since 1973, when instrument makers also discovered the potential of the new method, the development has been spectacular. The development described by Walsh 1267 is very interesting to read.”
Vassili Karanassios added, “The paper 1267 contains a very catchy title and a nice story told eloquently. It provided ‘food for thought’ for many of my research endeavors (and, ideally, those of my students).”
Walsh's personal recollections and speculations on AAS – Walsh, 1268 Spectrochim. Acta Part B, 35 (1980) 639–642
As noted by Vassili Karanassios, “This paper 1268 contains wonderful ideas. One of my favorite quotes comes from this paper, ‘It appears to be true that having an idea is not necessarily the result of some great mental leap: it is often the result of merely being able, for one sublime moment, to avoid being stupid!’ 1268 This quote has stayed with me to this day (since the first time I read it as a graduate student).”
Atomic absorption spectrometry – pregnant again after 45 years – Welz, 1269 Spectrochim. Acta Part B, 54 (1999) 2081–2094
According to Martín Resano, “This very interesting review and viewpoint 1269 discusses the main trends of AAS at that time, including some that will become focal research points (solid sampling and high-resolution continuum source AAS) and others that were not successfully exploited any further. For many readers, it was the first contact with high-resolution continuum source AAS. The title is a direct reference to a famous review by Alan Wash. 1267 ”
Atomic absorption spectrometry – has it gone or where is it going? – Hieftje, 1270 J. Anal. At. Spectrom., 4 (1989) 117–122
Stefan Florek recommended this viewpoint article because, “The critical article, 1270 which is still topical today, showing how dynamically and competitively the individual analytical techniques have been developed in research and on the market, using the example of AAS. Hieftje wrote: ‘Clearly, for AAS to remain viable in the face of strong competition from alternative techniques will require novel instrumentation or approaches. Among the novel concepts that have been introduced are those involving continuum sources and high-resolution spectral-sorting devices, interesting atomisation devices and entirely new detection approaches. The impact of these developments will be evaluated against the backdrop of similarly exciting advances in competing techniques. The date when AAS will no longer be a viable technique is predicted.’ 1270 ”
Alexander Scheeline noted, “that prediction was several decades before the current critical article was considered, much less written. Hieftje made the prediction 1270 somewhat facetiously. What he actually demonstrated was that extrapolating a fitted curve is often inadvisable.”
Theoretical and practical limits in atomic spectroscopy – (a) Winefordner and Vickers, 1271 Anal. Chem., 36 (1964) 1939–1946; (b) Winefordner and Vickers, 1272 Anal. Chem., 36 (1964) 1947–1954; (c) Tölg, 1273 Analyst, 112 (1987) 365–376; (d) Dawson, 1274 J. Anal. At. Spectrom., 6 (1991) 93–98; (e) Winefordner, Petrucci, Stevenson, and Smith, 1275 J. Anal. At. Spectrom., 9 (1994) 131–143
Stanley Crouch recommended these two articles1271,1272 and noted, “Winefordner and Vickers1271,1272 use signal-to-noise ratio theory to calculate detection limits in atomic emission and atomic absorption spectrometry. Optimization of spectral bandpass for these techniques is also discussed.”
Nicoló Omenetto and James Winefordner recommended the article by Tölg 1273 and remarked, “In this article 1273 (originally a Conference Lecture), Tölg makes it very clear that the motivation for lowering the limits of detection is to determine trace elements present at their natural concentrations in biotic materials so to improve our knowledge about the complex biochemistry involved. The analysis of the micro-distribution of traces (microtrace analysis) is the major impetus behind the search and development of more sensitive methods. A vital message stresses the fact that each improvement in the detection power in trace analysis re-imposes the question of reliability of the results, and that improvements in both detectability and reliability necessitate carrying out basic research as first step.”
George Chan recommended the other two articles1274,1275 in this list and explained, “The viewpoint article by Dawson 1274 covered some historical background and philosophy, but the emphasis was on more then-recent developments (as of 1991). It provided a theoretical comparison of flame and furnace AAS (Equations 1 to 3 therein 1274 ). Figure 1 of the paper 1274 compared the theoretical and experimental wavelength dependence of the ratios of the detection limits by flame AAS and AES, and the results matched very well to the expectation as outlined by Alkemade. 1266 As a viewpoint article, it also provided prospects for future development with one being ‘there will be continued efforts to exploit fundamentally sound and attractive ideas that are technically unlikely to be realizable in an acceptable manner, e.g., simultaneous multi-element atomic absorption.’ 1274 Simultaneous multi-element AAS nowadays is realized and is commercially available in the market. This article by Winefordner 1275 used a fundamental approach to give theoretical expressions for the detection efficiency and measurement efficiency for a suite of atomic analytical techniques (e.g., AAS, AES, AFS, atomic ionization spectrometry, and atomic mass spectrometry) with different atomic sources (e.g., flame, plasma, and furnace). The approach and formula are useful to estimate the order of magnitude of detection and measurement efficiencies as well as the respective noise levels. It is a good and handy reference for a list of formulas 1275 for comparison of detection and measurement efficiencies. In addition, through these fundamental formulas, one can understand and appreciate the fundamental physical limitations of an analytical technique.”
Ove Axner also recommended this paper by Winefordner et al. published in 1994 1275 and noted, “This paper, 1275 together with the one by Winefordner, Smith and Omenetto, 840 discuss critically the ultimate performance of analytical atomic spectrometry; including addressing the question ‘How close is laser-based techniques in general, and LIF in particular, to single atom detection?’”
Theoretical discussion on atomic fluorescence spectroscopy in flames – Alkemade, 1276 Pure Appl. Chem., 23 (1970) 73–98
Noted by Stanley Crouch, “Alkemade 1276 discusses the theoretical gain in signal strength of atomic fluorescence spectrometry compared to atomic emission spectrometry. The shapes of analytical curves using line and continuum sources for atomic fluorescence are also described.”
Single-atom detection (SAD) and limit in atomic spectrochemical analysis – (a) Alkemade, 1277 Appl. Spectrosc., 35 (1981) 1–14; (b) Hieftje, 1278 J. Chem. Educ., 59 (1982) 900–909; (c) Falk, 1279 J. Anal. At. Spectrom., 7 (1992) 255–260
All three articles1277–1279 were jointly recommended by Nicoló Omenetto and James Winefordner with comments: “The article by Alkemade 1277 is a paper not to be missed. This is the first time that a clear definition of ‘intrinsic’ versus ‘extrinsic’ noise is applied to the topic of detecting single atoms. If the noise of the overall procedure is intrinsic, i.e., it is due to the statistical fluctuations of the atoms appearing in the probe volume, it would be useless to engage in tireless efforts to reduce the noise due to background, spurious non-specific scattering, etc., i.e., to reduce the extrinsic noise. This is equivalent to saying that the theoretical ultimate limit has been reached and therefore it is unlikely that these methods will be extended to SAD in the future (see Hieftje 1278 ). Basic statistical expressions are easy to follow – in particular, the different expressions pertaining to the stationary and non-stationary cases, highlighting the importance of parameters like probing time, probing volume, and number of probings. Alkemade concludes his paper 1277 by saying that there is a long way to go before we will reach the SAD challenge, and that for the moment ‘we are just looking around the corner.’ The last quote has become an inspiring leit-motif in the research career of Winefordner and Omenetto.”
Nicoló Omenetto and James Winefordner continued, “The paper by Hieftje 1278 starts identifying the key goals of chemical analysis, namely sensitivity and selectivity, with the ideal (yet unrealistic) scheme that would involve quantitative decomposition of a sample into its constituent atoms, sorting by element and counting individually those atoms. How close to reality such goal can be made by the advent of novel analytical detection schemes, the use of laser sources and associated methodologies is then exhaustively and authoritatively described. From a comparison of the current status (at the time of publication) of the detection limits obtainable with plasma atomic emission, electrothermal atomic absorption, and atomic fluorescence, the reader learns three important messages: first, all methods fall short of SAD capability; second, some methods have already approached their theoretical limit (far from SAD); and third: the most promising approach is offered by laser-excited, saturated non-resonance atomic fluorescence. More importantly, future research avenues, new atomization methods (sputtering cells, atom-ion trapping arrangements, and laser-induced ablation) are advocated.”
Richard Russo also shared this article 1278 with a similar view and added, “The article by Hieftje 1278 presented a comprehensive overview of the underlying issues influencing the ability to achieve single atom detection (SAD) and how current optical sources approached this ideality. The use of a droplet generator (journal cover photo) was described as a unique approach to separate and study the sequence of events that occur to convert a liquid sample into free atoms or ions useful for SAD.”
Gary Hieftje recounted, “This paper 1278 was not intended as an authoritative review but as a ‘thought piece’ for those considering or engaged in the pursuit of methods for single-atom detection of real chemical samples. Further, it was written in an intentionally didactic style; hence its publication in a journal dedicated to Chemical Education. Its hypotheses and conclusions, valid at the time of publication, should continuously be re-examined in the face of ongoing developments in instrumentation and fundamental knowledge since that time. The cover photo was taken by Rick Russo and has probably appeared in more of my formal presentations than any other.”
For the article by Falk, 1279 Nicoló Omenetto and James Winefordner noted, “Laser excited atomic fluorescence with graphite furnace atomization has again been highlighted in this paper 1279 as one methodology capable of reaching single atom detection after optimized laser operation. Emphasis is given to optical trapping schemes, in which an atomic beam is first decelerated and then trapped in an ‘optical molasses’ region by three mutually perpendicular laser beams. The author 1279 also proposed a scheme in which a sample forms an atomic beam moving at a small angle from a counter-propagating cooling laser, with the result that analyte atoms are spatially separated from the matrix (therefore reducing matrix effects to a minimum). Further cooling and trapping by another laser is then followed by fluorescence detection. Not surprisingly, Cs atoms and diode lasers are considered. Finally, it is worth mentioning that atom-ion trapping arrangements were also proposed by Hieftje. 1278 ”
Understanding, control, and the future of plasma spectrochemical instrumentation – (a) Hieftje, 1280 Spectrochim. Acta Part A, 45 Supplement (1989) 113–128; (b) Hieftje, 1281 J. Anal. At. Spectrom., 11 (1996) 613–621
George Chan remarked, “In the first paper, 1280 Hieftje shared his view and philosophy on the importance of fundamental studies and understanding in analytical atomic spectrometry; his philosophy is likely extendable to other branches of analytical sciences. He stated the two-way symbiosis between the importance of fundamental understanding and effectiveness of functional control of analytical instrumentation with examples from the ICP and other atomic spectrometric sources. His approach was first defining an ideal device, instrument or technique, and then determining criteria by which existing systems fall short. The overview 1280 was a high-level one, yet there were lots of touching on topics like ambipolar diffusion, detector technology, sample introduction, desolvation, vaporization, excitation and ionization processes. He covered the ‘Seven Stages of an Analytical Method’, both the original Laitinen version, 1263 the version modified by Fassel as well as his own one. The five generations of instrumentation, an original concept by Wade and Crouch, 1282 was also mentioned. All these concepts and approaches are very useful in analyzing the next step of chemical instrumentation. The second paper 1281 was somewhat a continuation and used a similar approach as in the Spectrochimica Acta 50th anniversary paper 1280 to analyze the then-current (1996) status of plasma spectrochemical instrumentation, but the focus was shifted towards atomic mass spectrometry. The paper 1281 also contained a classical analysis on the limit of detection between atomic emission and mass spectrometries. The deduction was that the signal levels in terms of ion and photon counts from the analyte are similar for AES and MS, respectively, but there are orders of magnitude differences in background ion and photon count rates, which ultimately dictate the detection limits attainable by AES and MS. 1281 ”
Is it still possible, necessary, and beneficial to perform research in ICP–atomic emission spectrometry? – Mermet, 1283 J. Anal. At. Spectrom., 20 (2005) 11–16
As noted by George Chan, “In this paper, 1283 Mermet provided his view on future research in ICP–AES, in which an ‘arbitrary’ (in Mermet's own word) selection of items related to his background and experience was discussed. The stated remaining problems in ICP–AES to be solved and his check list are likely equally applicable to any other existing or emerging AES sources. He explained the ecology and interplay of a many-body (researchers, funding bodies, instrument manufacturers, and industry) problem. The importance of consulting literature in a close-by field was also emphasized as he gave a comment which concerns ICP–MS users that ‘They should read results obtained in ICP–AES and not rediscover the wheel when considering plasma characteristics and capabilities.’ 1283 ”
Role of lasers in analytical atomic spectroscopy – (a) Omenetto, 1284 J. Anal. At. Spectrom., 13 (1998) 385–399; (b) Winefordner, Gornushkin, Pappas, Matveev, and Smith, 1285 J. Anal. At. Spectrom., 15 (2000) 1161–1189
Elisabetta Tognoni suggested both papers1284,1285 and noted, “The paper by Winefordner et al. 1285 includes some tutorial sections. For readers interested in obtaining a schematic picture of the different ways lasers can help in detecting atoms or ions and for diagnostic purposes, the contents of page 2 give a brief summary of the principles and experimental configurations of the different approaches. Additionally, Tables 11 and 12 are useful to compare the characteristics offered by different techniques for trace analysis. The paper 1285 is very well organized and easy to navigate: from fundamental issues to applications, to comparison between techniques, and to indication of their inherent limits. The paper by Omenetto 1284 has a sharper focus on analytical problems where laser techniques perform their best – or even are the only choice: e.g., situations needing ultrahigh sensitivity, analytical measurements performed in situ and in real time, and remote sensing approaches. The paper by Omenetto 1284 is certainly very sophisticated, I would say philosophical, with its reasoning about what experimental choice makes sense in a given situation and what does not. It also delineates emerging trends and includes complaints about the scarce attention of the research community towards the unexplored potential of some techniques (see, for example, the discussion about fluorescence and ionization spectrometry and their potential for absolute analysis). At the same time, reading between the lines, one can clearly figure out the author 1284 fancying which kind of play may be next, playing with atoms and one, two, maybe three lasers. I believe this approach to be inspiring for young researchers.”
The article by Omenetto 1284 was also recommended by Zhanxia Zhang.
Comparing several atomic spectrometric methods: Is LIBS a future super star? – Winefordner, Gornushkin, Correll, Gibb, Smith, and Omenetto, 939 J. Anal. At. Spectrom., 19 (2004) 1061–1083
This viewpoint article is popular and recommended by many scientists, including Michael Blades, Mikhail Bolshov, José Costa-Fernández, Vincenzo Palleschi, Martín Resano, Steven Ray, Richard Russo, and Zhanxia Zhang.
Michael Blades noted that “it is a spectacular paper 939 that puts the entire field in perspective.” Steven Ray summarized this key paper as: “An excellent treatment that puts LIBS in its place among the other atomic analytical methods. While informational, the paper 939 also provides an excellent philosophical discussion of the basis by which some methods seem to remain popular, while others are left to the side over time. Prescient identification of LIBS as an emerging technique of the future. Also provides a critical consideration of the potential for routine single-atom detection.”
José Costa-Fernández added, “I already recommended this review article 939 to my students in the ‘Advanced Spectroscopic Detection Methods’ subject of our Master Degree in Analytical Chemistry program, as it provides an excellent overview of the capabilities of different conventional analytical atomic spectrometry tools. Also, it puts into context other less routinely used atomic methods (e.g., glow discharge spectrometric methods or laser-based analytical methods). In addition, it helps me to introduce the current status and the potential of LIBS methodologies.”
As remarked by Mikhail Bolshov, “This review 939 presents a personal viewpoint of the authors on different spectroscopic analytical techniques. Three techniques – electrothermal atomization–atomic absorption spectrometry, inductively coupled plasma–atomic emission spectrometry, and inductively coupled plasma–mass spectrometry – are named as the ‘super star’ techniques. The authors present an analysis of the capabilities, instrumentation, number of publications, and other attributes to prove their selection. Compared with these three ‘super stars’, other techniques like laser induced fluorescence and ionization, microwave plasma emission and mass spectrometry, and glow discharge emission are named as the ‘lesser’ techniques. The authors gauge the future of LIBS and believe that this technique could become the new ‘super star’. Current status and future developments are reviewed. To my mind, the capabilities of LIBS are to some extent overestimated. The simplicity of the technique (just hit a sample and measure the emission) screens its poor metrology. Too many factors in the non-steady-state plasma affect the emission intensity of an analyte and compromise the results of the analysis. Great advantage of the technique is the possibility to design relatively compact instruments for on-site analysis. However, currently in most cases, the analysis is semi-quantitative, rather than quantitative. Anyway, LIBS is now widely used for the analysis of solid and liquid samples of different kinds.”
As narrated by Richard Russo, “Excellent overview 939 of the importance and capabilities of analytical atomic spectrometry technologies. The emerging LIBS technology is compared to three established super-star analytical atomic spectrometry technologies (electrothermal–AAS, ICP–AES, and ICP–MS). The work 939 describes the analytical features of a super-star technology, why lesser methods do not achieve such status based on the ‘Seven Ages of an Analytical Method’ by H.A. Laitinen 1263 and what it takes for LIBS to attain super-star status.”
Somewhat similar comments were shared by Zhanxia Zhang, who stated, “This paper gives a clear and concise review of the current status and future development of LIBS. 939 Although electrothermal–AAS, ICP–AES, and ICP–MS are considered to be the super stars of analytical atomic spectrometry now and in the future, well-developed LIBS will probably emerge to be another super star.”
Furthermore, as commented by Vincenzo Palleschi, “This paper 939 is often quoted in the LIBS community to signify the great (although future) perspectives of the technique. However, Nicoló Omenetto has recently disclosed a funny anecdote about the proof editor of Journal of Analytical Atomic Spectrometry dropping by accident the question mark at the end of the title of the paper (LIBS, a future super star?). In fact, the intended title would have better reflected the (more than justified, at that time) caution of the authors about the future of the LIBS technique which seems to be, after 20 years from the publication of that paper, still in the future.”
Metallomics – Haraguchi, 1286 J. Anal. At. Spectrom., 19 (2004) 5–14
According to Steven Ray, “The emergence of metallomics is of critical importance to the field of atomic spectrometry. The foundation of metallomics as an integrated biometal science at the interface between biology and atomic spectrometry is introduced by Haraguchi, 1286 while the modern analytical strategies and methodologies are presented fully formed in another article. 1287 The recognition of metallomics as a distinct area of chemical research is a watershed moment for three reasons. First, metallomics is introduced here as an important subdiscipline of biochemistry dedicated to the study of the function and activity of metal and metalloid elements, often found at trace and ultra-trace concentrations in biological systems. It is often estimated that metals play a vital role in the function of 30–40% of all proteins and enzymes across all of the biological kingdoms where they fulfill specific chemical functions as electron donors or acceptors, Lewis acids, redox regulators, and structural templates and controls. Due to the complexity of these biochemical interactions, the field of metallomics is introduced as an inherently multidisciplinary area of study, but one that relies heavily upon atomic spectrometry measurements. It is also noteworthy that metallomics is often envisioned as a holistic approach to biological systems analysis. Indeed, the entirety of the bioactive trace-metal and metalloid composition of the cell has come to be known as the cell's metallome, which is in dynamic equilibrium with the cell's proteome, metabolome, genome, and other biological functionalities. The recognition of the interplay of many different metals performing a variety of biological functions within the system of a cell or biosystem is a critical aspect of understanding metallomics studies.
“Second, these publications1286,1287 emphasize that metallomics research requires chemical measurements made by advanced analytical atomic spectrometry techniques. This does not mean that atomic analyses are the only nor most important aspect of metallomics studies, but rather that atomic spectrometry measurements form one of the foundational forms of the chemical information required to understand biological systems. In particular, the ability of atomic spectrometry to provide quantitative elemental speciation information is a critical data component that must be considered in symphony with other chemical measurements, such as molecular mass spectrometry or optical spectroscopies, in order to achieve a deeper understanding of biological behaviors. The aspirations and emerging measurement needs of this area of research are also significant. Understanding increasingly sophisticated biometal functionality within some systems is likely to require multielemental speciation with exquisite spatial and temporal resolution. Thus, in some ways these publications1286,1287 provide a roadmap for further development of atomic spectrometry.
“Finally, the conceptualization of metallomics as a field of exploratory research has, in some ways, led to a paradigm shift in thinking about metal-related biological chemistries. The label of essential, benign, or toxic was assigned to a particular list of elements based upon major, accepted roles within cells. Metallomics has shown that these labels should be understood to rely on both the concentration and chemical form of the element, as well as the biological system. Moreover, the field of metallomics has extended the list of elements that are known to be biologically relevant, and suggested that even those elements thought to be more or less inert in the biological sense find function in certain situations. This concept is furthered to the extreme in the ‘Extended All-Present Theory of Elements’, which holds that, given the correct circumstances, all elements will be found within biological systems.”
Reminiscences and Tributes
Alan Walsh – Alkemade, 1288 Spectrochim. Acta Part B, 35 (1980) 671–676
As suggested by Stanley Crouch, “Alkemade 1288 reminisces and commemorates the publication of Walsh's classic paper on atomic absorption spectrometry in 1955. He comments about the nearly simultaneous publication of a double-beam instrument for spectral selection by Alkemade and Milatz.”
Cornelis (Kees) Alkemade – (a) Alkemade, 1289 Spectrochim. Acta Part B, 43 (1988) 995–1005; (b) Winefordner and Omenetto, 1290 Spectrochim. Acta Part B, 43 (1988) 1017–1019; (c) Willis, 326 Spectrochim. Acta Part B, 43 (1988) 1021–1028
Stanley Crouch commented, “Alkemade's thesis influenced scientists in flame emission spectrometry for several decades. Alkemade 1289 writes a farewell paper describing his many years as a physics professor at the Rijksuniversiteit, Utrecht, Netherlands. He describes his work in fluctuation phenomena, metal vapors in gases and atomic beams, and in analytical flame spectroscopy. Winefordner and Omenetto 1290 discuss Alkemade's impact on the introduction of atomic fluorescence spectrometry for spectrochemical analysis. His contributions to the use of signal-to-noise ratio theory and to calculations of detection limits are also discussed. In this paper, 326 Willis discusses the influential, though not widely disseminated, PhD thesis of Kees Alkemade ‘A contribution to the development and understanding of flame photometry’. 35 ”
Howard Malmstadt – (a) Crouch, Enke, Walters, and Hieftje, 1291 Appl. Spectrosc., 58 (2004) 165A–172A; (b) Winefordner, 1292 Spectrochim. Acta Part B, 61 (2006) 599; (c) Walters, 1293 Spectrochim. Acta Part B, 61 (2006) 600–601; (d) Horlick, 1294 Spectrochim. Acta Part B, 61 (2006) 602–618
This set of papers documents the remembrance of late Howard Malmstadt by his students and colleagues. As noted by Stanley Crouch, “These papers1291–1294 are tributes to one of the giants in spectrochemical analysis, Howard Malmstadt, who passed away in 2003. Malmstadt's career as a scientist, mentor, teacher, author, and missionary are discussed along with his scientific legacy. Several personal anecdotes and observations are given in these tributes.”
Gary Hieftje added, “The effectiveness of an academic scientist can be gauged by several potential measures, including numbers of publications and invited presentations, grant support, service on editorial boards, and success of students and colleagues who benefitted from mentorship of the scientist. Of these measures, I view the last as being the most important. It is also the reason Howard Malmstadt was so revered by his former group members, as indicated by several of those people in the cited pages.1291–1294”
Glossary
atomic absorption spectrometry
alternating current
ambient desorption ionization–mass spectrometry
analog-to-digital units
atomic fluorescence spectrometry
atmospheric-pressure glow discharge
background-equivalent concentration
charge-coupled device
charge-injection device
complementary metal–oxide semiconductor
continuum source
charge transfer
chemical vapor generation
Cytometry by Time-of-Flight™ mass spectrometry
Direct Analysis in Real Time®
dielectric barrier discharge
direct current
diode laser atomic absorption spectrometry
Dynamic Reaction Cell (trademark)
electrochemical hydride generation
easily ionizable element
electrolyte-cathode discharge
electrothermal atomizer
electrothermal vaporization
furnace atomic non-thermal excitation spectrometry
flowing atmospheric-pressure afterglow
full gravimetric isotope mixture
Fourier transform
Fourier transform-ion cyclotron resonance
Fourier transform spectrometry
gas chromatography
glow discharge
glow discharge–mass spectrometry
glow discharge–optical emission spectrometry
graphite furnace
hollow-cathode lamp
intensified charge-coupled device
inductively coupled plasma
inductively coupled plasma–atomic emission spectrometry
inductively coupled plasma–mass spectrometry
ion cyclotron resonance
infrared
International Union of Pure and Applied Chemistry
laser ablation
laser ablation molecular isotopic spectrometry
laser-enhanced ionization
laser-induced breakdown spectroscopy
laser-induced fluorescence
laser-induced fluorescence in graphite furnaces
limit of detection
limit of quantitation
liquid sampling–atmospheric-pressure glow discharge
local thermodynamic equilibrium
multi-collector
monodisperse dried microparticulate injector
mass-independent isotopic fractionation
microwave-induced plasma
mass spectrometry
mass-to-charge ratio
National Bureau of Standards (later renamed NIST)
neodymium-doped yttrium aluminum garnet
non-dispersive atomic fluorescence spectrometry
noise-immune cavity-enhanced analytical atomic spectrometry
National Institute of Standards and Technology (formerly NBS)
nuclear magnetic resonance
optical emission spectrometry
photodiode array
photomultiplier tube
photochemical vapor generation
quartz tube atomizer
research and development
radiofrequency
resonance ionization mass spectrometry
resonance ionization spectroscopy
parts-per-billion
parts-per-million
parts-per-trillion
relative standard deviation
relative standard deviation of the background
signal-to-noise ratio
single atom detection
signal-to-background ratio
solution-cathode glow discharge
standard reference material
single particle-inductively coupled plasma
tunable diode laser absorption spectrometry
tetrahydridoborate(1−), [BH4]−
thermal ionization mass spectrometry
transverse electric (resonant cavity mode)
transverse magnetic (resonant cavity mode)
time-of-flight mass spectrometry
ultraviolet