
Abstract
The use of Raman spectroscopy has rapidly been on the rise across a great number of industries where comparability, reproducibility, and reliability of the data are of paramount importance. However, controlling the intensity of the Raman signal depends on a large number of factors such as the wavelength of the laser light, the optical components of each device, or the number of molecules in the illuminated volume. For this reason, in this study, a new protocol has been applied to twin Raman devices to achieve a conversion of the signal between them, by pairing the intensity response of the units using a reference sample. The new reference material is a homogenous dispersion of a 0.5 wt% anatase (titanium dioxide, or TiO2) in an epoxy resin matrix, with deviations <2.5% in Raman intensity across the reference material. The proposed protocol for Raman-twinned devices takes a well-defined approach that leads to obtaining a correction factor that relates the differences in the signal intensity between the two Raman devices, in order to obtain the same Raman intensity counts. The performance of the proposed method was evaluated based on the data from the devices, which presented the most common user cases: twinning Raman devices of the non-confocal same model for two different wavelengths; and twinning confocal and non-confocal devices. The results obtained show that the protocol has worked for both of the Raman twinning cases, allowing the Raman intensity harmonization of Raman spectra between two different devices.
This is a visual representation of the abstract.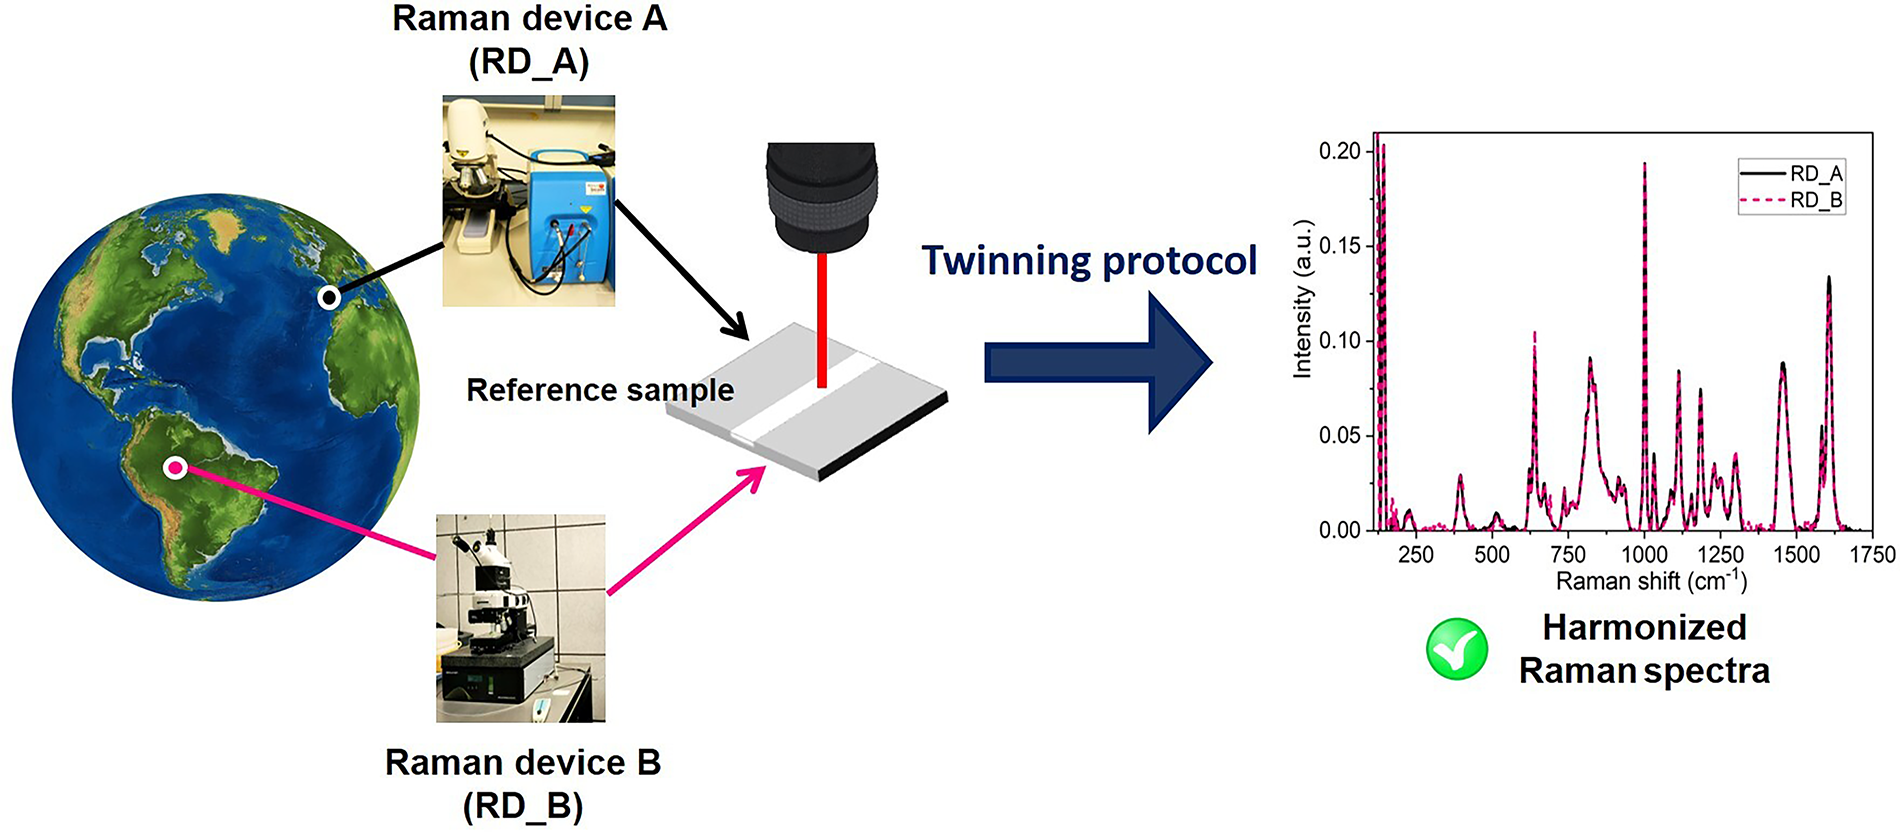
Keywords
Introduction
Raman spectroscopy is widely used in various industrial applications since it is a relatively easy-to-implement technique. The technique offers a rapid characterization of advanced materials, from the design and manufacturing of these materials to verification of their performance and validation of the end-of-life and recycling steps.1,2 The rapid growth of this technique is showing the need for greater harmonization and interoperability among data generated from a variety of different instruments, 3 ranging from affordable portable devices to sophisticated high-resolution devices.4,5 The choice of the device is often influenced by the application, specifications on the analysis, environment, budget, etc.
It is critical, before running any quantification procedure, that the devices are correctly calibrated in both intensity and Raman-shift axis. 6 At present, there are different procedures and protocols that can be used to perform these calibrations. 7 To verify the calibration of the x-axis, the ASTM E1840 standard 8 defines a series of Raman shift values for a limited number of materials. To proceed with this calibration, the alignment of the Raman spectra is generally carried out after their acquisition, correcting the x-axis to compensate for the different changes produced due to different variations of the laser wavelength, changes due to temperature, nonlinear instabilities, and distortions. Primarily, for Raman shift verification, this standard suggests covering a spectral range of 85–3327 cm−1 using eight different liquid and solid materials such as polystyrene (PS). Additionally, in order to complete the x-axis calibrations, the use of arc lamp emission lines (such as Ar, Ne, and Hg) is required, as described in ASTM E2529. 9 Other protocols have been proposed for the calibration of the x-axis of the Raman devices.10–12
When it comes to the intensity of the signal, the ASTM E2911 standard includes the correction of the relative intensity of Raman devices using or a calibrated irradiance source 13 or a Standard for Raman spectroscopy reference materials.14,15 The National Institute of Standards and Technology (NIST) provides Standard Reference Materials (SRMs) 224x (2241, 2242, 2243, 2244, 2245, and 2246). The literature also describes how to correct the Raman intensity using reference samples such as Teflon, 16 diamond, 17 or sapphire. 18 Relative Raman intensity calibration systems allow, through luminescence spectra, to correct differences in relative maximum intensity that vary because each Raman unit has its unique spectral characteristics based on the response of the sensor to the spectral range in use. 7
Regarding the radiation sources as intensity calibration methods, the spectra of white lights (mainly tungsten) are measured, producing a correction curve that is used to correct the variation in the response of the instrument at different wavelengths. One of the problems with this calibration method is that said light needs to be recalibrated from time to time and it also has a limited lifetime. On the other hand, reference materials consist of optical glasses doped with different elements according to each wavelength. However, in the case of having more than one excitation laser in the same Raman device, more than one SRM would also be required. This adds a problem to this type of reference material, since it considerably increases the economic value used for the calibration of a Raman device. It also must be considered that these materials (glass) are highly fragile, which requires special attention when handling them. There are also other problems, such as with the 2242a sample, 19 which is susceptible to corrosion when exposed to high relative humidity, causing these glasses to deteriorate. Additionally, glass-type materials have very different refraction indexes than other materials, i.e., nanomaterials, which produce a scattering effect and even resonance of the incident laser that significantly modifies the signal intensities collected by the device.
In addition to the calibration, proper interoperability of the data obtained from different Raman devices can be only carried out from harmonized spectra. Raman spectra harmonization is about ensuring that data collected from different instruments are comparable and can be combined or analyzed together without the problems caused by equipment differences, obtaining comparable intensities. Thus, the harmonization protocols facilitate the interpretation of the results and improve the reliability and validity of the analysis performed with the spectral data. However, despite being able to have Raman units already calibrated with the same calibration protocols, Raman spectra obtained with different instruments generally can show significant variations in the Raman intensities measured from the same sample or specific material. This is because Raman intensity is also influenced by numerous factors such as the quantum efficiency of the detector, laser amplitude and mode, grating efficiency, and the reflection and transmission efficiencies of optical components such as objectives, gratings, mirrors, and optics,20–22 which affects the arbitrary intensity counts given by each Raman instrument.
In addition to the influence that instrumental factors have on the intensity, the Raman cross-section of the measured material is another variable to take into account in the Raman intensity. The Raman cross-section is defined by the intrinsic Raman emission intensity of a chemical substance of a material. 23 It corresponds to the quantification of the probability of an inelastic Raman scattering event occurring, that in the case of the Raman cross-section of a specific Raman shift, it would be the probability that an incident excitation photon will scatter as a Raman shifted photon. 24 Extrinsic factors such as particle size, surface roughness, crystal stress, and purity can modulate the intrinsic Raman cross-section of a solid material, adding uncertainty to its determination. Besides, the Raman cross-section depends also on several factors such as laser wavelength, observation angle, and polarization-sensitive components in the equipment or optical geometry, making empirical determination challenging for each material.25,26 Therefore, obtaining a numerical value of the cross-section must usually be carried out empirically. In fact, there are currently some studies that calculate the cross-section of gases or liquids,27–29 but there are practically no studies that provide this value for solid materials. The most common practical method to calculate it is actually by comparing the Raman spectrum of the material with the Raman spectrum of a material with a known Raman cross-section, such as the benzene 27 or the cyclohexane 30 used as reference material. However, there are some technical problems such as the value of the used reference material can change after dilution causing them to vary. Therefore, since the complexity in Raman cross-section determination, there is also a certain disparity between the values for the same reference material. For this reason, no progress has been made in the harmonization of Raman spectra considering this parameter.
Unlike the calibration protocols, the intensity harmonization among different Raman devices in terms of comparability, reproducibility, and reliability of the data is an aspect not sufficiently explored neither theoretically nor experimentally, due to the great difficulty involved in controlling all the variables and factors dependent on the Raman intensity. Above all, being able to compare and obtain absolute intensities in different Raman devices is an unresolved issue to date. Some authors have studied how the intensity varies in a measurement due to some elements or properties in a Raman instrument such as the slit width, 31 pinholes, 32 or spot size, 33 however, no works are found in the literature that encompass all the changes that can simultaneously exist between two different devices whilst maintaining similar Raman intensity values. For this reason, in this work, a new practical and simple experimental method is proposed for the first time, which allows us to globally consider almost all of the variables that influence the Raman intensity between two devices by determining a single experimental constant. To afford this, two controlled variables are used: on the one hand, employ a homogeneous and reproducible reference sample that ensures a unique and consistent Raman cross-section, and on the other hand, considering the linearity that exists between the laser power with the Raman intensity of the proposed reference material.
Therefore, the objective of this work is to define a new concept related to the twinning of Raman devices which mainly consists of finding the experimental variables and algorithms that correlate two different instruments. The twinned devices are going to have the same intensity counts. Thus, it is possible to harmonize their Raman spectra in terms of Raman intensity, without the need to calculate all the parameters that influence it. To achieve this, a new reference sample of composite material of epoxy with anatase titanium dioxide (TiO2) was designed. This new reference sample is homogenous and stable over time, and thus, provides the same response to laser excitation at different areas of the sample. The new twinning protocol between similar or different Raman model devices allows the harmonization of Raman spectra and increases the interoperability between different instruments, applications, and industries.
Experimental
Materials and Methods
A reference sample was manufactured with a composite material of epoxy and 0.5% by weight of anatase TiO2 particles (EP + 0.5 wt% TiO2) in order to use it to twin different Raman devices. In addition, the composite material was deposited on a transparent PS support (Resopal) to produce a flat-parallel sample with controlled thickness because PS is a common material that also allows the calibration of the Raman shift. 34 In order to manufacture the reference sample, the first step was to mechanize a track with a width of 4 mm and a thickness of 0.4 mm along a PS support (20 × 20 × 4 mm), using a V30 computer numerical control (CNC) milling machine with a three-lip end (Leadwell) with the purpose to then incorporate the composite material.
For the composite material, TiO2 particles with an average particle size of D50 = 312 ± 62 nm (Precheza a.s.) were dispersed in a two-component epoxy resin with ultraviolet (UV) filter Translux D 150 (EP) in a liquid state (Feroca) with a resin : catalyst ratio of 2 : 1 by mass. The particles used were pre-dried prior to the mixing process for 24 h at 80 °C in order to eliminate the possible moisture contained. To obtain a homogeneous composite, a material mixing process was followed and consisted of three different steps. First, the epoxy resin and the TiO2 particles were stirred in a Lleal Dissolver SL-1 high-speed stirrer (Lleal S.A.U.) using a stainless-steel vessel for 2 min at 2700 rpm. The second step consisted of mixing the resin/TiO2 suspension in a high shear Ika Ultra Turrax digital T 25 (IKA-Werke) at 18 000 rpm for 2 min. Finally, the homogenization of the mixture was completed in an Exakt 50I tri-cylinder roller (Exaktusa), where the liquid composite was processed twice through the three rollers spaced 0.5 mm apart. Once the homogeneous material was obtained, it was cast in the mechanized track on the PS support and then it was cured at 40 °C for 48 h.
Next, the excess composite material was removed from the surface of the PS to regain the initial thickness of the mechanized track. For this purpose, the CNC milling machine (Leadwell) was used. In order to prevent the workpiece from heating up, a water-based lubricant was used as a coolant during the grinding process. Finally, the reference sample was polished in a Vibromet 2 automatic polishing machine (Buehler) in order to obtain an optically polished surface.
The homogeneity of the reference composite sample was characterized with a non-confocal B&W Tek iRaman device (B&W Tek) with a microscope with a 20× objective, using a 785 nm laser. In this case, 50-point Raman spectra acquisitions were performed spaced randomly throughout the entire sample using a laser power of 290 mW and an integration time of 6 s. The Raman measured zone for each point (≈8171 µm2) was calculated as the area illuminated by the laser in the sample having a diameter of ∼102 µm.
Procedure for Twinning Raman Devices
Raman measurements of the reference sample were carried out with two different Raman devices. In this work, two different types of Raman intensity twinning were performed: between Raman devices of the same model and between devices of different models, specifically within confocal and non-confocal devices. In addition, this protocol has been applied between Raman devices with the same wavelengths of the lasers in each twinning since the excitation wavelength can considerably modify the Raman spectra of a material. In each Raman twinning protocol, one of the Raman devices will be defined as the reference device and the other will be the device to be twinned. On the other hand, it should be mentioned that in this work, the effects of polarization have not been considered.
For the same model twinning, two B&W Tek iRaman portable devices with the same specifications have been used. The reference Raman device was labeled as RD_A and the device was to be twinned as RD_B. Raman measurements were obtained in both devices with a fiber optic probe and the twinning was carried out for two excitation lasers, 785 and 532 nm. For each Raman device and for each used laser power, average Raman spectra were obtained from 10 single-point measurements in different random regions of the reference sample, each Raman measurement being the result of five accumulations. The same integration time was employed for both Raman devices (RD_A and RD_B), being 6 s and 10 s for 785 nm and 532 nm laser excitations, respectively.
In addition, twinning was also carried out between two totally different Raman devices with different components and concepts of optical resolution and data acquisition. For that, the B&W Tek (RD_A_532) main Raman device was twinned with a high-resolution confocal Raman WITec (Germany) Alpha-300 R equipment (labeled as RD_C_532) using a fiber collection of 50 μm diameter. The main differences between these two devices were that the B&W Tek was a non-confocal portable device, which allows only specific measurements and presents a spectral resolution of 3 cm−1, meanwhile, the WITec Raman device was a high-resolution confocal Raman device, with the capability to generate Raman maps from individual spectra and with a much higher spectral resolution (0.05 cm−1) than B&W Tek devices. In this case study, Raman measurements were performed with the 532 nm laser excitation and with the 20× objective. As they are completely different Raman devices, the Raman measurements were also adapted to the characteristics of each device. For Raman measurements for the B&W Tek device, 10 single-point Raman spectra were taken for the entire sample, while in the WITec Raman device, the average Raman spectrum was obtained after performing three different Raman mappings of 90 × 90 µm and 45 × 45 pixels of the reference sample. In order to have similar measurement areas on both devices, the WITec mapping area (≈8100 µm2) was selected taking into account the illuminated area of the B&W Tek laser (≈8171 µm2). Finally, the integration times necessary for the measurements were different, using 10 s for the B&W Tek and 0.2 s for the WITec.
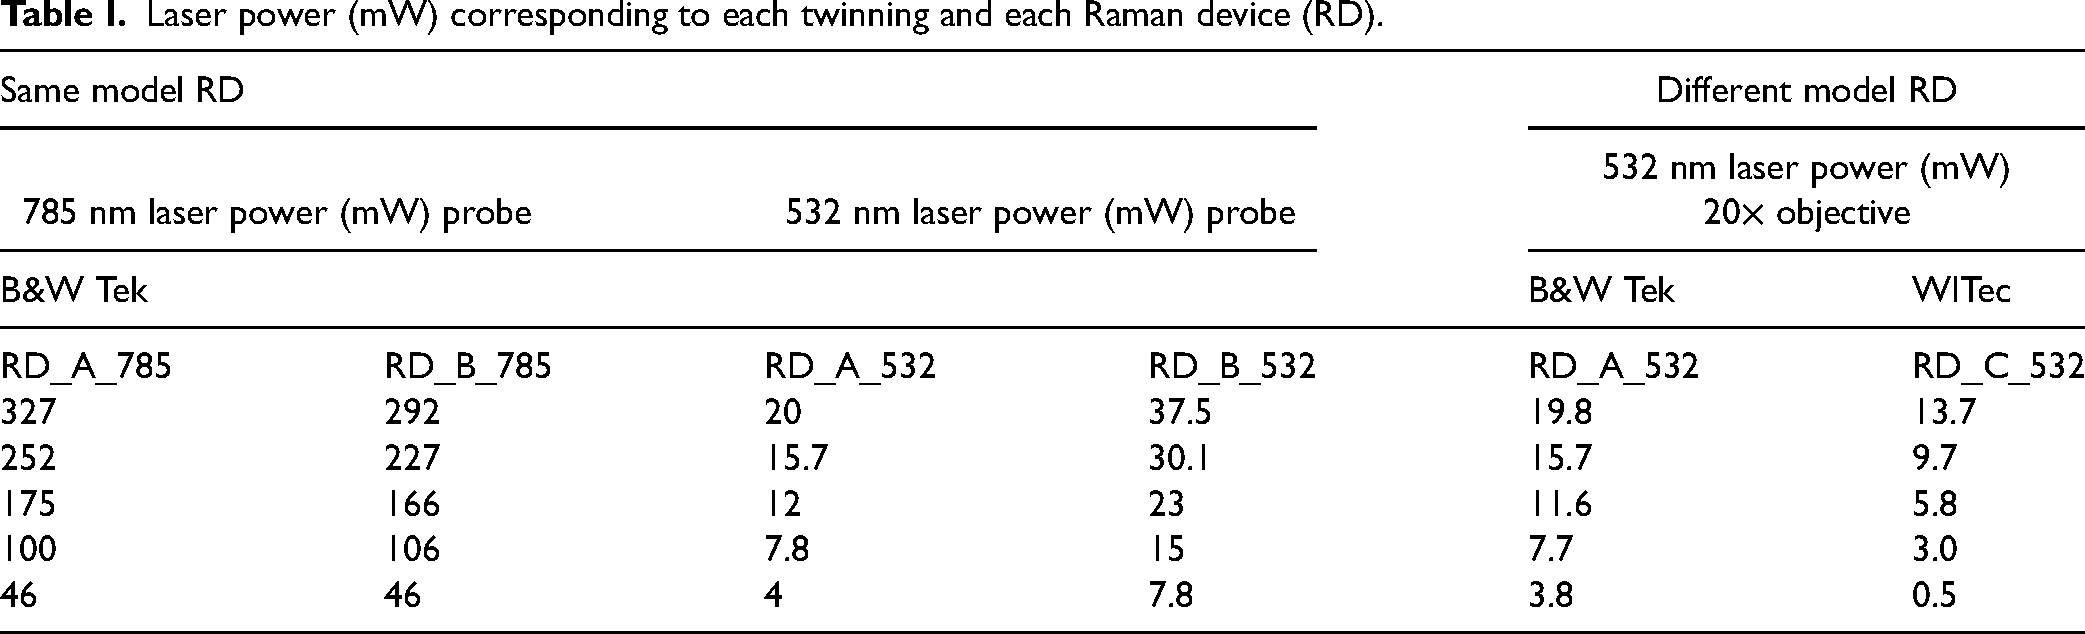
In all cases, Raman spectra acquisitions of the reference sample were performed at five different laser powers, which were selected in each Raman device by using a Thorlabs power meter PM100D (Table I).
Laser power (mW) corresponding to each twinning and each Raman device (RD).
Relative intensity corrections of all Raman spectra obtained for each Raman device have been performed within the twinning protocol. For the Raman twinning carried out between Raman devices with an excitation of 785 nm, a white-light calibration lamp near-infrared (NIR) light was used, while for the excitation of 532 nm, a visible light-emitting diode (LED) was employed. Both LED lamps used were developed by ELODIZ Ltd. The relative intensity correction procedure with the different equations and graphs can be found in the LED Relative Raman Intensity Correction section below, for both laser excitations.
Results and Discussion
Study of Homogeneity
In order to have a reference sample for Raman twinning devices in intensity harmonized, a solid homogeneous and reproducible sample must be achieved. The design of the reference sample must allow a composite material where the TiO2 is well dispersed in the epoxy matrix (obtaining the same Raman spectra at all points of the sample), which means the same Raman peaks in both Raman shift and Raman intensities when measured in different regions of the sample. The selection of TiO2 anatase as an inorganic particle for the reference sample has been made due to different advantages. First, TiO2 has been selected because it has been already suggested as a good reference material due to the excellent properties of the materials for its large Raman scattering cross-section (to reach high signal-to-noise ratios, well-defined and distinguishable Raman peaks, and low absorbance at the excitation wavelength that avoid heating mechanisms) outside others specific for temperature.35,36 This high-intensity Raman signal is also useful for quantification of TiO2 polymorphs by using Raman spectroscopy. 37 On the other hand, TiO2 anatase particles are common pigment-grade materials and commercially available in sizes ranging from 200 to 300 nm that ensure adequate dispersion, high crystallinity, and stoichiometry with low anharmonicity. Finally, TiO2 is a very stable material, meaning that it does not degrade in the presence of some chemical substances. The only drawback is its potential photocatalytic behavior under UV excitation is reduced in the selected particle size range. In addition, it should be noted that since the new reference sample is a solid composite it is adequately managed and used for device operability.
The amount of TiO2 embedded in the epoxy matrix for the reference material was chosen to ensure obtaining a homogeneous material with a clearly distinguishable anatase Raman signal. A scheme can be seen that shows how to measure normal to the surface of the developed reference sample (Figure 1a). The reference sample shown also in the photograph in Figure 1a comprises a white area that corresponds to the epoxy–TiO2 composite material, and a transparent area (gray in the diagram) that corresponds to the PS support, where the composite material is embedded. Figure 1b shows an average raw Raman spectrum obtained with the composite material, where after a single point measurement, the main Raman bands of TiO2 (marked in red), the epoxy (EP) Raman bands (marked in green), and the PS Raman bands (marked in blue) can be observed.
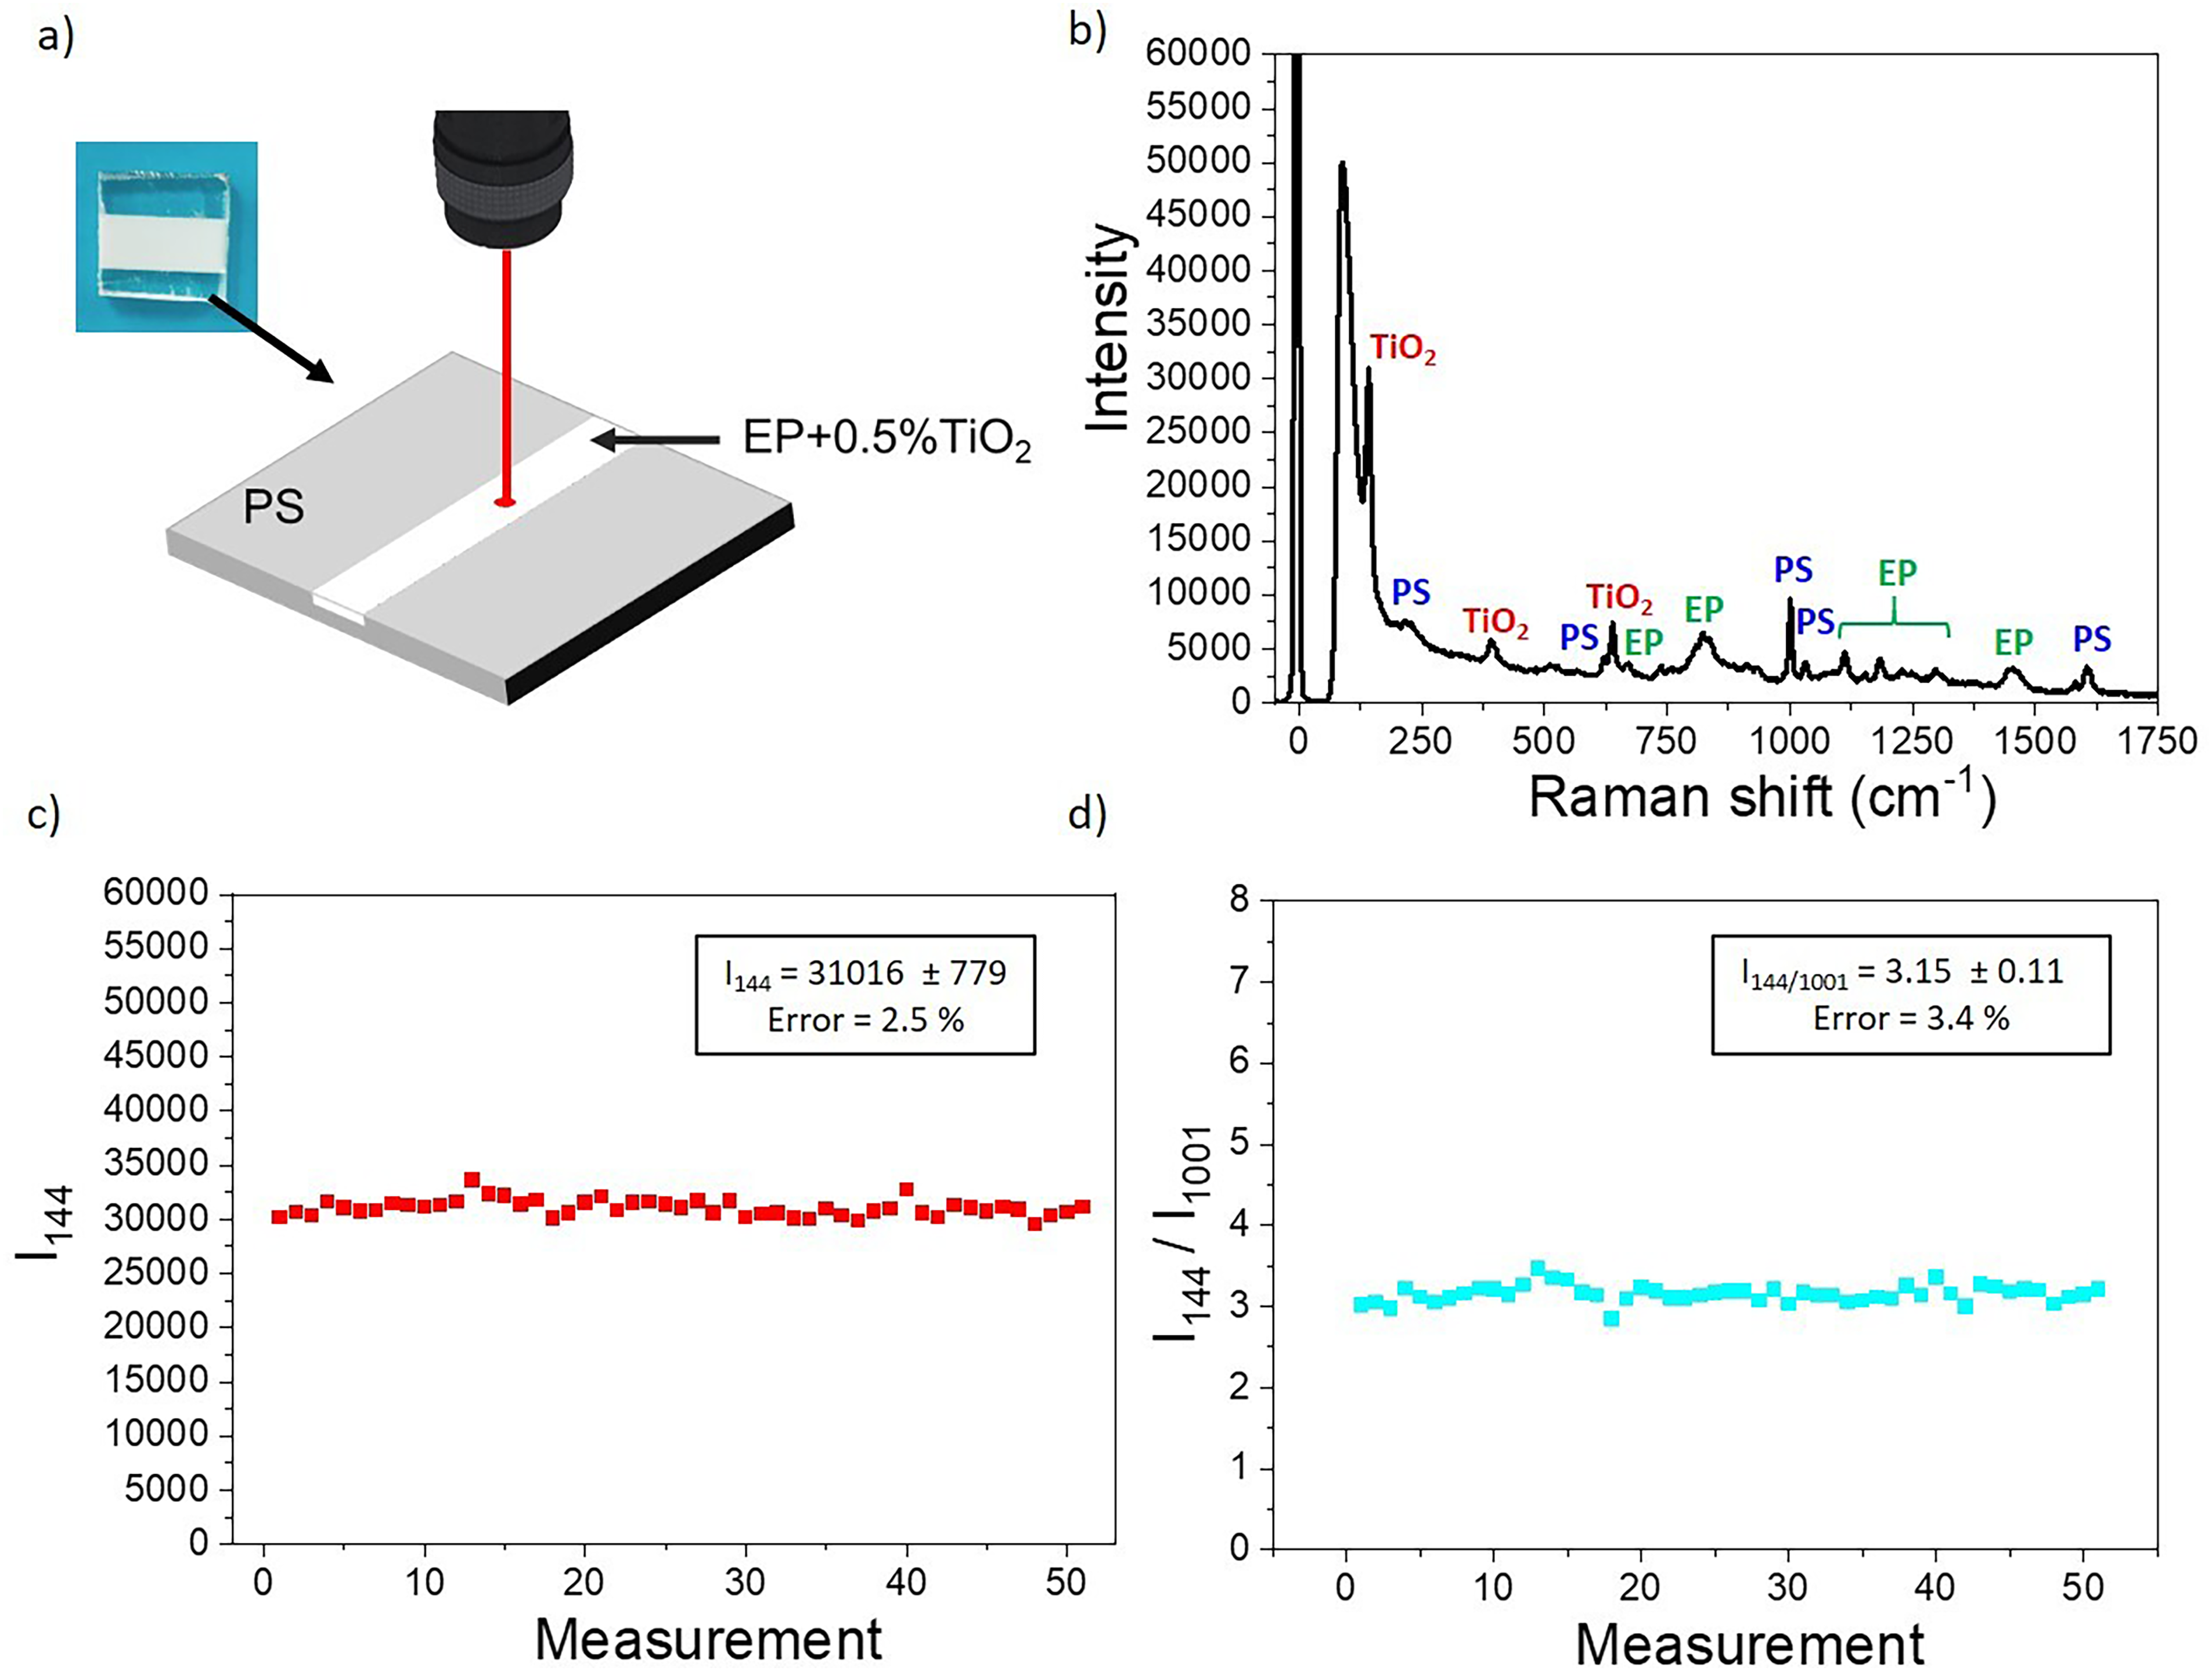
(a) Photographic image (on a blue background) of the reference sample and scheme of the Raman measurements, (b) average Raman spectrum of PS + EP + 0.5% TiO2, (c) maximum Raman intensity of TiO2 (I144), and (d) ratio of Raman intensities for TiO2/PS main Raman bands (I144/I1001) of single-point measurements using a 785 nm laser, 290 mW, 6 s, and a 20× objective.
In order to study the homogeneity of the Raman intensity at different points of the reference material surface, 50 different single-point measurements have been made with the RD_A_785 Raman device throughout the composite material. Figure 1c shows the quantification of the maximum Raman intensity of the main TiO2 Raman band (I144) in each of the 50 Raman measurements performed. These results were calculated from the raw data without modification. In this case, it can be observed that the Raman intensities in all the measurements are very similar, obtaining a standard deviation of ±2.5% in Raman intensities. Therefore, a good dispersion of the particles in the epoxy matrix is confirmed. In addition, the ratio of intensities of the main Raman band of TiO2 (I144) and the main Raman band of PS (I1001) along the composite line of the reference sample has been calculated, as can be seen in Figure 1d. In this case, the homogeneity of the TiO2 and the thickness of the mechanized track can also be verified, since there are not too many variations, obtaining a standard deviation of ±3.4%, in the ratio of Raman intensities for these two Raman bands.
LED Relative Raman Intensity Correction
In order to be able to correct the relative intensity in this twinning protocol of both laser excitations used, Eq. 1 was used for all Raman spectra and all Raman devices.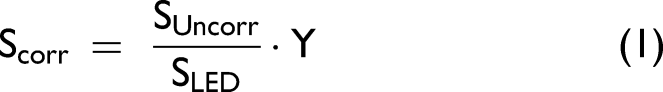
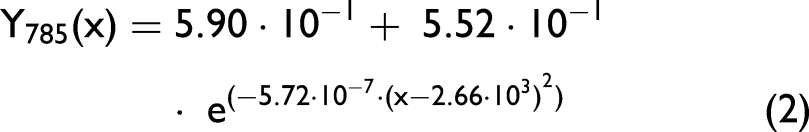

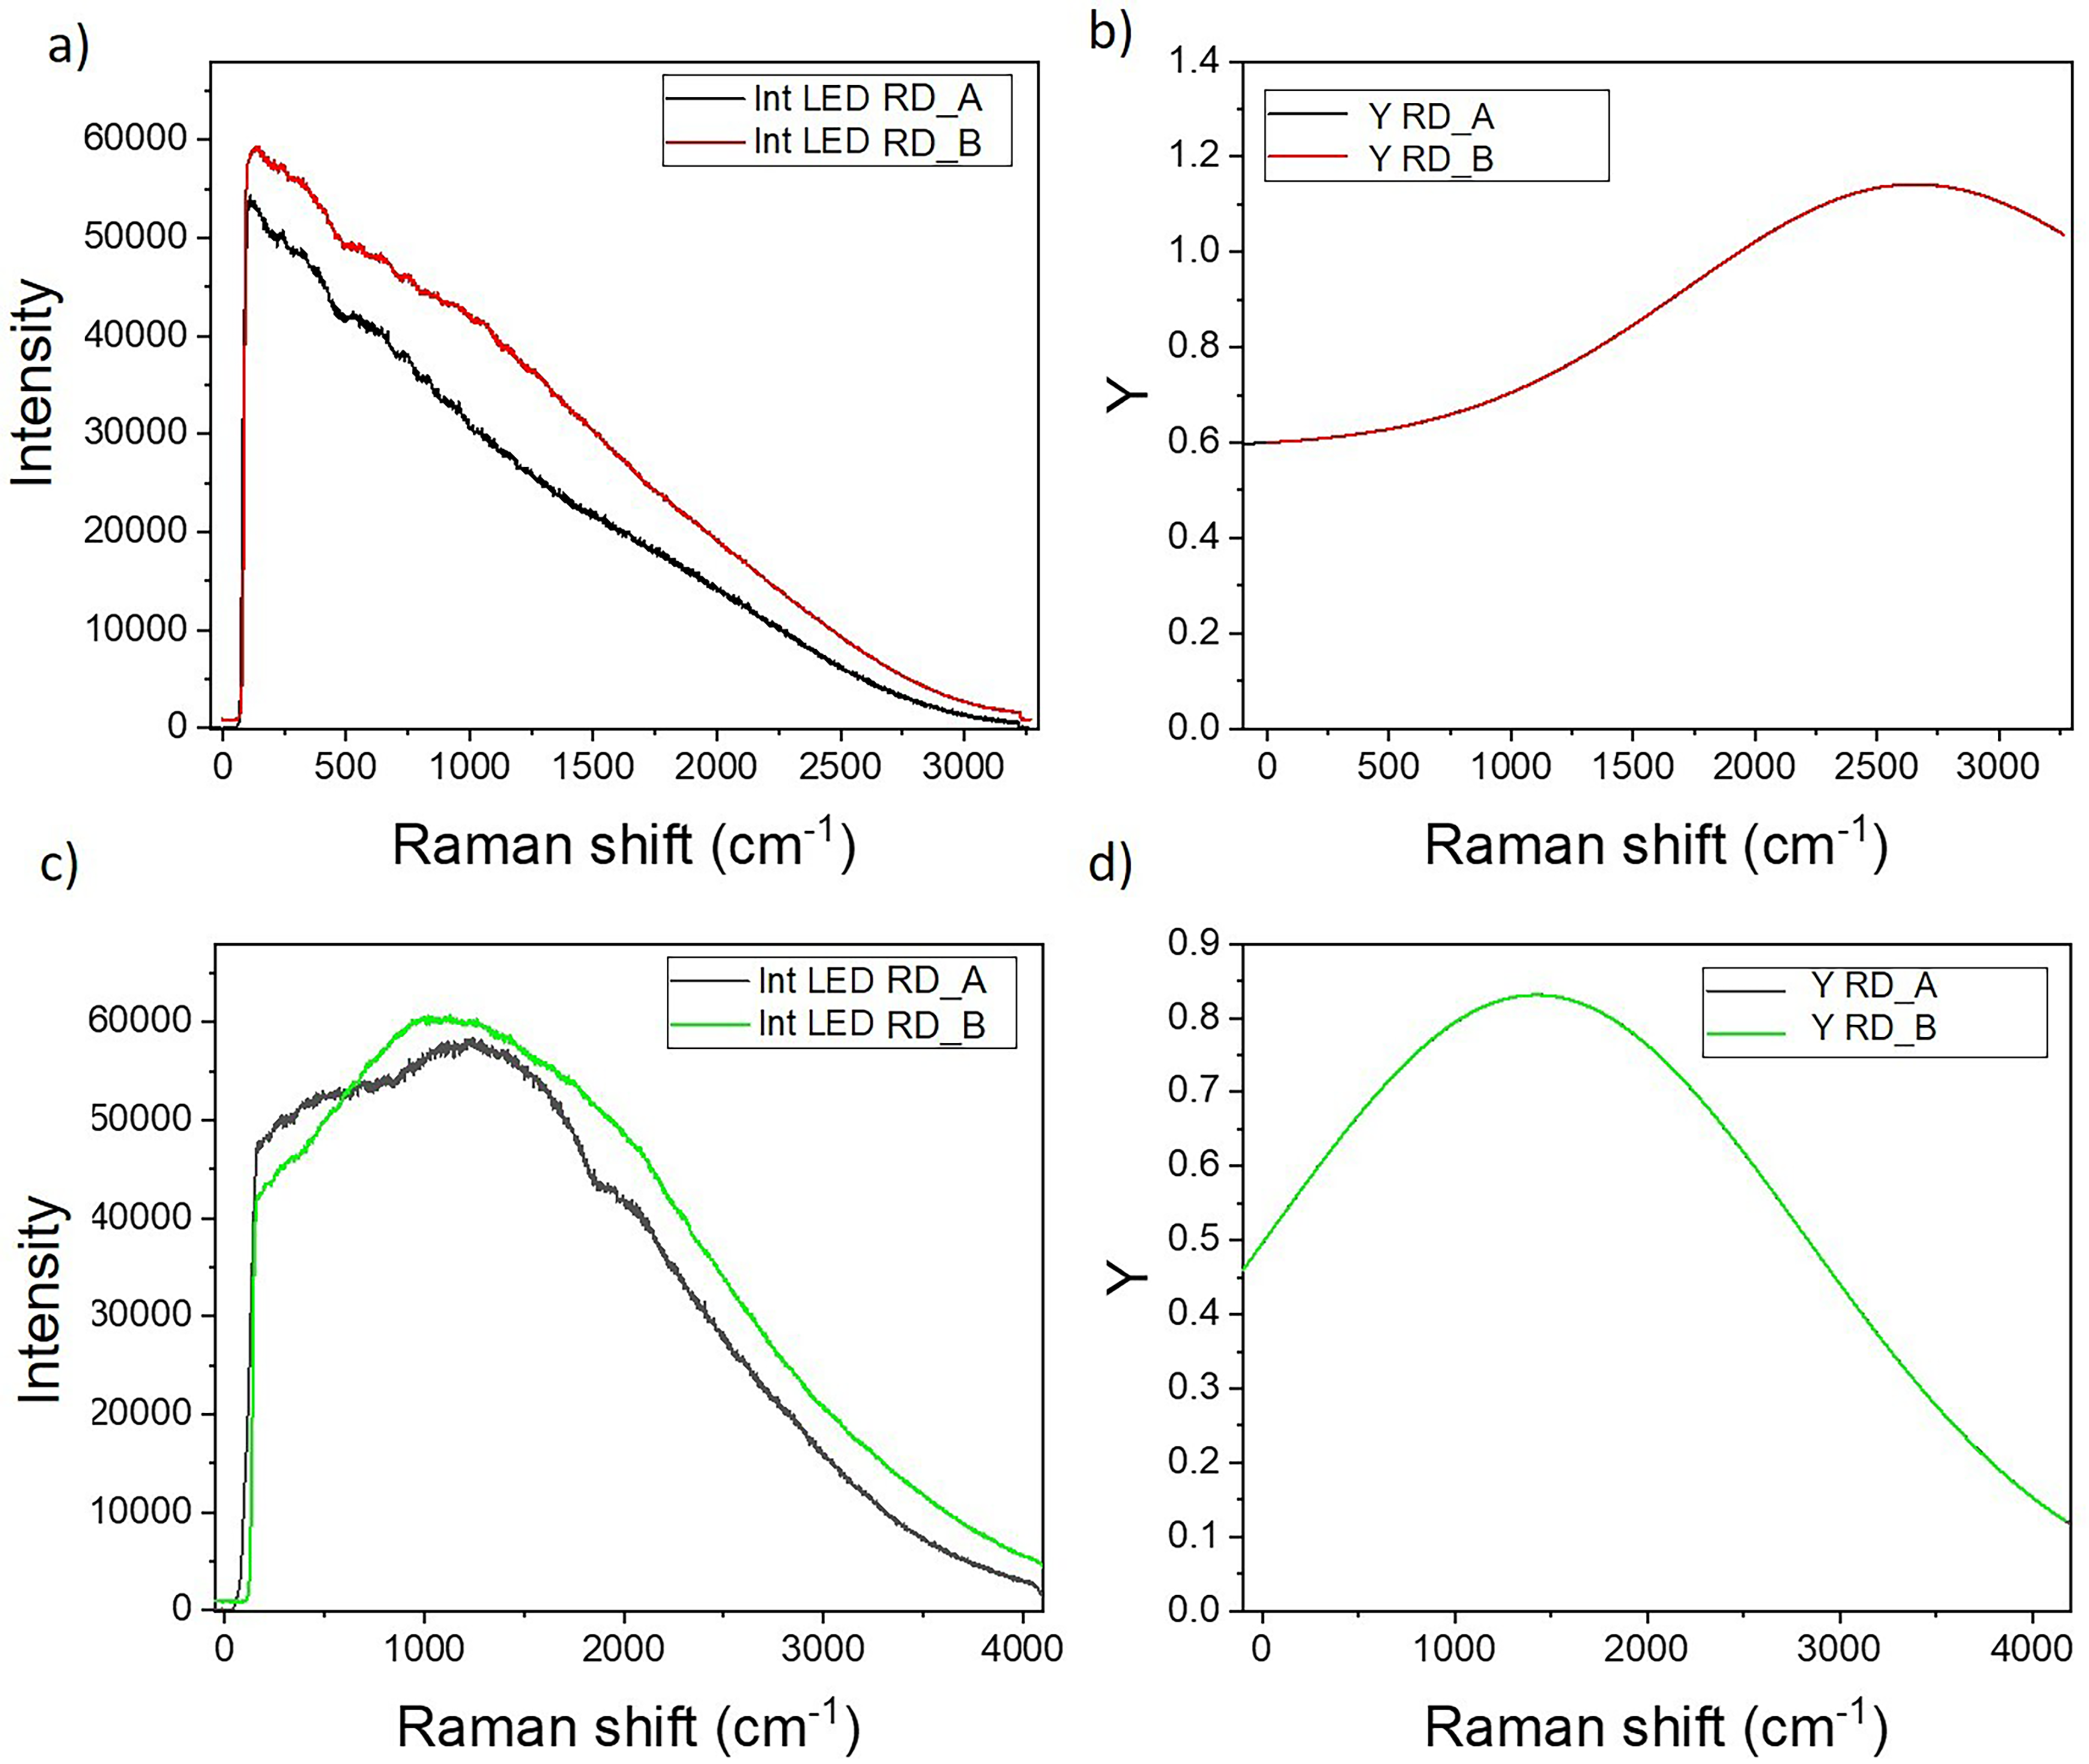
Calibration LED Raman spectra: SLED and Y functions obtained for RD_A and RD_B devices with wavelengths: 785 nm (a) and (c), respectively, and 532 nm devices (b) and (d), respectively.
Twinning of Raman Device Protocol
Application to the Same Raman Device Models
The different steps of the protocol that allow the twinning between different Raman devices for Raman intensity harmonization were developed with the reference sample previously validated. The first twinning was performed between the same Raman models using the 785 nm excitation laser (Figure 3). The first step was to acquire the Raman spectra of the reference sample with RD_A_785 and with RD_B_785, at five different laser powers in each Raman device. Although the reference sample was measured on each instrument with five different laser powers in all applications of the Raman twinning protocol, only the Raman spectra taken with three laser powers are shown in the figures for the sake of clarity. This selection aims to provide a clearer visualization of the various graphs. In Figure 3a, raw Raman spectra obtained for both Raman devices and at each laser power can be seen. The solid line curves correspond to the Raman spectra obtained for the RD_A_785 reference device, while the dashed line curves correspond to the RD_B_785 one. It appears that the variation in the Raman spectra background is the main difference between RD_A_785 and RD_B_785 Raman spectra. These differences are assigned to small variations in the optical path and/or detector of each device.
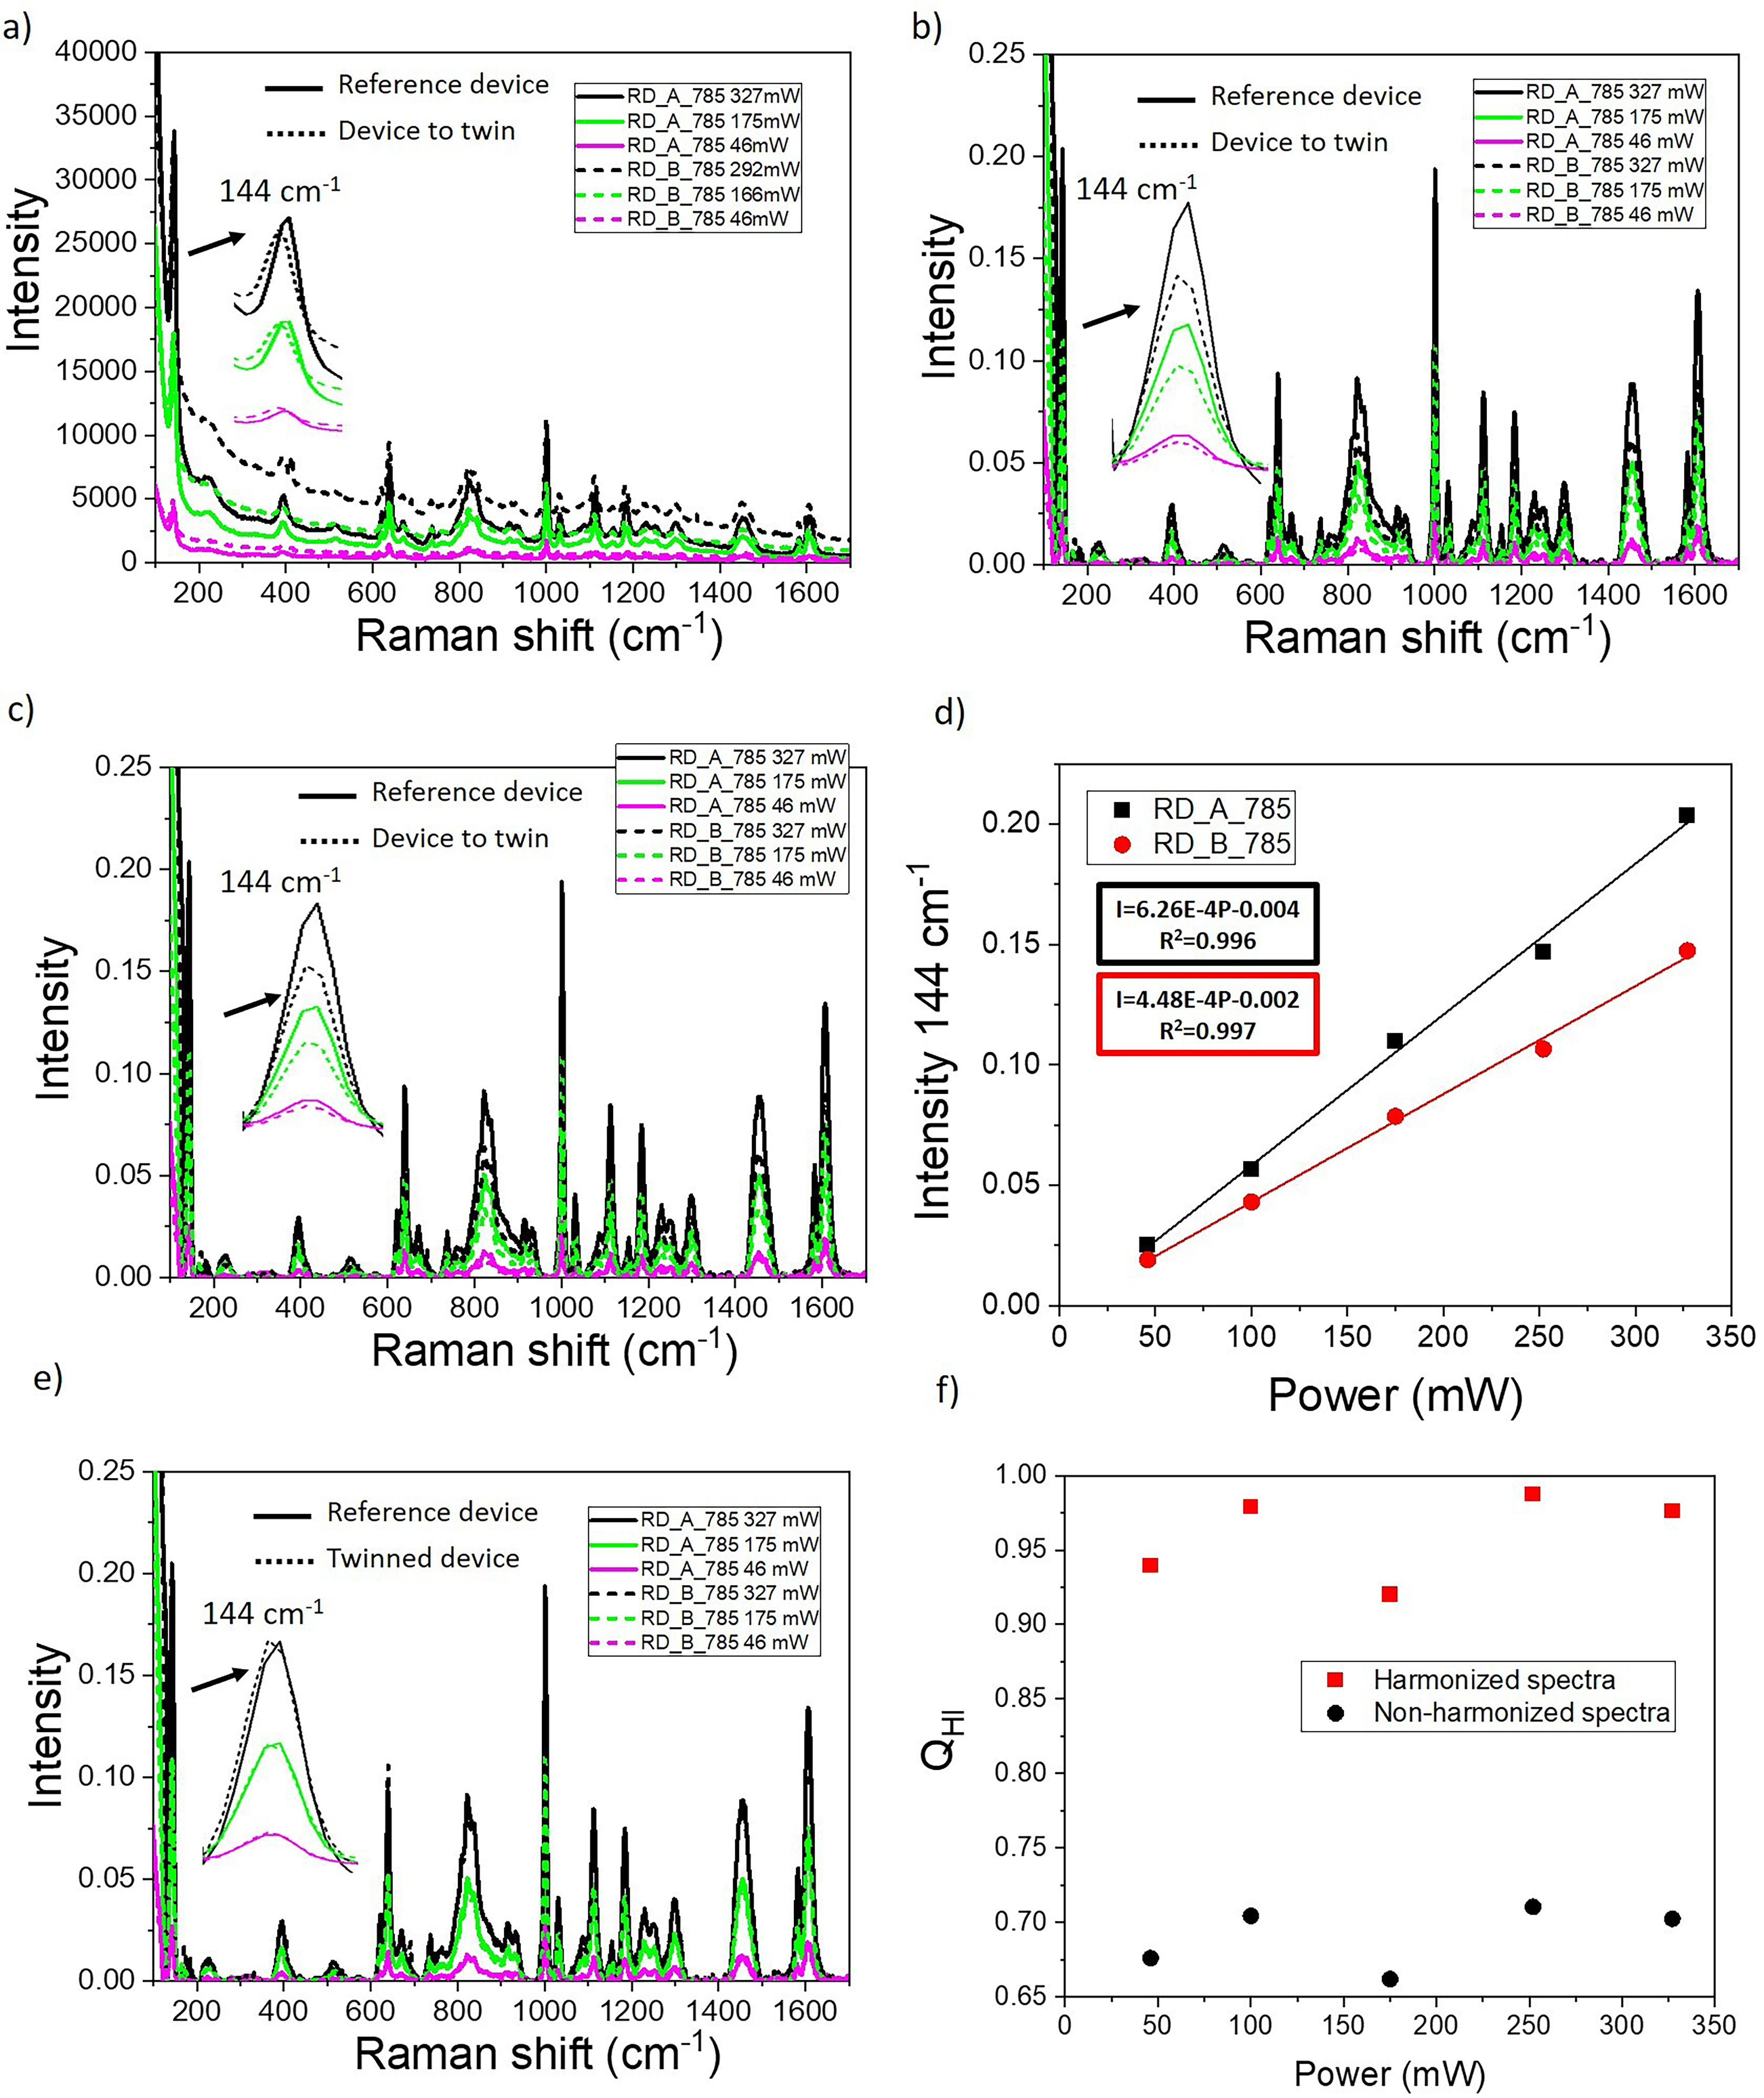
Raman spectra resulting after different steps of the twinning protocol between Raman devices of the same model for 785 nm using the TiO2 reference sample: (a) raw spectra, (b) Raman spectra after pre-processing (c) Raman spectra after LED relative intensity correction, (d) power regression lines before applying the CF, (e) Raman spectra after harmonization, and (f) QHI value obtained for harmonized and non-harmonized Raman spectra.
The second step consisted of the data pre-processing of raw Raman spectra: normalization and baseline subtraction of all Raman spectra (Figure 3b). Firstly, it was necessary to normalize the Raman spectra to the measurement parameters used in the main equipment (RD_A_785) in order to have the equivalent measurement conditions in all Raman spectra. In this case, since the integration time used is the same, it was only necessary to normalize to the laser power. To do this, the Raman spectra measured by the different laser powers used in RD_B_785 are normalized to the same five laser powers used in the RD_A_785 reference device using Eq. 4.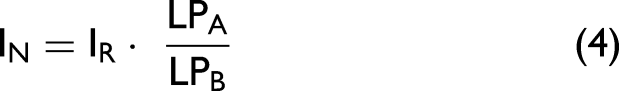
Subsequently, the third step is to make a correction of the relative intensity of all Raman spectra measured and pre-processing from both Raman devices with the white-light calibration lamp NIR light LED for 785 nm. This step is essential for the Raman twinning and further Raman spectra harmonization, since it must be considered that each Raman device has its own relative maximum intensities, which are mostly affected by differences in their wavelength-dependent optical transmission and the quantum efficiency of the detector. 14 The intensity correction procedure with the different equations and graphs, can be found in Figure 2. Figure 3c shows the relative intensity corrected Raman spectra of the reference sample for both RD_A_785 and RD_B_785 Raman devices. As can be seen in Figure 3c, despite the different pre-processing and relative Raman intensity correction steps applied to the Raman spectra, at this point, harmonized spectra have not yet been obtained, as the counts of Raman intensities of the different Raman spectra are still different between both devices. Therefore, an additional algorithm is needed to equalize the Raman intensity counts in both devices and this will be done with the correction factor (CF) described below.
Once all Raman spectra were pre-processed and relative Raman intensity corrected, the CF that adjusts all differences between the two Raman devices in terms of Raman intensity is calculated. This CF is the algorithm that allows both Raman units to be twinned to subsequently harmonize their Raman intensity. This value is an experimental constant that shows the differences in the efficiency of each Raman device, including all the variations that exist in different parameters (such as spot size, power density, optical path, detector, etc.), without the need to study the existing changes one by one. The CF is obtained from the relations of the power regression lines of the data obtained from both Raman devices. To do this, it is necessary first to represent the relative Raman intensity corrected of the Raman band of TiO2 centered at 144 cm−1 for each Raman spectra shown in Figure 3c versus the laser power used, as it can be seen in Figure 3d, and calculate their corresponding regression equations (also shown in Figure 3d). To calculate the Raman intensity of the different TiO2 Raman bands, a prior Lorentzian fitting was performed to find the maximum signal and minimize quantification errors. It can be observed how the TiO2 relative Raman intensity is linear with the laser power used in both cases, but it can also be seen that this linearity is different in each device, as a consequence of the variations in the measurement of each Raman equipment. The CF is obtained with Eq. 5, by dividing the slopes (S) of each power regression line shown in Figure 3c:
The validation of the Raman twinning is carried out by multiplying the treated and corrected RD_B_785 Raman spectra of the reference sample by the calculated CF. Figure 3e shows how the Raman spectra of RD_B_785 match with the Raman spectra of RD_A_785 after applying the CF, that is, harmonized Raman intensities are achieved in all Raman spectra by applying the twinning algorithm between these two Raman devices.
After spectrum harmonization, there may be a certain error in the calculation. These errors can be due to different reasons, ranging from fluctuations in laser power measurements during different readings (including laser fluctuations and instrumental errors of the power meter), to precision issues in focusing the reference sample, instrumental errors of LED lamps, spectral resolution discrepancies, the calculation of the slope of the power regression lines and also the pre-processing of the data obtained (such as the fitting of the Raman bands and the removal of the baselines), among others.
In order to study the quality of the Raman twinning performed and to verify the error in the Raman spectrum harmonization in Raman intensities, a Raman intensity quality factor (QHI) defined with Eq. 6 was calculated considering the areas under the Raman spectra of the harmonized spectra.
Once the protocol for twinning of Raman devices for intensity harmonization was established, with two identical models using a laser excitation with a wavelength of 785 nm, in order to verify that the twinning can also be performed with different excitation lasers, the same previous protocol was carried out with measurements made with a 532 nm laser in the same Raman devices (RD_A_532 and RD_B_532). The results for this other Raman twinning can be found in Figure 4. On this occasion, in addition to differences in the Raman spectrum of the reference sample, it is also expected that the CF may vary its value somewhat, since using a different laser also implies changing the optical path and therefore, having some differences between equipment.
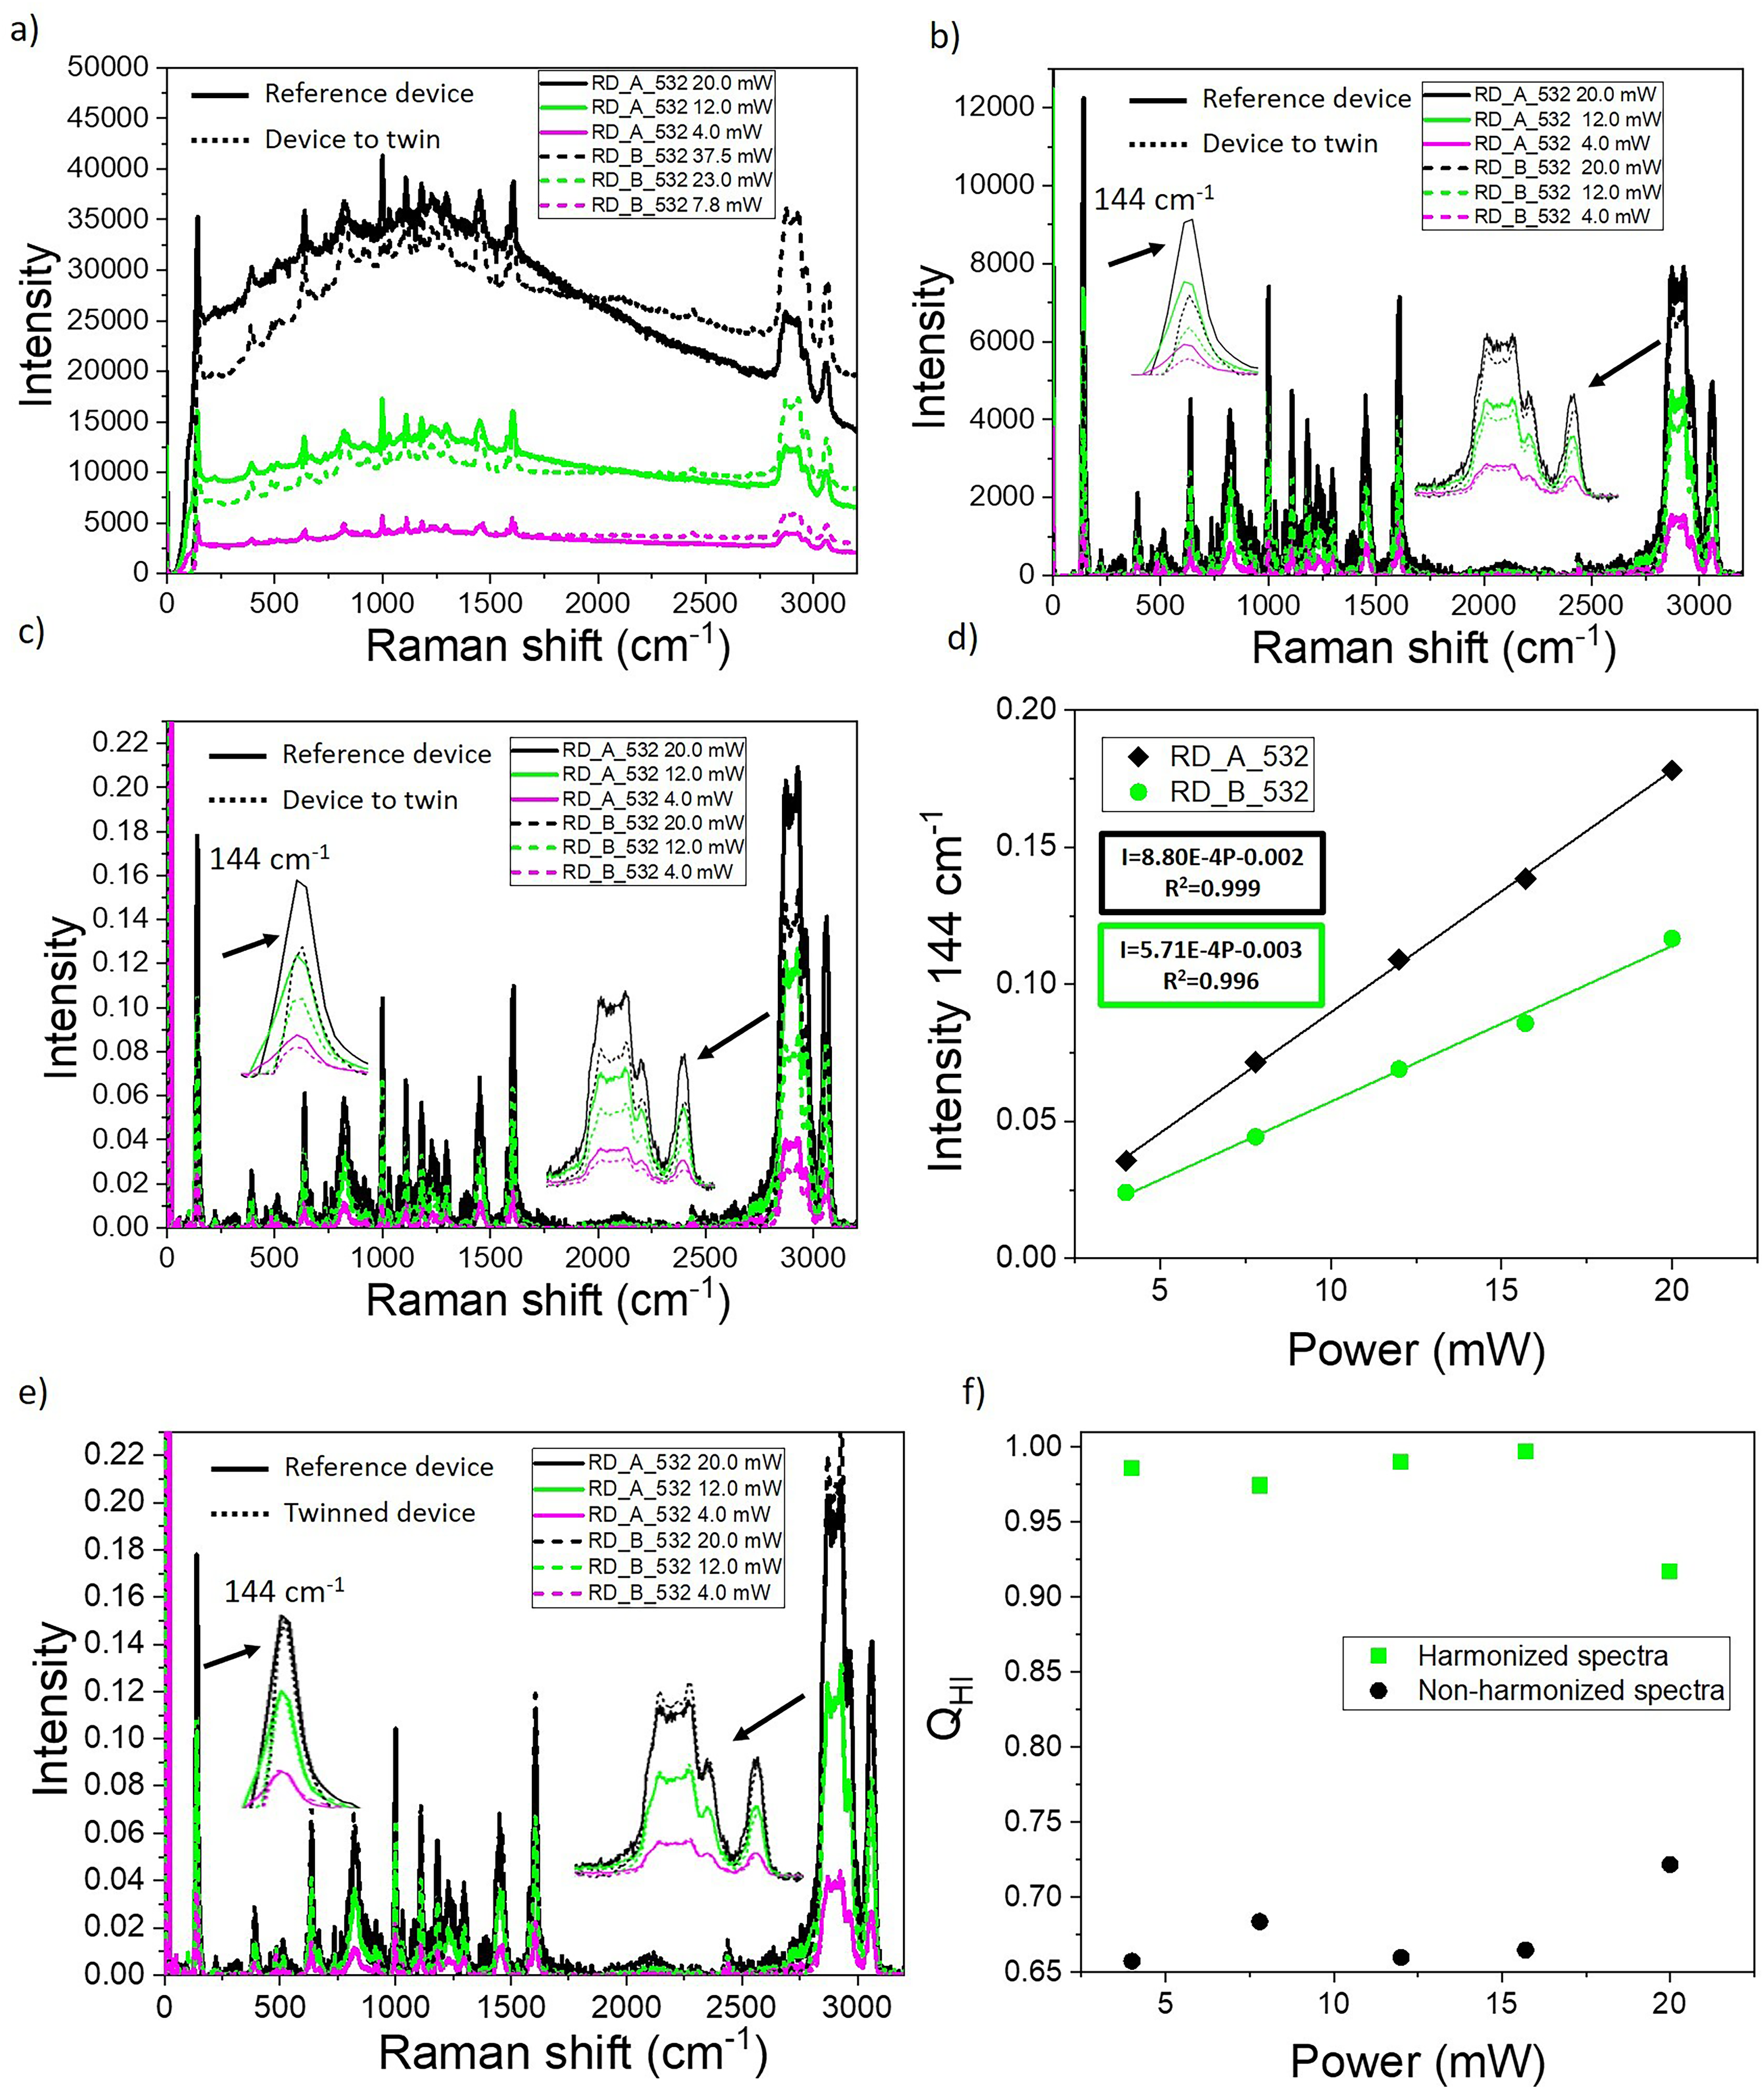
Raman spectra resulting after the different steps of the twinning protocol between Raman devices of the same model for 532 nm using the TiO2 reference sample: (a) raw spectra, (b) Raman spectra after pre-processing (c) Raman spectra after LED relative intensity correction, (d) power regression lines before applying the CF, (e) Raman spectra after harmonization, and (f) QHI value obtained for harmonized and non-harmonized Raman spectra.
The same procedure was used for the twinning of the Raman devices using a 532 nm laser, considering that some differences are found with respect to the devices using a 785 nm laser. First, the raw Raman spectra (Figure 4a) of the reference sample obtained with the 532 nm laser have more background than with the 785 nm laser, since a lower wavelength increases the probability of fluorescence excitation of materials. 38 Next, the intermediate steps of normalization and subtraction of the baseline are performed (Figure 4b) and finally, the relative intensity is corrected with the visible light LED lamp corresponding to 532 nm. The final Raman spectra after all these corrections are shown in Figure 4c, where again in this example it can be seen that the spectra from the two devices do not have the same Raman intensity counts. This confirms again that the relative Raman intensity correction is not sufficient to harmonize the Raman spectra and that the CF algorithm is needed.
In Figure 4d, the power and equations lines for the 532 nm twinning are shown after calculating the Raman intensity of the main Raman band of TiO2. Again, it can be seen that both regression lines are not equal for each Raman equipment. On this occasion, the CF obtained after dividing the slopes of RD_A_532/RD_B_532 is 1.52, which is somewhat higher than in the 785 nm twinning example.
The Raman spectra harmonization is also carried out by multiplying the Raman spectra of the reference sample of the RD_B_532 equipment by CF. As can be seen in Figure 4e, the Raman spectra of both devices coincide after following the proposed protocol, verifying that it is also capable of having harmonized spectra thanks to this Raman twinning in intensities.
The harmonization quality factor QHI is calculated considering Eq. 6 (Figure 4f). It can be seen how the non-harmonized Raman spectra (Figure 4c) have a QHI of 0.65–0.70, similar to the value obtained in the twinning with 785 nm, while the Raman spectra are harmonized by the application of the CF, QHI increases to values higher than 0.92. Moreover, some of them are even very close to one for the different laser powers selected, indicating a very good quality of harmonization.
In all case studies, it has been possible to verify and conclude that the twinning between equipment of the same model, with the protocol developed in this work, allows us to achieve equipment twinning harmonized Raman spectra with errors lower than 8% in all cases.
Application to the Dissimilar Raman Device Models
The results show that this twinning protocol can be successfully applied to similar Raman devices, but a question arises if they can be applied for the twinning of different devices with also dissimilarities in optical paths, optical resolution, and data acquisition components. To verify this point, a twinning between completely different non-confocal and confocal devices (B&W Tek and WITec devices) has also been studied.
The average Raman spectra from the raw data collected by RD_A_532 and RD_C_532 devices can be seen in Figures 5a and 5b, respectively. The first significant difference can be observed with respect to the twinning of RD_A_532 and RD_C_532 devices, where the raw Raman spectra obtained in the case of the RD_A_532 device have a greater background fluorescence, which is not observed in the RD_C_532 one, which is probably due to the high quality of the optical path in the confocal Raman device and to a greater spectrometer efficiency.
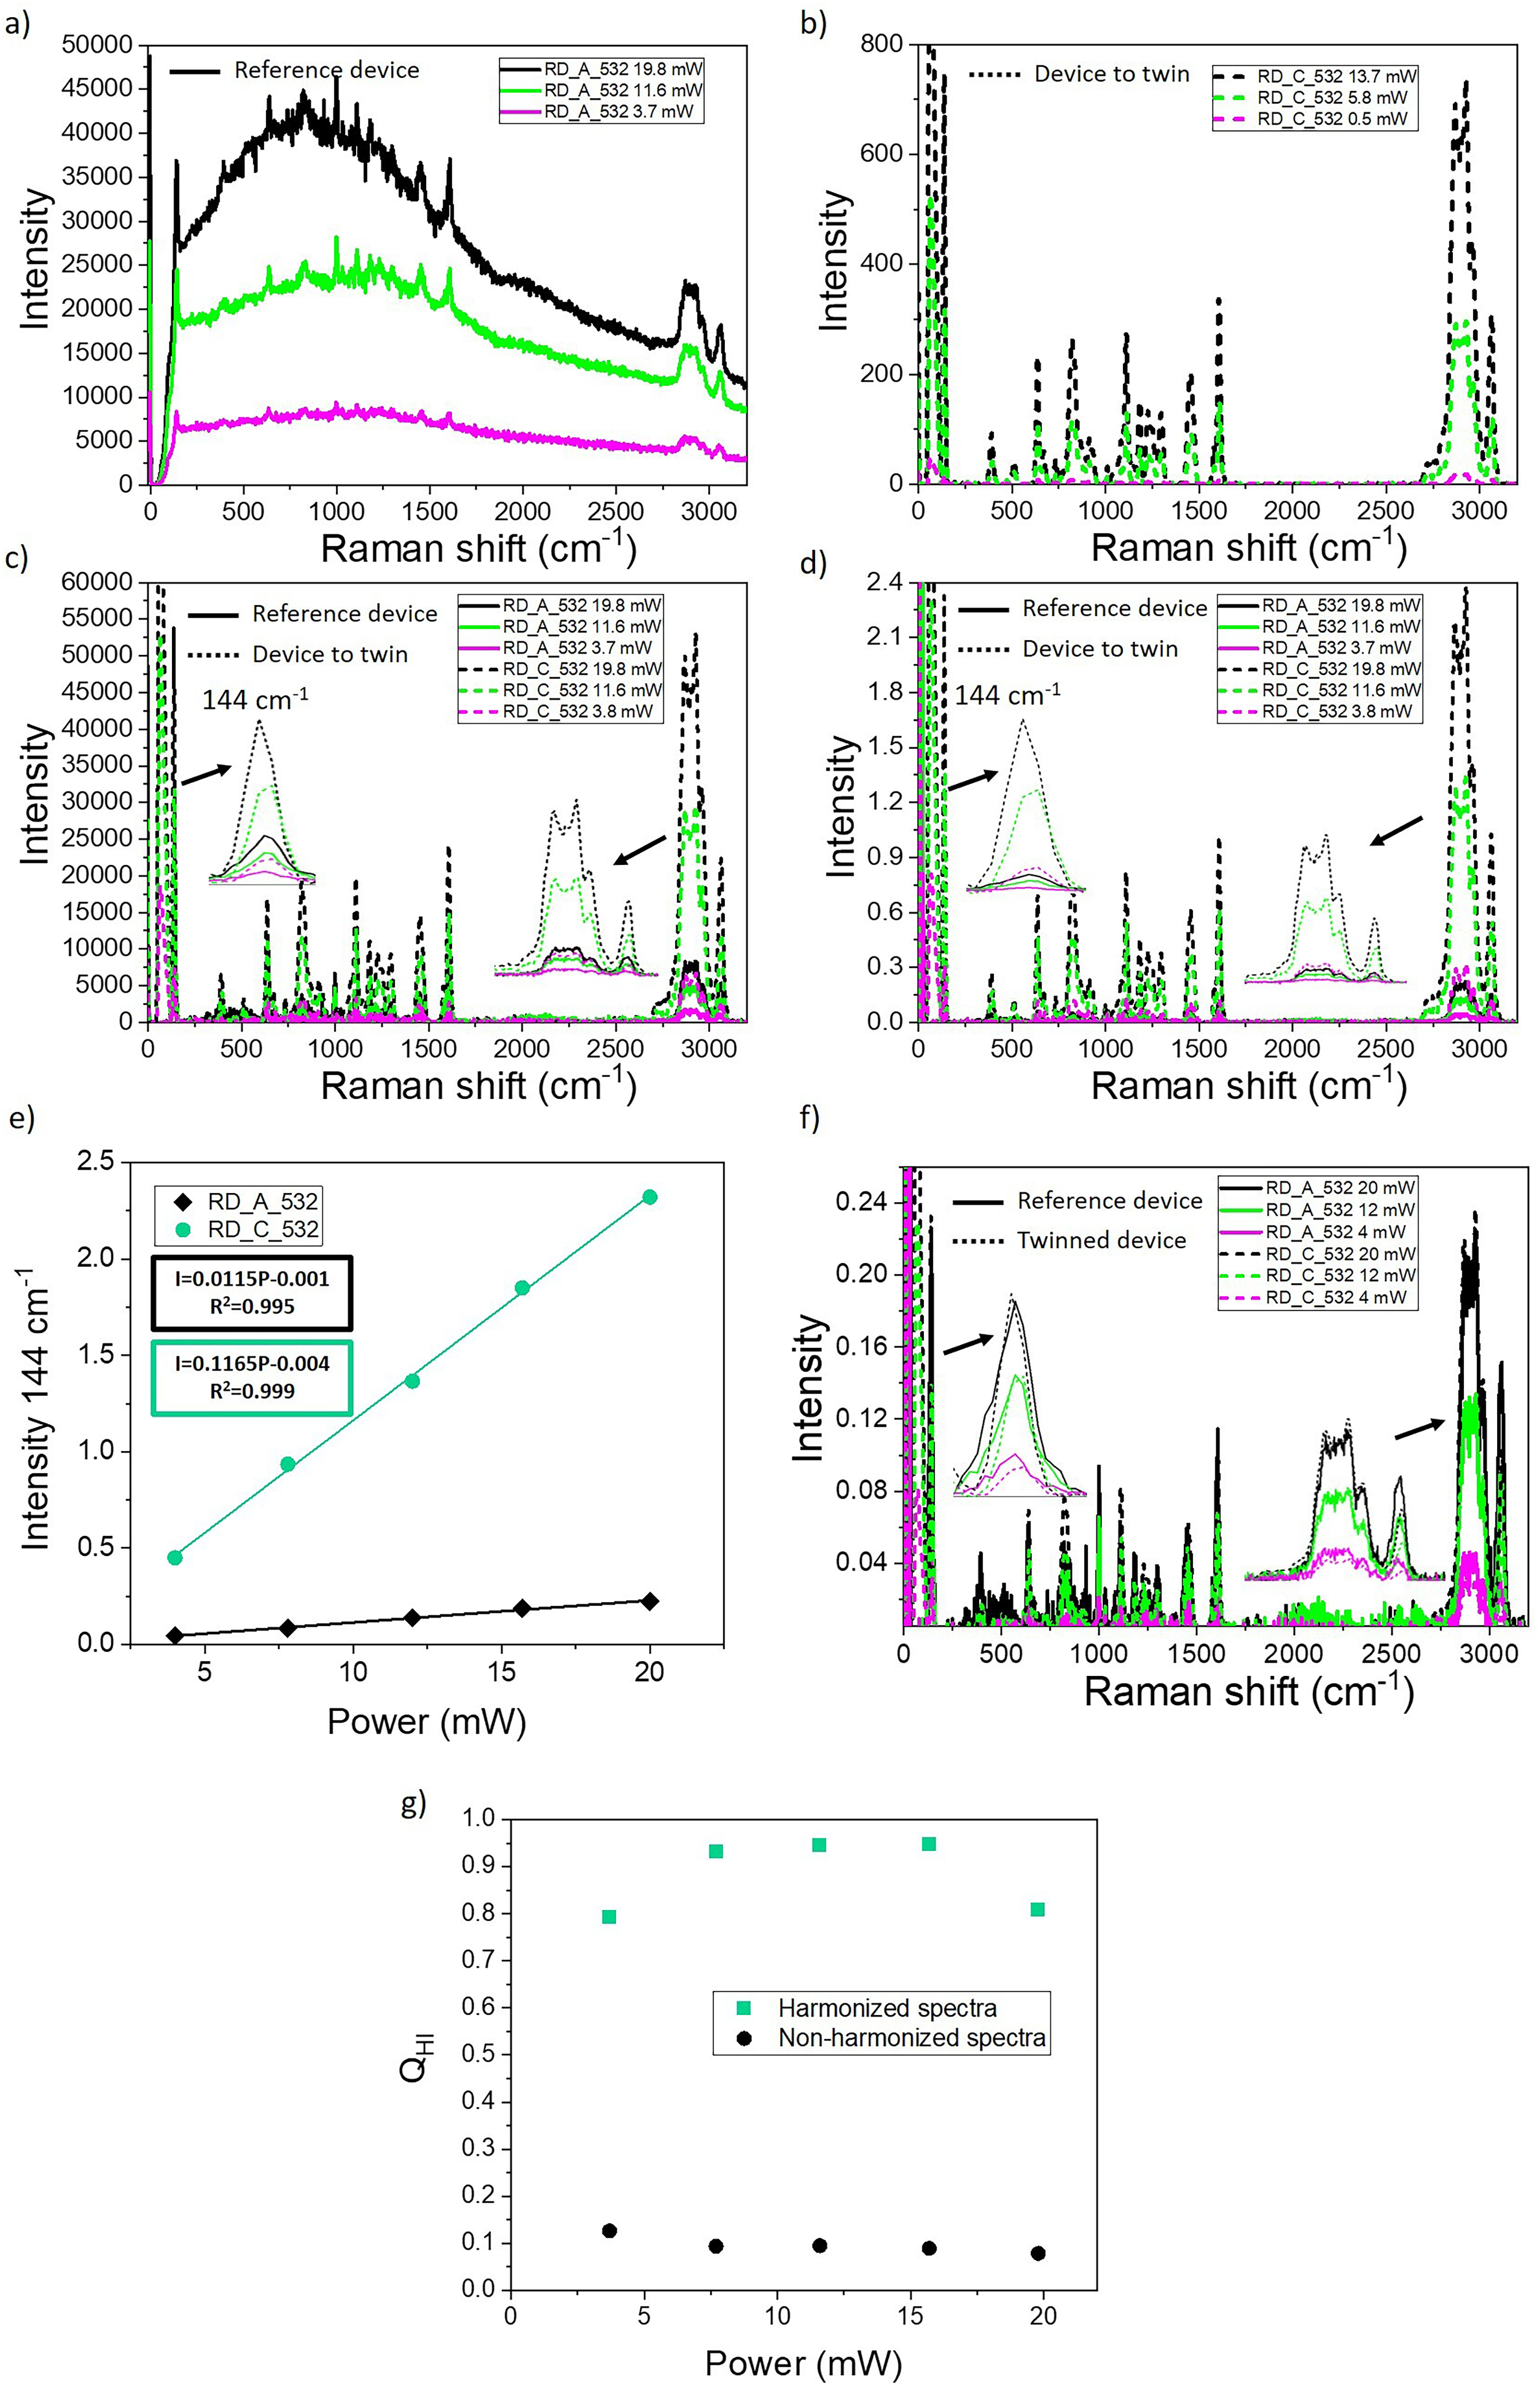
Raman spectra resulting after the different steps of the twinning protocol between Raman devices of different models for 532 nm: (a) RD_A_532 Raman raw spectra, (b) RD_C_532 Raman raw spectra, (c) Raman spectra after removing baseline, (d) Raman spectra after LED relative intensity correction, (e) power regression lines before applying the CF, (f) Raman spectra after harmonization, and (g) QHI value harmonized for corrected and non-harmonized Raman spectra.
In the second step, in addition to the normalization of the Raman intensity to the same laser powers (Eq. 4), a second normalization for the RD_C_532 Raman spectra to the same integration time used in the RD_A_532 reference device was necessary using Eq. 7:
In Figure 5d, the Raman spectra after the relative intensity correction are shown, carried out again with the visible light LED lamp for 532 nm with the same procedure as previously explained. It can be observed that there is still a large difference in the Raman intensity between both Raman devices before the application of the CF.
Figure 5e shows the Raman intensity-power regression lines obtained for each Raman equipment. It can be seen how the slopes are substantially different compared to the regression lines obtained in the Raman twinning between devices of the same model. These variations also translate to a CF value calculated from the ratio between both slopes, which is 0.1. This value is one order of magnitude lower than that obtained for the same Raman device models twinning.
A good harmonization of the reference Raman spectrum is achieved (for all laser powers described in this article) when the validation is performed by multiplying the CF by the Raman spectra for RD_C_532 (Figure 5f), as Raman intensities are mostly coincident for all the laser power applied, despite the great difference between the units compared, regarding their optical sets, performance and area/volume of analysis.
The benefit of this Raman twinning is also calculated in terms of the Raman intensity quality factor (QHI) of the harmonized Raman spectra as shown in Figure 5g. In this case, it can be seen that the non-harmonized Raman spectra have values of QHI around 0.1, much lower than when twinning is done between devices of the same model. This is due to the large variations in terms of Raman intensity that exist between these two devices of different models. Regarding the harmonized Raman spectra, QHI values of at least 0.8 are observed, reaching values higher than 0.9 for some laser powers. A reasonably good harmonization is obtained from the twinning of RD_A_532 and RD_C_532 devices despite the huge differences between them and the collected Raman spectra.
This study proves a relationship between the twinning of Raman devices and algorithms based on laser power. Raman spectroscopy is a relatively low efficient spectroscopy, where it is calculated that approximately one of each of the applied 106–107 photons is Raman scattered. As stated before, Raman efficiency is dependent on the Raman cross-section of materials. Moreover, a second parameter must be considered, which in this case is related to the efficiency of the Raman devices, that is, how many of the Raman scattered photons are collected. Each Raman device possesses differences in optical paths (losses by reflection or absorption, heating, etc.), detector capability, confocal focusing, and so on. These particular characteristics make it impossible to reproduce the same measurement of a Raman spectrum even for the same material in two different devices.
The twinning protocol shown here is based on the linearity of the signal intensity with the measured power and integration time, which is considering the variation of the Raman intensity with laser power, and not isolated measurements in specific conditions. The linearity, on the one hand, allows replicating the laser powers of two devices in the normalization step. On the other hand, it allows the efficiencies of each device to be related through the CF calculation, so that the Raman intensities as a function of the laser power are restricted to vary in a common straight line (illustrated in Figures 2d, 3d, and 4f) after CF application. This can be achieved even though the efficiencies of the devices to be twinned are very different. The CF between RD_A and RD_B for both wavelength lasers is in the order of 1.3–1.5, because the components and the optical paths, although particular for each device, are similar. In the case of RD_C_532, the fact that the measurements need lower integration times indicates a high efficiency of the device to integrate a large part of the scattered photons into the measured signal. Nevertheless, the linearity between Raman intensity and laser power enables twinning with RD_A and B devices, in which the very low CF calculated (0.1) is indicative of the difference in the efficiency of the devices.
Conclusion
The utilization of Raman spectroscopy as a material characterization method is on the rise, finding application in diverse industrial sectors. Even though there are different standards and protocols for the calibration of this type of equipment now, comparing harmonized Raman spectra in terms of Raman intensity from different devices has been a challenge not described in the literature until recently. In this work, a new method has been carried out that makes an approximation in obtaining Raman spectra with equal intensity counts for the first time. It has been demonstrated that by applying this new twinning protocol between different Raman devices, it is possible to link different instruments to compare their measurements in terms of harmonized Raman intensity. Because controlling all the factors on which Raman intensity depends is practically impossible, the twining protocol is based on taking into account two elements: (i) using the same reference sample and (ii) the linearity of the laser power with the intensity of the reference sample. To afford this protocol, a homogeneous and reproducible reference sample has been developed and manufactured, which ensures a measurement with a constant Raman cross-section and a deviation <2.5% in relative Raman intensity. The twinning protocol has been applied and validated between devices of the same model (with equal or different laser excitations) and between wholly different devices showing that it can be applied in both of the examples. In the case of Raman devices of the same model, the results show how it is possible to harmonize Raman spectra with a <5% deviation in Raman intensity. This deviation is <10% in Raman intensity with harmonized non-confocal and confocal Raman devices. It has been shown that the use of the new reference sample and the newly developed procedure allows Raman devices to be twinned in order to obtain comparable relative Raman intensities. Intensity harmonized Raman spectra will improve the degree of comparability, reproducibility, and reliability of the Raman data obtained between different Raman devices, and thus promote the use of this technique in different applications and industries.
Footnotes
Declaration of Conflicting Interests
The authors declared no potential conflicts of interest with respect to the research, authorship, and/or publication of this article.
Funding
The authors disclosed receipt of the following financial support for the research, authorship, and/or publication of this article: This work was supported by EU H2020 Project CHARISMA (Grant No 952921). M.F.A acknowledges the financial support from MCIN/AEI/10.13039/501100011033 and European Union NextGenerationEU/PRTR (Grant No FJC2021-047888-I).