
Abstract
Near-infrared (NIR) dyes have a unique ability to interact favorably with light in the NIR region, which is particularly interesting where stealth and camouflage are paramount, such as in military uniforms. Characterization of cotton fabric dyed with NIR-absorbing dyes using visible–NIR (Vis-NIR) and short-wave infrared (SWIR) hyperspectral imaging was done. The aim of the study was to discern spectral changes caused by variations in dye concentration and dyeing temperature as these parameters directly influence color- and crocking-fastness of fabrics impacting the camouflage effect. The fabric was dyed at three concentrations (2.5, 5, and 10%) and two dyeing temperatures (55 °C and 85 °C) and principal component analysis (PCA) and partial least squares discriminant analysis (PLS-DA) were performed on the spectra to discriminate the fabrics based on dye concentrations. The PCA models successfully segregated the fabrics based on the dye concentration and dyeing temperature, while PLS-DA models demonstrated classification accuracies between 75 and 100% in the Vis-NIR range. Spectra in the SWIR region could not be used to detect the differences in the concentrations of the NIR dyes. This finding is promising, as it aligns with the objective of creating NIR-dyed camouflage fabrics that remain indistinguishable under varying dye concentrations. These results open possibilities for further exploration in enhancing the stealth capabilities of textiles in military applications.
This is a visual representation of the abstract.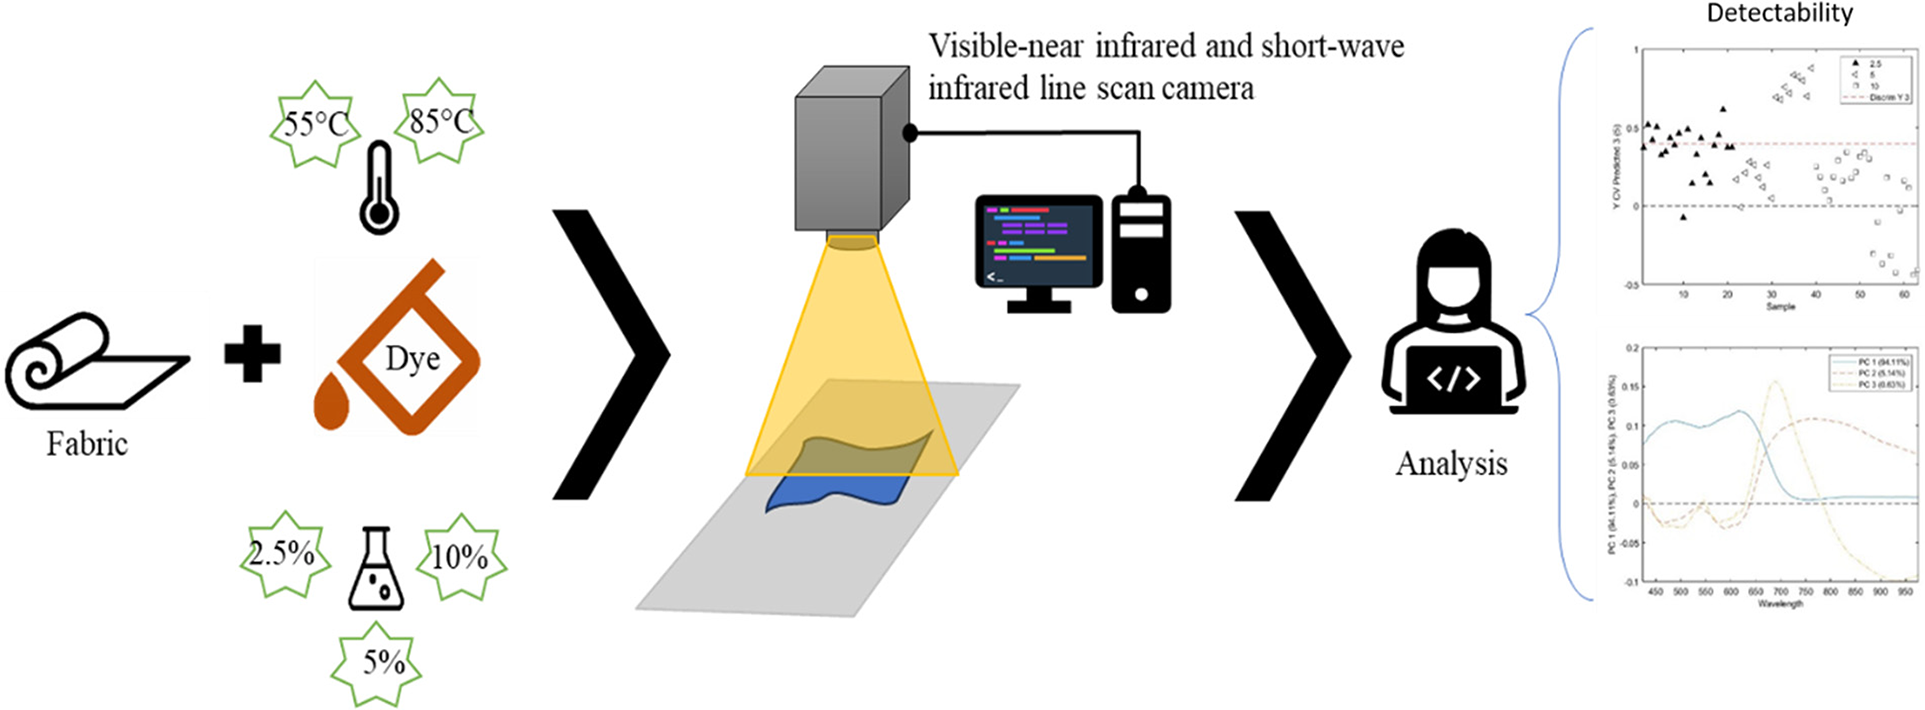
Keywords
Introduction
Textiles have been integral to human society for thousands of years, serving different purposes, ranging from clothing, and shelter, to aesthetics representing cultural expressions. In the wake of technological progress, functional textiles are being developed to aid specialized applications in diverse fields, including medical science, aerospace, agriculture, automotive, petrochemicals, and defense. One remarkable advancement in textile technology is the incorporation of near-infrared (NIR) dyes that interact with light in the NIR region (750–2500 nm) to serve specific end purposes. For example, textiles infused with NIR dyes can be virtually indetectable relative to the environment in specific wavelength regions, a property of fundamental importance for military applications where camouflage and stealth are paramount.1,2
The NIR range is of great importance to the defense sector because it encompasses the region where non-visible reflectance patterns of green vegetation occur. 3 The ambitious goal of achieving NIR reflectance matching has been realized for cotton fabric using vat dyes that mimic the reflectance signals of various natural environments, including deciduous or coniferous leaf surroundings.4,5 Textiles dyed with NIR dyes not only aid in camouflage but also offer enhanced durability, resistance to environmental conditions, and protection against ballistic threats. 6
Subversive coloration of fabrics in military uniforms plays a vital role in assisting personnel in blending with their surroundings and evading detection. 7 Color detection and identification processes are involved in identifying objects using computer vision. Various technologies, ranging from optical sensors such as thermal, low light, visible (Vis), and ultraviolet (UV) have been deployed to detect and identify objects in military contexts. Specialized detector materials such as mercury–cadmium–telluride (MCT) can be especially advantageous in reconnaissance as the sensors are tunable in the short-wave infrared (SWIR) range (950–2500 nm) and have low payload weight. With continual improvements in compactness and efficiency, different camouflage types have been developed to confound infrared (IR) sensor systems’ detection capabilities.8,9 Hence, the evolution of specific camouflage designs for military uses tends to follow the pace of sensor development. Under optimum conditions, camouflage should minimize the resolution between the uniform and its surroundings, for which the protective fabric type, color, and pattern hold significant importance. 10
In contemporary military contexts, using multi- and hyperspectral NIR equipment to find hidden camouflage has proven valuable. SWIR imagers have a unique ability to penetrate through fine particulates (e.g., atmospheric pollution, fog, and obscuring/signaling devices such as smoke grenades), and so are valuable for surveillance in military applications. 11 The reflectance spectra captured by these types of sensors can also be used to observe the diffused reflectance in cotton-blend fabrics by evaluating them as a function of the concentrations of dye mixes.12,13 To evaluate camouflage efficiency in the Vis and NIR spectral ranges, Rubežienė et al. 14 created photo modeling and spectral analysis methods. While testing alternative reflectance values for forest camouflage materials, the authors discovered that the gap between dominant spectral reflectance values for dissimilar hues must exceed 7% to ensure camouflage efficacy. By matching the reflectance characteristics of the environment with the soldier's attire, attempts have been made to camouflage the army uniform in the NIR region, using various types of pigments, dyes, and nanoparticles to achieve sufficient camouflage.15–18
Innovations involving surface dyeing and pigmentation, embedded additives, chromic materials, low emissivity coatings, and phase change materials have contributed to the creation of protective textiles. Typically, cotton fibers are dyed using vat dyeing or pigment printing with anthraquinone-type dyes to achieve the desired NIR reflectance dyeing. 8 In such cases, factors, including the concentration of a dye and dyeing temperature, are pivotal, as they influence dye solubility, penetration, bonding, and vibrancy. 19 Elevated dyeing temperatures, in particular, facilitate these processes, resulting in more uniform and vivid coloring. 20
Despite the advancements in NIR technology and its applications in the defense sector, no other study has explored the ability of visible–NIR (Vis-NIR) and SWIR hyperspectral imaging (HSI) to discriminate the reflectance of cotton fabric based on the concentration of the NIR dye and the dyeing temperature. This study sets out to fill the research gap by exploring the possibility of using Vis-NIR and SWIR imaging to detect changes in the NIR-dyed cotton fabric dyed at different dyeing temperatures and concentrations. The findings from this research may serve as a fundamental reference for subsequent advancements in the field.
Experimental
Materials and Methods
Near-Infrared Dyes and Materials
The dyeing process used a 100% bleached and de-sized woven cotton fabric (1:1, plain, 98 g/m2) made from spun yarn. The fabric was supplied by TestFabrics Inc. with style no. 400 and a warp/weft count of 54/124 per square inch (21/48 cm2). It was cut into equal sample sizes of 70 mm × 120 mm before dyeing. Chemicals used to aid the dyeing process were sodium hydroxide (NaOH technical flake; J.T. Baker Chemical Co.), anhydrous sodium carbonate (Na2CO3; McArthur Chemical Co. Ltd.), sodium hydrosulfite (Na2S2O4) and anhydrous sodium sulfate (Na2SO4; Fisher Scientific Company), all meeting American Chemical Society specifications. To assess the potential of detecting the change in the cotton fabric dyed with NIR absorbing dyes in the Vis-NIR and SWIR ranges, green (no. 1, Bezaprint green BT pigment), olive (no. 2, Bezathren olive R PS), and red (no. 3, Bezathren Rubine R EPS) dyes sourced from Chemische Fabrik Tübingen, CHT were used.
Dyeing Process
To prepare the dye solution, the vat dye reduction was performed by adding two-thirds of the alkali mass (0.133 g of NaOH) and sodium hydrosulfite (0.0533 g) to the water solution (100 mL) at 60 °C for 10 min (Figure 1). The remaining mass of alkali (0.67 g of NaOH) and sodium hydrosulfite (0.027 g) was added with the cotton samples (sample weights of 1 g) to the aqueous solution containing 2.5, 5 and 10% vat dye and stirred continuously for 15 min. Half of the granular sodium sulfate, equivalent to 0.11 g, was then introduced, followed by the addition of the remaining half after a 15 min interval, resulting in a total sodium sulfate mass of 0.22 g. The sample was exposed to air for 25 min after rinsing with liquor to oxidize the vat dye. The samples were washed in an aqueous solution of soap (American Association of Textile Chemists and Colorists standard reference detergent without brightener, 2 g/L) and sodium carbonate (2 g/L) and boiled for 10 min. After that, the samples were washed with cold water and dried under ambient conditions, as described by Zhang and Zhang. 4
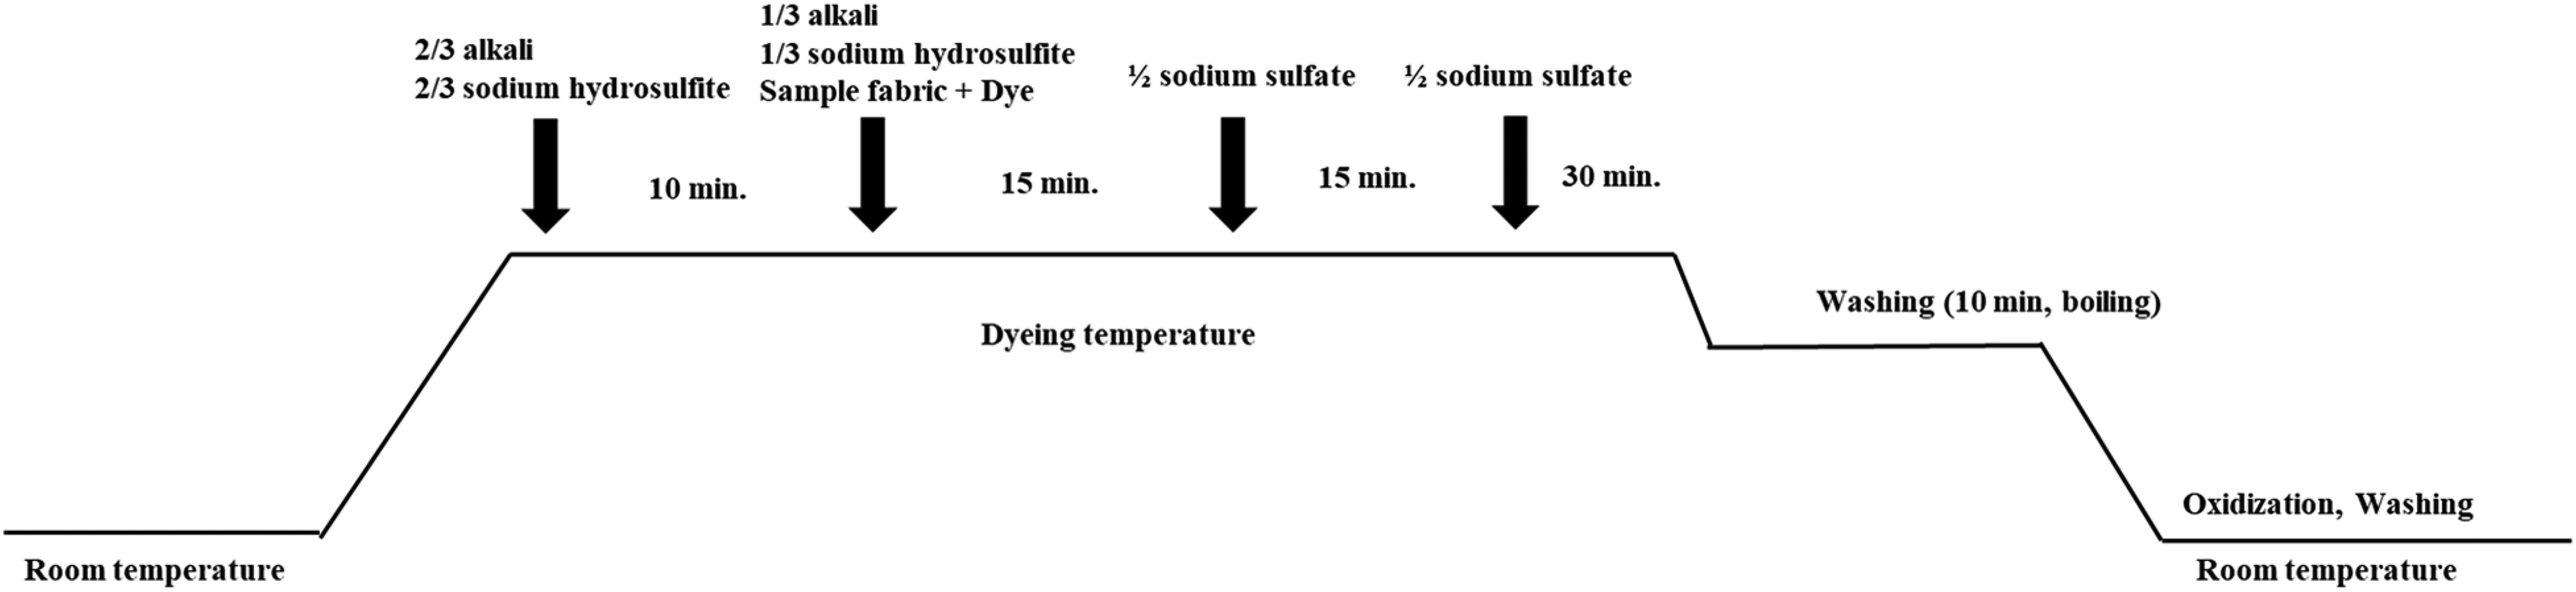
Near-infrared (NIR) dyeing process with NIR absorbing dyes.
In the experiment, two distinct dyeing temperatures (55 °C and 85 °C) were chosen. Additionally, we chose to investigate the effects of three different dye concentrations: 2.5, 5, and 10%. These concentration levels were carefully selected to examine the potential interactions between various dye concentrations and the textile material at the specified dyeing temperatures. As the variation in the total dyeing time did not create any remarkable changes in the dyed cotton samples, this variable was excluded from the data analysis. The total data set consisted of 270 samples (90 for each dye with 15 replications of samples corresponding to each combination of dyeing temperature and dye concentration).
Hyperspectral Imaging System
The samples of dyed cotton fabric were assessed with Vis-NIR and SWIR line-scanning HSI systems (SPECIM Spectral Imaging Ltd). For the Vis-NIR system, a charge-coupled device camera with a 1024 × 896-pixel sensor array was employed, as shown in Figure 2a. The calibrated spectrograph (SPECIM V10E) worked in the wavelength range of 397.66–1003.81 nm and had a spectral resolution of 2.6 nm (SPECIM OLET 15). Two 150 W tungsten lamps (3900-ER, Illumination Technology, Inc.) placed at a 45° angle on either side of the sample stage served as light sources.
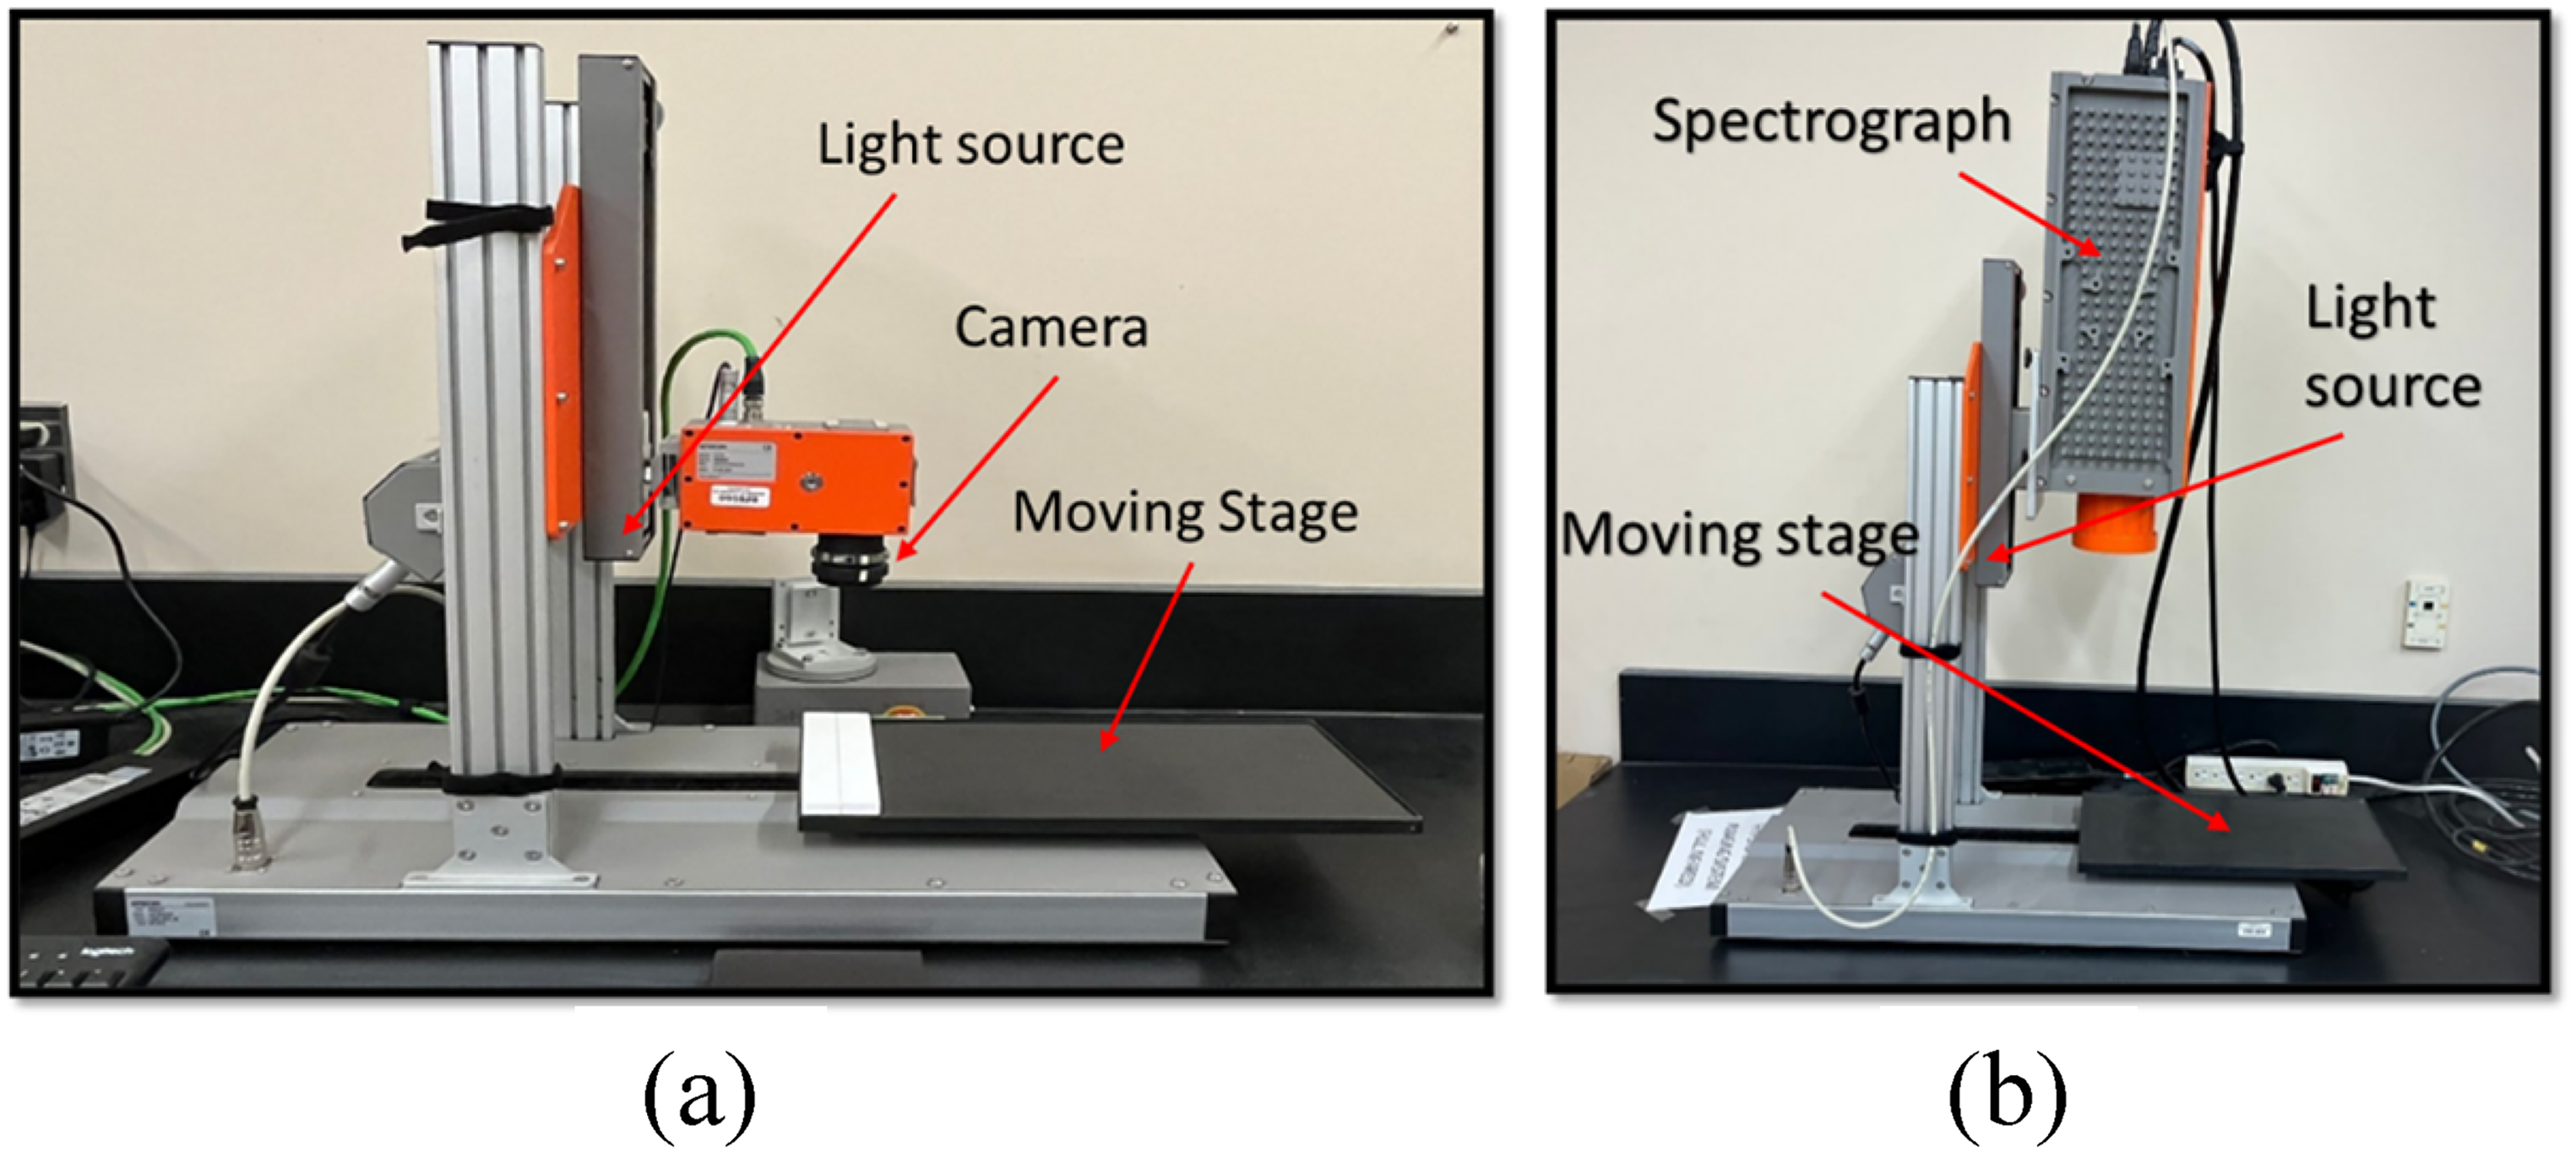
(a) Visible–near-infrared (Vis-NIR) and (b) SWIR line-scanning HSI systems.
The SWIR setup included a thermo-electrically cooled camera and a SPECIM N25E spectrograph, equipped with a 300 × 384-pixel sensor array and a cryogenically cooled MCT detector array (Figure 2b). Hypercubes were captured within a 953.36–2567.37 nm wavelength range, achieving a spectral resolution of 5.6 nm, using a 30 mm SPECIM OLES 30 focusing lens. 21
Image Acquisition and Correction
The line-scanning systems were powered and allowed to stabilize for a minimum of 30 min before scanning commenced. This was done to ensure the thermal and temporal stability of the camera sensors.
22
With the frame rate calibrated at 20 frames per second (fps) and the moving stage speed adjusted to 7 mm/s, the optimum balance between frame rate and exposure time was established. The black reference image was captured by closing the camera shutter. A 99% Spectralon reflectance standard (Labsphere) was scanned at the beginning of each image for white reference. These references were further used to calculate the relative reflectance, R, after obtaining an original hyperspectral image. The calculation is shown in Eq. 1:
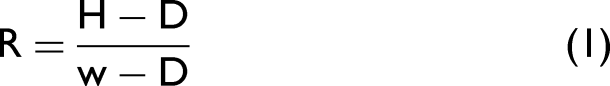
Image Processing and Spectra Acquisition
To pre-process the data, wavelengths corresponding to poor signal-to-noise ratio found at two extremities of the spectral range were removed from the hypercubes for both the Vis-NIR and SWIR data before spectral extraction. Next, the background was separated from the area of interest using binary masks. Representative spectra were obtained by averaging the unmasked pixels on each sample image using a custom code written in Matlab (The Mathworks Inc.).
Multivariate Analysis
Outlier elimination, dimensional reduction of the data set, and model creation were accomplished using multivariate analysis approaches such as principal component analysis (PCA) and partial least squares discriminant analysis (PLS-DA). PCA is a data exploration technique that converts many correlated variables into a smaller quantity of independent orthogonal variables called principal components (PCs). This approach reduces data complexity and facilitates subsequent analysis and interpretation. In contrast, PLS-DA is a supervised classification method that employs latent variables (LVs), which are identified by considering the correlation between reaction parameters and a design matrix filled with dummy variables. These variables represent different groups within the data collection, enhancing the specificity (SPEC) and relevance of the analysis.
The spectral data sets were pre-processed using mean centering, first derivative, second derivative, smoothing, and standard normal variate, and the resulting combinations before employing multivariate data analysis approaches.
23
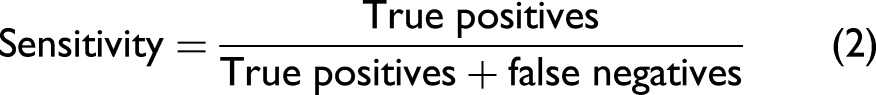
PCA models were created using mean-centered data, whereas PLS-DA models were created using pre-treatment combinations. To determine the model's reliability, the sensitivity (SENS), SPEC, and accuracy of the models were determined. SENS, which reflects the number of properly identified positives, was calculated as the ratio of true positives to the sum of true positives and false negatives, as shown in Eq. 2. The ratio of true negatives to the sum of true negatives and false positives was used to compute SPEC, as stated in Eq. 3. The accuracy of the PLS-DA was calculated using Eq. 4:


Results and Discussion
The Vis-NIR range spectra obtained for the olive, green, and red dyed cotton samples can be seen in Figures 3a and 3b, 3c and 3d, and 3e and 3f, respectively. It is obvious that the reflectance profile of olive dye begins from 23 to 32% in the Vis range and reaches up to 50–58% in the NIR band. A similar trend can be seen for green and red colorants. The results suggest that NIR-dyed fabrics match the NIR reflectance, however, there is a variation in their reflectance behavior in the Vis band.
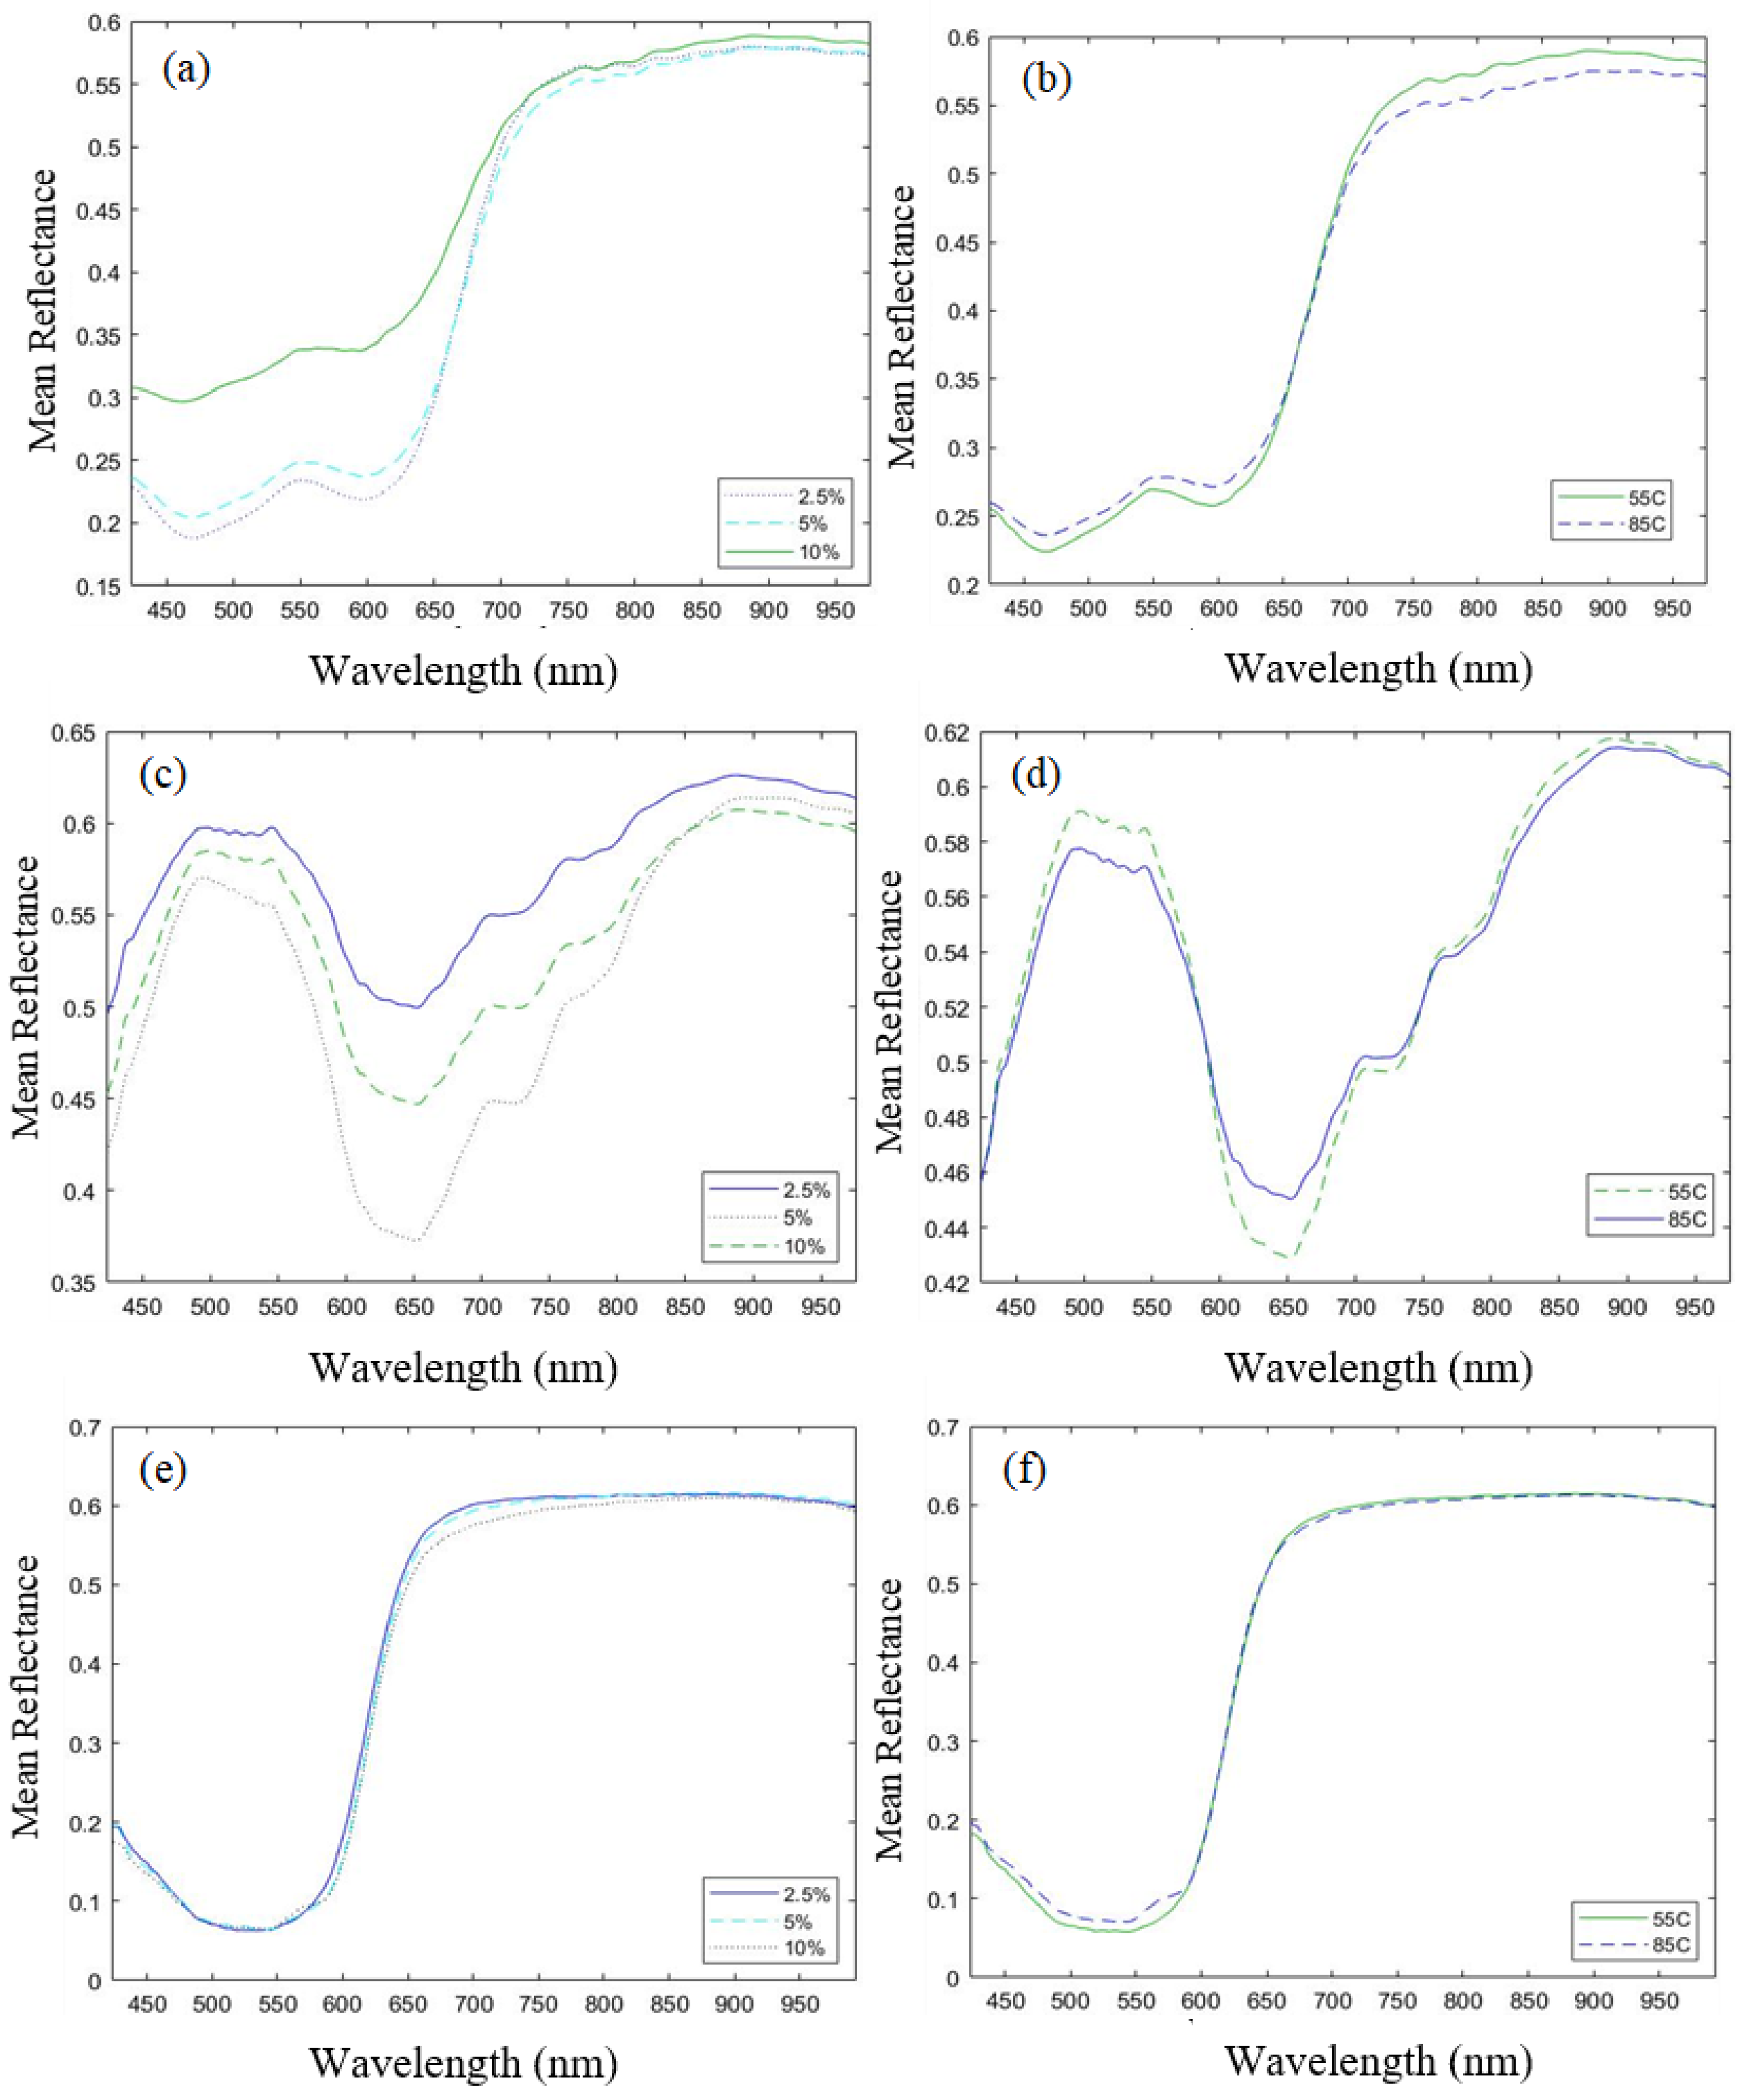
Mean spectra in the Vis-NIR region for olive dyed cotton cloth based on (a) the concentration of dye and (b) the temperature of dyeing; for green dyed cotton cloth based on the (c) concentration of dye and (d) the temperature of dyeing; for red dyed cotton cloth based on (e) the concentration of dye and the (f) temperature of dyeing.
Principal Component Analysis
Visual observation of the mean spectra illustrates that the reflectance values for the pigment-based (green) dye remarkably varied in response to differences in the concentration and the temperature of dyeing as compared to powdered dyes (olive and red). Significant peaks were observed for the olive and red-dyed cotton cloth at 550 nm,24,25 whereas the cloth dyed with pigment showed a sharp peak at 650 nm. 4
To explore data trends, an unsupervised classification was conducted using PCA. Three different PCA models were developed in total, one for each type of dye. Prior to PCA, the spectral data were mean-centered, and Venetian blind cross-validation was used with nine splits of the data having 10 samples per blind. The first PCA model was developed for the olive-dyed cotton cloth, and the data were explored based on the dye concentration and the dyeing temperature. The PCA model explained 99.88% of the variance in the data, with PC1 capturing 94.11%, PC2 explaining 5.14%, and PC3 depicting 0.63% of the total variance. The scores plot revealed groupings of data based on the dye concentration along the PC1 axis, whereas groups based on the dyeing temperature were observed along the PC2 axis. Figure 4a shows the PC1 versus PC3 plot, which clearly depicts the separation of the sample scores based on the dye concentration, whereas Figure 4b depicts the groups based on dyeing temperature. Figure 4c shows the loading plots for the three respective PCs.
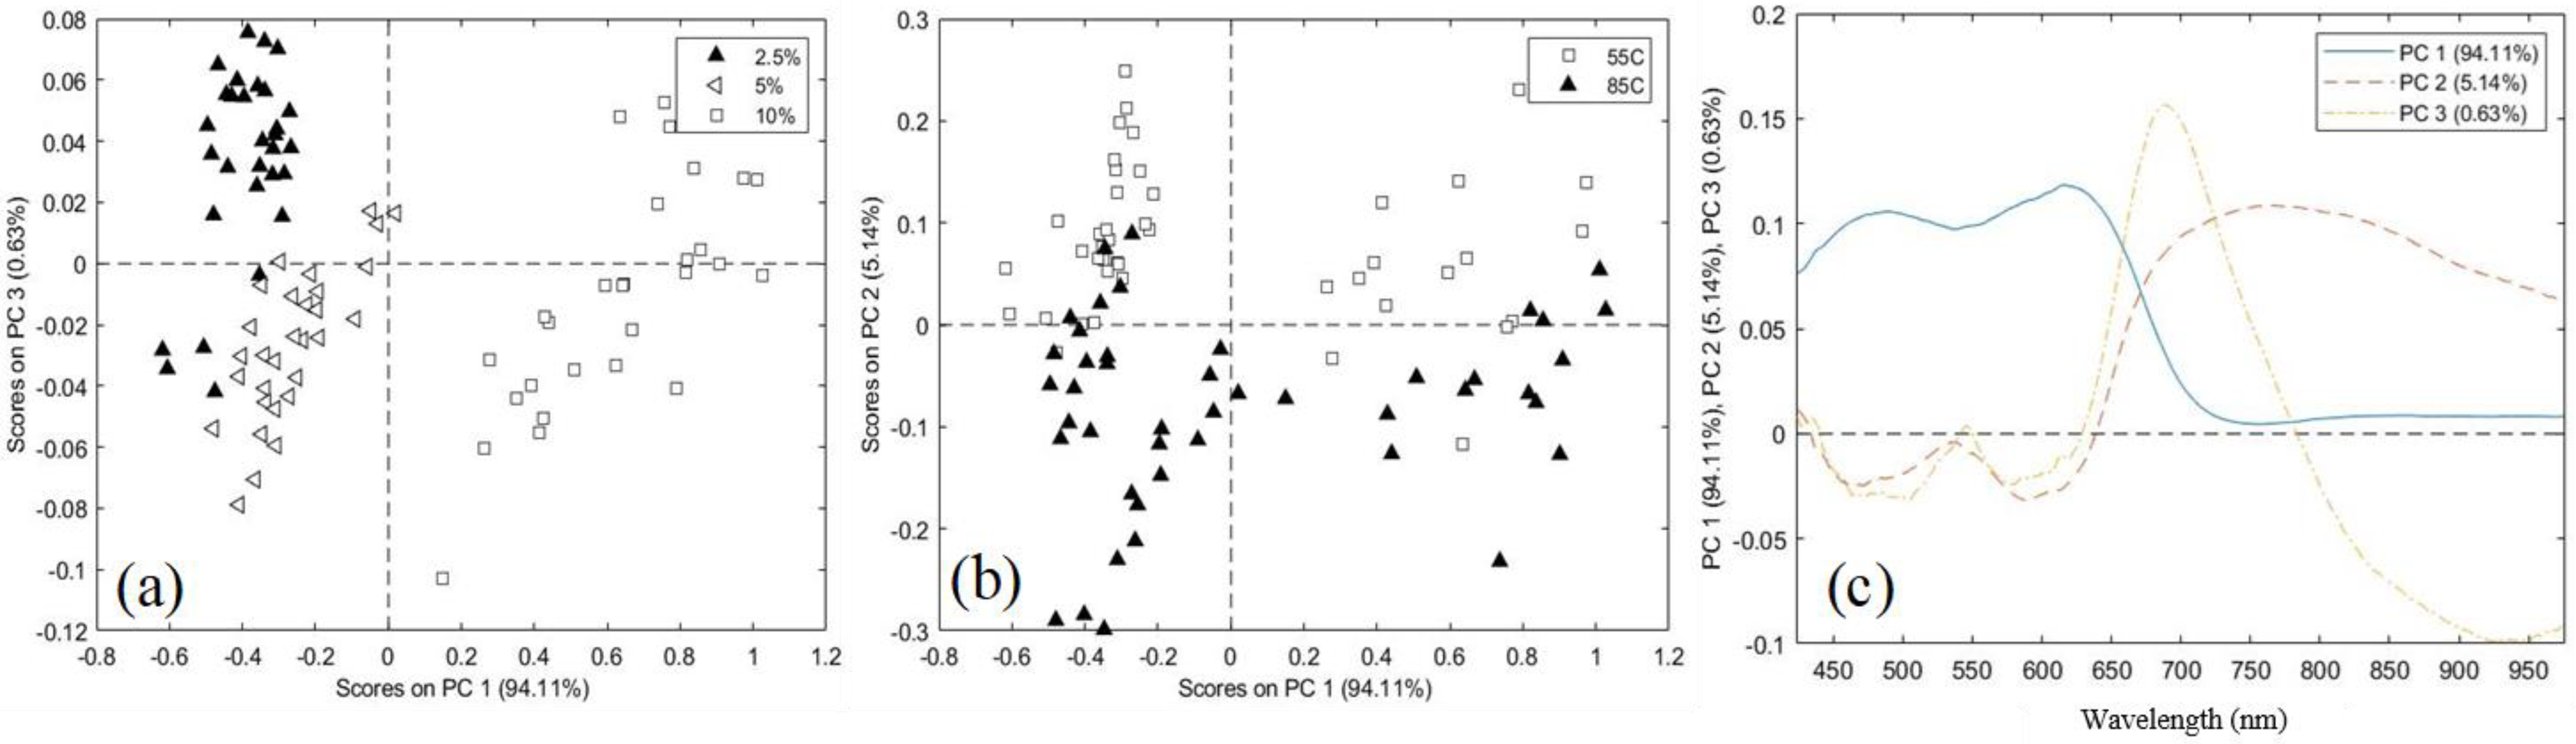
Scores plot for olive-dyed cotton samples: (a) based on the dye concentration, (b) dyeing temperature, and (c) loadings plot of the first three PCs.
The second PCA model was developed for the green pigment-based dyed cotton samples to check the difference in the NIR signature for the prepared samples. The model covered 99.85% of the variance in the data with PC1, PC2, and PC3 explaining 97.54, 1.84, and 0.47% of the total variance in the data. PC1 axis could group the samples of 2.5 and 5% concentration, whereas 10% concentration samples were distinguished by PC2 (Figure 5a). PC2 could discriminate the sample scores based on the temperature of dyeing (Figure 5b). The loading plot of the first two PCs is depicted in Figure 5c.
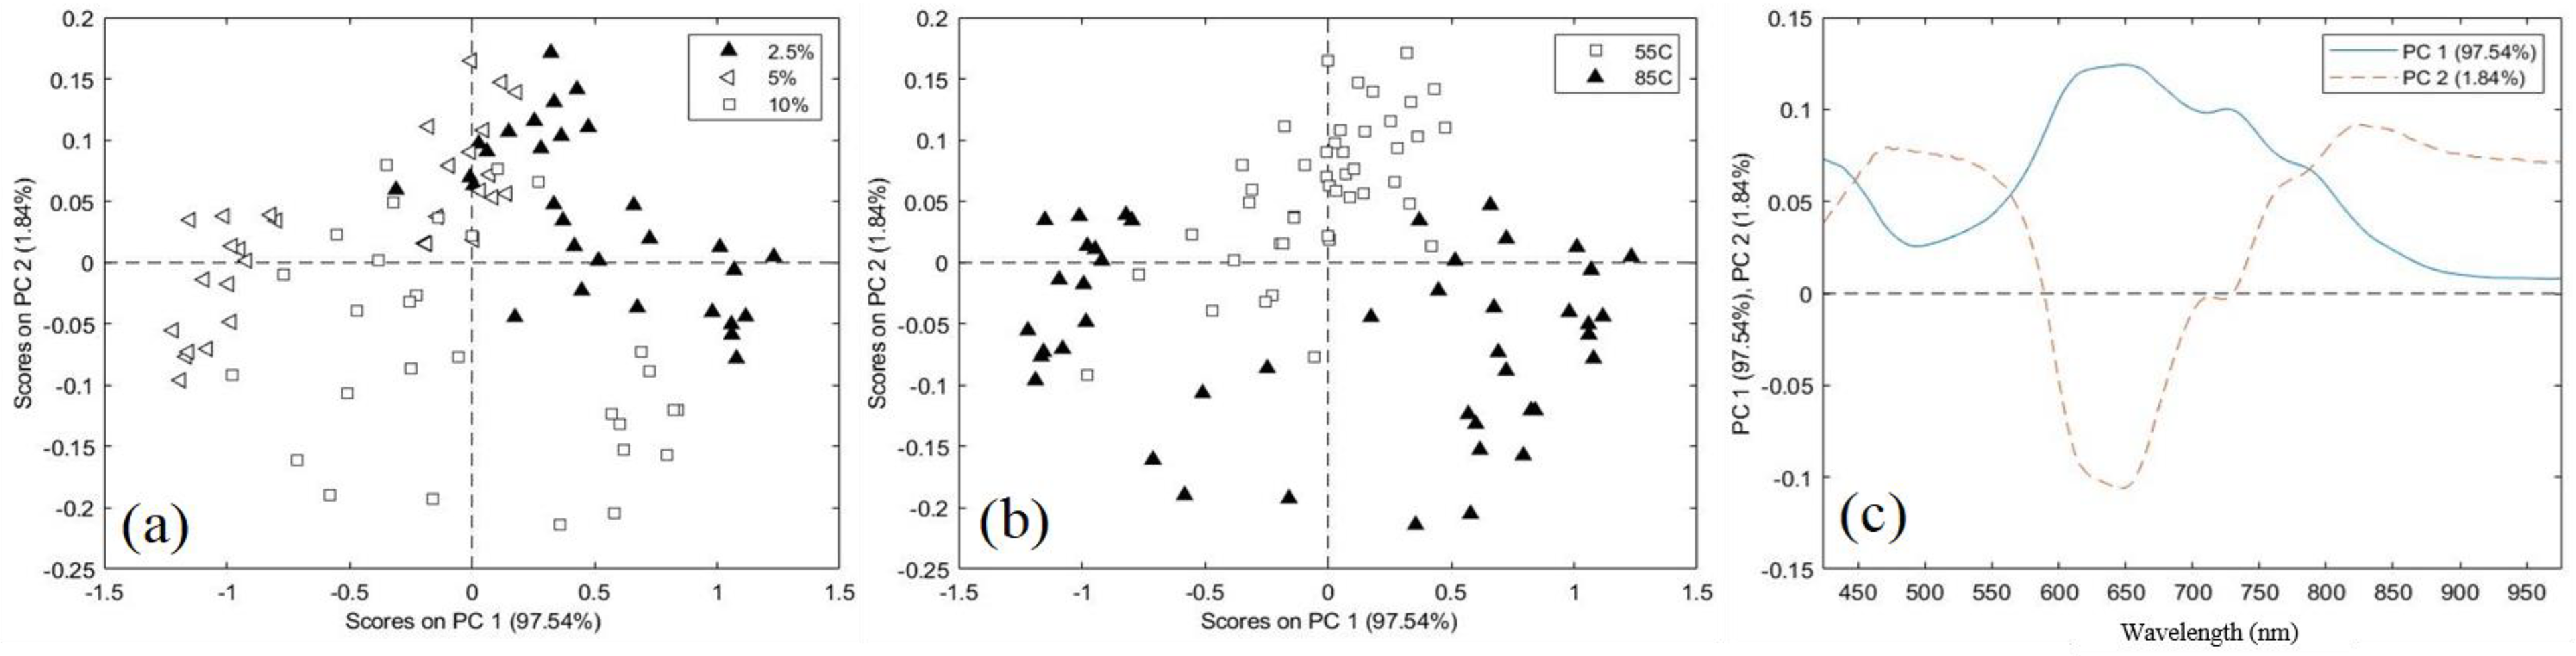
Scores plot for green-dyed cotton samples: (a) based on the dye concentration, (b) dyeing temperature, and (c) loadings plot of the first three PCs.
In the case of red-dyed cotton samples, the PCA model yielded five PCs that could explain 99% of the variance in the data set. Of the five PCs, PC1 (46.51%), PC4 (5.26%), and PC5 (1.82%) could group the sample scores based on the concentration of dye and temperature of dyeing. PC1 successfully discriminated the red-dyed samples with a dye concentration of 10% from those of 2.5 and 5%, whereas PC5 grouped the samples having dye concentrations of 2.5 and 5%. In terms of groups based on the temperature of dyeing, PC4 showed the potential to group the red-dyed sample scores along its axis. Figures 6a to 6c present the sample scores plots based on dye concentration, dyeing temperature, and the respective PC loadings plot.
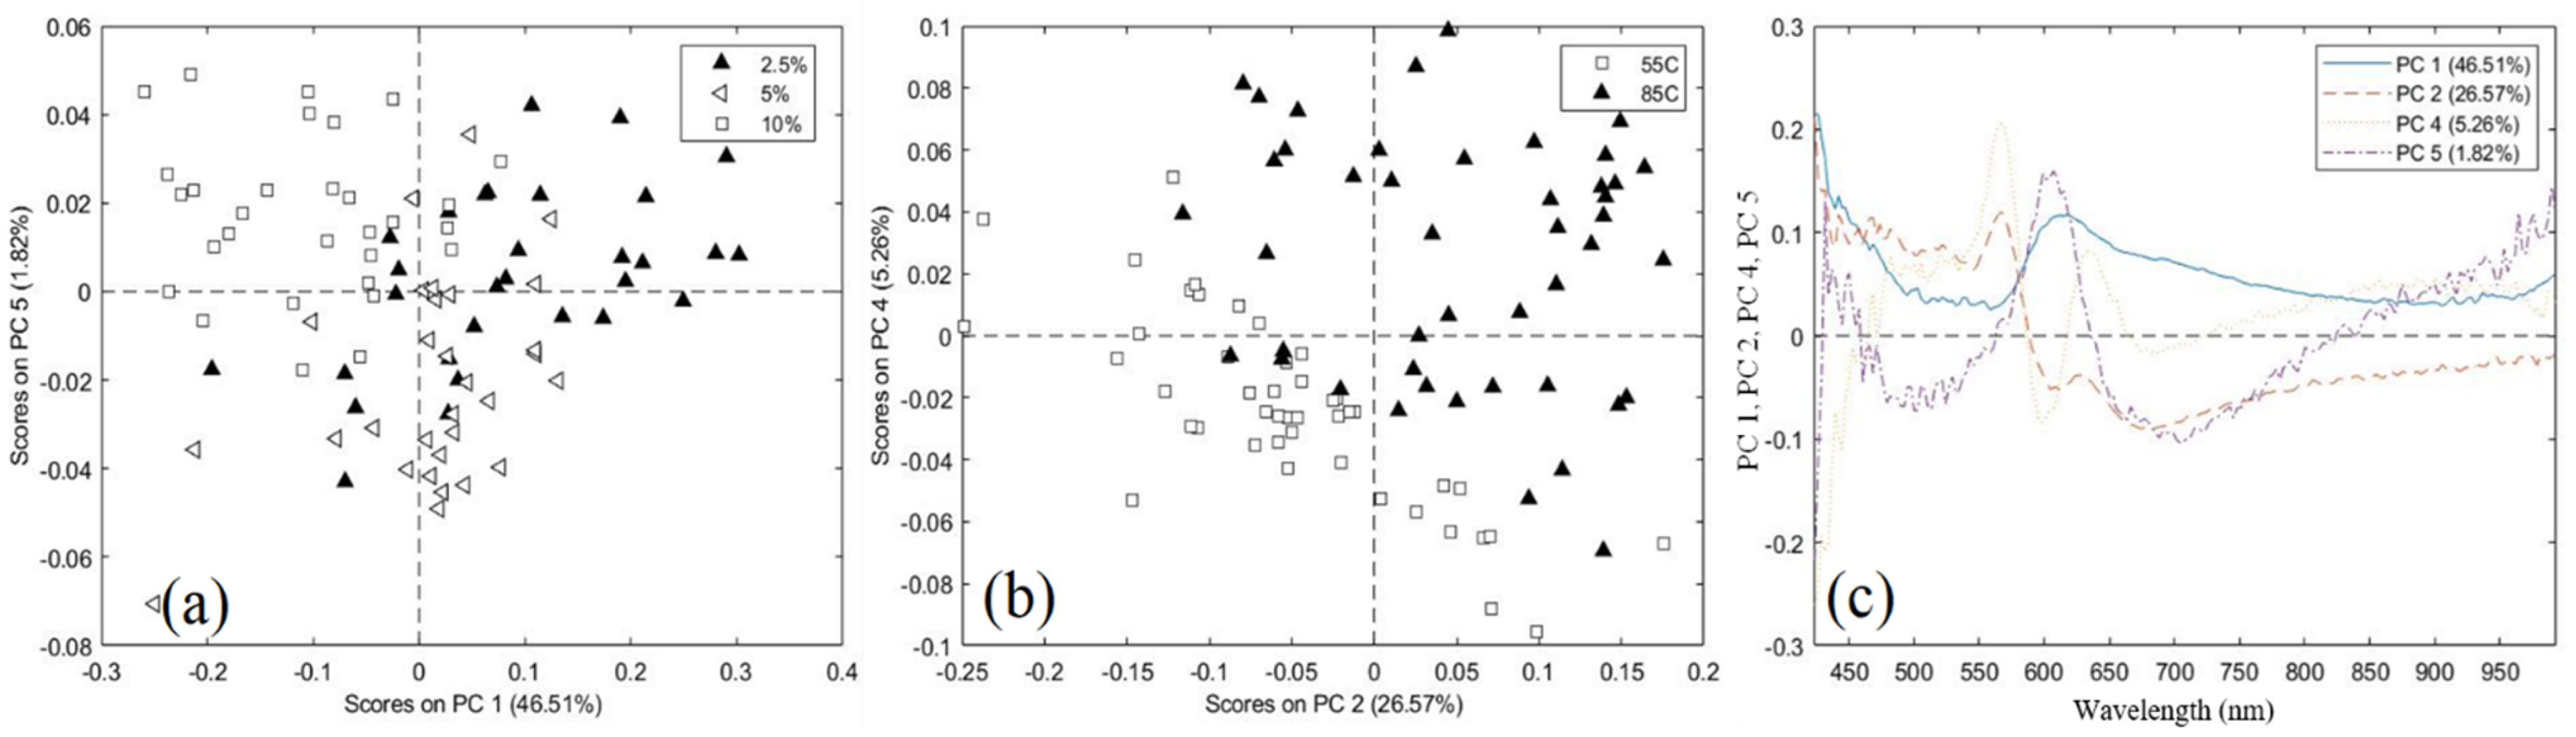
Scores plot for red-dye cotton samples: (a) based on the dye concentration, (b) dyeing temperature, and (c) loadings plot of PCs (PC1, PC2, PC4, and PC5).
Partial Least Squares Discriminant Analysis (PLS-DA)
Before the development of the calibration models, the data were split into calibration and validation sets using the Kennard–Stone algorithm. For the data set of 90 samples from each dye color, 63 samples were used for calibration and cross-validation, whereas 27 samples were used for external validation. In the case of the green-dyed samples, the PLS-DA classification model based on the dye concentration yielded four latent variables, explaining 98.07% covariance in the data in the Vis-NIR range. In this case, the spectral data were treated using mean centering, and a combination of mean centering and Savitzky–Golay (first- and second-derivatives). The best results in calibration and prediction were obtained for the spectral data processed with mean centering and Savitzky–Golay first derivative. The confusion matrix for the PLS-DA model statistics is shown in Table I.
Confusion matrix for green-dyed cotton samples based on dye concentration.
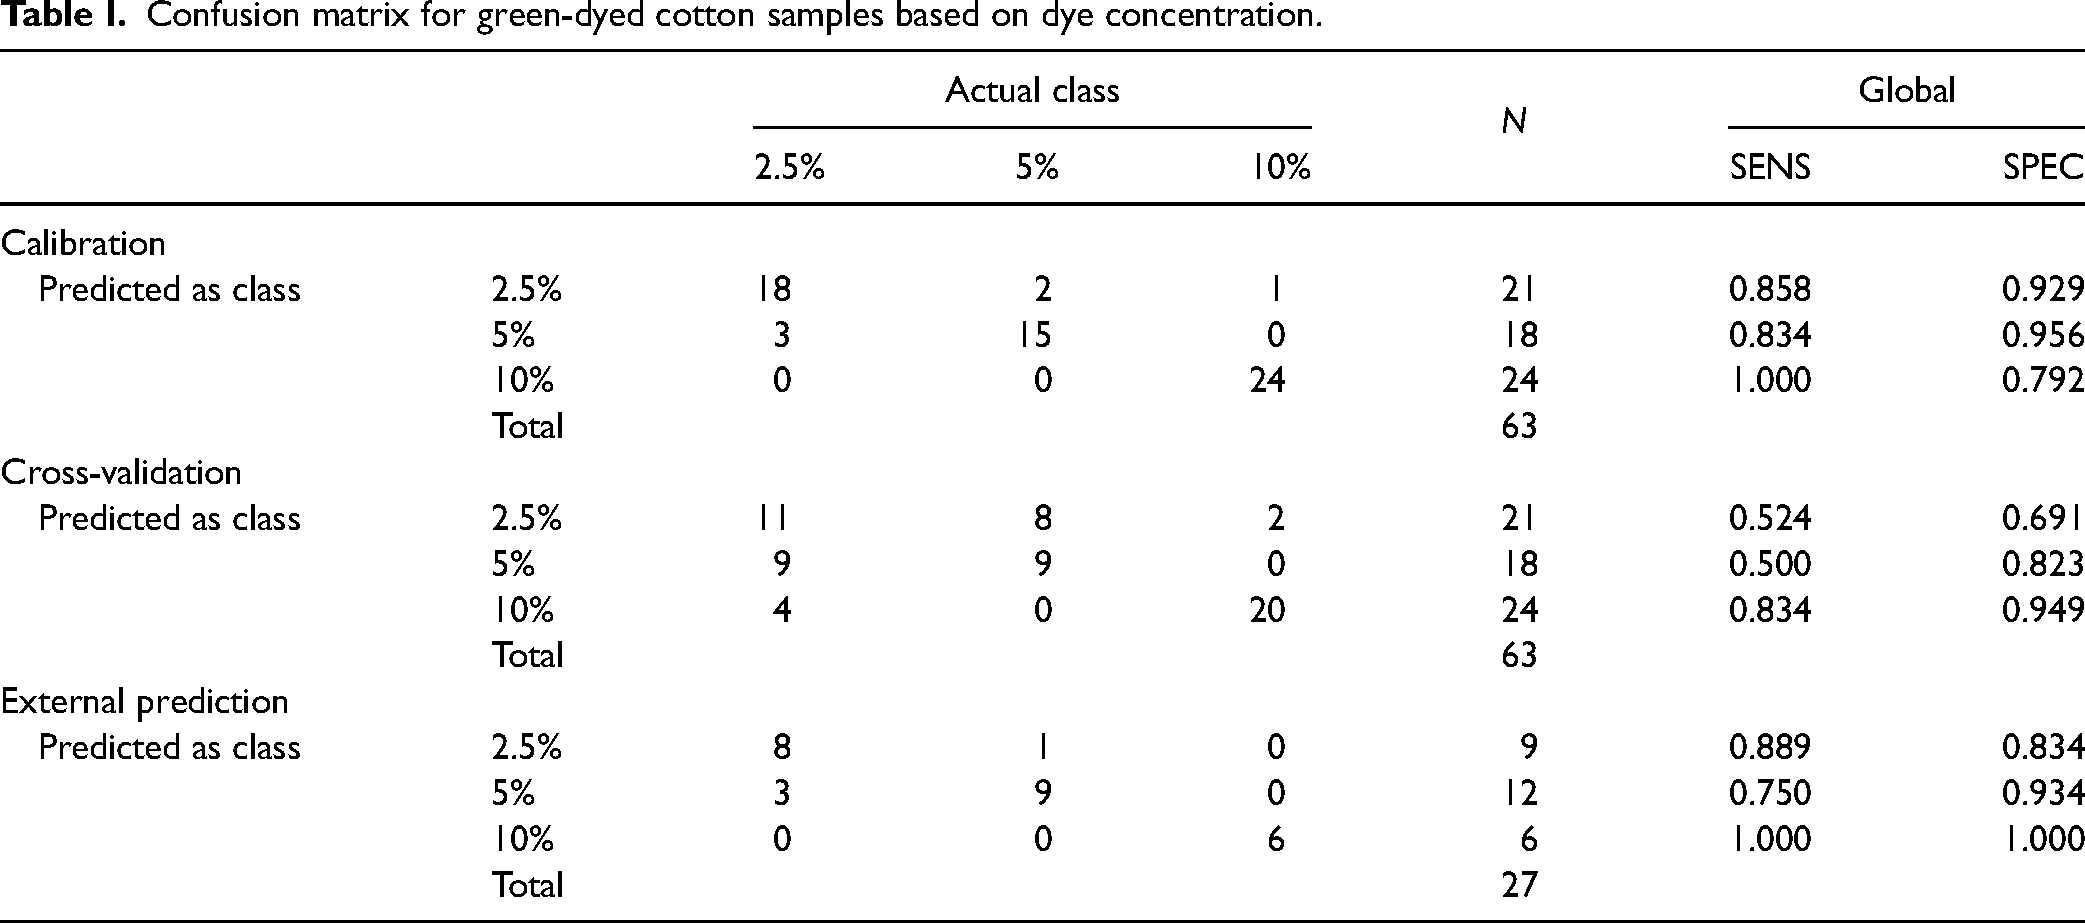
The scores for the classification model can be observed in Figure 7. It was concluded that the samples with 2.5% concentration dyed at 85 °C were misclassified as 5% dye concentration. Similarly, samples with 5% concentration dyed at 85 °C were discriminated, but the ones dyed at 55 °C were misclassified as 2.5% concentration. However, the classification for the 10% concentration class was highly accurate (100%) for both dyeing temperatures.
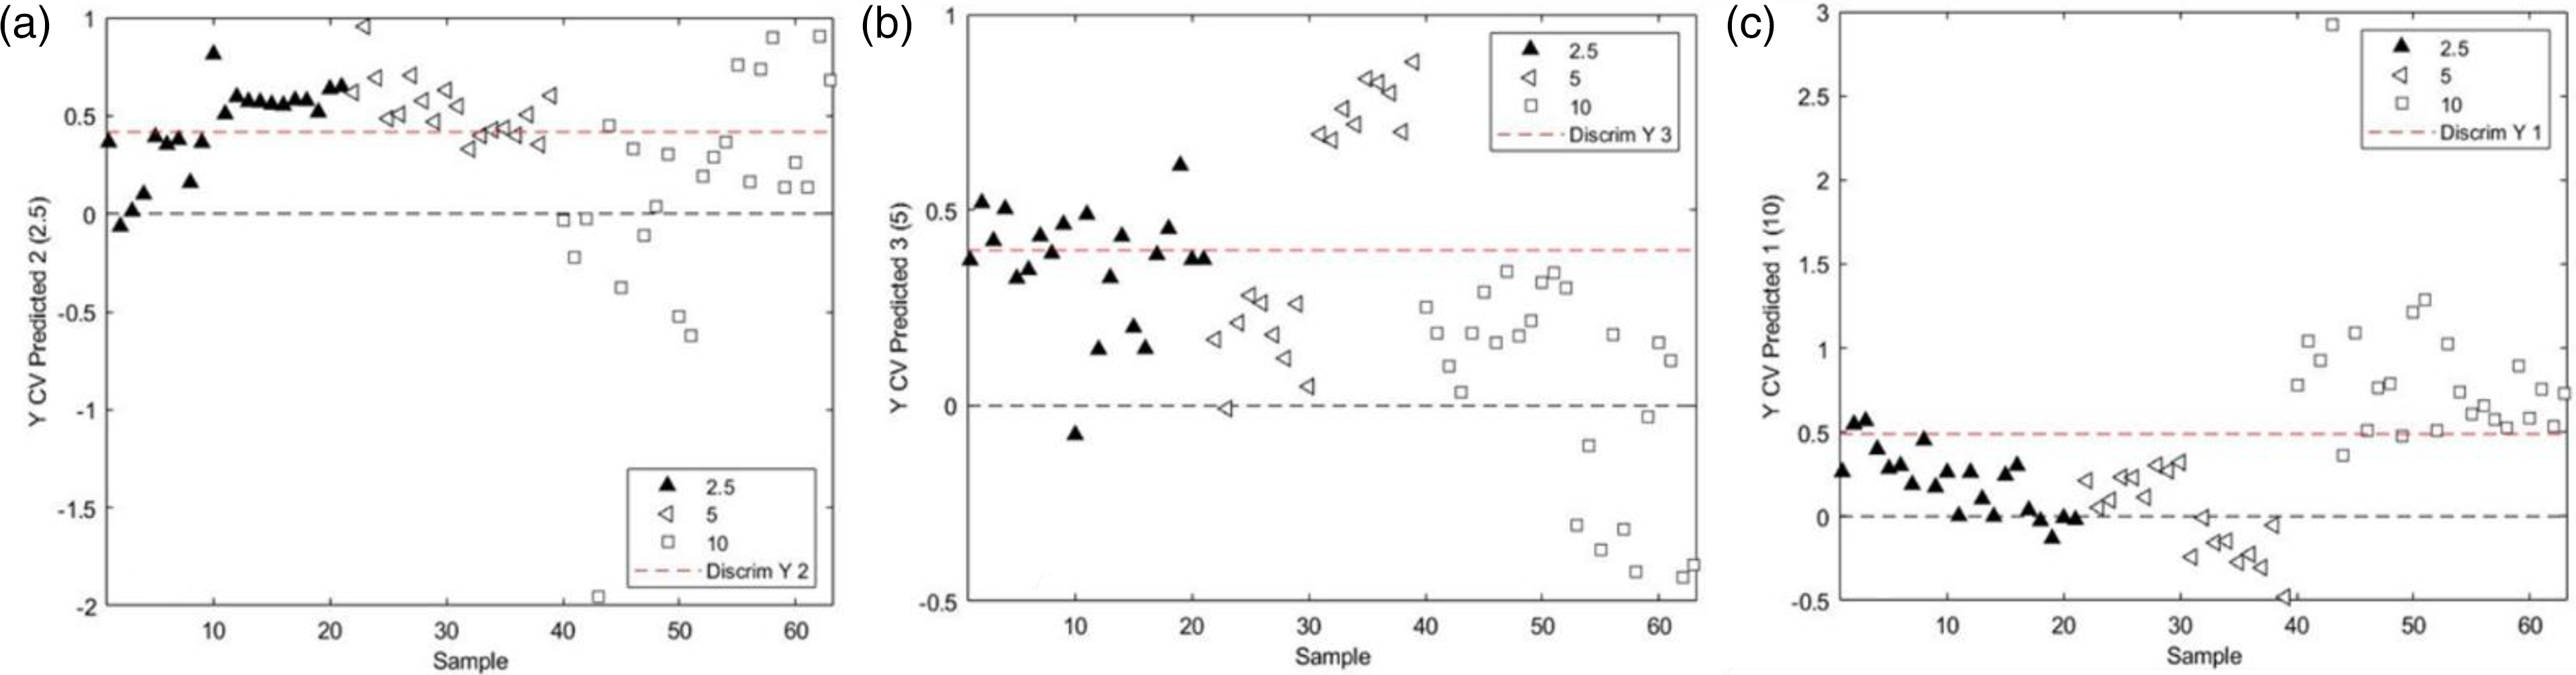
Partial least squares discriminant analysis (PLS-DA) classification scores for green-dyed cotton samples based on dye concentration: (a) classification scores for concentration class 2.5%; (b) classification scores for concentration class 5%; and (c) classification scores for concentration class 10%.
The next PLS-DA model for the green-dyed cotton samples was developed to classify samples based on the dyeing temperature in the Vis-NIR range. Herein, data pre-processed using mean centering provided the most reliable results in calibration and prediction. The model yielded three LVs covering 99.80% of the total covariance, with the first LV explaining 96.52% and the second and third LVs explaining 2.70 and 0.58% of the covariance, respectively. The confusion matrix for the cotton samples based on dyeing temperature is shown in Table II.
Confusion matrices for green-dyed cotton samples based on dyeing temperature.
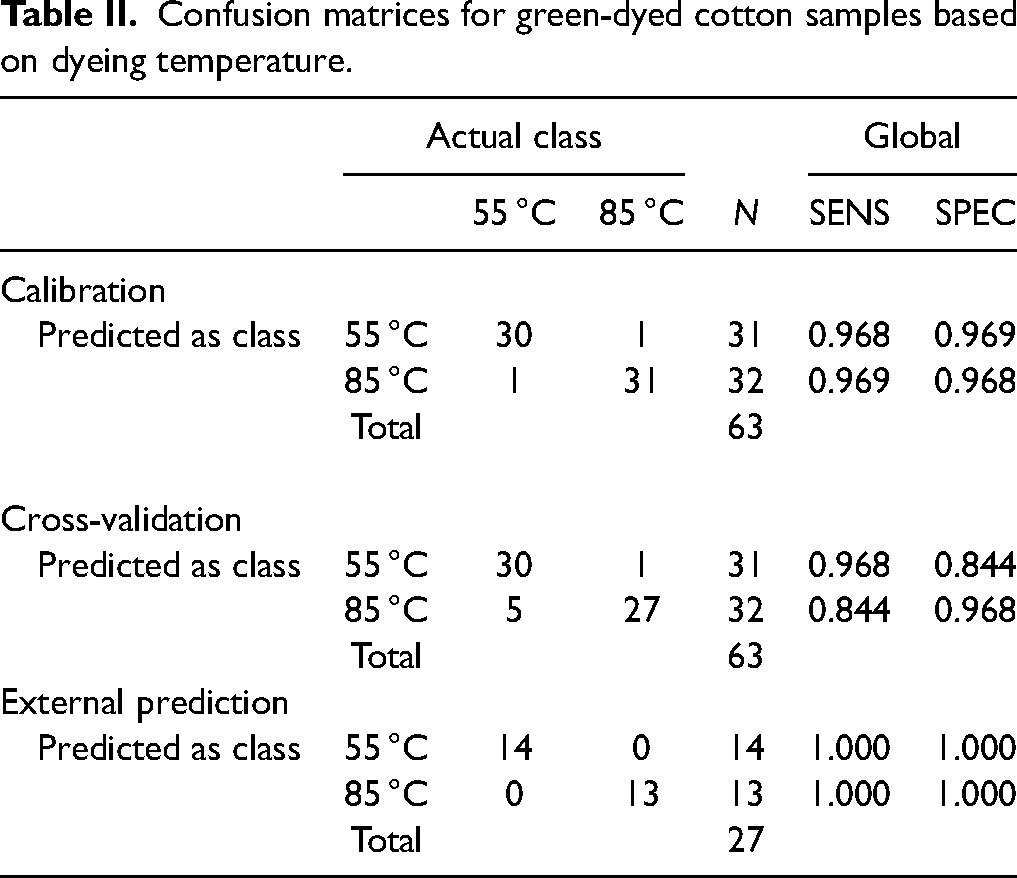
Of the 63 samples in the calibration data set, 31 were dyed at 55 °C and 32 at 85 °C. As shown in Table II, the classification of cotton samples based on dyeing temperature achieved high accuracy in calibration, cross-validation, and prediction. One sample from each class was misclassified, resulting in SENS values of 0.968 and 0.969 for both 55 and 85 °C dyeing temperatures, respectively. However, in the external prediction, the classification accuracy was 100% for both classes. The scores plot for the PLS-DA model is shown in Figure 8a. Figure 8b shows the temperature scores false-colored by dye concentration. It can be observed that PLS-DA possesses the capability to discriminate the dyed-cotton fabric based on the method of dyeing.
Partial least squares discriminant analysis (PLS-DA) classification scores for green-dyed cotton samples based on dyeing temperature.
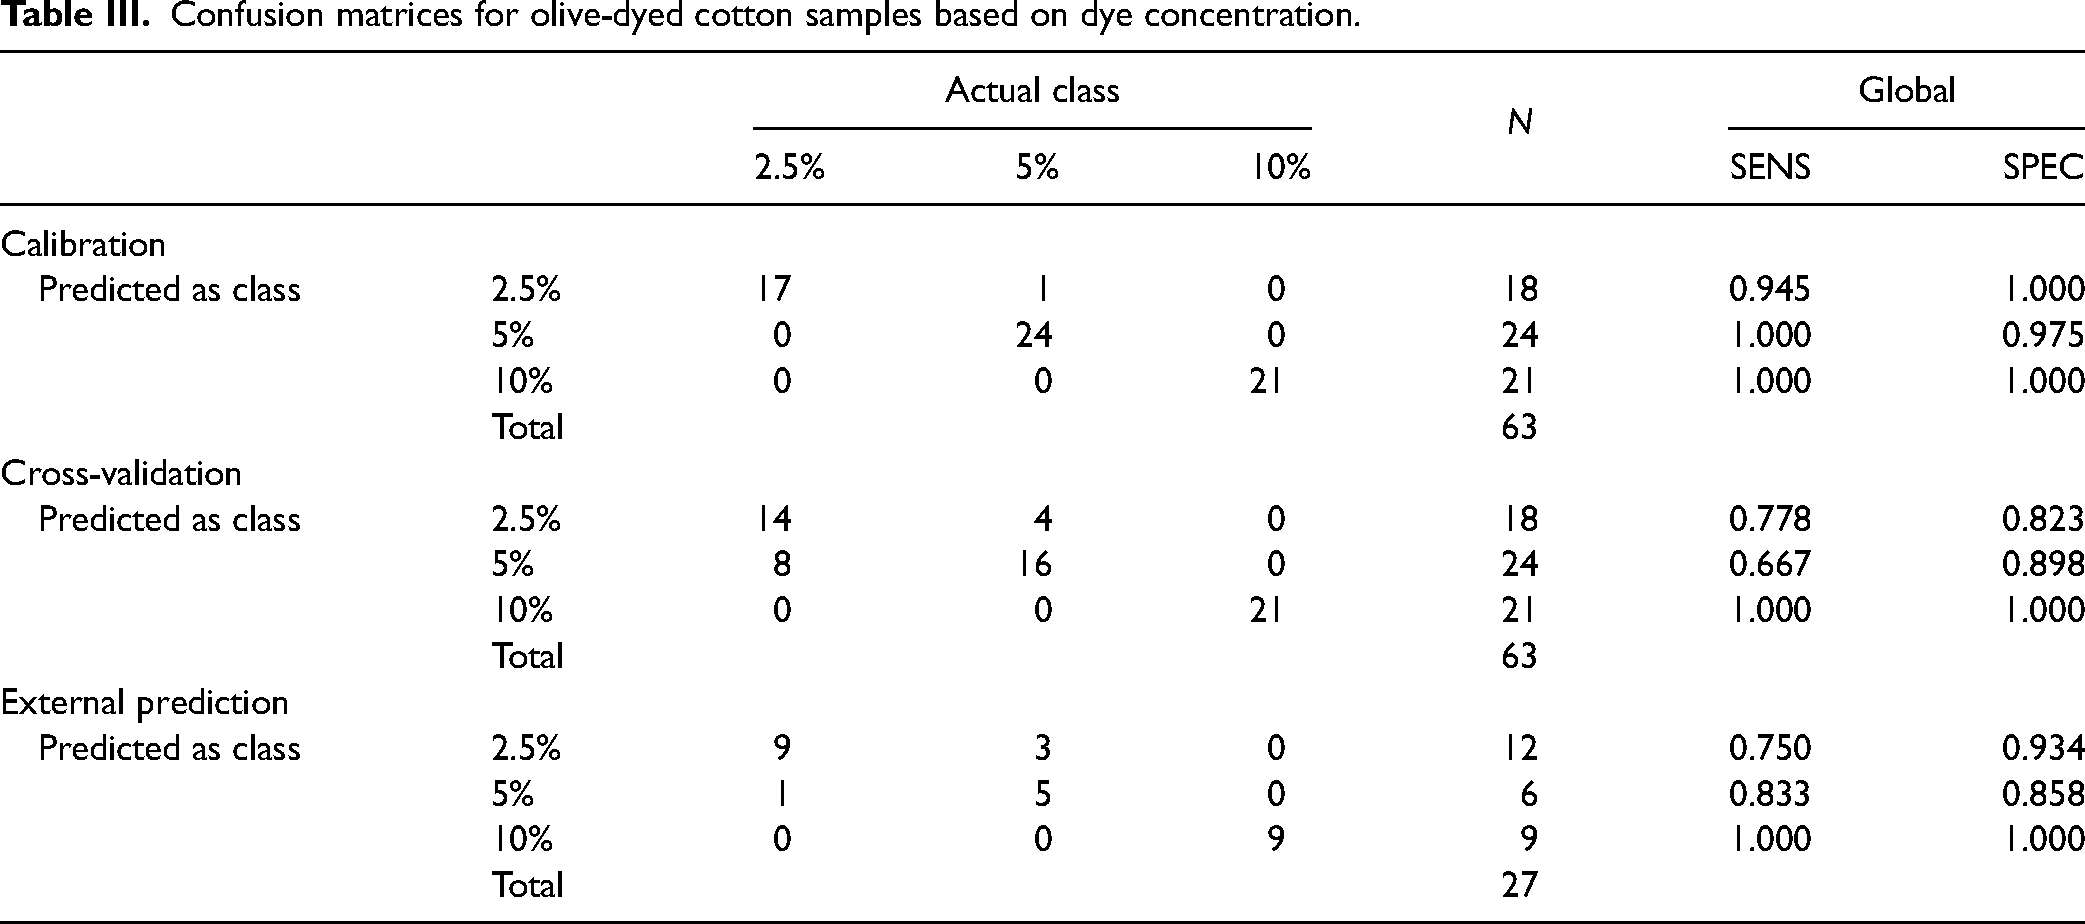
For olive-dyed cotton samples, the classification based on the dye concentration yielded encouraging results with high SENS values in calibration, cross-validation, and prediction. The model with spectral data pre-processed using mean centering provided the best results. This model resulted in three LVs, explaining a total of 99.90% of the total covariance in the data. The highest covariance (94.30%) was explained by the first LV, followed by the second and third LVs covering 4.52 and 1.08%. The confusion matrix shown in Table III describes the classification statistics of the PLS-DA model for the classification of olive-dyed cotton samples based on dye concentration. For the calibration set, the samples belonging to 5 and 10% dye concentrations depicted 100% classification accuracy. Even the samples with 2.5% dye concentration had only one sample misclassified as 5% concentration. However, for external prediction, the classification accuracy was lower for samples belonging to the 2.5% dye concentration class, where three samples out of 12 were misclassified as 5% concentration. A similar trend was observed in the cotton samples dyed with green pigment, where a higher misclassification was observed between the 2.5 and 5% dye concentrations.
Confusion matrices for olive-dyed cotton samples based on dye concentration.
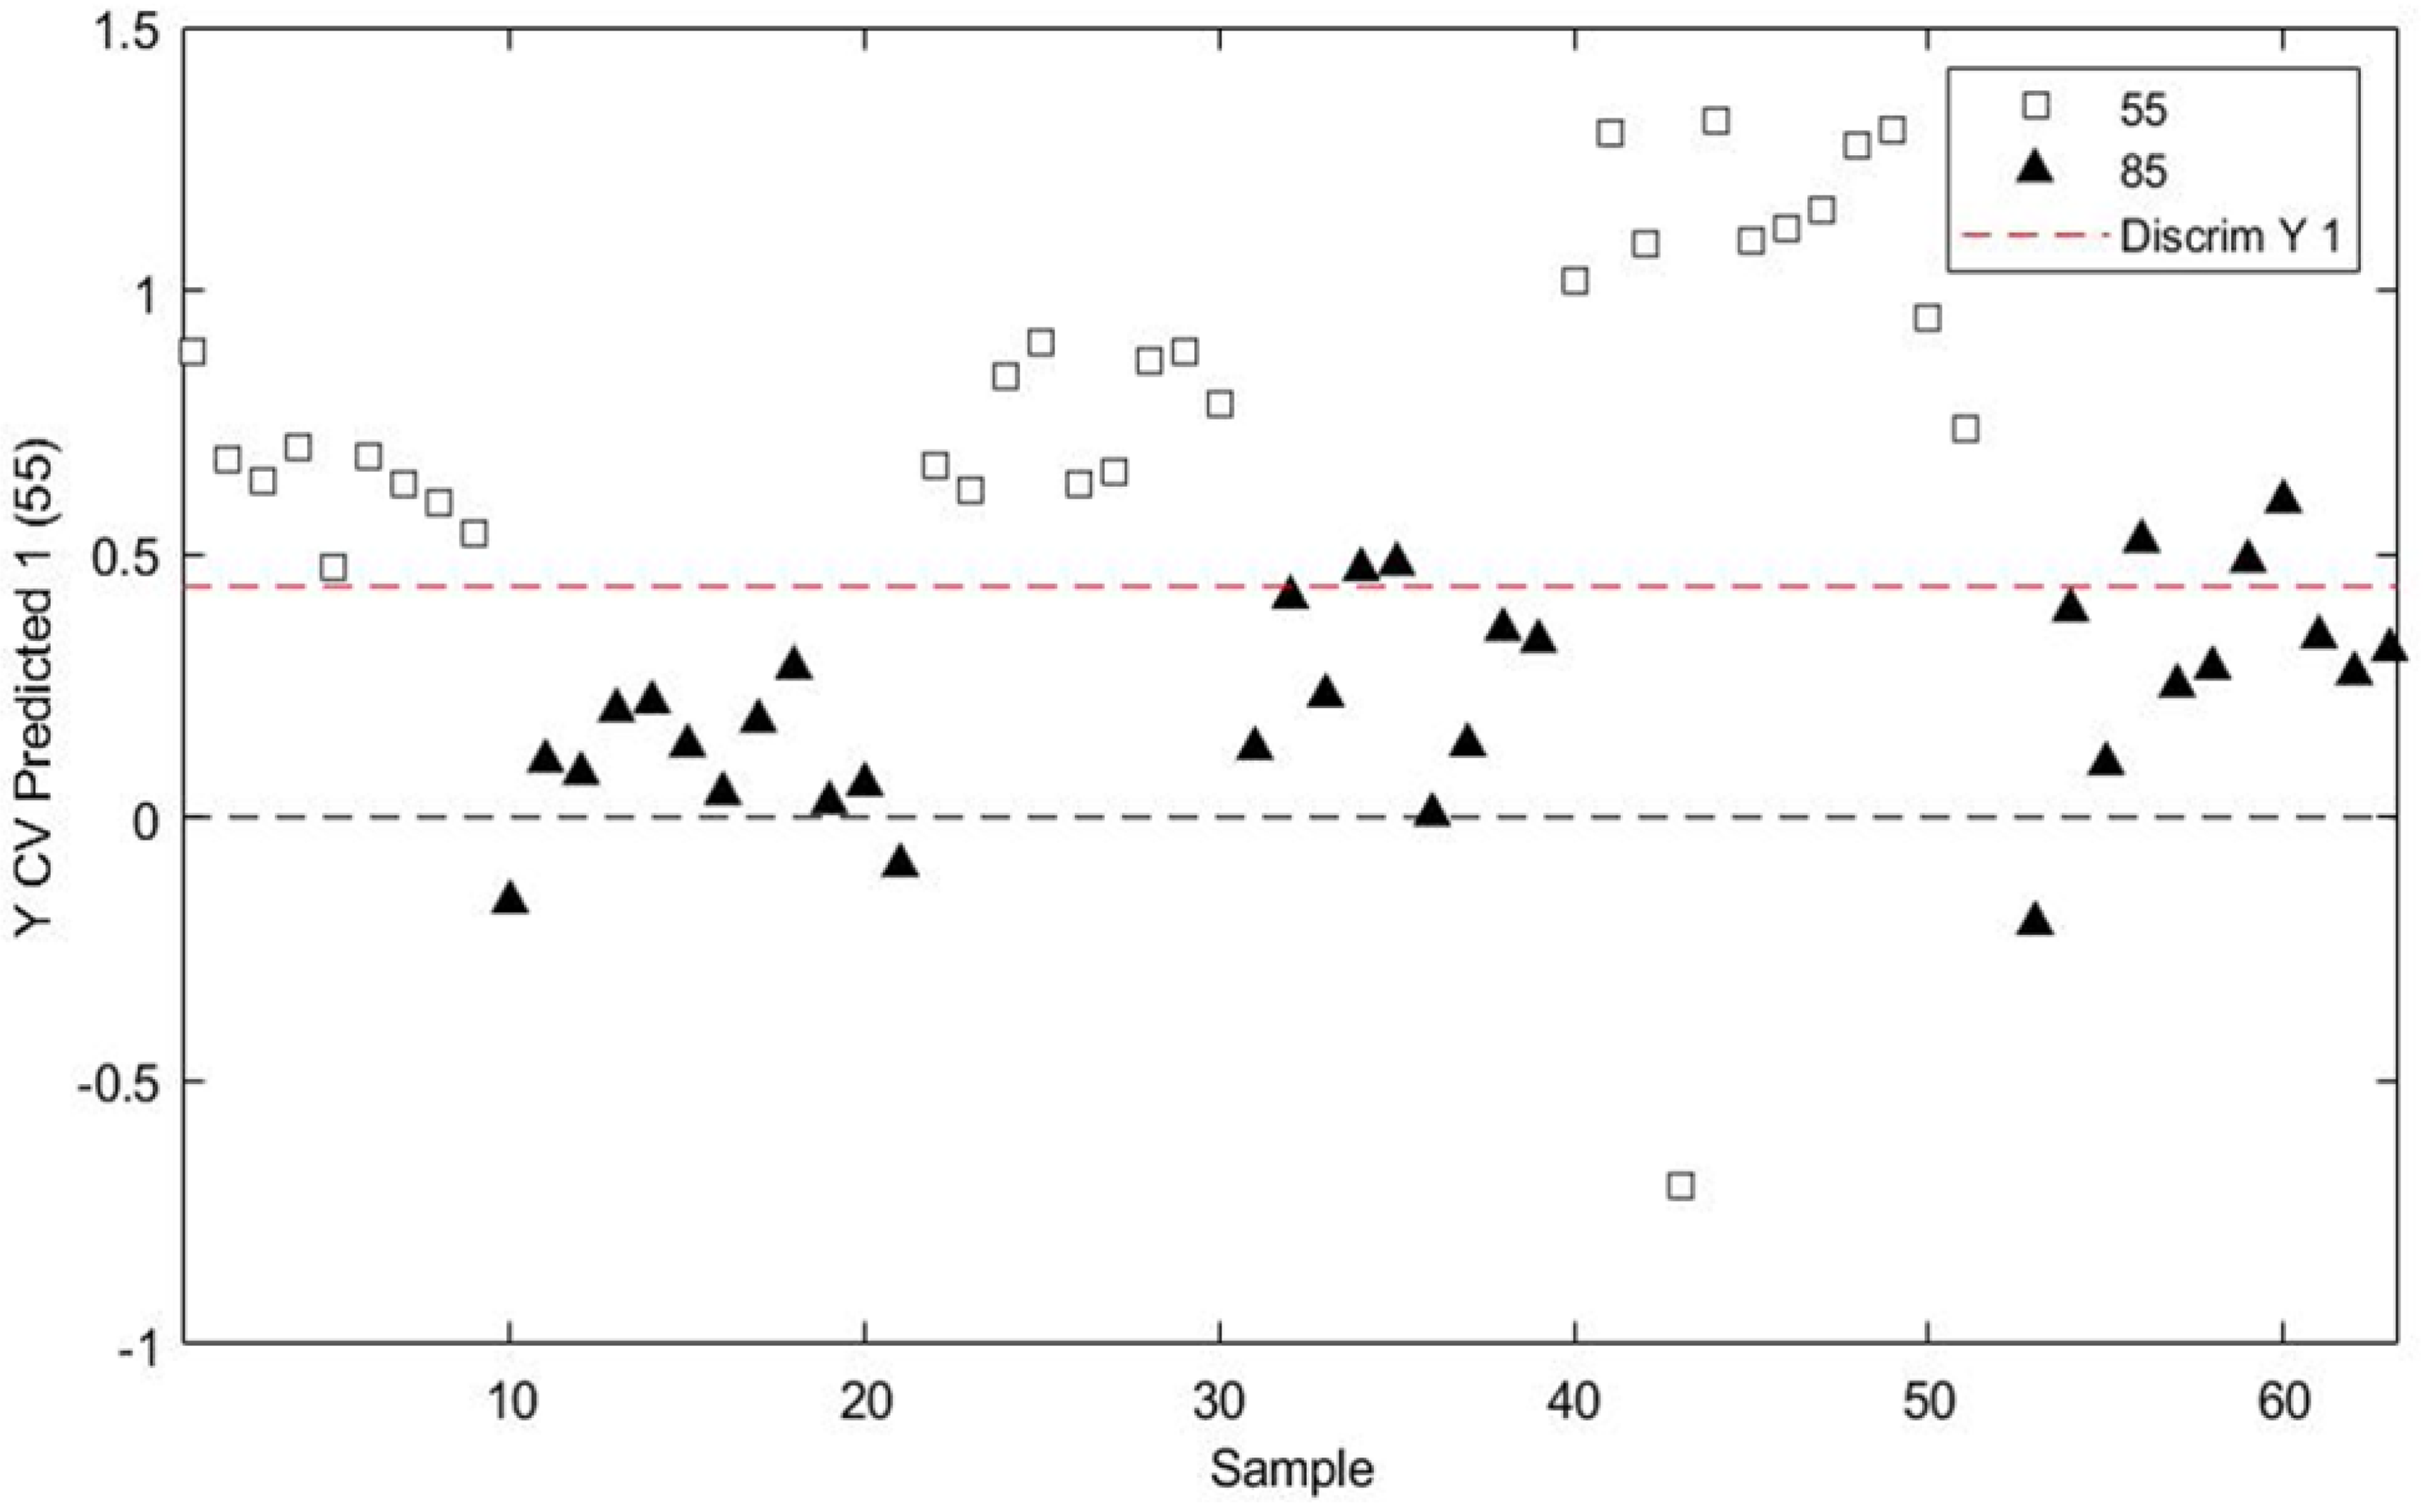
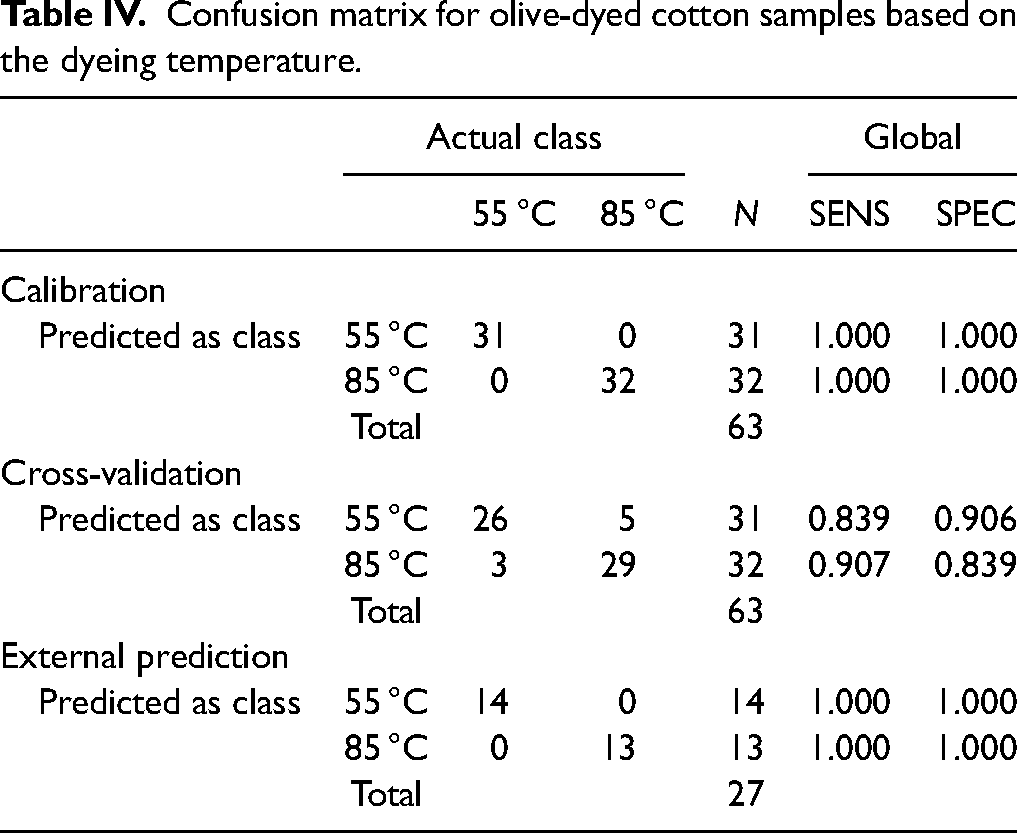
The PLS-DA model developed for classifying olive-dyed cotton samples based on the dyeing temperature yielded three LVs explaining 95.19% of the total variance in the data. The model with spectral data pre-treated using mean centering followed by the first derivative yielded the best classification. In calibration and external prediction, 100% of the samples dyed at 55 and 85 °C were correctly classified. Table IV shows the classification statistics for the PLS-DA model based on dyeing temperature. Out of a total of 63 samples in calibration, none of the samples were misclassified. In cross-validation, only three samples dyed at 55 °C were misclassified as 85 °C and five samples from the 85 °C class were misclassified as 55 °C ones. In terms of external prediction, 100% classification accuracy was achieved.
Confusion matrix for olive-dyed cotton samples based on the dyeing temperature.
The PCA and PLS-DA models were also developed in the SWIR range, but the results were unsatisfactory. The supervised classification models yielded classification accuracies of ∼50% and, thus, were not presented. The results of the red-dyed samples were not satisfactory in the case of PLS-DA models, therefore, only the PCA model for this particular dye has been reported.
The shortcomings of SWIR in discriminating textiles have been reported in the literature. Blanch-Perez-del-Notario et al. 26 found that while Vis-NIR was effective in textile identification, SWIR failed due to its susceptibility to agnostic color influence. In the current research, we observed only a 50% classification accuracy in SWIR, which may be attributed to the transparent nature of the woven cotton fabric used. The cotton fibers have a diameter of 20 μm, and the fabric weighs 98 g/m2, resulting in relatively large gaps that are even visible to the naked eye. These gaps allow for transmission and consequently result in lower reflectance values, as reflectance measurements depend on the ratio of the area covered by gaps to the remaining area of the fabric. Furthermore, in SWIR, the MCT detector used is extremely thin, causing functional issues with the fabric due to differences in lattice thickness. 27 Further investigations into the limitations of SWIR in dye identification were conducted by Leong 28 from the Naval Postgraduate School.
Results and Discussion
The extensive analysis conducted on the Vis-NIR spectra of olive, green, and red-dyed cotton cloth has brought forth some critical insights into the behavior and classification of the dyes based on concentration and dyeing temperature. The observed spectral peaks at 550 nm for olive- and red-dyed cotton and 650 nm for green-pigmented dye were key markers for differentiating the dyes. Unlike the powdered dyes (i.e., olive and red), the pigment-based (green) dye showed remarkable spectral variation in response to changes in concentration and temperature. These peaks could be potentially valuable in developing real-time monitoring systems for dyeing processes.
Principal component analysis (PCA) allowed for a comprehensive understanding of the variance within the samples, with models explaining over 99% of the variance in all three dye types. The clear grouping of samples based on dye concentration and temperature obviates the underlying differences in physical and chemical properties, possibly affected by the molecular interactions within the dyes. The PLS-DA models’ high SENS and SPEC values demonstrate the technique's capability to classify the dyed cotton samples based on both concentration and temperature. Misclassifications between 2.5 and 5% concentrations in both green and olive-dyed samples might suggest that there is a narrow spectral difference at these concentration levels, warranting further investigation. Although it is challenging to segregate the differently dyed samples with the naked eye, the use of a hyperspectral line scanning system followed by PCA, and PLS-DA analysis clearly distinguished the samples based on the dyed variables with more than 95% accuracy. This supports the idea that the evaluation criteria for fabric samples dyed with NIR-absorbing dyes, specifically for military camouflage uniforms, should rely more on HSI than sensory evaluation through grayscale rating. The experiment provides new insights into comparing newly NIR-dyed fabric with those after pre-treatment, including colorfastness to light, washing, perspiration, and staining, with the help of an HSI system. This can pave the way for future experiments in which the development of rating systems can display the extent of colorfastness in dyed fabrics. Some areas for future investigation could include examining different textile materials, additional dye colors, and other dyeing techniques. Furthermore, exploring the causes of misclassification between certain concentration levels might lead to new understandings of the dyeing process at a molecular level. The results from this study might find immediate application in quality control within the textile industry. The developed models could be part of an automated, non-invasive inspection system to ensure dyeing consistency. The effectiveness of NIR-dyed fabrics in military camouflage, showing their ability to maintain consistent spectral signatures despite varying dye concentrations and temperatures has been demonstrated. This ensures effective concealment in the NIR spectrum, highlighting their potential for advanced stealth applications in military textiles. Some areas for future investigation could include the examination of different textile materials, additional dye colors, and other dyeing techniques. An analysis of how different dye concentrations and temperatures impact the environmental sustainability of the dyeing process could be another valuable extension of this research.
Conclusion
In conclusion, this study highlights the significant potential of NIR dyes in military camouflage applications, with their favorable interaction with NIR light proving crucial for stealth operations. Through the use of Vis-NIR and SWIR HSI, it is possible to discern cotton fabrics dyed with NIR-absorbing dyes at different dye concentrations and dyeing temperatures. The study's findings reveal that PLS-DA models are particularly effective in the Vis-NIR range for classifying dyeing methods and distinguishing dye concentrations, outperforming their SWIR counterparts. This underlines the strategic importance of NIR dyes in maintaining uniform shade consistency, a key factor in camouflage effectiveness. This research opens avenues for the development of sophisticated multivariate models to assess dyeing parameters in other textiles such as nylon, and their blends, further advancing the field of military textile technology and contributing to enhanced stealth capabilities.
Footnotes
Declaration of Conflicting Interests
The authors declared no potential conflicts of interest with respect to the research, authorship, and/or publication of this article.
Funding
The authors received no financial support for the research, authorship, and/or publication of this article.