
Abstract
A wavenumber calibration protocol is proposed that replaces polynomial fitting to relate the detector axis and the wavenumber shift. The physical model of the Raman spectrometer is used to derive a mathematical expression relating the detector plane to the wavenumber shift, in terms of the system parameters including the spectrograph focal length, the grating angle, and the laser wavelength; the model is general to both reflection and transmission gratings. A fast search algorithm detects the set of parameters that best explains the position of spectral lines recorded on the detector for a known reference standard. Using three different reference standards, four different systems, and hundreds of spectra recorded with a rotating grating, we demonstrate the superior accuracy of the technique, especially in bands outside of the outermost reference peaks when compared with polynomial fitting. We also provide a thorough review of wavenumber calibration for Raman spectroscopy and we introduce several new evaluation metrics to this field borrowed from chemometrics, including leave-one-out and leave-half-out cross-validation.
This is a visual representation of the abstract.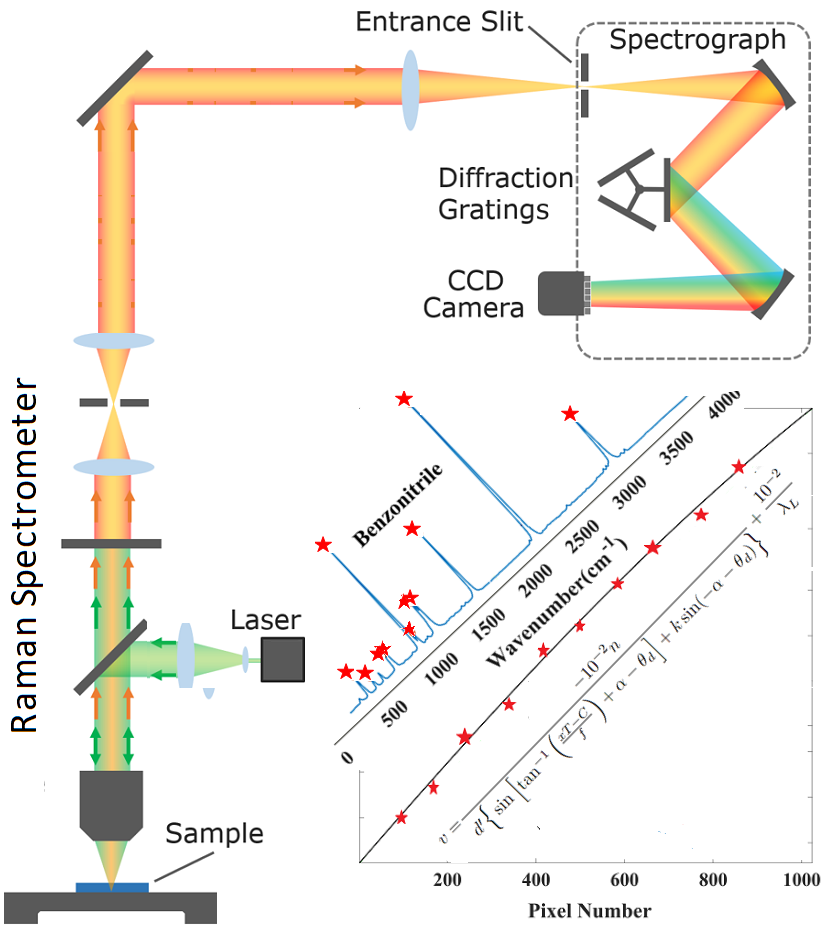
Keywords
Introduction
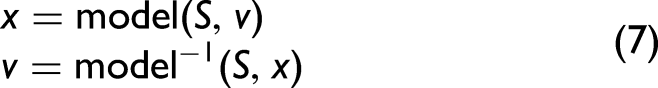
The objective of this paper is to develop a direct wavenumber calibration protocol for Raman spectroscopy (RS) that outperforms traditional methods. The concept is to build upon the conventional protocol of applying low-order polynomial fitting to the spectral peak positions of a wavenumber standard such as 4-acetamidophenol. We replace the typical polynomial fitting step with the fitting of a nonlinear function that represents the model of the optical system which is the spectrometer. This function is governed by the various parameters that describe the optical system such as the grating period and focal length and it is necessary to search over these parameters in order to find an optimal fitting to the available peak positions. Although the laser wavelength is one of the parameters, we believe the approach can be described as a “direct” protocol, because only an approximate value of the wavelength is required as input.
Raman spectroscopy (RS) probes the vibrational and rotational modes of molecules whereby laser photons scattered by the material have lost energy related to the energy of certain Raman-active molecular bonds present within the sample. RS can identify biomolecular changes within cells as they progress from a healthy to a cancerous state1–3 making it a powerful technique for the identification of cancer cells and tissue. Post-processing such as multivariate statistical analysis4,5 is typically applied to Raman spectra for classification, whereby statistical pattern recognition algorithms identify subtle changes across data sets that can be used to accurately differentiate between different pathological groups.1–3,6–11 One application of particular commercial interest is Raman guided surgery.12–14 Another emerging area of clinical research is automated Raman cytology.15–19
The development of the clinical application of RS is hindered by poor cross-instrument comparability, which has been highlighted by two recent multi-site studies,20,21 both of which demonstrate inconsistencies in the wavenumber shift for various materials even following established calibration protocols provided by the instrument manufacturer. Itoh et al. 21 examined spectra from polystyrene, benzonitrile, and cyclohexane obtained across 26 different systems from which they concluded that the wavenumber shift inconsistencies resulted from the instrumentation and calibration protocols and not from the materials samples. Guo et al. 20 found similar inconsistencies across 35 different instruments using acetaminophen, polystyrene, and cyclohexane. Cross-instrument differences relate to both wavenumber shift as well as intensity variation for the same sample, the latter being caused by the differing wavelength and polarization-dependent transmission function of each instrument and possibly differing instrument resolution as well as other potential causes. Wavenumber variation is generally attributed to small changes in the instrument resulting from thermal expansion or positional drift; instruments with motorized gratings are particularly susceptible to miscalibration. These studies have highlighted the need for further research into the cause of cross-instrument variability and for the availability of open-access standardized materials and calibration protocols that can be universally adopted.
There has already been some development of consensus standards for Raman instrumentation by the American Society for Testing and Materials (ASTM) international in relation to performance testing, calibration, and relative intensity correction (ASTM E1683,
22
E1840,
23
E2529,
24
and E2911
25
). An excellent review of these standards and the various calibration protocols are provided in the literature.26–28 Further information on reference materials certified by the Chinese and Japanese metrology institutes provides an expanded uncertainty over those by ASTM.
28
In summary, these standards relate to methods for spectral response correction and wavenumber calibration for a single instrument, and for evaluating the performance of the instrument in terms of resolution, stray light, sensitivity, etc. In the context of this paper, the most relevant of these standards is ASTM-E1840,
23
most recently updated in 2022, which focuses on Raman shift calibration. Included in this document are the Raman shift values for eight wavenumber standards including acetaminophen and benzonitrile, which we utilize in this study; these values were determined by eight independent laboratories and only the most stable peaks, standard deviation (SD)
All of the literature to date, on the subject of direct wavenumber calibration employs a low-order polynomial (typically of order 3) to fit the detector pixel and reference wavenumber shift pairs that are recorded from a reference standard; this polynomial provides the calibrated wavenumber shift axis. In this paper, we propose an alternative to polynomial fitting, which provides superior accuracy and precision, particularly in bands outside of the outermost peaks in the wavenumber reference spectrum. The method is based on deriving the relationship between wavenumber shift and detector pixel for an arbitrary Raman spectrometer based on the physical model, which is defined in terms of the system parameters including the spectrometer focal length, grating angle, etc. A search algorithm estimates the set of parameters that are optimal in terms of fitting the detector pixel and reference wavenumber shift pairs. The method is tested on hundreds of spectra recorded using four different systems with varying resolutions including a reflection Czerny–Turner spectrometer with a motorized grating as well as a low
It is important to acknowledge that the wavenumber calibration protocol proposed in this paper is directly related to our recently published paper that proposed a wavelength calibration protocol using much the same approach. 29 In that paper, the equation that describes optical propagation within the spectrometer was used to replace the third-order polynomial that is conventionally applied to fit to the peak positions in a neon spectrum. In this paper, we build on this in a simple manner by applying the wavenumber conversion formula to the aforementioned equation, providing a new equation that relates the Raman wavenumber shift to the detector pixel. This latter equation is then used to fit to the peaks of a wavenumber reference standard such as 4-acetamidophenol. The difference between the calibration routines in this paper and in Hennelly and Liu 29 is, therefore, only slight; the fitting equation, which although different in form, has only one extra parameter in the laser wavelength. Secondly, the reference spectra are Raman spectra of wavenumber reference standards instead of atomic emission wavelength reference lamps.
The breakdown of this paper is as follows: A physical model of the general Raman spectrometer is analyzed in the following section, and the relationship between wavenumber shift and detector pixel is derived; we also investigate what polynomial order would best fit this relationship, which has been a subject of debate in previous papers. Based on this relationship, an algorithm is proposed to replace polynomial fitting. A methods section provides a detailed step-by-step description of the overall calibration routine and the metrics used for accuracy/precision. Finally, results are presented, which are followed by a brief conclusion. We note that a Supplemental Information is provided that includes a comprehensive background section in which a thorough review of wavenumber calibration is provided that includes a comparison of the two approaches mentioned above. This Supplemental Information document also provides additional results and clarification that are referenced throughout the paper.
Relationship Between Wavenumber Shift and Pixel Position in a Spectrometer
Relationship Between Wavelength and Pixel Position for a Generalized Spectrometer with a Rotating Grating
We begin with the relationship between the wavelength of a point-source at the spectrometer slit, to the position of the image of this point on the array detector. The derivation of this expression has recently been published in Hennelly and Liu
29
and so we will present only a summary here. The derivation is general for both transmission and reflection gratings, and the calibration algorithm that builds on this and which appears in the next section can, therefore, be applied to spectrometers that employ both types of gratings. The relationship between the wavelength,
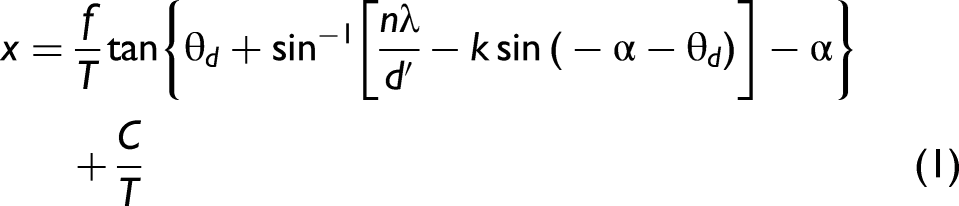
(a) Basic Raman spectrometer with epi-illumination; (b) A Czerny–Turner spectrograph with a rotating grating; the parameters shown in the illustration appear in Eq. 1 in the text; (c) a transmission spectrograph using a holographic grating. Both types of spectrographs are used in this study.
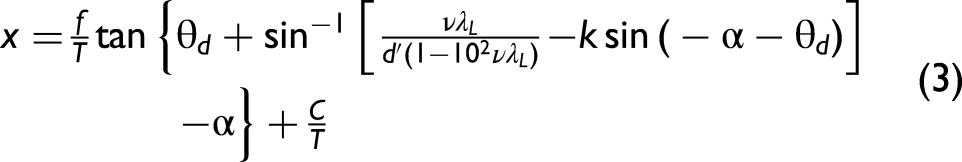
Relationship Between Wavenumber Shift and Pixel Position for a Generalized Spectrometer with a Rotating Grating
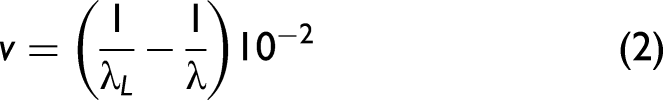
The wavenumber conversion formula is defined in Eq. 2 below:
Full details of these two spectrometers are provided in Hennelly and Liu.
29
For the purpose of this paper, it suffices to point out some key details and to provide the set of parameters for each system in Table I. The Czerny–Turner spectrograph (Andor Shamrock 500; SR-500i-A; Andor) is illustrated in Figure 1b; it used parabolic mirrors with a focal length of 500 mm and contains a motorized rotating grating with interchangeable reflection gratings of period, 300, 600, and 1000 lines/mm. A transmission spectrometer (HOLOSPEC-F/1.8I-VIS; Andor) is also investigated in this study, illustrated in Figure 1c. This lens-based system used volume-phase holographic transmission grating with 2455 lines/mm. The same detector is used for both cases: a cooled charge-coupled device (CCD; Andor iDus; DU420A-BR-DD; Andor) with
The parameters for the two spectrometers illustrated in Figure 1, which are investigated in this study. The laser wavelength was measured using a neon lamp.
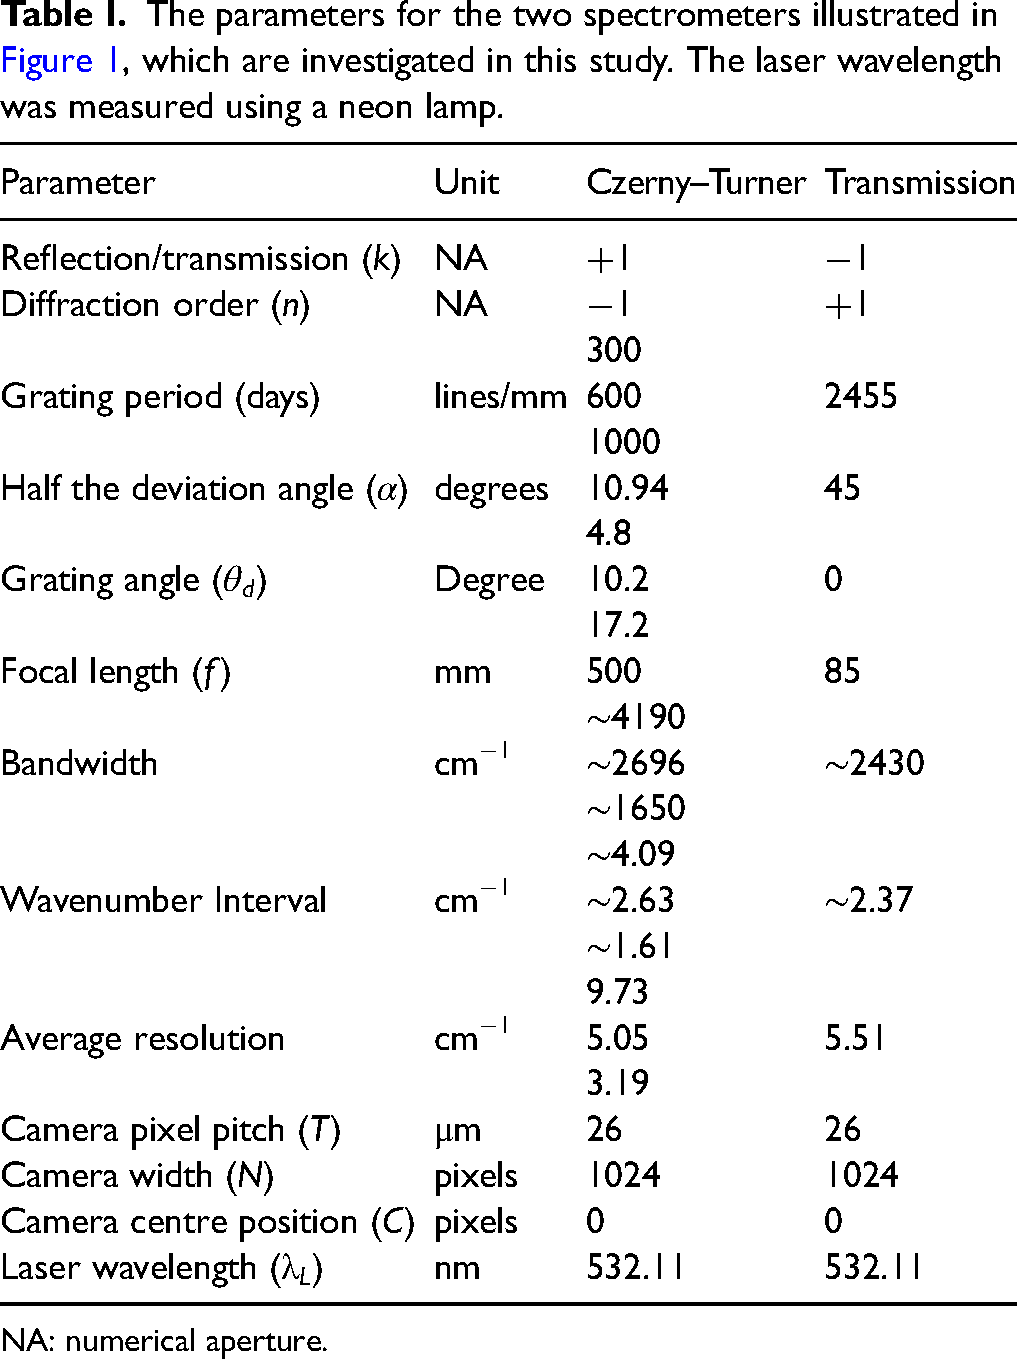
NA: numerical aperture.
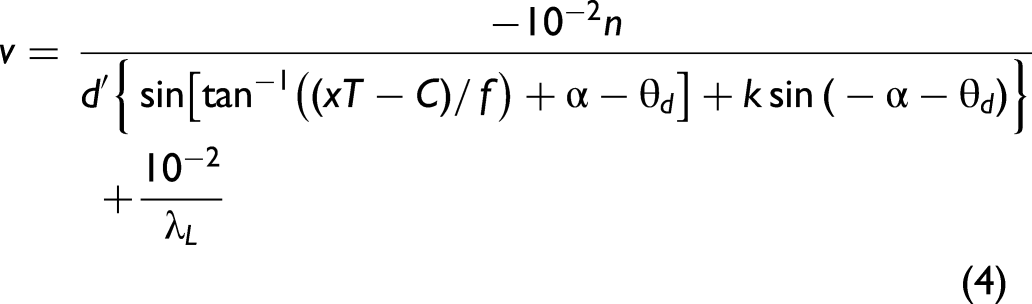
In order to elucidate the nonlinear relationship between wavenumber shift and pixel position for these Raman spectrometers, Eq. 4 is plotted for integer values of
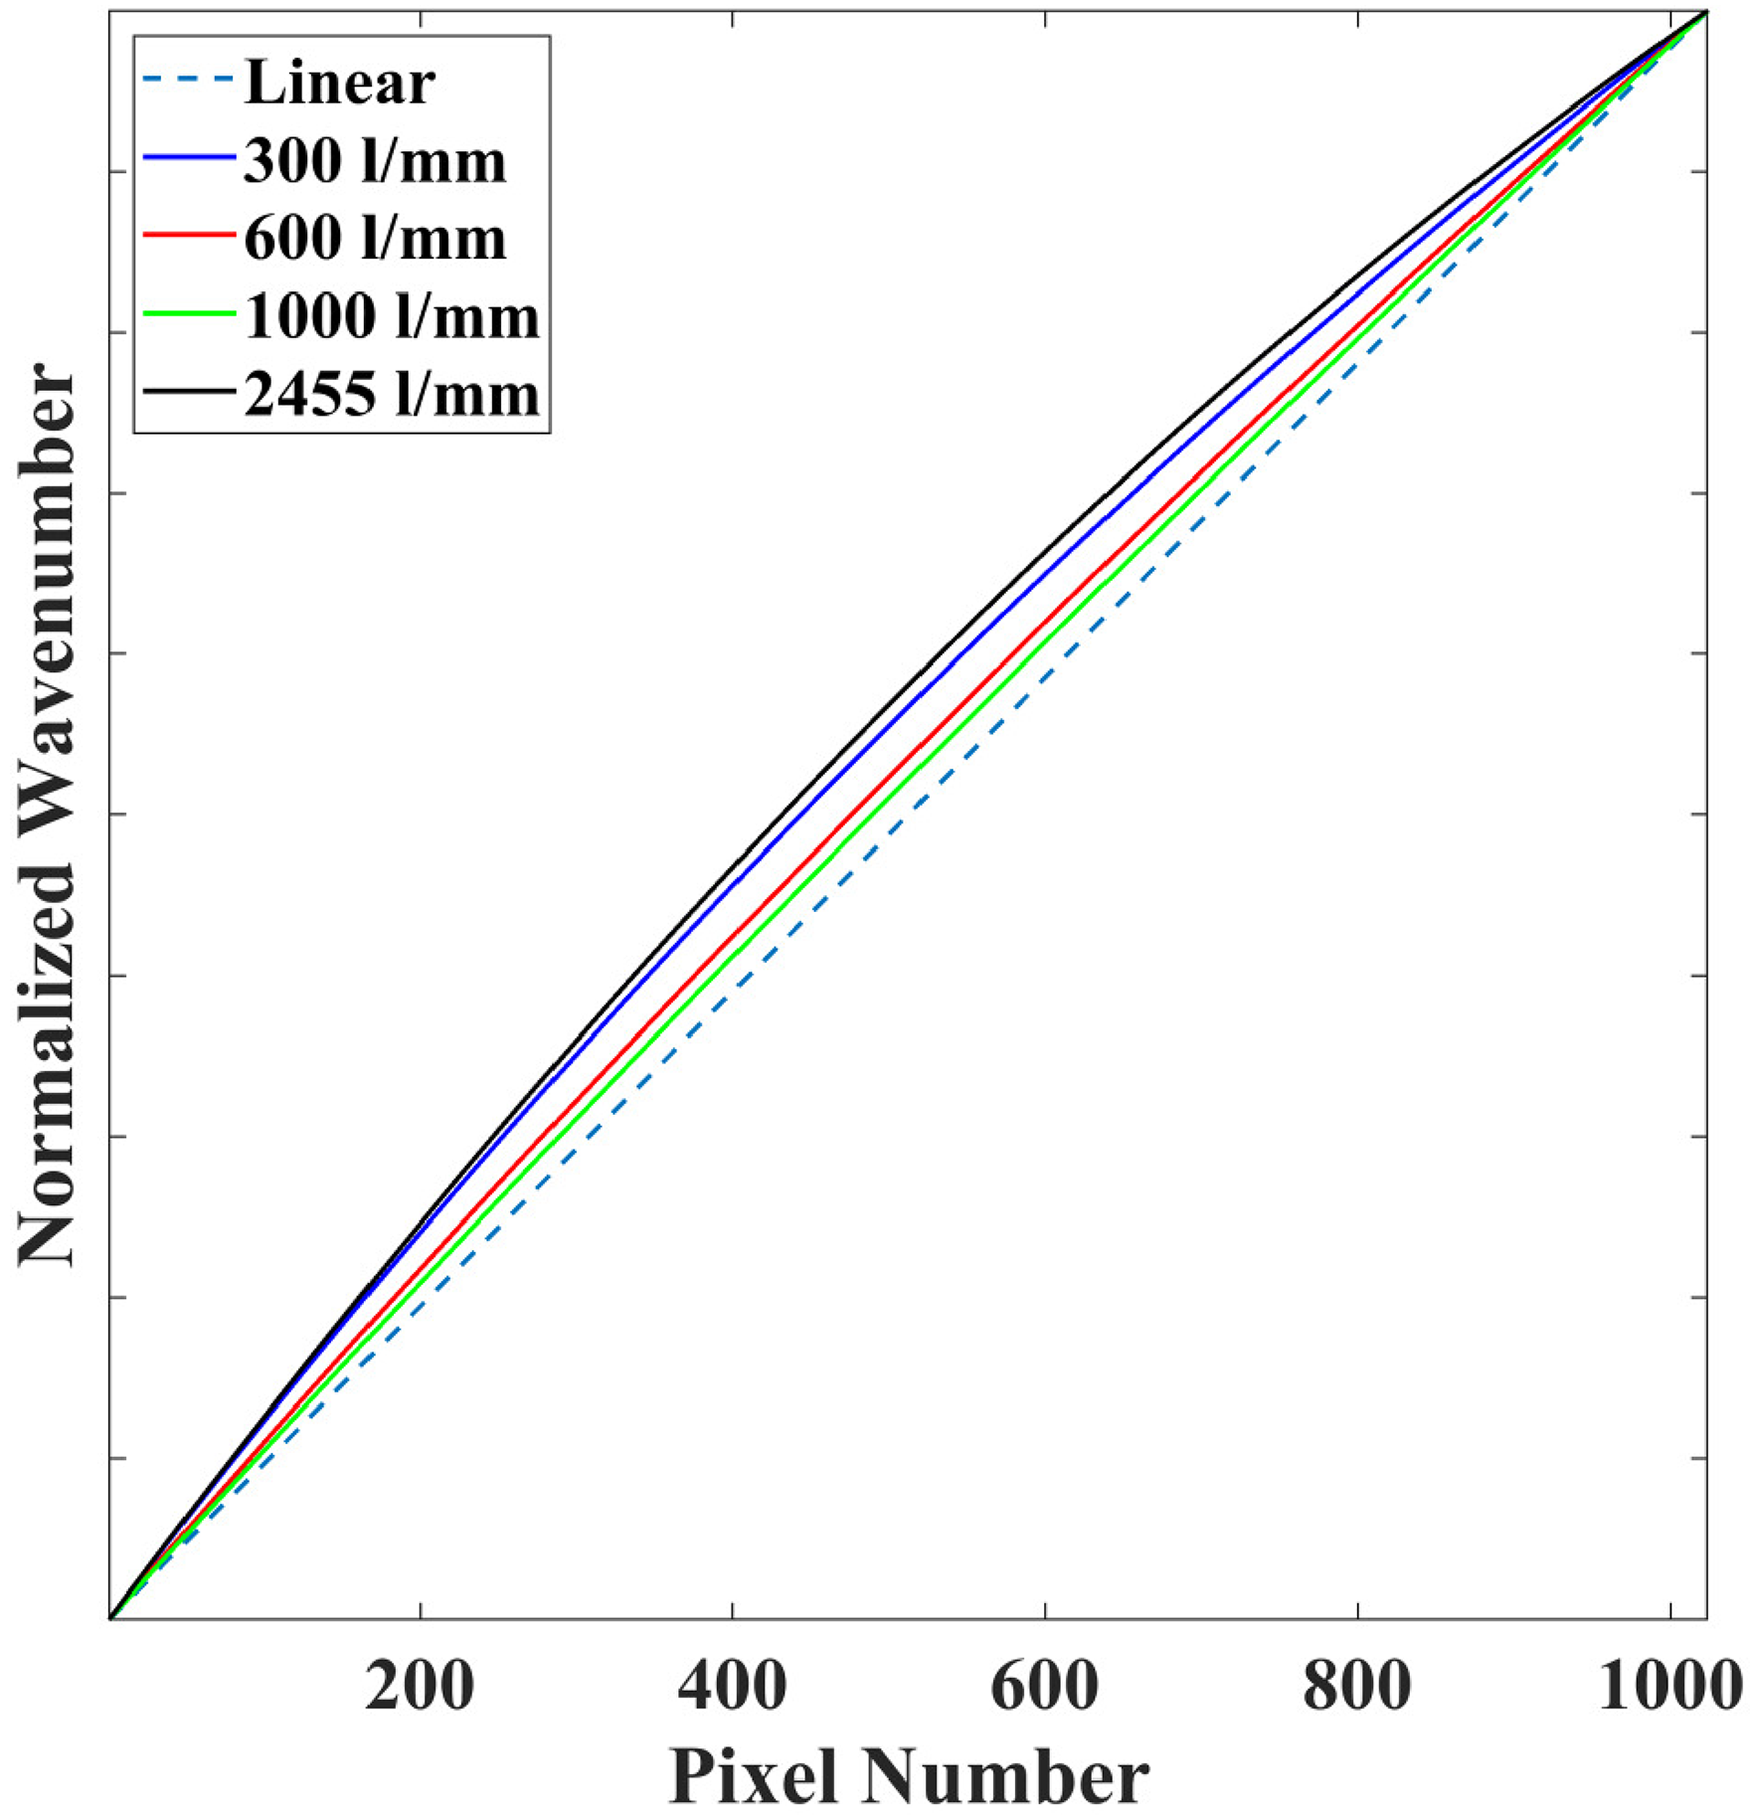
Investigation of the nonlinearity of the
Algorithm
In this section, an algorithm is developed that relates the detector pixels, 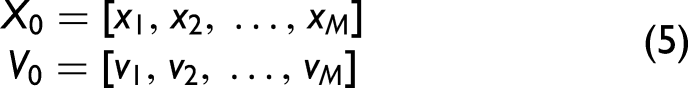
Equation 4 contains several system parameters that define the system and knowledge of their precise values enables accurate fitting of Eq. 4 to the available data points 
The first step provides initial estimates of the key parameters in A brute-force search is performed over The specific set of parameters, Now that the system parameters
The algorithm is general for any spectrometer; however, the constant integer values of 

The flowchart in Figure 3 illustrates the key components of the algorithm. In summary, the first step is to select estimates of the seven parameters that describe the model. In the model, three of the parameters can be identified as linearly relating the wavelength and pixel positions, while the other four are nonlinear. The next step is to perform a brute-force search over only these nonlinear parameters in the form of four nested for loops using a range of values in the neighborhood of the initial estimates. In total, we will search over
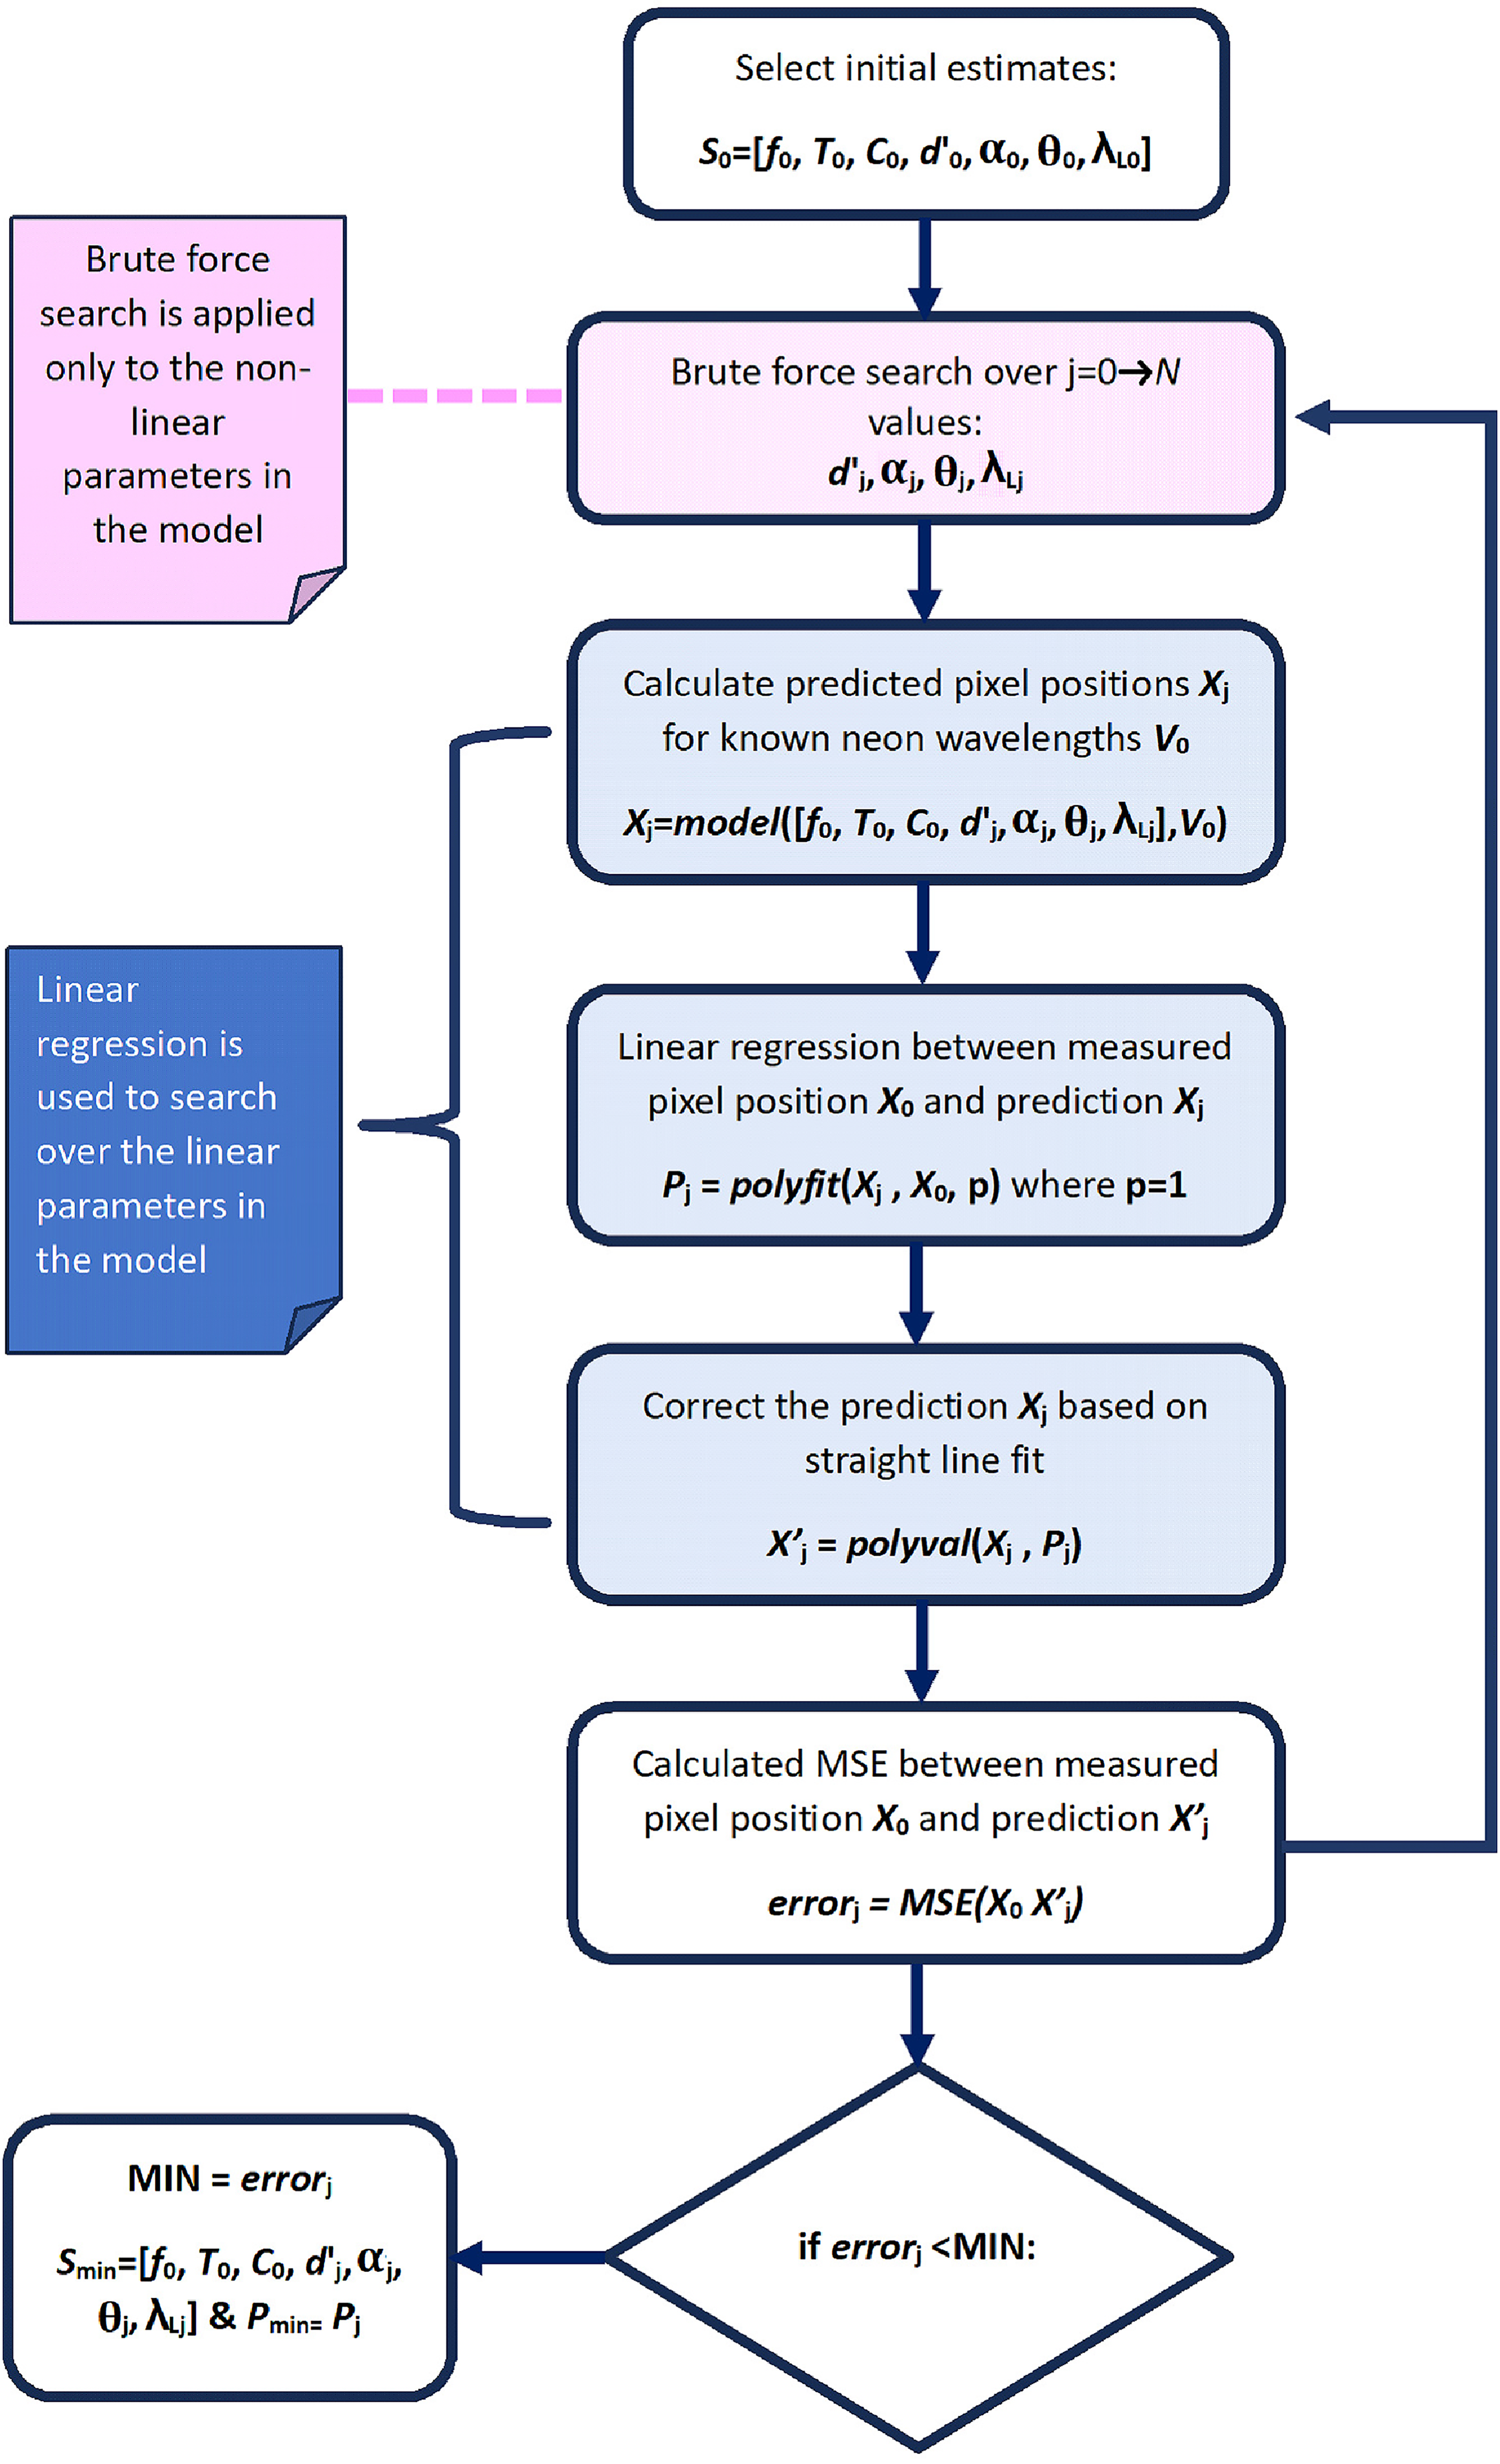
This flowchart illustrates the algorithm. See text for further details.
Overall Calibration Procedure
The overall calibration protocol is similar to that outlined in Hennelly and Liu
29
with some additional steps. Step 1 is to record a Raman spectrum from a reference material containing some number of sharp, symmetrical, and well-defined, known peak wavenumber shifts. Here, we use three reference materials: 4-acetamidophenol (Sigma), benzonitrile (Sigma), and a commercial polymer slide (
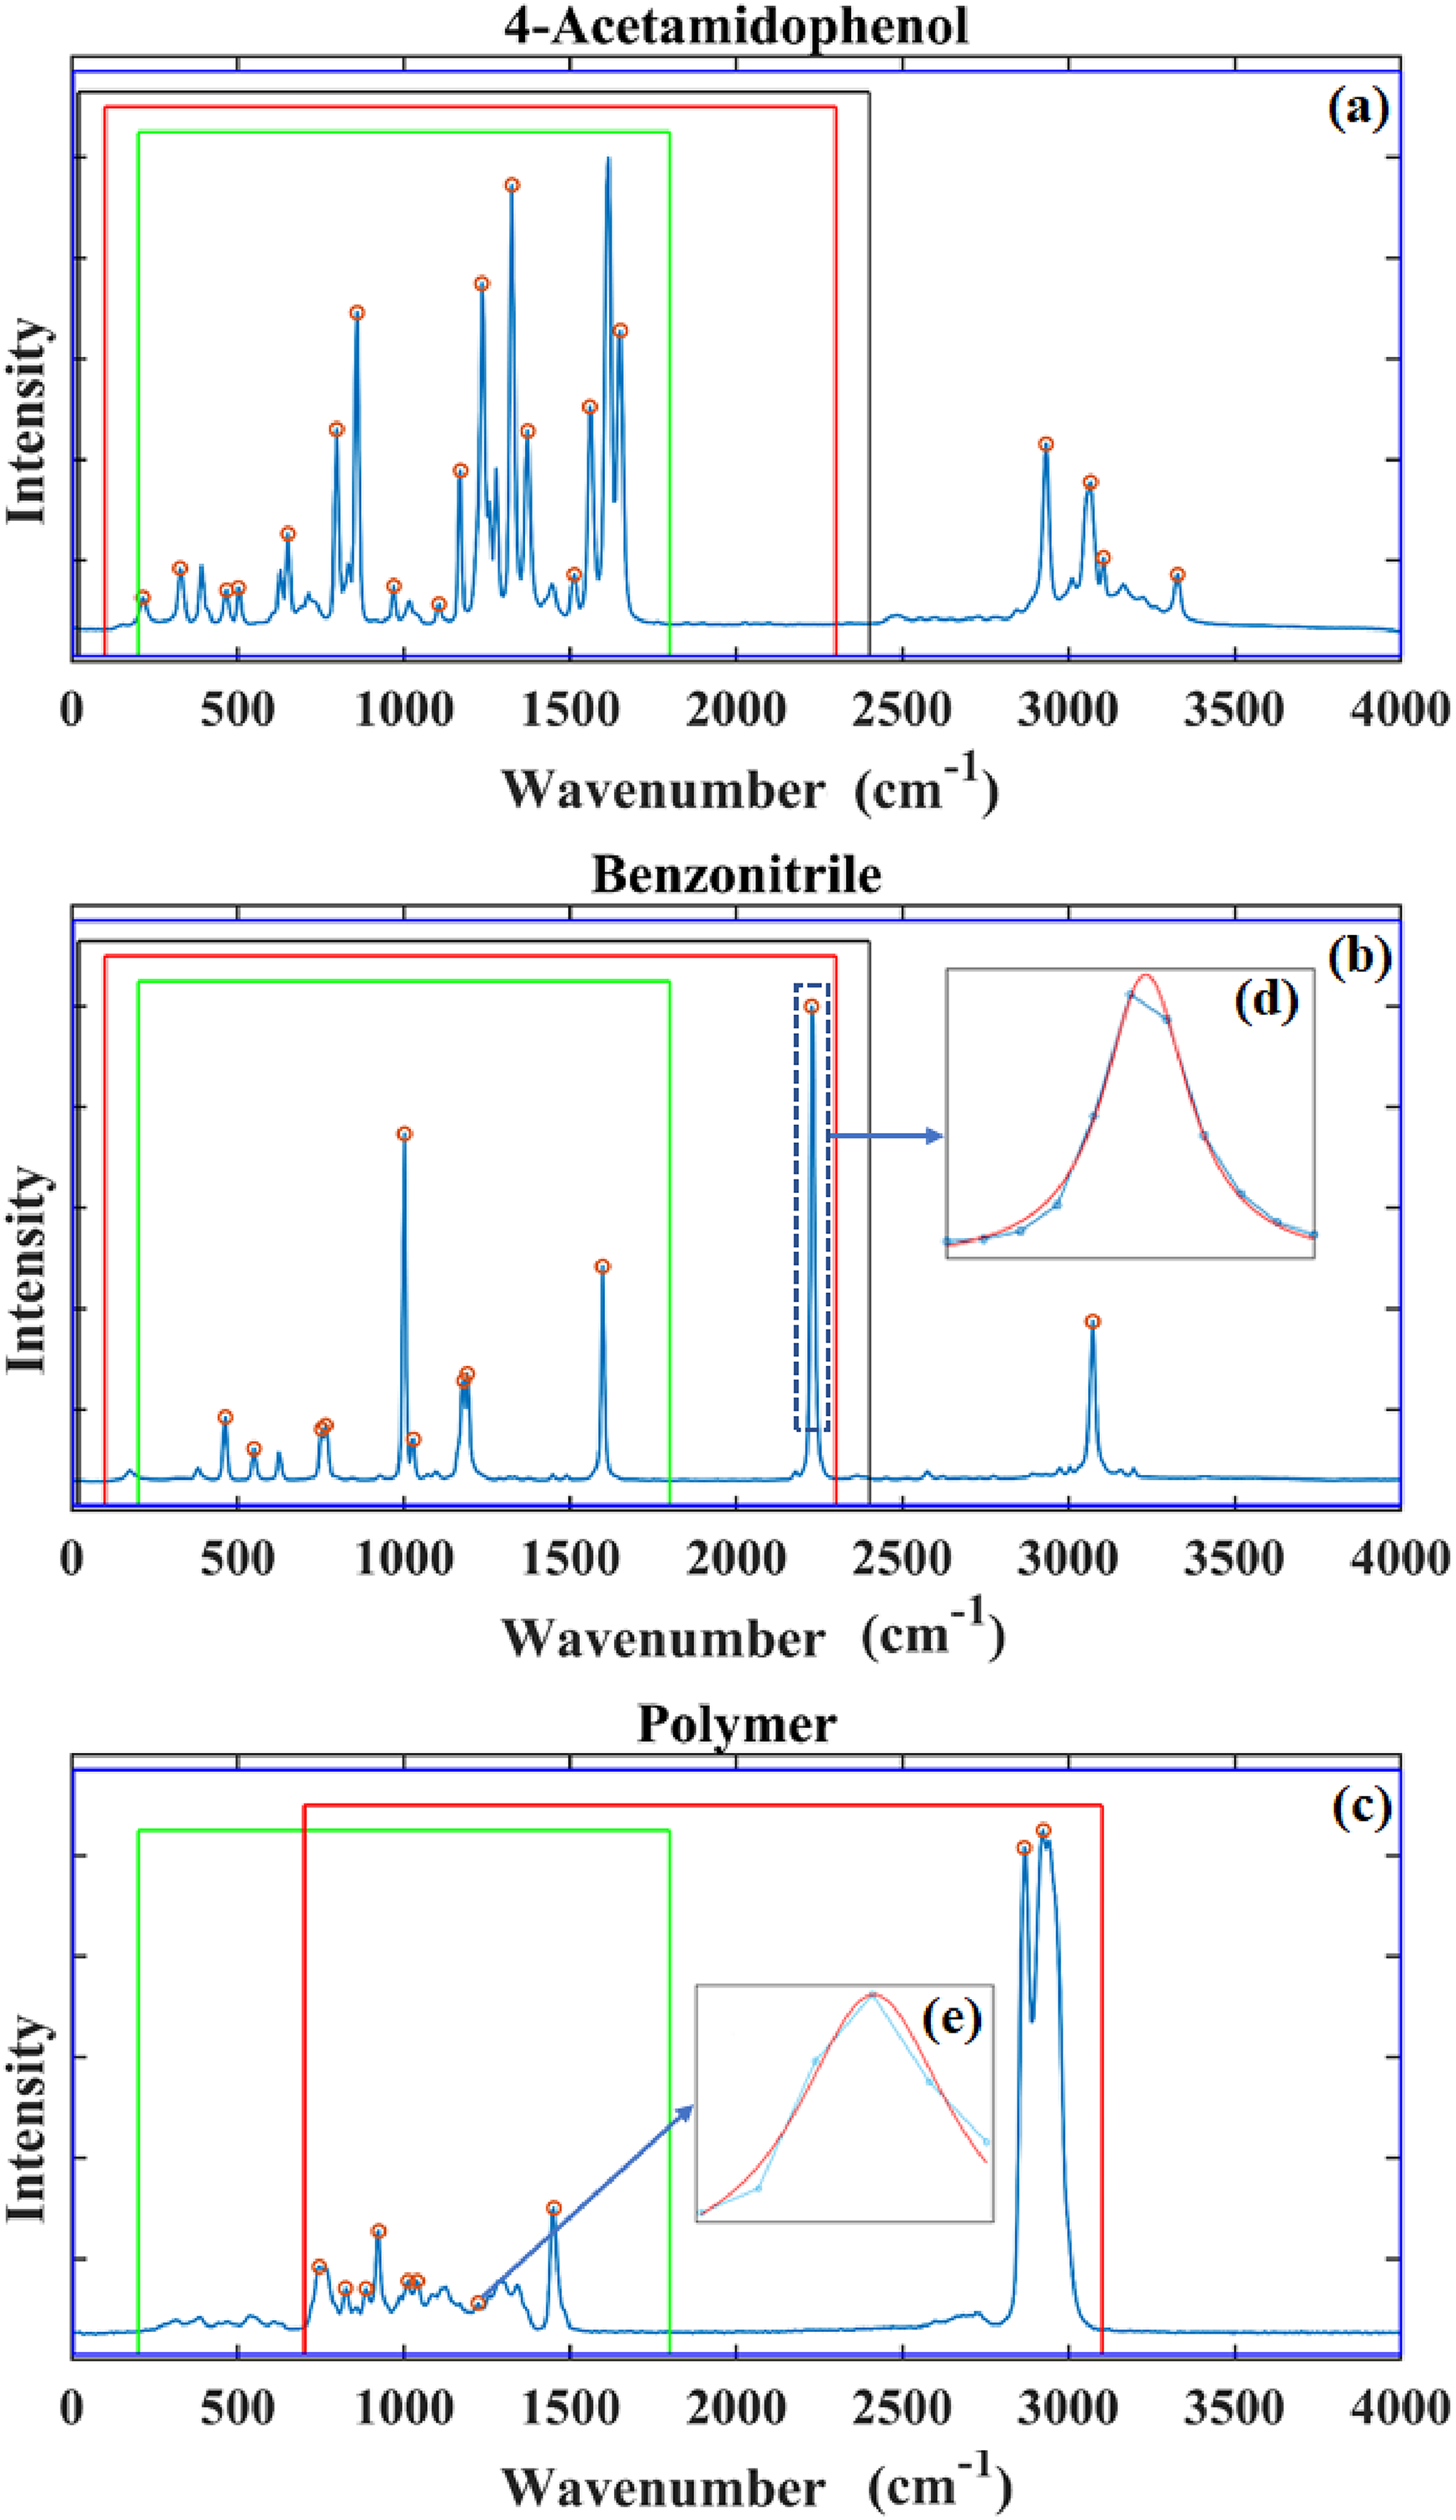
Sample spectra recorded from the three different reference materials. The spectrum of (a) 4-acetamidophenol, (b) benzonitrile, and (c) commercial-grade polymer. The recorded bands using the four spectrometers are highlighted in different color boxes: the black area corresponds to the 2455 lines/mm grating; green is 1000 lines/mm; red 600 lines/mm; blue 300 lines/mm. (d) A single peak from the benzonitrile is expanded. A Lorentzian function is fitted to the data points around the peak in order to detect the peak center with sub-pixel accuracy. (e) A further example is given of Lorenzian peak fitting, this time applied to a relatively broader and weaker peak.
The wavenumber shift values of the lines that are highlighted in Figure 4 are provided in Table III. These reference values and uncertainties have been taken from ASTM-1840 23 and Liu et al. 35 For the case of the 300 lines/mm grating, all of the values shown in Table III were used for wavenumber calibration and a reduced set was used for the other gratings as detailed in the caption for Table III.
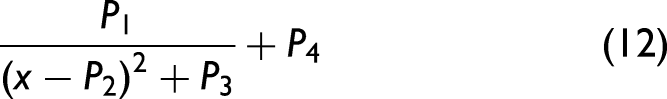
Step 2 is to identify the sub-pixel position of the lines in the recorded spectrum. Various methods are reviewed in the background section in the Supplemental Information on how this can be achieved; here, we fit a Lorentzian function to the intensities of the pixels in the region of the peak of the following form:
36
Experiment Design
Recording of Reference Spectra
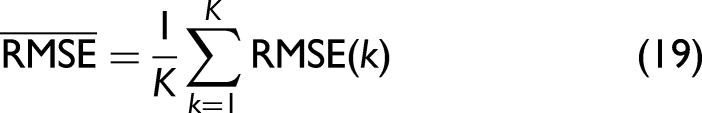
The performance of the proposed wavenumber calibration algorithm is examined across two Raman spectrometer designs and four different gratings periods as described earlier. For the case of the Czerny–Turner system, all three reference materials were investigated, while for the transmission spectrometer, the polymer was omitted. For each of the three gratings in the Czerny–Turner spectrometer, and for each of the three materials, 100 different reference spectra are recorded with changes in the grating rotation angle. For each of these cases, a rigorous evaluation of the performance of the calibration is possible by calculating the ensemble average of the error metrics defined below, across the set of 100 reference spectra.
While the polymer slide has the advantage of requiring no preparation whatsoever, the 4-acetamidophenol and benzonitrile are in powder and liquid form, respectively. These were both mounted in an Ibidi chamber slide (GmbH). The base of the chamber was drilled to create an open aperture, which was sealed using a Raman grade calcium fluoride coverslip (Crystran), which produces a negligible Raman spectrum except for a single peak at 321 cm−1.
To minimize the effect of shot noise, the accumulation time was maximized to provide a photon count just less than the saturation level of the CCD. Rather than use full vertical binning, which can produce errors in the presence of image distortion, 29 area scan images were recorded by the detector; the row of pixels containing the spectrum was cropped.
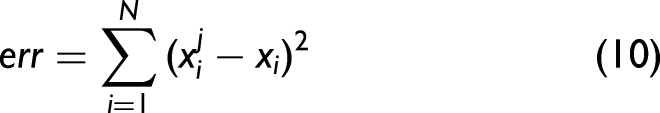
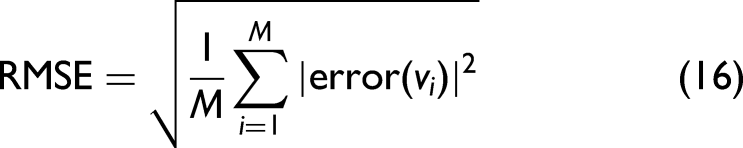
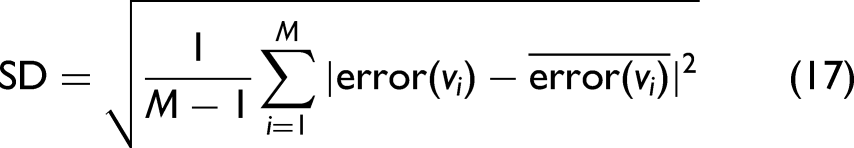
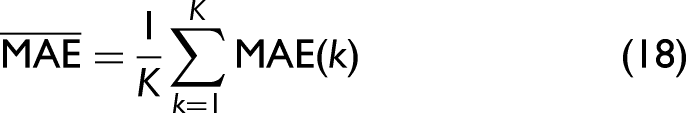
Error Metrics
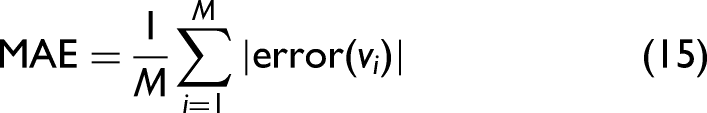
Several different error metrics have been reported in the literature (see the Background section in the Supplemental Material) including, mean absolute error (MAE), the SD, and the root mean square error (RMSE), all of which are measured in this paper. These metrics are defined below using the same notation as used in the Algorithm section. Initially, we define the error for a single line at known wavenumber shift 

Evaluation Methods
Here, we describe a number of evaluation methods, making use of the above metrics, which we recently proposed for the evaluation of wavelength calibration.
29
The latter two are borrowed from the area of multivariate statistical analysis37,38 and are used here for the first time (to the best of our knowledge) in the evaluation of wavenumber calibration:
All-peaks: Here all of the calibrated peaks from the reference are used in the error analysis. This is the typical value reported in the literature to date. Taking a spectrum of the reference sample 4-acetamidophenol as an example, which contains 20 reference lines Leave-one-out cross-validation (LOOCV): In order to remove any bias from the reference spectrum, we propose the use of “leave-one-out” (LOO) cross-validation, whereby one peak is removed from the reference spectrum used in the calibration process. The error metric is then applied only to this peak alone following calibration. This process is repeated for each peak in the spectrum and the average value for all cases is calculated. This method must provide a more accurate estimate of wavenumber shift accuracy inside the bounds of the spectral lines provided by the reference spectrum. Again taking a spectrum of the reference sample 4-acetamidophenol as an example, which contains 20 reference lines, the first line Leave-half-out (LHO): The purpose of this metric is to examine the impact of having a wide silent band on the left or right of the reference spectrum that is devoid of reference lines. We propose an evaluation based on calibrating using the left-most half of the reference peaks and applying the error metric to the right-most peaks of the calibrated spectrum. This is repeated using the right-most peaks for calibration and the left-most for error calculation. The average of the two values is taken. This provides a more accurate evaluation of the accuracy of the wavenumber calibration “outside” the bounds of the reference spectrum lines. Again taking a spectrum of the reference sample 4-acetamidophenol as an example, which contains 20 reference lines, the 10 left-most lines in the spectrum are removed and only the right-most 10 lines,
We note that the Matlab code for the evaluation methods described above is available from Liu
34
as is sample data used in the experiments described below.
Comparison with Traditional Methods of Wavenumber Calibration
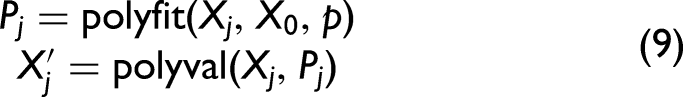
In the results shown here, the proposed algorithm is compared with equivalent results from first-order up to a fourth-order polynomial. This analysis relates to the discussion at the end of Section on the nonlinear relationship between
Results and Discussion
In this section, the results are presented for wavenumber calibration using the proposed algorithm and compared with the corresponding set of results from first-, through to fourth-order (where possible) polynomial fitting. Polynomial orders of 5 and 6 were also tested but are not shown here due to the high error values. As outlined in the previous section, these results are broken down into three sets of evaluations, corresponding to “All-Peaks” (ALL), “LOO” cross-validation, and “LHO” cross-validation. Furthermore, to facilitate comparison with other papers, which use various metrics, these evaluations are performed using three different metrics:
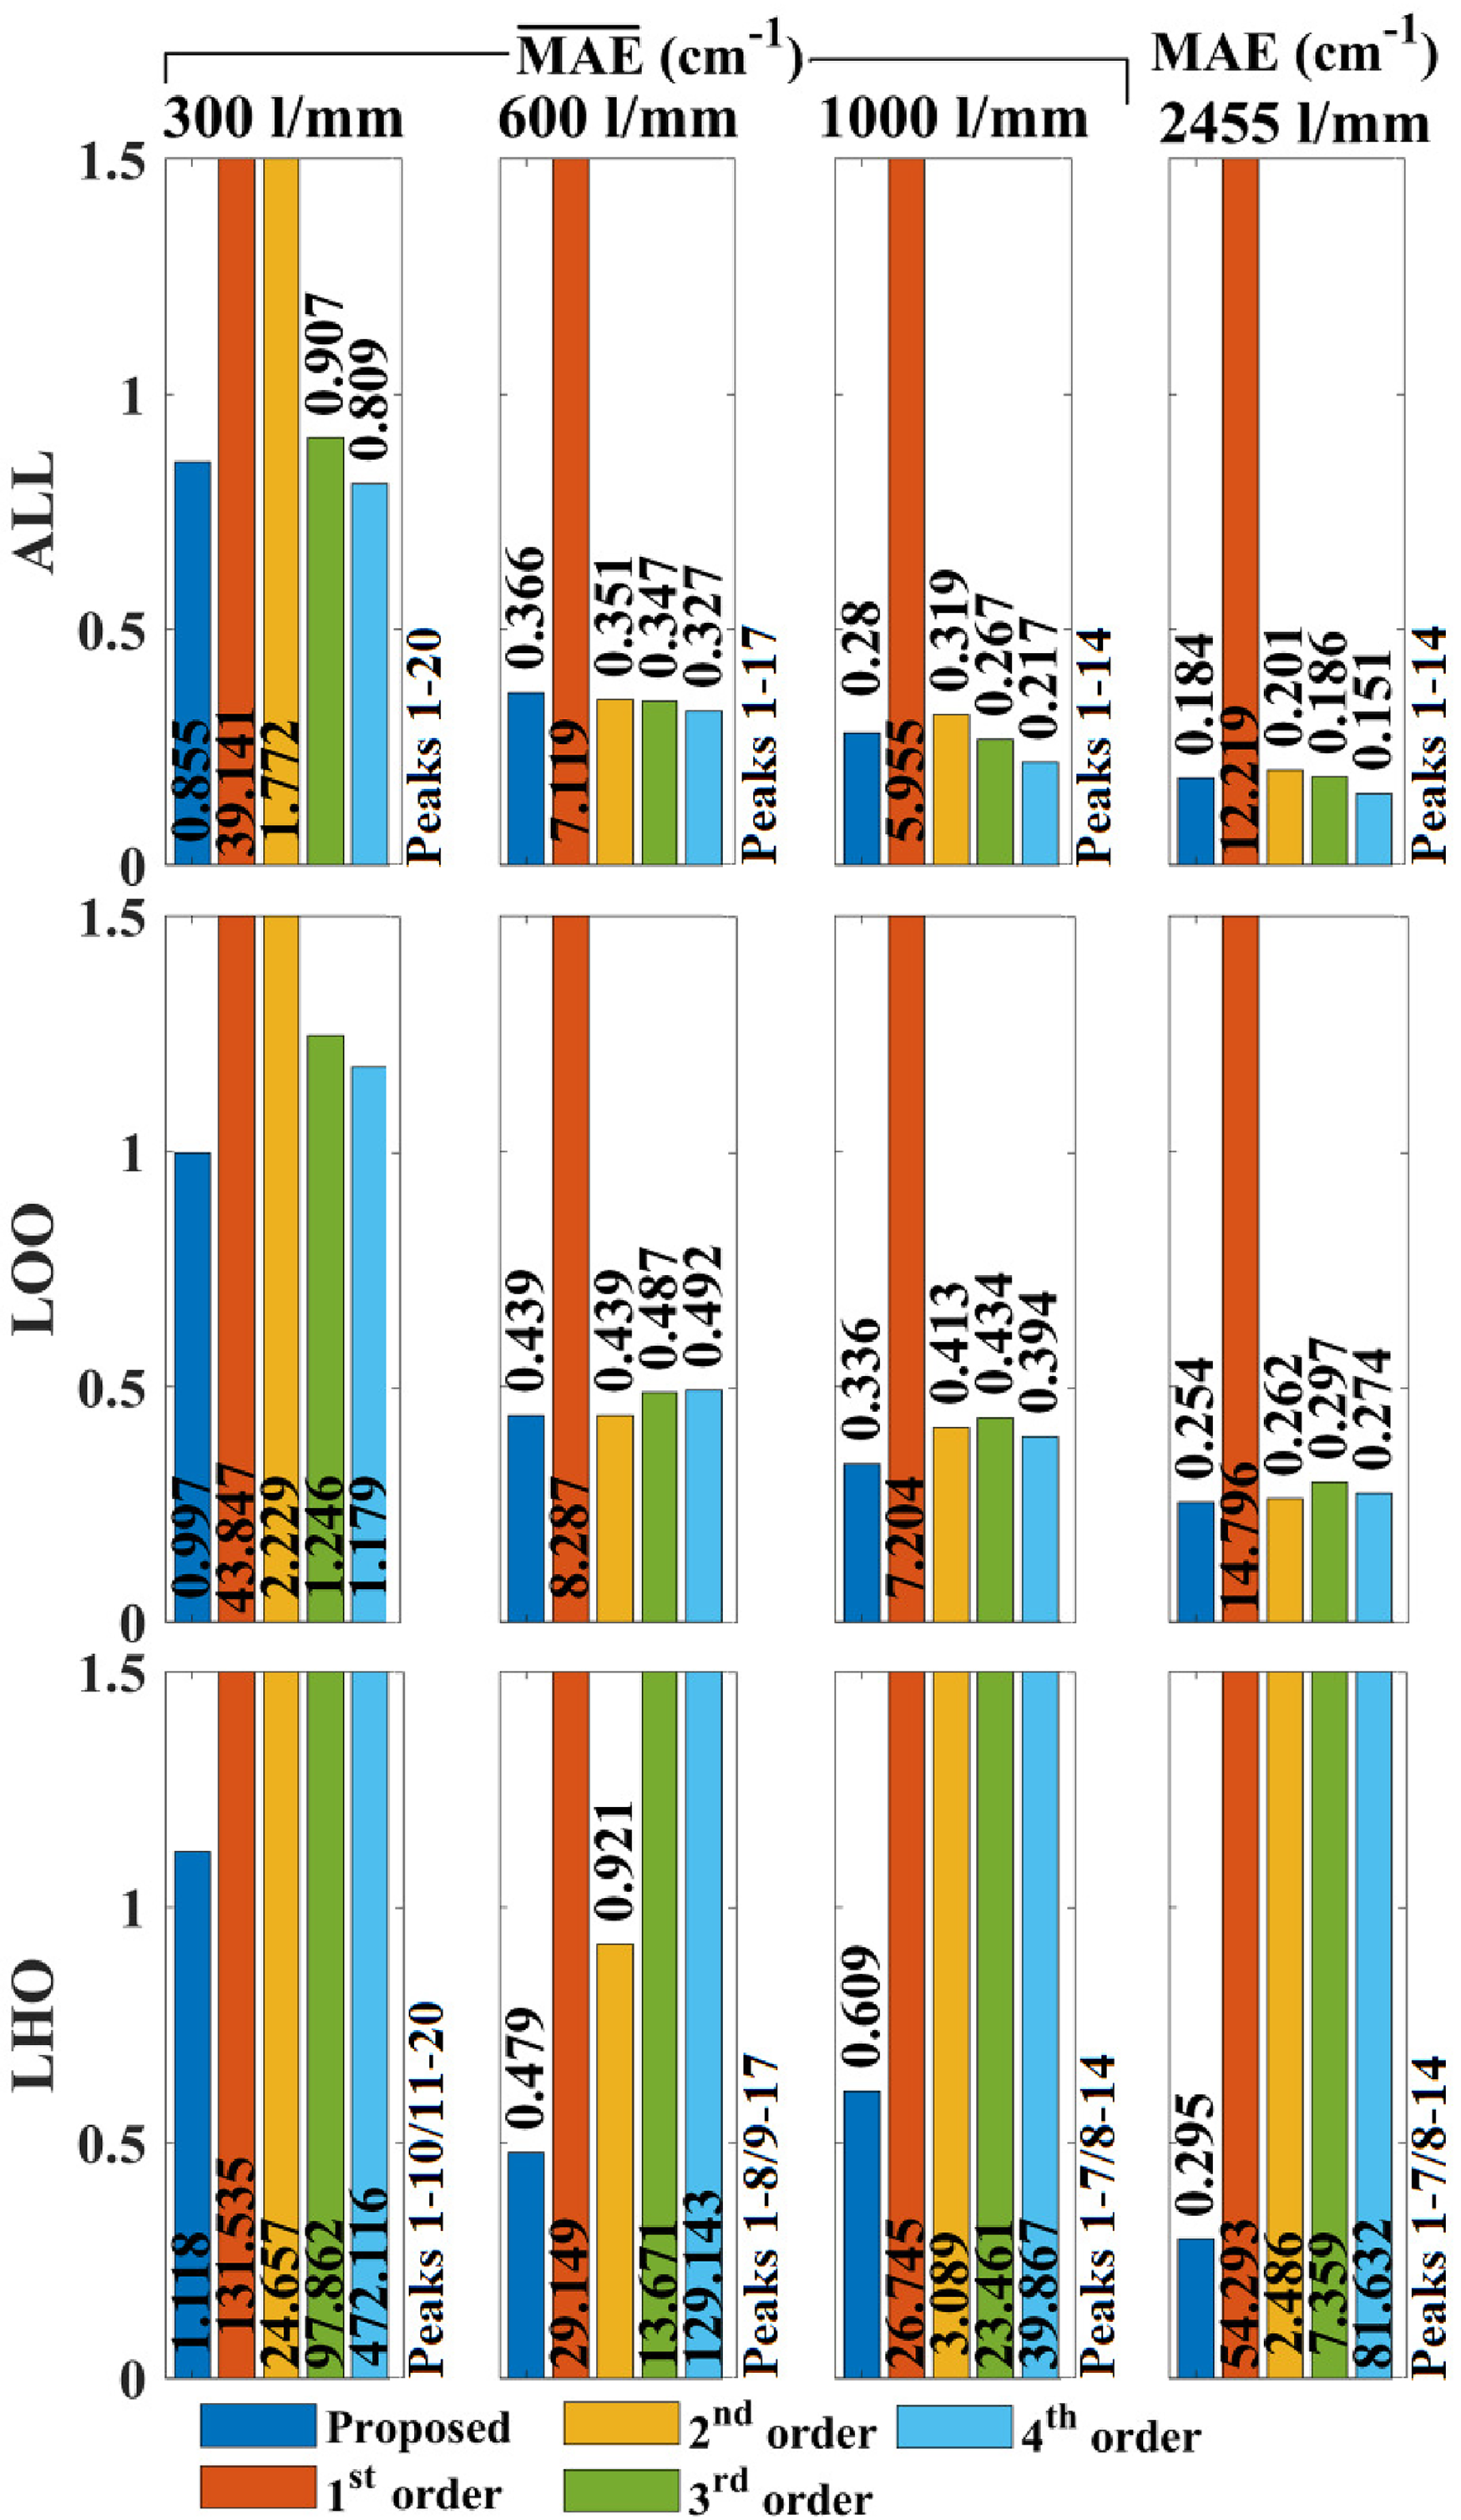
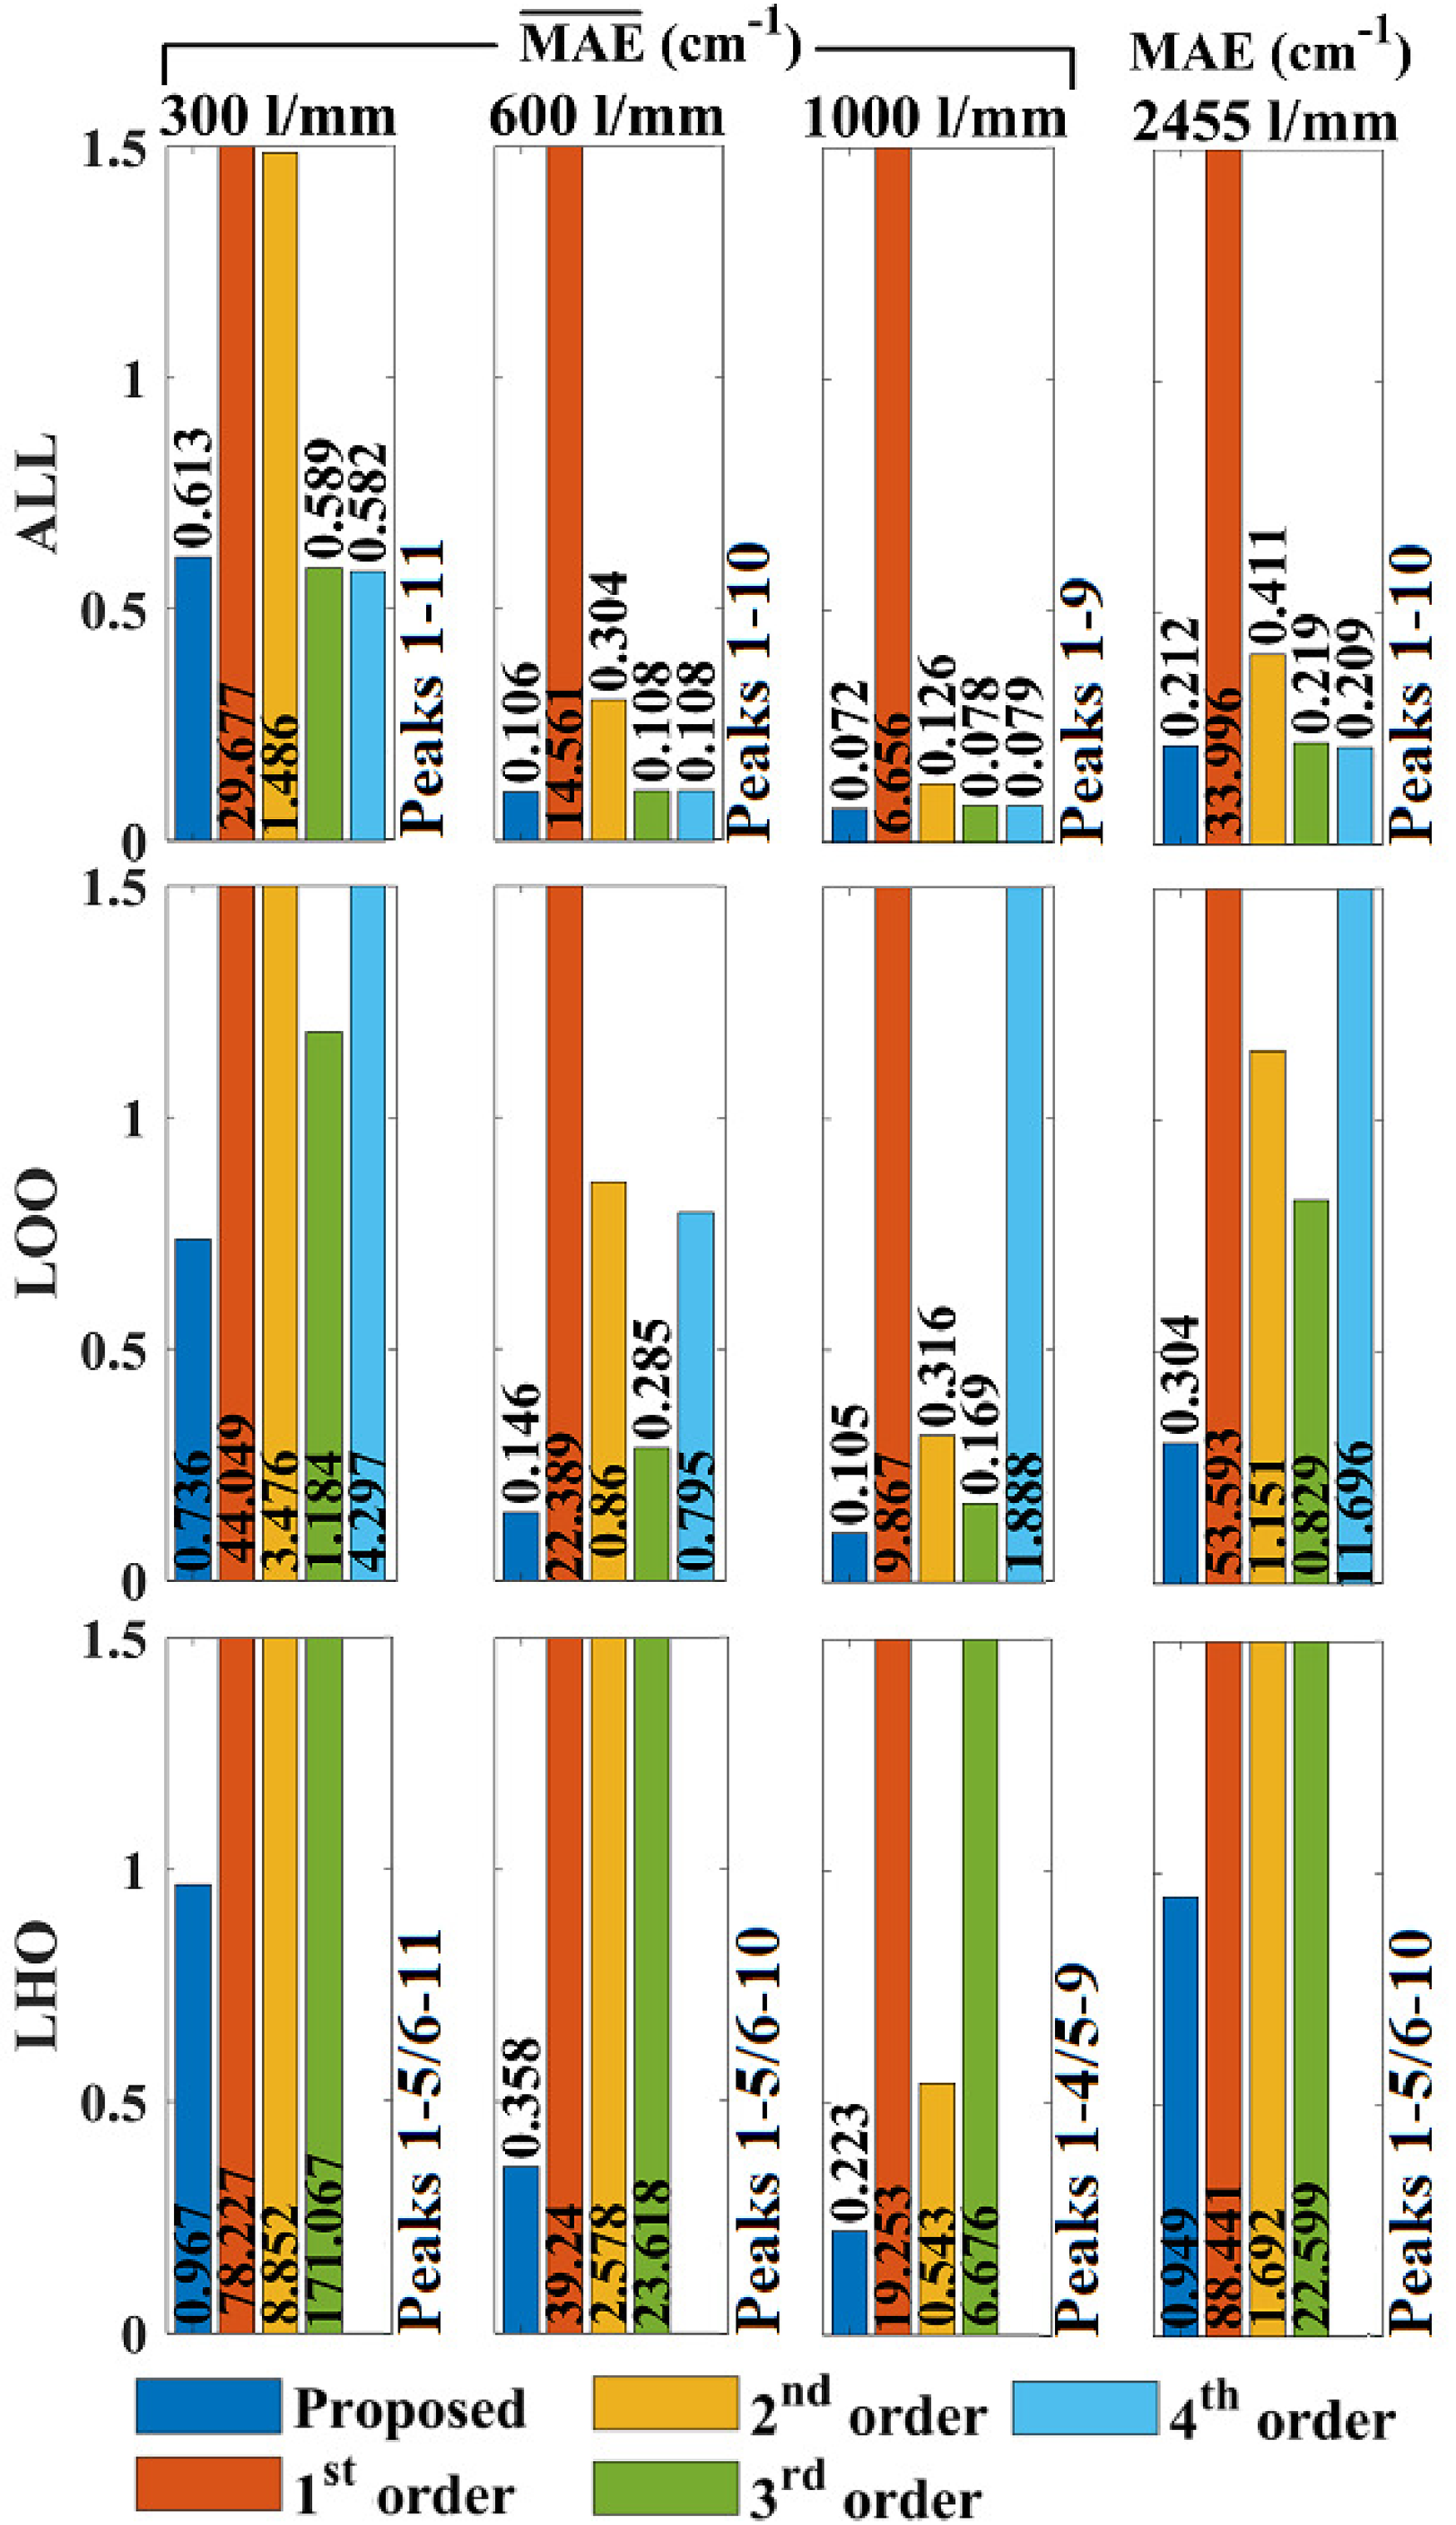
Evaluation of direct wavenumber calibration accuracy using MAE applied to 4-acetamidophenol spectra. For the case of the Czerny–Turner reflection spectrometer, three different gratings are investigated: 300, 600, and 1000 lines/mm, and for these three cases the
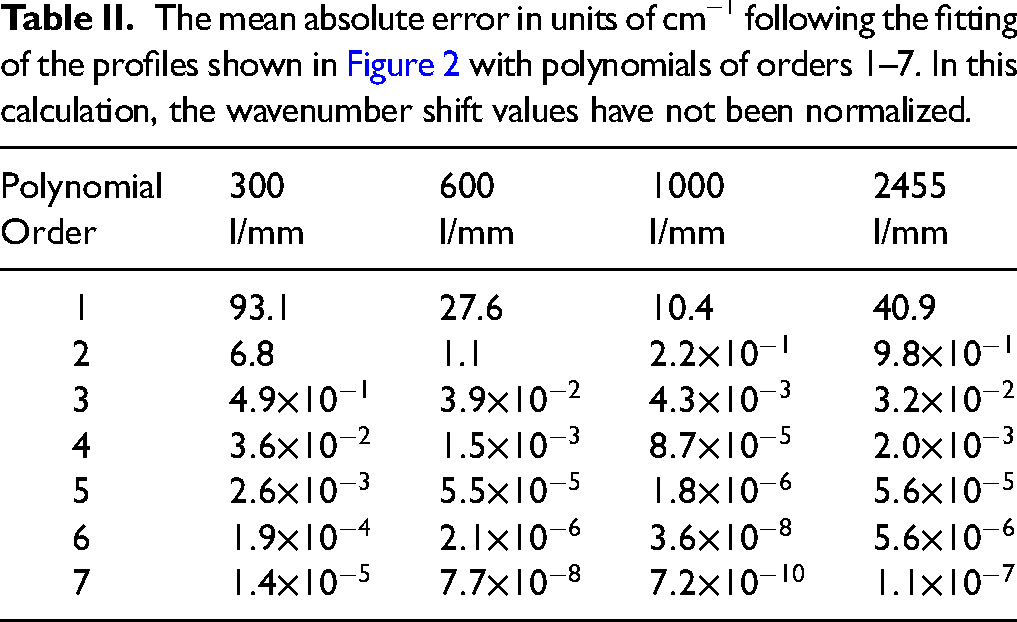
The mean absolute error in units of cm−1 following the fitting of the profiles shown in Figure 2 with polynomials of orders 1–7. In this calculation, the wavenumber shift values have not been normalized.
Reference spectral lines and uncertainties used in this paper.
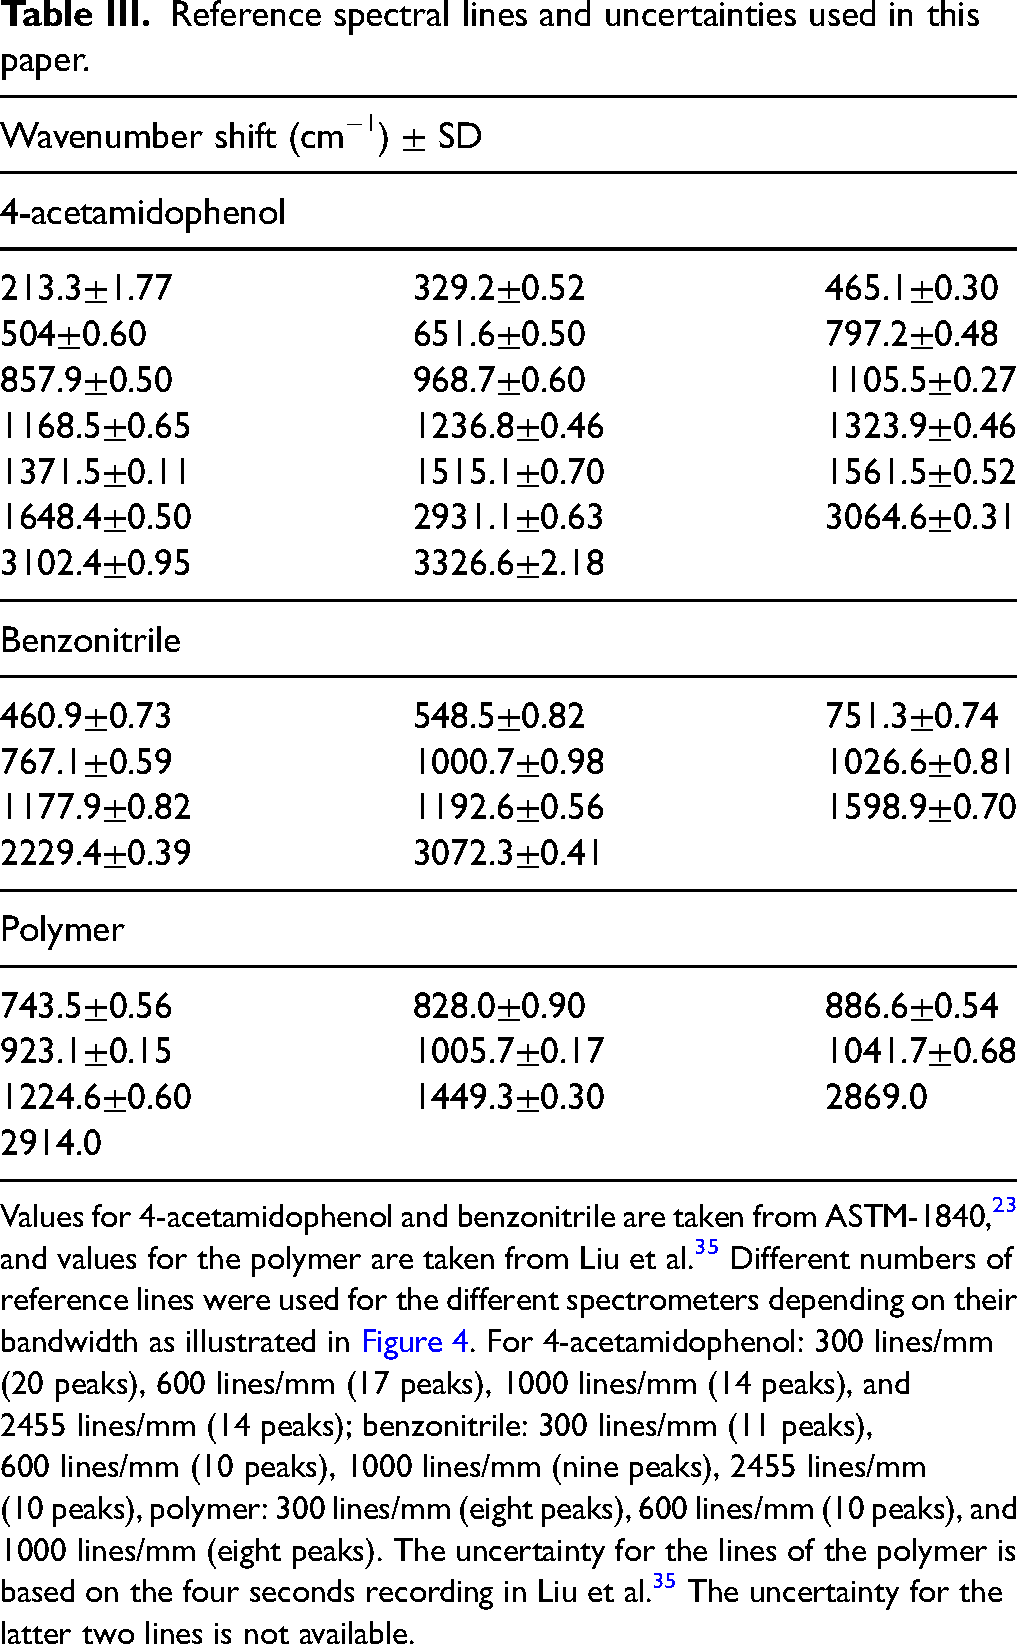
Values for 4-acetamidophenol and benzonitrile are taken from ASTM-1840, 23 and values for the polymer are taken from Liu et al. 35 Different numbers of reference lines were used for the different spectrometers depending on their bandwidth as illustrated in Figure 4. For 4-acetamidophenol: 300 lines/mm (20 peaks), 600 lines/mm (17 peaks), 1000 lines/mm (14 peaks), and 2455 lines/mm (14 peaks); benzonitrile: 300 lines/mm (11 peaks), 600 lines/mm (10 peaks), 1000 lines/mm (nine peaks), 2455 lines/mm (10 peaks), polymer: 300 lines/mm (eight peaks), 600 lines/mm (10 peaks), and 1000 lines/mm (eight peaks). The uncertainty for the lines of the polymer is based on the four seconds recording in Liu et al. 35 The uncertainty for the latter two lines is not available.
It is notable that for the case of ALL, the MAE reduced as the polynomial order increased. This was also found to be the case for orders 5 and 6, not shown here. It is likely that the better accuracy for order
Leave-half-out (LHO) evaluation reveals the strength of the proposed algorithm over traditional methods. This evaluation indicates that in all cases, the proposed algorithm is by far the most accurate in wavenumber bands that are “outside” of the spectral lines in the reference lamp; indeed the accuracy in these bands is only slightly less (0.04–0.273 cm−1) than the accuracy “inside” the bounds according to LOO evaluation. For the case of the 300 lines/mm reflection grating, the proposed algorithm provides the best LHO accuracy, with an error of 1.118 cm−1 and second-order fitting is next best with an error of 24.657 cm−1; second- and third-order fitting errors are 22.1 times and 87.5 times worse than the proposed algorithm, respectively. For the 600 lines/mm reflection grating, the proposed algorithm once again provides the best LHO accuracy with an error of 0.479 cm−1; second-, and third-order fitting provide errors are 1.9 times, and 28.5 times greater. For the third reflection grating of the period 1000 lines/mm, the proposed algorithm once again returns the best LHO accuracy with an error of 0.609 cm−1; second-, and third-order fitting provide errors that are 5.1 times and 38.5 times greater. For the transmission grating of the period 2455 lines/mm, the proposed algorithm once again returns by far the best LHO accuracy with an error of 0.295 cm−1; second-, and third-order fitting provide errors that are 8.4 times and 24.9 times greater.
Similar trends are reported for the benzonitrile reference spectrum as shown in Figure 6. In this case, it was not possible to perform polynomial fitting with order
Evaluation of direct wavenumber calibration accuracy using MAE applied to benzonitrile spectra. See the caption of Figure 5 for further details. Polynomial order >3 could not be applied for LHO evaluation due to the lower peak number. The results of the algorithm proposed in this paper are given in blue and the results for first-, second-, third, and fourth-order polynomial fitting are given in orange, yellow, green, and blue, respectively.
Although the polymer material has the advantage of photo-stability and easy mounting, it produces the least accurate wavenumber calibration results across the three materials tested. Nevertheless, it provides similar trends as for the other two cases as shown in Figure 7. As for benzonitrile, it was not possible to perform polynomial fitting with order
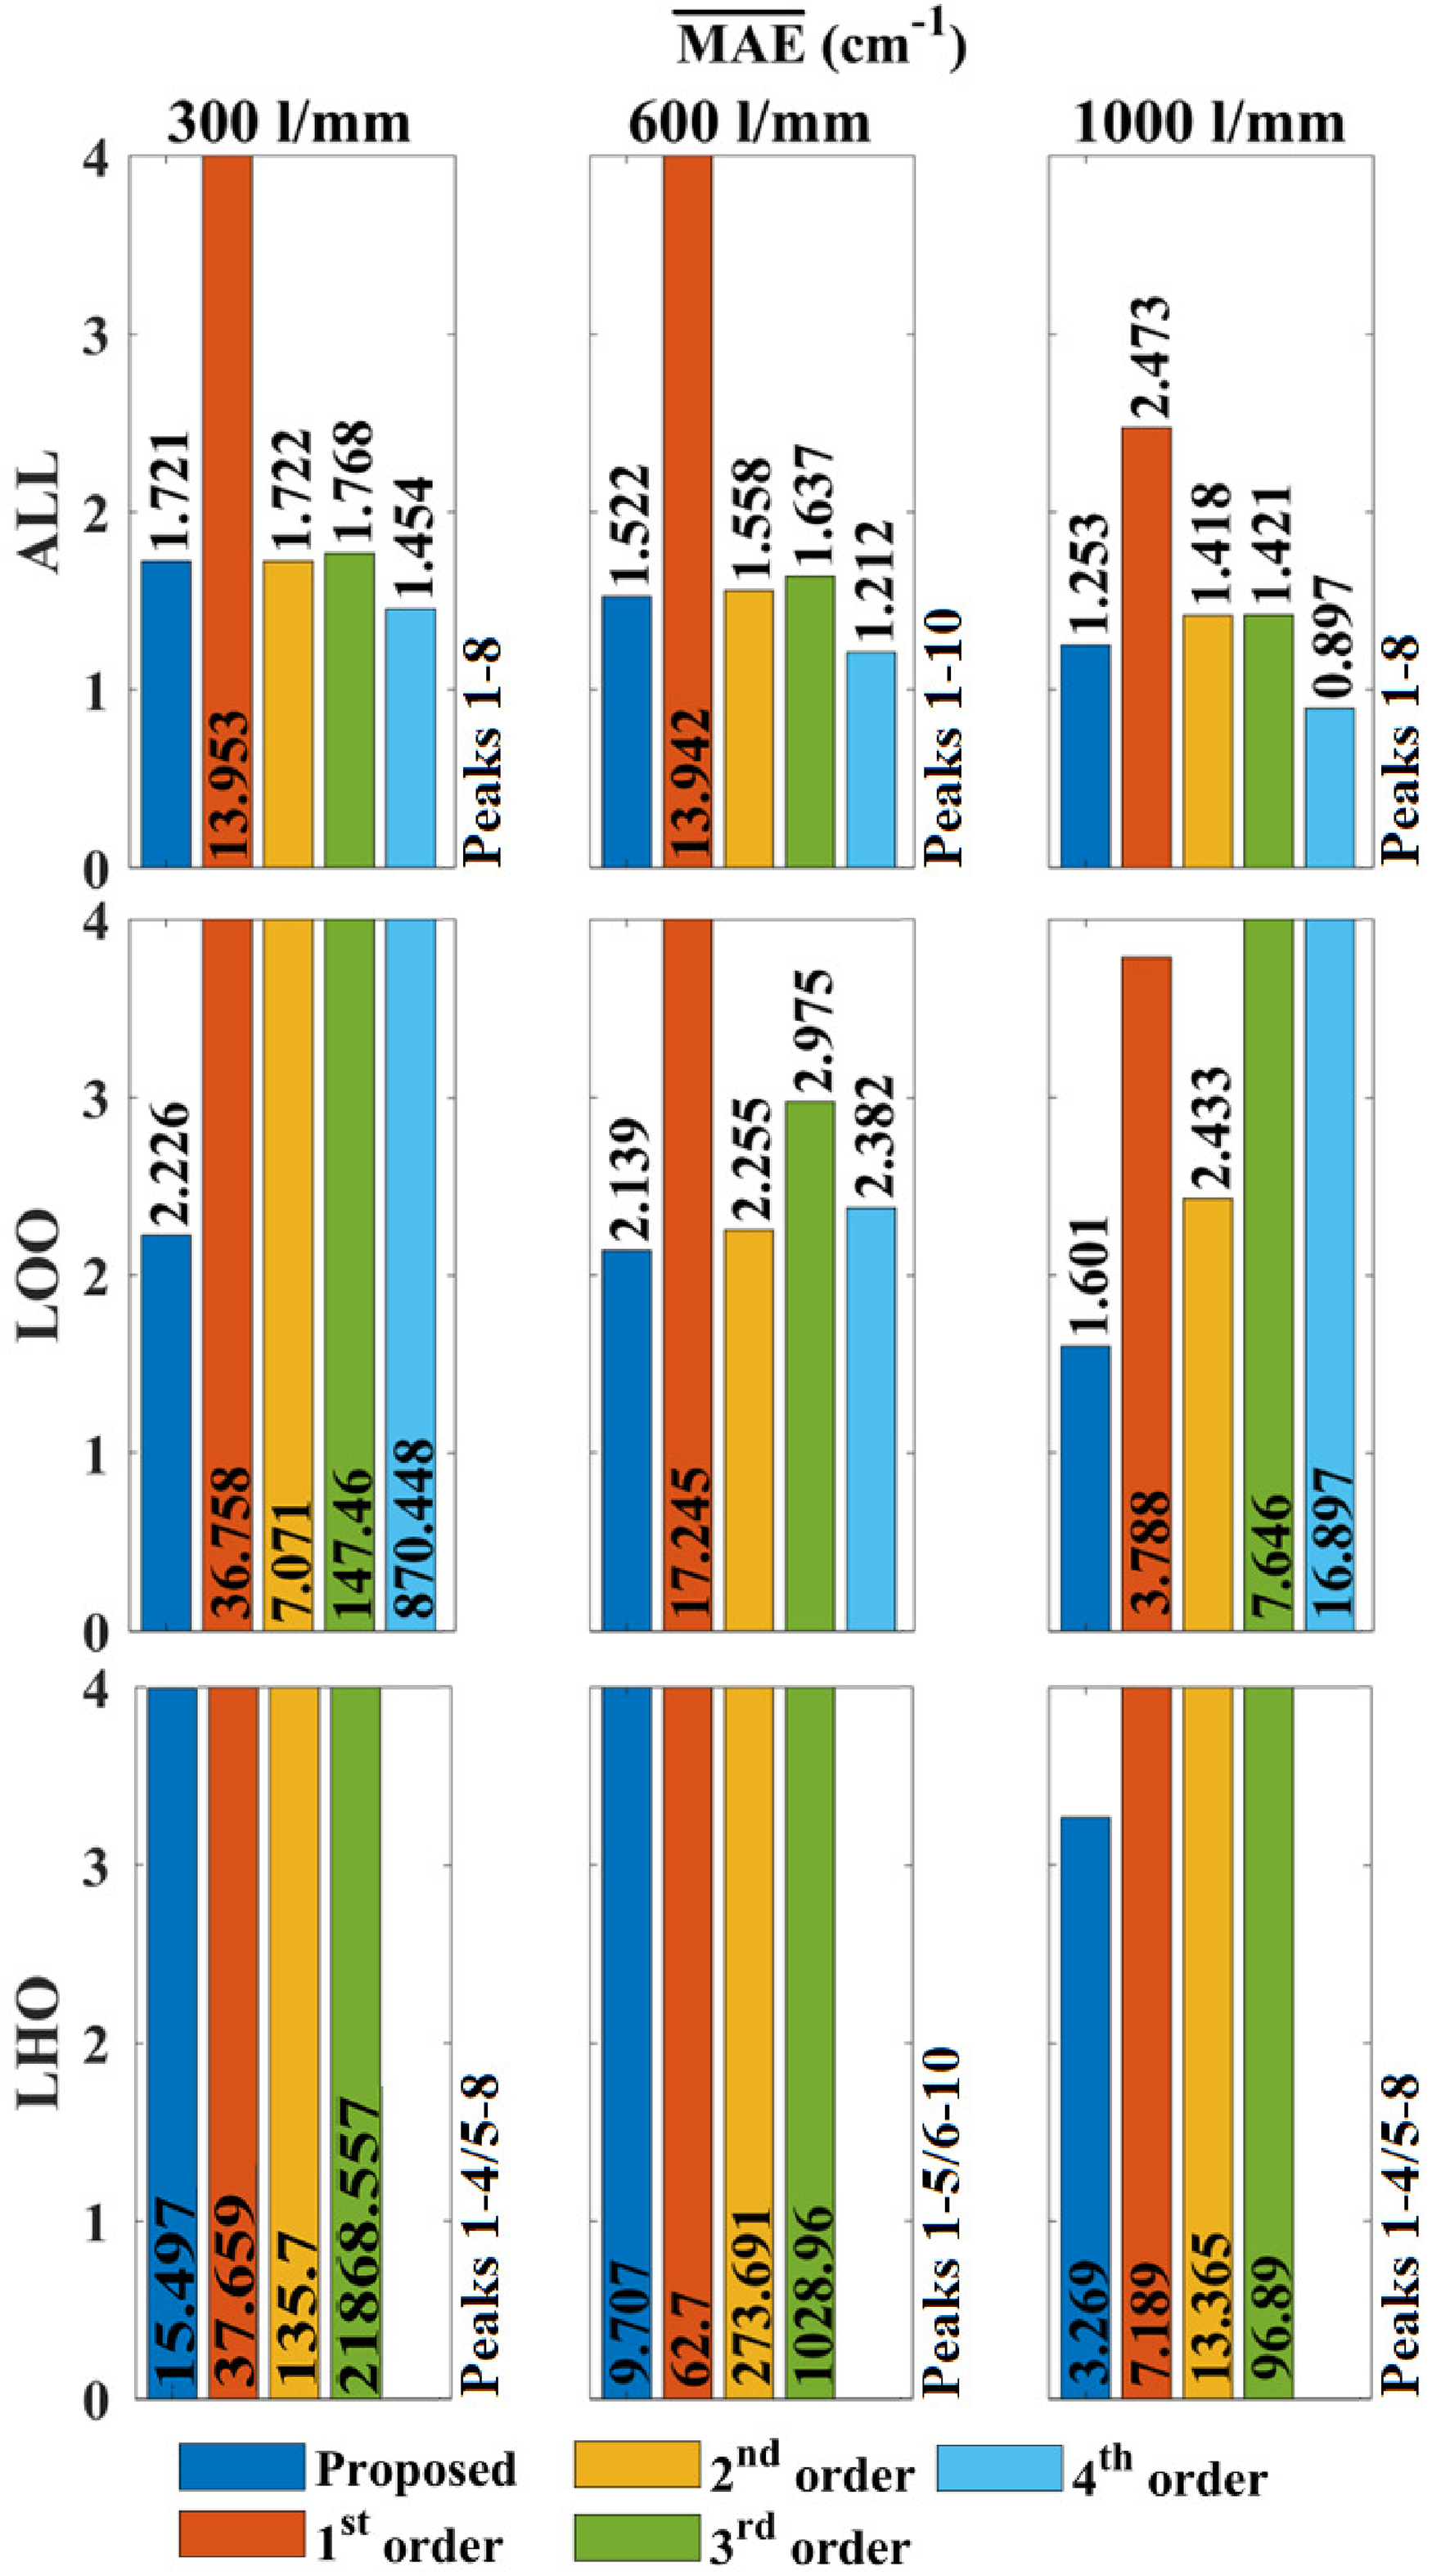
Evaluation of direct wavenumber calibration accuracy using MAE applied to commercial polymer spectra. In this case, the transmission spectrometer was not tested. Polynomial order >3 could not be applied for LHO evaluation due to the lower peak number. The results of the algorithm proposed in this paper are given in blue and the results for first-, second-, third, and fourth-order polynomial fitting are given in orange, yellow, green, and blue, respectively.
It is interesting to note that for the various reference materials, the accuracy of the ALL and LOO peaks analysis is of similar order to that predicted in Table II up to polynomial order of 3. It can be concluded that the limited precision in identifying the peak position prevents higher than third-order fitting.
In the Supplemental Information, we provide the same evaluations as above for the three materials, where the underlying metric of MAE is replaced with the SD, and the RMSE, which are sometimes preferred in the literature.
An additional result of interest relates to the laser wavelength. All of the results presented above relate to the initial input parameters to the algorithm taken from Table I except for the laser wavelength. The value input was
Conclusion
In this paper, we have made several important contributions in the area of wavenumber calibration for RS. Firstly, in the Supplemental Information the background section provides a detailed review of direct wavenumber calibration in the literature and compares with the alternative approach of wavelength calibration followed by wavenumber conversion. In this review, we have compared the various contributions over several important features including the reference materials used, the number of peaks in the reference spectrum, the resolution of the systems, methods for sub-pixel interpolation, and calibration accuracy. We believe this is the first such review of its kind in the literature to date.
An important consideration is the derivation of the relationship between the detector pixel position
The most significant contribution of the paper is the algorithm that can replace the polynomial fitting step applied in traditional wavenumber calibration to relate
In order to fully demonstrate the superiority of the proposed algorithm over polynomial fitting, we propose a number of novel evaluation methods, namely LOO and LHO cross-validation. Although these are well-known techniques in chemometrics, their applicability to wavenumber calibration has not previously been reported. We argue that these matrices are more suitable than traditional approaches as they preclude the possibility of over-fitting in the calibration process; by only allowing the accuracy to be measured on peaks that were not included in the calibration process, these methods must be considered to be a more accurate evaluation of the true accuracy of the calibration procedure at wavenumber shift positions between the spectral lines in the reference wave and in bands outside of the outermost peaks in the reference spectrum. Using these evaluations, we conclude that for the instruments tested here, the proposed algorithm is more accurate than second- or third-order fitting within the band of the spectral lines in the reference by a factor of up to 2.2 times for 4-acetamidophenol and 5.9 times for benzonitrile. More significantly it is more accurate than second- or third-order fitting outside of the reference lines by factors of up to 269.6 times and 176.9 times these two materials.
It is important to contextualize the use of the LOO and LHO metrics in the comparison of the proposed algorithm and traditional polynomial fitting. Our method outperforms polynomial fitting for both cases; for LOO there is only a slight improvement; however, for LHO the superiority of the proposed algorithm is much more significant. The LHO evaluation is somewhat of an edge case and it was expected that the proposed method would outperform polynomial fitting for this metric. Although the LHO metric somewhat exaggerates the error one can typically expect from polynomial fitting, we feel that this is a useful metric to highlight the advantage that can be provided by the proposed method in extreme bands. It is important to note that many wavenumber calibration materials have outermost peaks that do not extend to the end of the band of interest. As an example, for a spectrograph configured to record the fingerprint region 400–1800 cm−1, most reference materials will not extend beyond 1600 cm−1. Cyclohexane, for example, which is commonly used for wavenumber calibration would only cover the band from 426 to 1444 cm−1. In terms of wavenumber calibration accuracy, polynomial fitting cannot be trusted in this band. For this reason, some authors have used a combination of chemical spectra to increase the number and breadth of the available peaks for calibration REF The method proposed in this paper largely overcomes this limitation by fitting to the expected
Another interesting conclusion is that benzonitrile provides for more accurate calibration than 4-acetamidophenol for all four spectrometers tested: the accuracy afforded by 4-acetamidophenol is LOO: 0.254–0.997 cm−1 and LHO: 0.295–1.118 cm−1 for the four systems, while for benzonitrile this drops to LOO: 0.105–0.736 cm−1 and LHO: 0.223–0.967 cm−1. The latter has significantly fewer peaks; however, these peaks are in general sharper, which may suggest a greater importance for peak width compared with peak number for wavenumber calibration. It is important to emphasize that the proposed algorithm negates the need for a large number of peaks. The accuracy when using only nine peaks for the case of the 1000 lines/mm grating is ALL: 0.072 cm−1, LOO: 0.105 cm−1, and LHO: 0.223 cm−1. These values compare well with the most accurate calibration reported to date, 39 which was limited only by the accuracy of the ASTM values for the reference lines of 0.1 cm−1. In that paper, the authors used 67 peaks from a reference spectrum from a composite of different materials, chosen to cover a wide range in wavenumber. The proposed algorithm may negate the need for such an approach, and we believe there is a strong case for it to be included in future iterations of ASTM-E1840, in particular for wavenumber bands outside the range of lines in the reference spectrum.
At the heart of the proposed method is a nonlinear optimization scheme and the results from such procedures can be highly dependent on the quality of the provided initial values, and may not converge to the most optimum value if initial guesses are not reasonable. Further work is required to evaluate the impact of large errors in the initial parameter values. In the experiments described in this paper, we did not encounter any major issues in selecting the initial values that worked well; most of the system parameters are approximately known from manufacturer specifications, with the exception of the two parameters that relate to grating angles. In our case, we were able to measure these approximately after removing the cover from the spectrograph.
One of the assumptions in this paper is that the same physical model applies to transmission and reflection spectrographs; however, there exists a significant difference between the two types. For ruled reflection gratings, diffraction occurs at the interface between the air (with a refractive index that can be
We summarize the advantages of the proposed algorithm as follows: (i) The main advantage of the proposed algorithm for direct wavenumber calibration using a Raman reference wavenumber standard is that it outperforms traditional polynomial fitting in terms of accuracy, as demonstrated by novel evaluation methods such as LOO and LHO cross-validation. Although it is demonstrated to be superior in all wavenumber regions, it is especially so in regions outside of the range of peaks in the reference spectrum; (ii) an advantage over the common wavelength calibration/wavenumber conversion protocols, which are often preferable due to the highly reproducible atomic emission spectra with extremely sharp line shapes, is that the method has only a single step and does not require the wavelength of the laser to be carefully or accurately measured; an approximate estimate is sufficient; (iii) an advantage over direct wavenumber calibration protocols that can currently be found on some commercial instruments is the generality of the approach such that it can be applied to various spectrograph, reflection and transmission alike, even if the specifications of the device are not known exactly; only approximate values for the spectrograph parameters are required for the algorithm to converge. Disadvantages of the algorithm include (i) that it is slower than traditional polynomial fitting; the time taken to calibrate the using 20 peaks (4-acetamidophenol, 300 lines/mm) is 160 ms using polynomial fitting and 35 s using the proposed algorithm when processed using an i7 intel processor; (ii) an additional disadvantage is the error that is inherent in the method for the case of volume phase transmission holographic gratings, for which case the dispersion caused by the material of the grating cannot easily be accounted for. Nevertheless, the results still outperformed those for traditional polynomial fitting.
Supplemental Material
sj-zip-1-asp-10.1177_00037028241254847 - Supplemental material for Wavenumber Calibration Protocol for Raman Spectrometers Using Physical Modelling and a Fast Search Algorithm
Supplemental material, sj-zip-1-asp-10.1177_00037028241254847 for Wavenumber Calibration Protocol for Raman Spectrometers Using Physical Modelling and a Fast Search Algorithm by Dongyue Liu and Bryan M. Hennelly in Applied Spectroscopy
Footnotes
Acknowledgments
We would also like to thank an anonymous reviewer for their significant effort in helping to improve the paper.
Declaration of Conflicting Interests
The authors declared no potential conflicts of interest with respect to the research, authorship, and/or publication of this article.
Funding
The authors disclosed receipt of the following financial support for the research, authorship, and/or publication of this article: This work was funded by the Science Foundation Ireland under Grant Numbers 15/CDA/3667 and 19/FFP/7025.
Supplemental Material
All supplemental material mentioned in the text is available in the online version of the journal.
References
Supplementary Material
Please find the following supplemental material available below.
For Open Access articles published under a Creative Commons License, all supplemental material carries the same license as the article it is associated with.
For non-Open Access articles published, all supplemental material carries a non-exclusive license, and permission requests for re-use of supplemental material or any part of supplemental material shall be sent directly to the copyright owner as specified in the copyright notice associated with the article.