
Abstract
Liquid aluminum containing the important alloying element magnesium in varying concentrations was analyzed using in-situ laser-induced breakdown spectroscopy (LIBS). Magnesium emission shows an exponential dependence on melt temperature that correlates well with the expected partial pressure of magnesium above the aluminum melt. Furthermore, comparison with LIBS measurements on corresponding solid samples supports the conclusion that a significant part of Mg emission from liquid metal samples originates from the vapor phase above the metal surface. Simultaneously, curves of growth measured over four orders of magnitude in Mg concentration reveal a level of self-absorption for liquid aluminum samples that is stronger than for solid aluminum samples having a corresponding Mg concentration, and beyond what is expected from conventional plasma models. The implications for measurements of volatile species in liquid metals in general are discussed.
This is a visual representation of the abstract.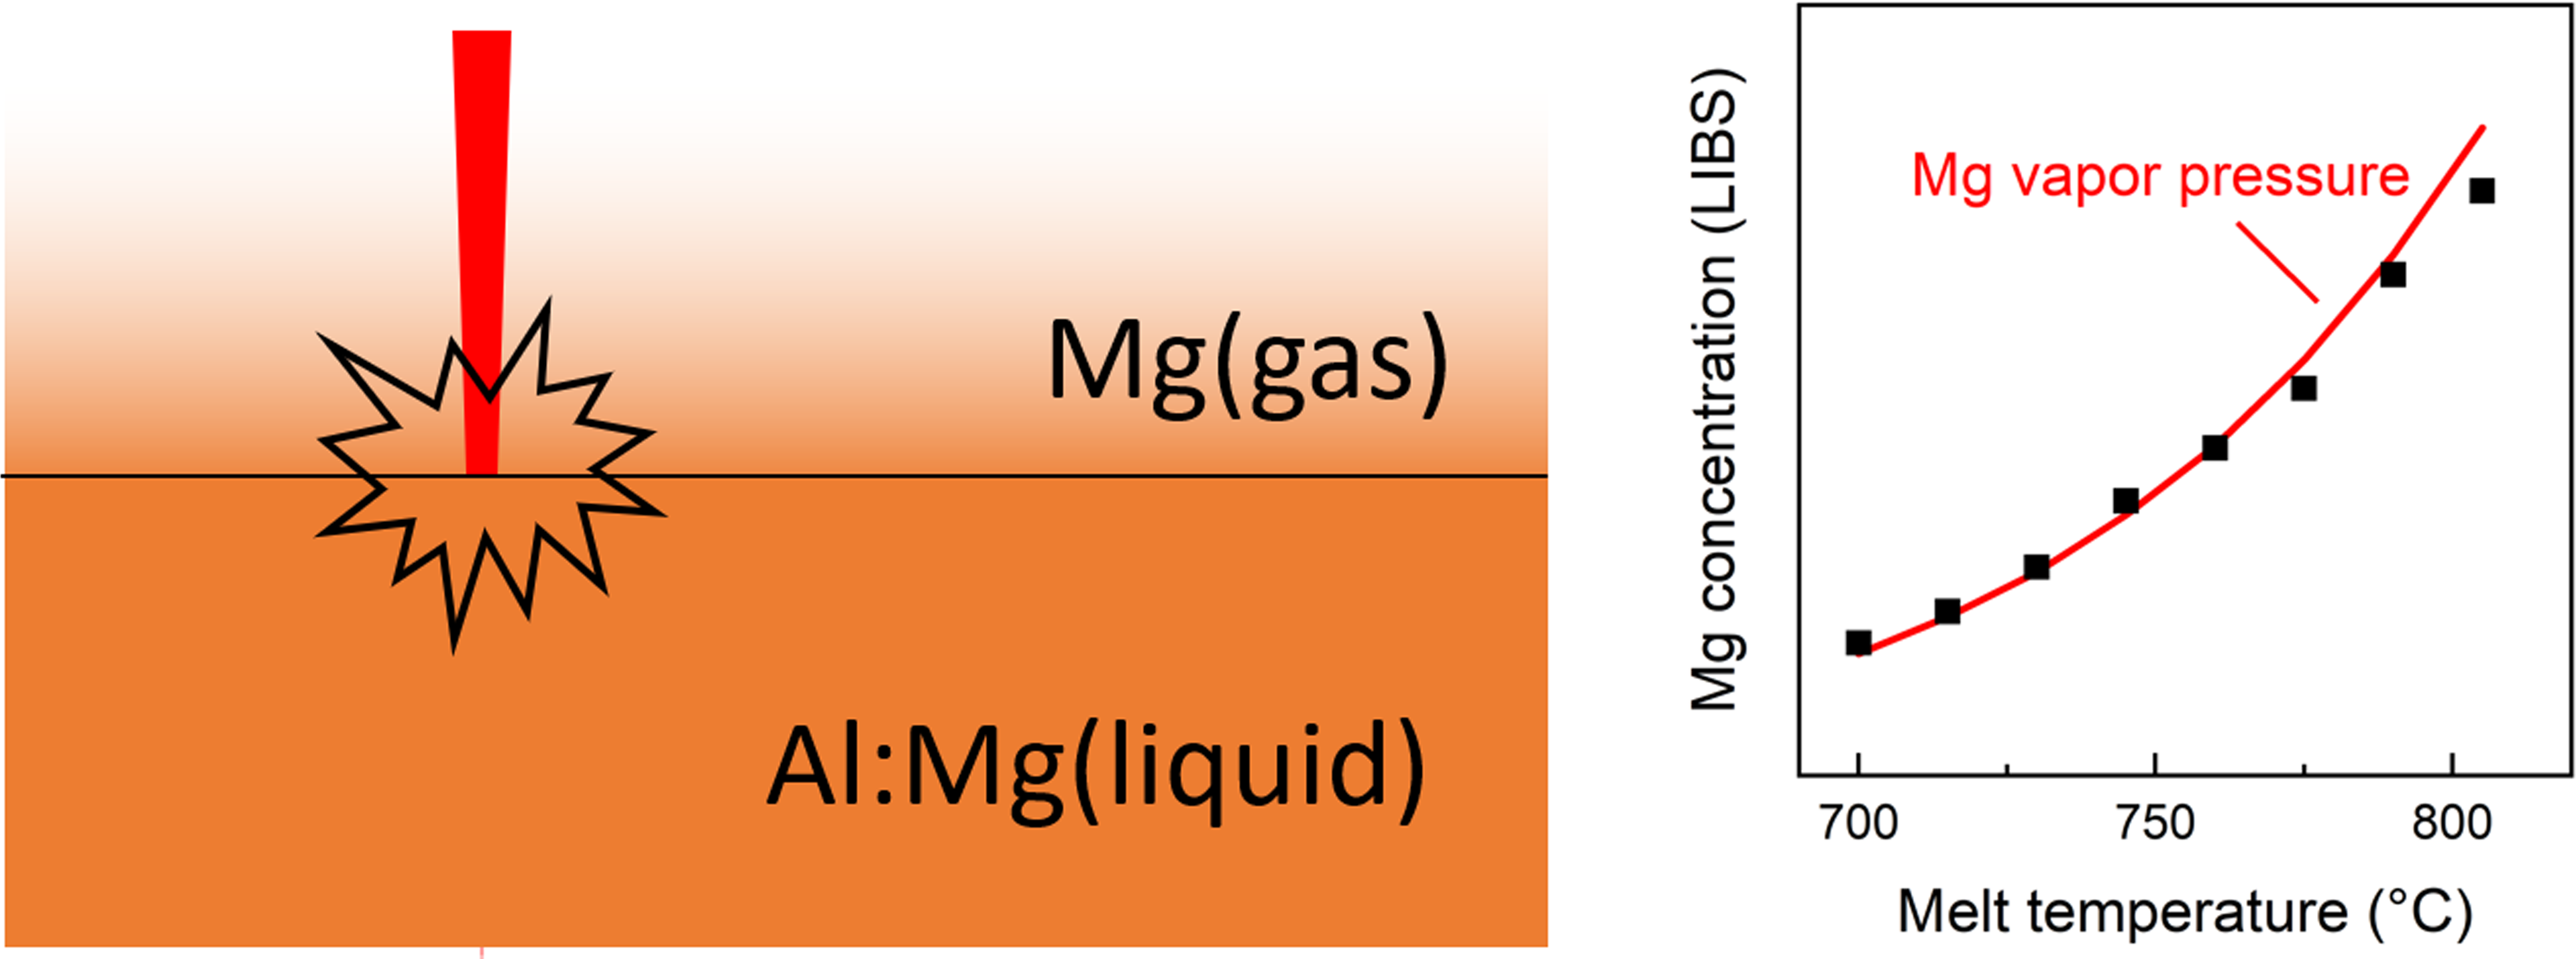
Introduction
Accurate knowledge of chemical composition is of central importance in the manufacturing, refining, alloying, and recycling of metals. 1 Traditionally, characterization of molten metals at various stages of processing involves collecting samples from the liquid melt and casting them into suitable molds, followed by spectrochemical analysis using spark optical emission spectroscopy (spark-OES), X-ray fluorescence, inductively coupled plasma atomic emission spectroscopy, or similar methods. 2 An additional atomic emission spectroscopy method that has been extensively researched in recent years 3 is laser-induced breakdown spectroscopy (LIBS). 4 Unlike the methods mentioned above, LIBS lends itself to direct chemical analysis of molten metals and its potential for in-situ analysis of liquid metals and molten slags has been demonstrated in multiple pilot experiments. 5 Furthermore, LIBS-based analyzers for molten zinc 6 and aluminum7,8 are commercially available and have been implemented at several industrial sites.
It is well known that LIBS plasma emission consists of emission from material ablated from the sample by the impinging laser pulse, as well as from the gaseous environment (usually air or inert gas) immediately above the sample surface. While typically not a concern for solid materials, a significant concentration of atoms or molecules in the vapor phase may be associated with high-vapor-pressure species in a liquid sample. It was previously demonstrated that absorption spectroscopy of the vapor phase above liquid metal provides a means of quantifying the concentrations of certain elements in molten metal, such as Ag dissolved in Cu. 9 To our knowledge, however, the contribution of vapor pressure to the LIBS signal from molten metal has not been studied in detail. One patent application discusses the vapor pressure contribution to LIBS measurements of Mn in liquid steel, 10 where the temperature-dependent intensity of the corresponding LIBS signal is described using an empirical formula. A study that reported LIBS analysis of 14 trace elements in molten primary aluminum (>99% Al) found that measurement repeatability was reduced for the elements having the highest vapor pressures, including Na, Zn, and Mg, where the correlation between the LIBS analysis and a reference measurement on the solidified melt was correspondingly negatively affected. 11
The present paper presents an analysis of LIBS measurements of magnesium in molten aluminum. Magnesium is one of the most important alloying elements in the aluminum industry. Its high vapor pressure and strong reactivity, however, can cause significant loss of material through dross formation. 12 Primary aluminum produced by the conventional Hall–Héroult electrolytic process typically contains only trace amounts of magnesium (in the parts per million, or ppm, range), but Mg is intentionally added to most types of cast and wrought alloys, to specific concentrations typically ranging from 0.5 wt% to 5 wt%. 13 The use of LIBS analyzers for process control in the secondary aluminum industry, including aluminum recycling, therefore requires a comprehensive understanding of Mg emission and its behavior in the melt, in order to determine how the contribution of the vapor phase influences the measured signal.
Materials and Methods
Thermodynamic Considerations
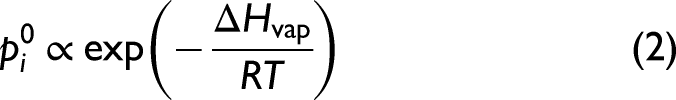
In a closed two-phase (liquid–vapor) system of a single chemical component i, the pressure exerted by the component in the vapor phase is given by its equilibrium vapor pressure

The equilibrium vapor pressure of pure Mg can be described across a wide temperature range with an empirical relationship
15
but in the range of melt temperatures investigated here it follows the simple expression
In the LIBS experiments presented below, the molten metal is not in a closed system and, consequently, there will be a net flux of atoms from the melt surface. The rate of evaporation,
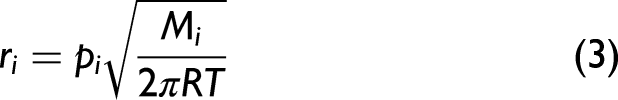
In a LIBS measurement of liquid metal, additional evaporation will occur because of the interaction between the sample and the impinging laser pulses, due to the direct conversion of a volume of the ablated metal to the vapor phase as well as the potential formation of droplets which may additionally contribute to the evaporative flux. In an experiment where the LIBS signal is accumulated over a series of laser pulses, the gas-phase contribution of high vapor pressure components can therefore be expected to depend on multiple factors, including the energy, repetition rate, number of laser pulses, the ambient pressure or ambient gas flow rate, and the geometry of the measurement chamber.
Experimental Setup
In the present work, LIBS measurements were carried out using a molten metal analyzer (DTE ehf.), using a 20 Hz Q-switched neodymium-doped yttrium aluminum garnet (Nd:YAG) laser with <10 ns pulse length and a pulse energy of 90 mJ at 1064 nm wavelength, focused with a 500 mm lens. To eliminate measurement uncertainty due to possible breakdown at random positions within the beam waist in the vapor phase, prior to interaction with the liquid metal sample, the laser beam focus was located at a depth below the sample surface larger than the Rayleigh length, 18 resulting in a laser fluence of approximately 20 J/cm2 at the sample surface. The LIBS analyzer used in the present work is designed and configured to measure dissolved elements in the liquid metal. The goal of the investigation was to determine how the vapor phase additionally affects the measured signal in such a system for high vapor pressure elements, specifically Mg.
The emitted plasma radiation was focused into an optical fiber, as shown schematically in Figure 1, and transmitted to a high-resolution Echelle spectrometer (λ/Δλ≈9000) equipped with a mechanical chopper and a cooled charge-coupled device detector. The delay between the laser pulse and the opening of the detector was set to 2 µs and the detection window (defined by the slit width of the chopper wheel) was substantially larger than the lifetime of the plasma emission. The LIBS measurement was carried out in a partially open argon-flushed chamber (1.6 Ln/min) above the surface of the liquid aluminum (see Figure 1). Immediately prior to each measurement the liquid metal sample was skimmed to remove any oxide layer that might have accumulated on the surface. The molten metal analyzer head was held at a constant distance above the liquid metal during each measurement cycle, which consisted of three or nine accumulations over 300 laser pulses in immediate succession (with 1–2 s passing between sets of pulses), with each 300-pulse accumulation yielding one emission spectrum. After the full measurement cycle, the metal analyzer head was retracted from the surface to prevent overheating. LIBS measurements were also performed on solid samples using the same experimental configuration.
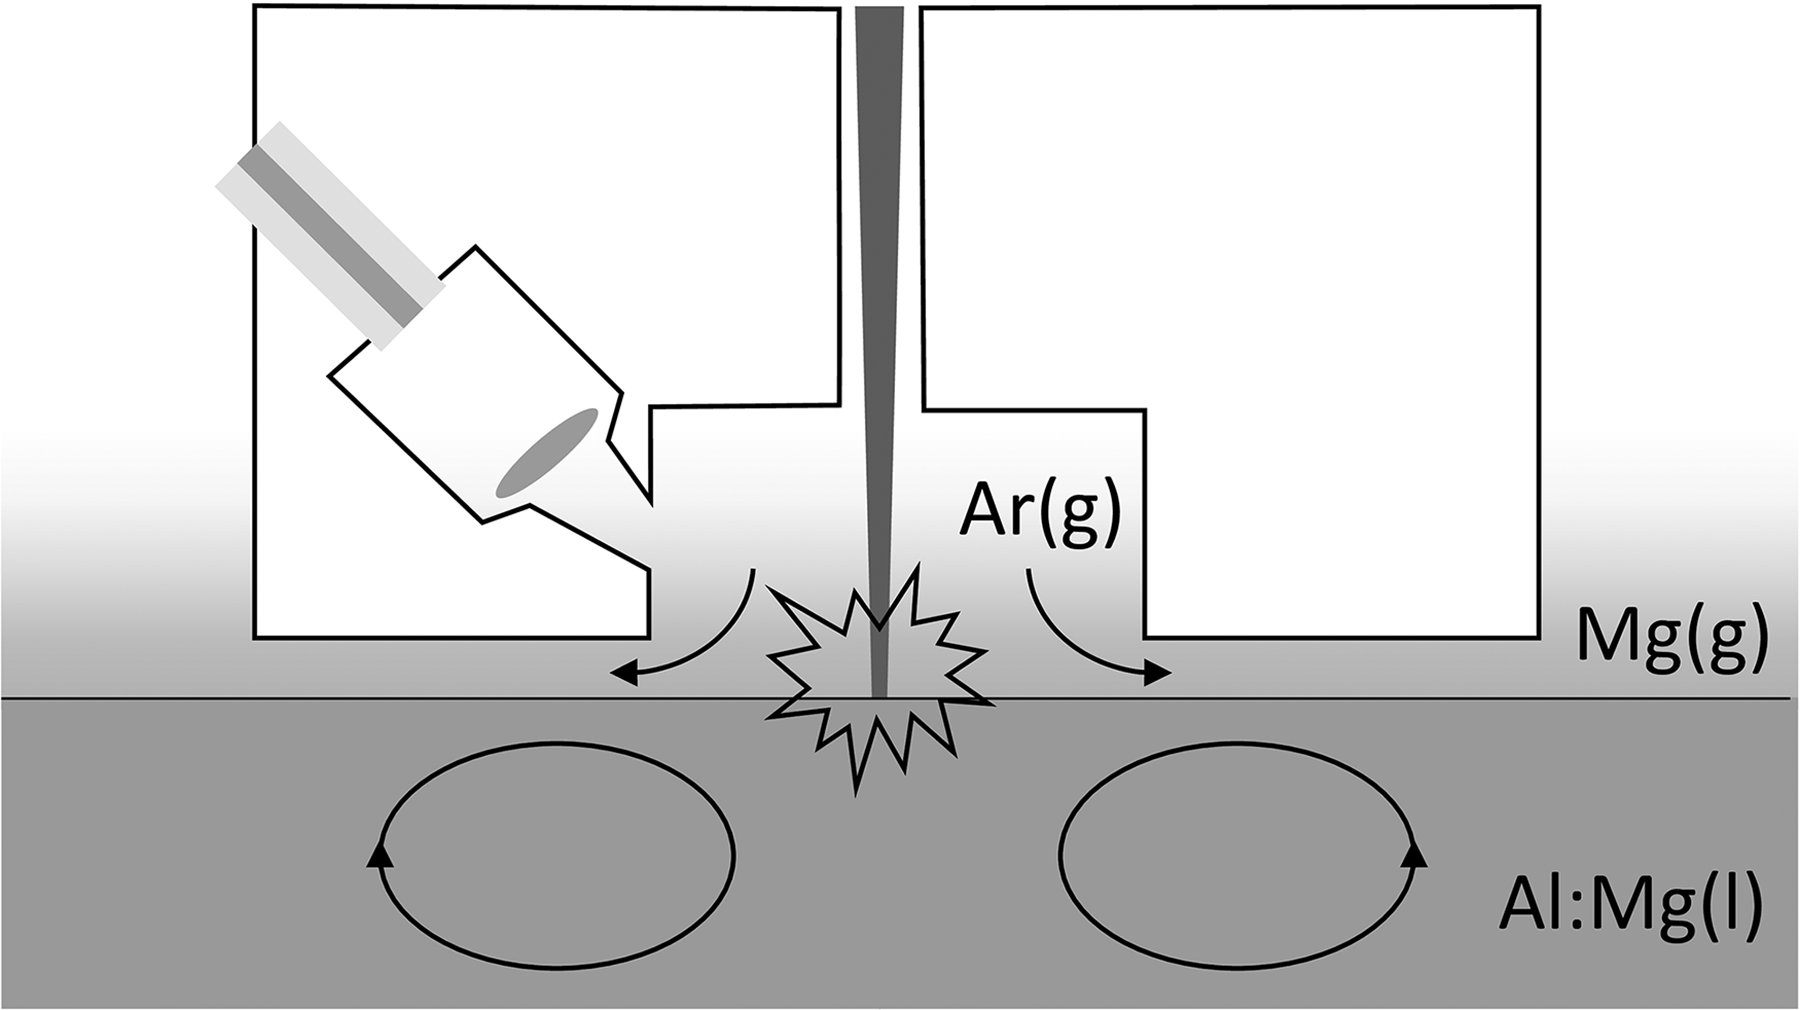
Schematic illustration of the measurement setup. The laser beam is directed onto the liquid aluminum surface and the resulting emission is collected with a lens and transmitted through an optical fiber to the spectrometer. Argon gas passes through the measurement chamber during analysis.
Samples were prepared by melting 99.996% Al (Laurand Associates, nominal impurity content Si 6.2 parts per million (ppm), Fe 2.2 ppm, Mn 3.9 ppm, Mg 1.0 ppm, Cr 1.2 ppm, Zn 2.7 ppm, Ga 5.5 ppm, V 2.4 ppm, and other elements <1 ppm) in a boron–nitride-coated fiberglass–ceramic crucible (Pyrotek RFM) using the induction melter of the liquid–metal analyzer. Weighed pieces of Al(4N6)–1% Mg master alloy or pure (>99%) Mg metal were added to the aluminum melt to achieve different Mg concentrations in the ppm to percent range. The temperature of the melt was continuously monitored with a thermocouple and the induction heater was used to regulate the melt temperature to within ±1 °C, while simultaneously providing electromagnetic stirring of the molten metal during the LIBS measurement. The movement of the surface of the metal due to the electromagnetic stirring or the laser-induced shockwaves did not significantly affect the repeatability of the recorded LIBS spectra that were averaged over hundreds of individual laser pulses.
Following the LIBS analysis of each molten metal sample, the melt was poured into a standard Type B aluminum sampling mold. 19 The resulting solid sample was milled to 1.2 mm depth from the sprue side and analyzed with an ARL iSpark 8820 (Thermo Scientific) spark-OES, standardized using certified reference materials.
Results and Discussion
Magnesium Emission
Figure 2 shows a partial Grotrian diagram for magnesium, based on NIST data. 20 A list of the most prominent emission lines that were observed in the present work (detected wavelength range 210–800 nm) and the associated level energies is provided in Table S1 (Supplemental Material). For Mg(I) and Mg(II), the strongest signals correspond to transitions to the respective ground states and the metastable 2p63s3p triplet state of Mg(I). The transitions from the 3s4d triplet states of Mg to the metastable triplet state overlap with the strong resonance transitions of Al at 308.2 nm and 309.3 nm and are therefore not considered in the present study.
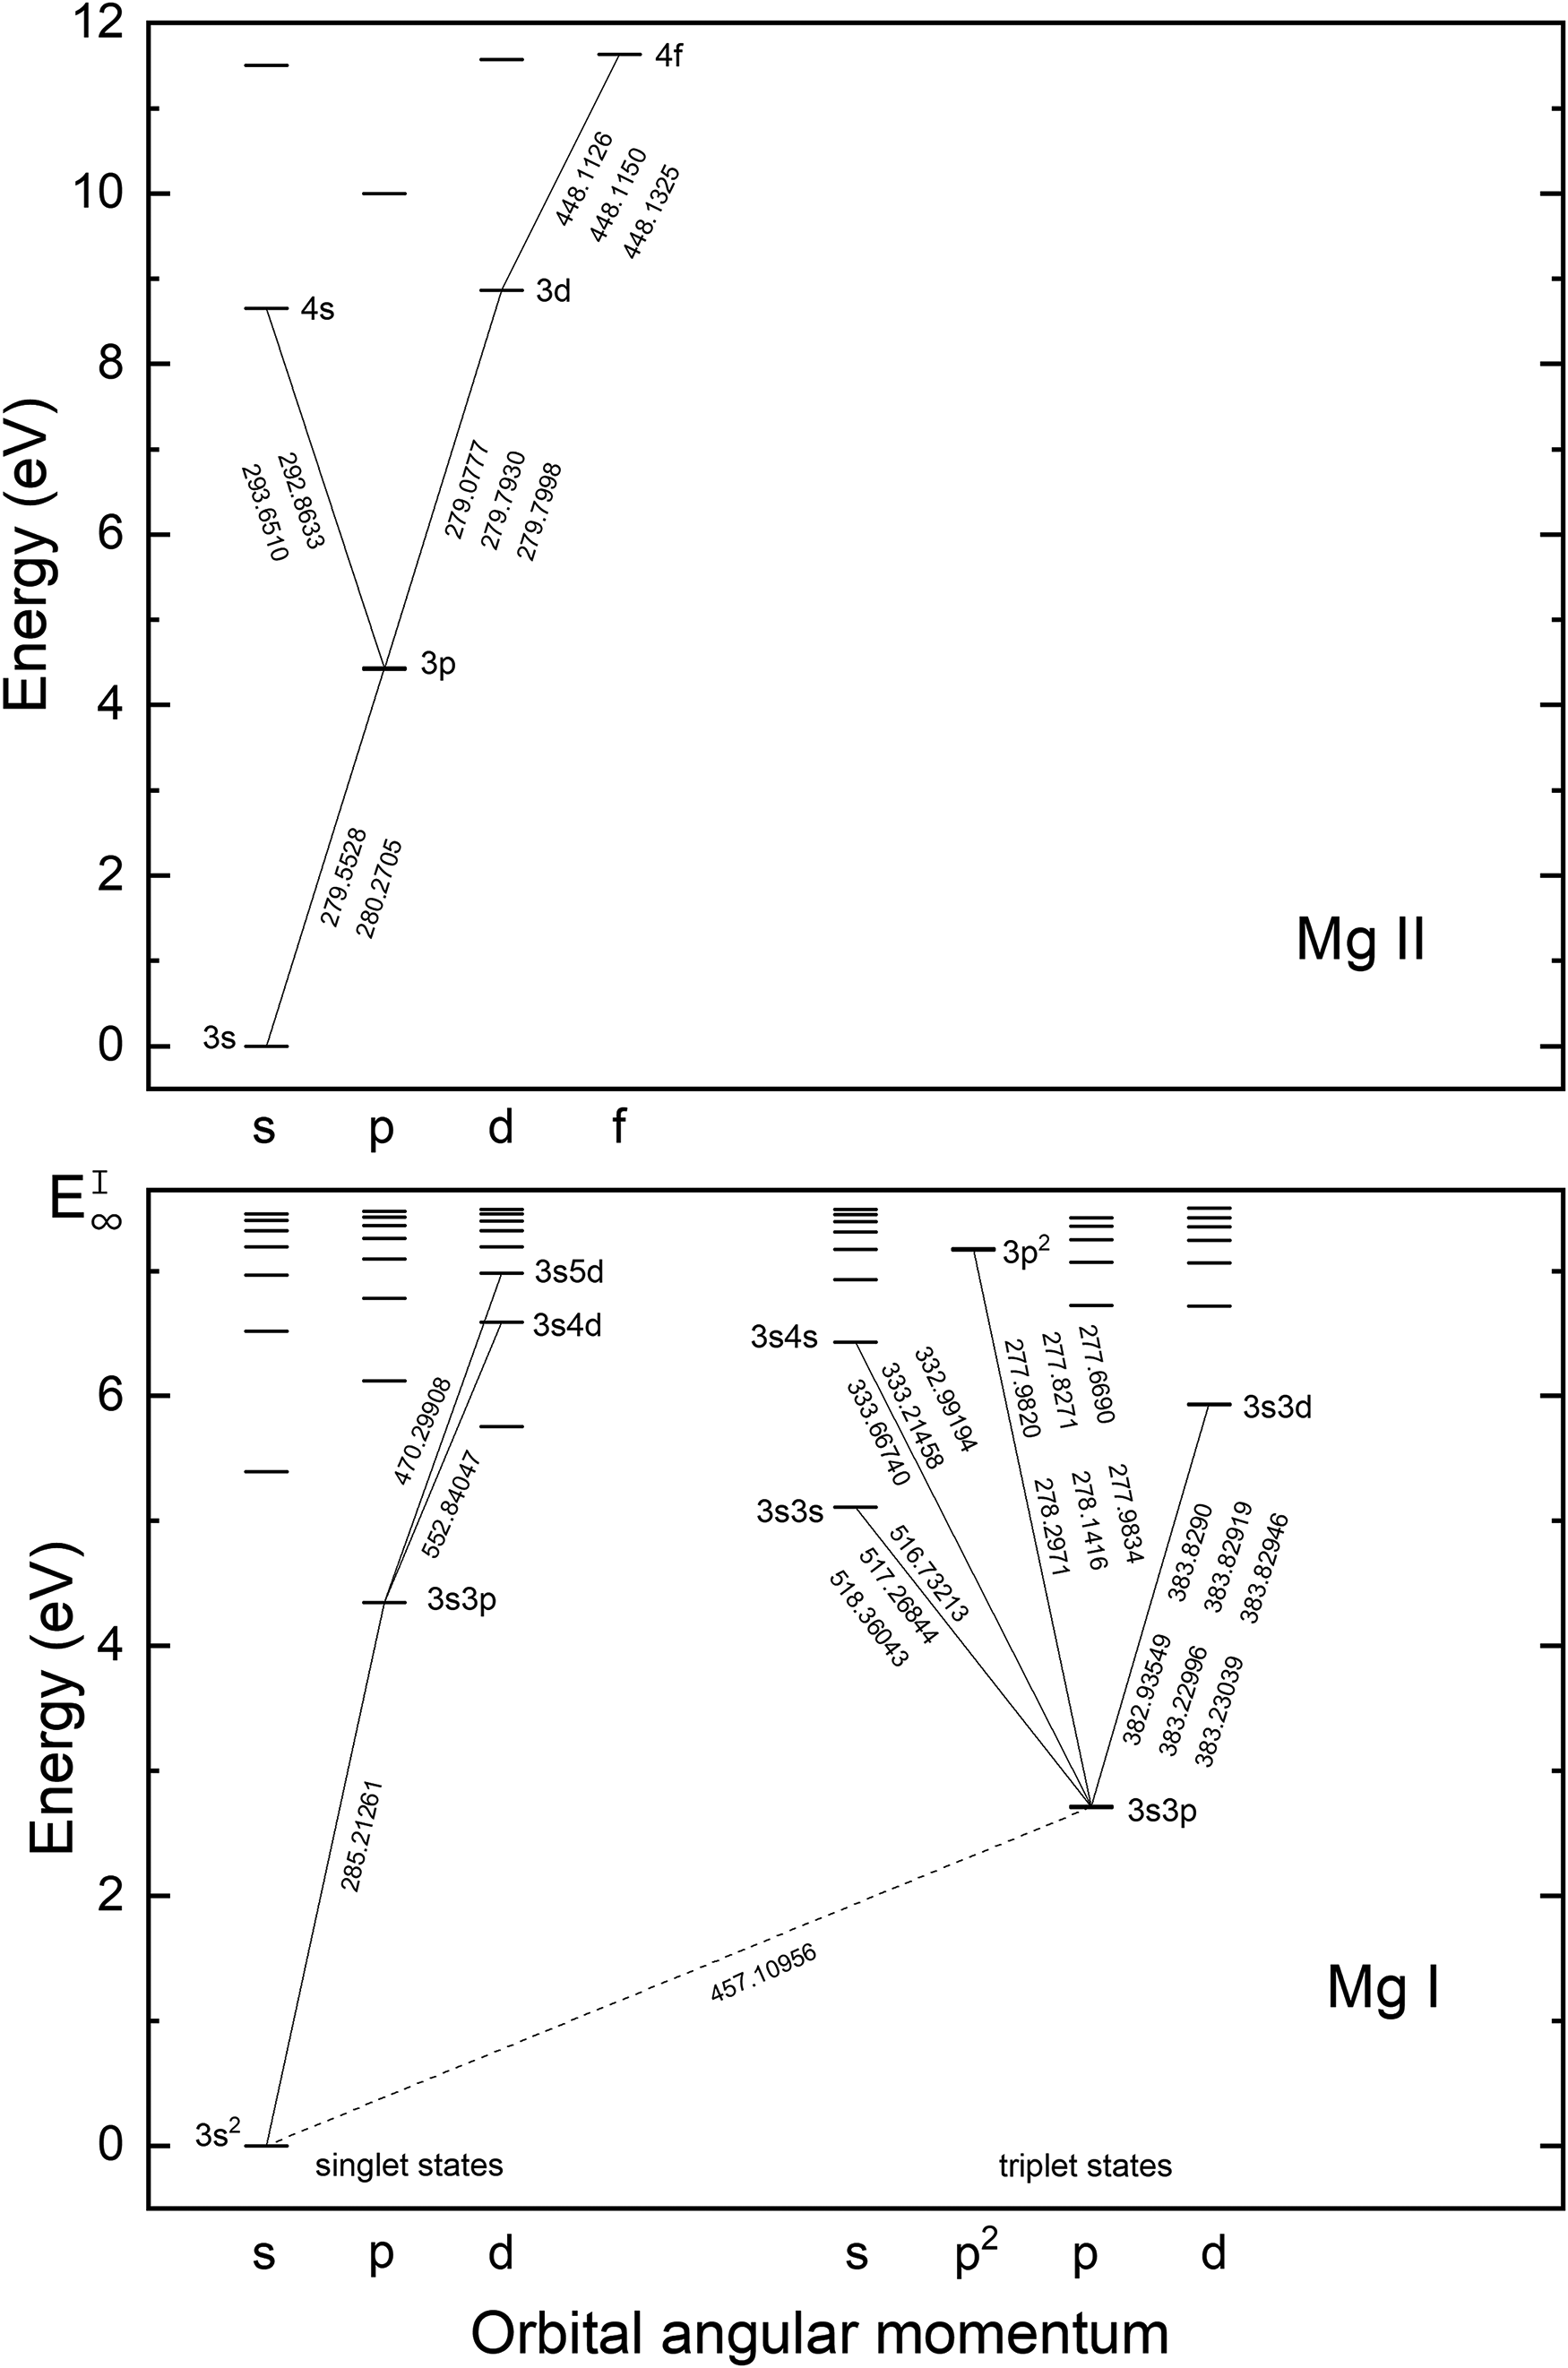
Partial Grotrian diagram of Mg(I) and Mg(II) showing optical transitions relevant to the present work and their associated wavelengths (not all emission lines shown in the figure were spectrally resolved).
Figure 3 shows examples of LIBS spectra from liquid (700 °C) and solid (room temperature) aluminum samples containing low and high concentrations of Mg (0.0002 wt% and 3.8 wt%, respectively, as measured by spark-OES on the solid samples). As previously mentioned, each LIBS spectrum is accumulated over 300 laser pulses. At low Mg concentration, the liquid and solid spectra correspond well to a calculated result, assuming local thermodynamic equilibrium and ionization according to the Saha equation, 21 considering instrumental broadening only. With all other experimental parameters fixed, the Mg emission from the liquid sample with 3.8 wt% Mg, however, is approximately two orders of magnitude stronger than the solid sample of the same Mg concentration, which is much larger than the observed difference in Al emission between liquid and solid samples. In the case of liquid metal, the Mg(I) and Mg(II) ground-state transitions at 2 ppm Mg concentration are clearly observed, with an intensity that was approximately three orders of magnitude above the noise level in the present experiment. Consequently, the detection limit of Mg in molten aluminum can be assumed to be in the ppb range under the present experimental conditions (accurate determination of the limits of detection is outside the scope of the present work). When the concentration of Mg is increased to 3.8 wt%, the LIBS spectrum is characterized by broadened peaks that are not proportional in intensity to the Mg concentration, strong deviations from theoretically predicted relative peak intensities, and strong self-reversal of resonance transitions indicating inhomogeneous plasma/gas conditions. 22 Some evidence of self-absorption is also observed in the corresponding solid sample but to a significantly smaller degree.
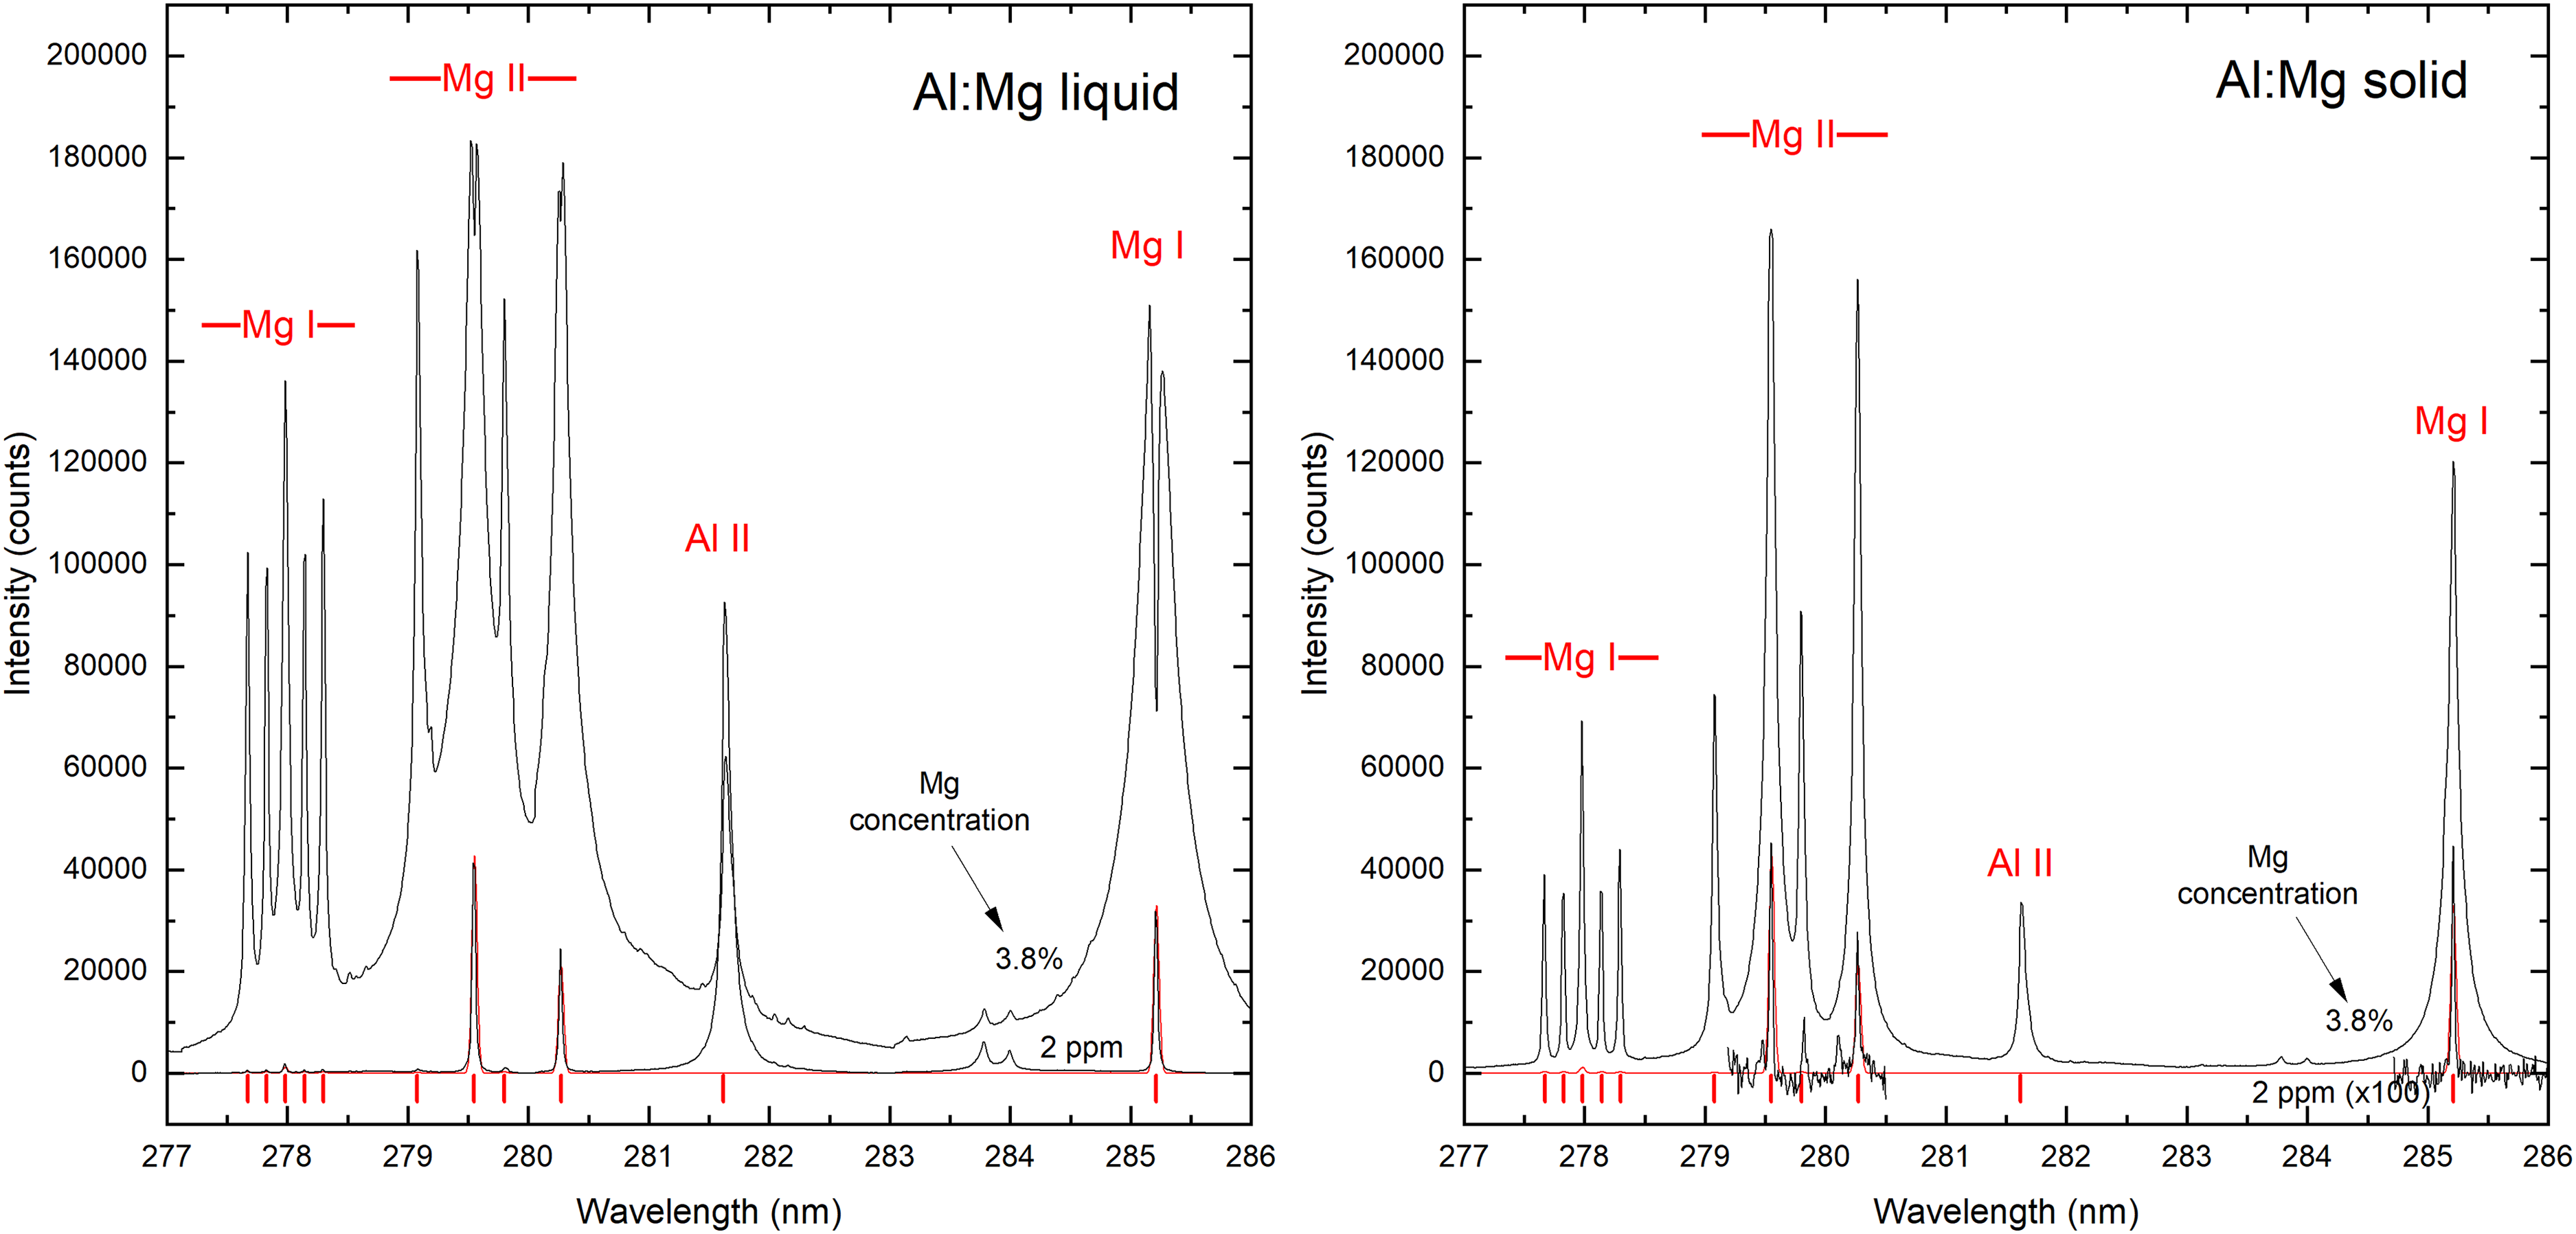
Laser-induced breakdown spectroscopy (LIBS) spectra of liquid (left panel) and solid (right panel) aluminum samples having low (2 ppm) and high (3.8 wt%) concentrations of magnesium. The liquid metal was maintained at a melt temperature of 700 °C. The red line represents a calculated Mg emission spectrum, Mg and Al peak positions are indicated with red vertical lines.
The electron density of the plasma, ne, was determined by analyzing the width of the Al(II) peak at 281.62 nm, corrected for instrument broadening as previously described. 23 Using the electron density as input to the Saha–Boltzmann equation, 21 the plasma temperature, Tp, was estimated from the ratio of the 281.62 nm Al(II) and the 305.0072 nm Al(I) peaks under the assumption of optically thin conditions (the validity of this assumption is supported by the fact that the upper-level energies of these transitions are 11.82 and 7.67 eV, respectively). For 15 solid samples with varying Mg concentration, the value of Tp was found to be constant to within 10 300 ± 100 K, with ne = (5.9 ± 0.7) × 1016 cm−3. For measurements on liquid samples, the corresponding values were Tp = 10 800 ± 100 K and ne = (10.0 ± 0.5) × 1016 cm−3. It should be noted that the determination of electron density and plasma temperature are derived from the time-averaged plasma emission and not instantaneous values.
Curves of Growth
Figure 4 shows the “curve of growth” (COG) for solid (upper row) and liquid (lower row) Al:Mg samples with varying Mg concentration. In the case of solid samples, symbols indicate the peak areas of the Mg emission signals averaged over six accumulations of 300 laser pulses, where each set was directed at a new spot on the sample. In the case of liquid samples (700 °C), measurement sequences of 3 × 300 laser pulses were repeated five times at 3–4 min intervals, with the measurement head fully retracting from the liquid metal surface after each sequence. The symbols and error bars indicate the average value and standard deviation of the five repeated measurements. The x-axis values and error bars represent the average and standard deviation of five repeated spark-OES measurements, determined using low Mg (for <1% concentration) and high Mg (for >1% concentration) calibration programs.
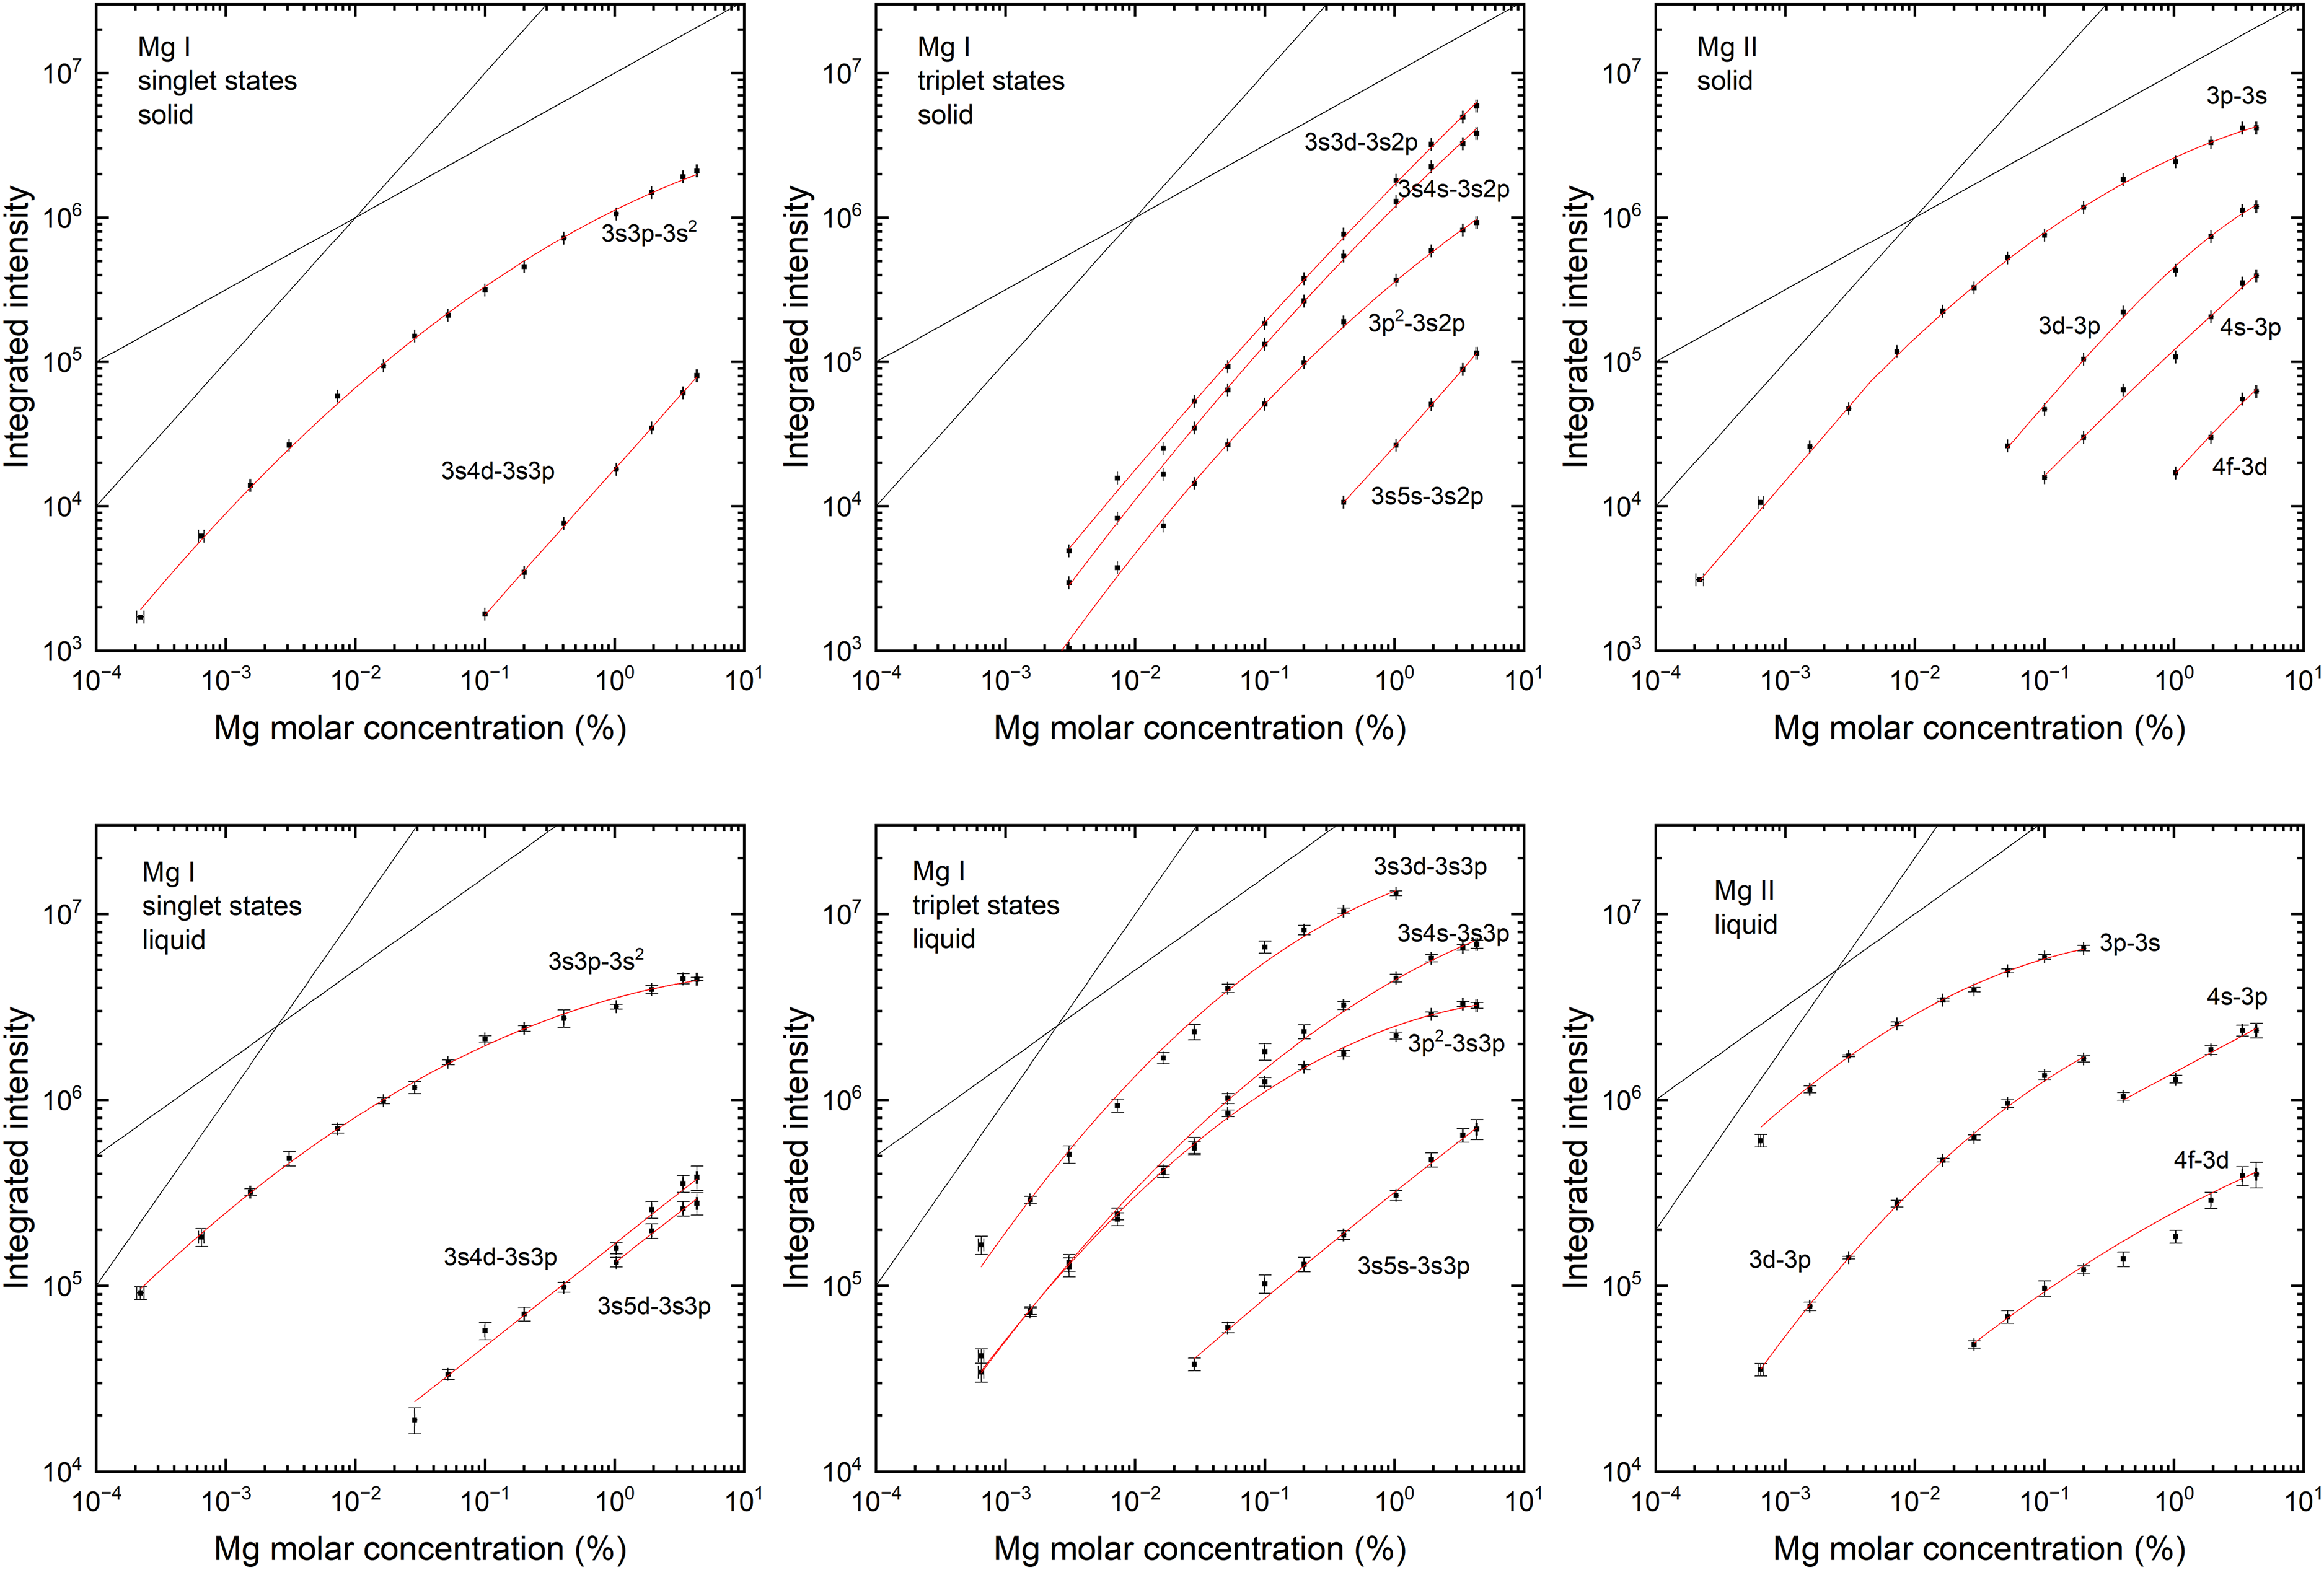
Curves of growth for Mg emission lines on solid (upper row) and liquid (lower row) Al:Mg samples with varying Mg concentration. Solid samples were measured at room temperature while liquid samples were measured at 700 °C. In both cases, the absolute Mg emission is plotted (i.e., not normalized relative to the matrix Al emission). The red solid curves are provided as guides to the eye, without their exact form implying any physical significance. The gray solid lines are provided for reference to show the linear and square-root relationships with increasing Mg concentration.
In LIBS experiments, the COG of a given emission line can typically be expected to show a transition from a linear to a square-root relationship with increasing concentration of the emitting element around a particular concentration value. 24 This was found to be the case for all the studied Mg emission lines on the solid Al:Mg samples, as shown in Figure 4 (upper row). For resonance transitions of Mg(I) and Mg(II), the intersection of linear and square-root asymptotes (parallel to the gray solid lines shown for reference) lies at a concentration of around 0.02% Mg, while for most of the other emission lines, the intersection is at the top of or beyond the measured concentration range. In contrast, measurement on liquid samples (Figure 4, lower row) shows a sublinear dependence on concentration across the whole of the measured range, consistent with a much higher degree of self-absorption of the Mg emission signals. Furthermore, at higher concentrations, the COG slope for the strongest transitions is well below the square-root dependence expected from homogeneous plasma under optically thick conditions, 24 approaching slope values on the log–log COG as low as 0.2 at the top of the concentration range for the most strongly self-absorbed emission lines.
As discussed above, the plasma parameters determined from the aluminum emission peaks are comparable for liquid and solid samples, suggesting that the large observed differences in Mg emission between the solid and liquid samples are not related to the properties of the emitting plasma itself. Furthermore, the fact that the strongly increased signal intensity of Mg in the liquid samples compared to the solid samples is not accompanied by any significant change in the aluminum emission suggests that a dominant part of the Mg signal originates from the vapor phase. This behavior of Mg is not reflected in the temperature dependence of the LIBS emission of solid samples, and it is not exhibited by nonvolatile additive elements such as Fe (see Supplemental Material).
Laser-Induced Evaporation
To investigate whether evidence of the accumulation of Mg in the measurement chamber (Figure 1) could be observed (evaporating naturally and/or due to the contribution of the impinging laser pulses), a series of nine LIBS measurements was carried out in sequence, without retracting the measurement apparatus, using a melt sample containing 0.1 wt% Mg. Figure 5 shows the results of successive measurements at melt temperatures from 700 °C to 805 °C (normalized relative to the respective peak intensities observed in the initial measurements, for clarity), with each point representing an accumulation over 300 laser pulses. Examples of emission lines corresponding to singlet and triplet transitions of the neutral atom are shown, as well as emission from singly ionized Mg. Other transitions in these groups behave in a qualitatively similar fashion. For Mg(I), emission increases for the first five to six measurements before stabilizing, while Mg(II) emission exhibits a more complex behavior. Both electron density and plasma temperature, estimated from Al emission as described above, show a change during the measurement cycles, as indicated in Figure 5. Assuming that the same parameters can be applied to magnesium in the plasma, the plotted Mg emission lines would be expected to decrease by ≈0–17% as a result of the observed changes in ne and Tp. This clearly does not agree with the observed behavior of any of the Mg emission lines.
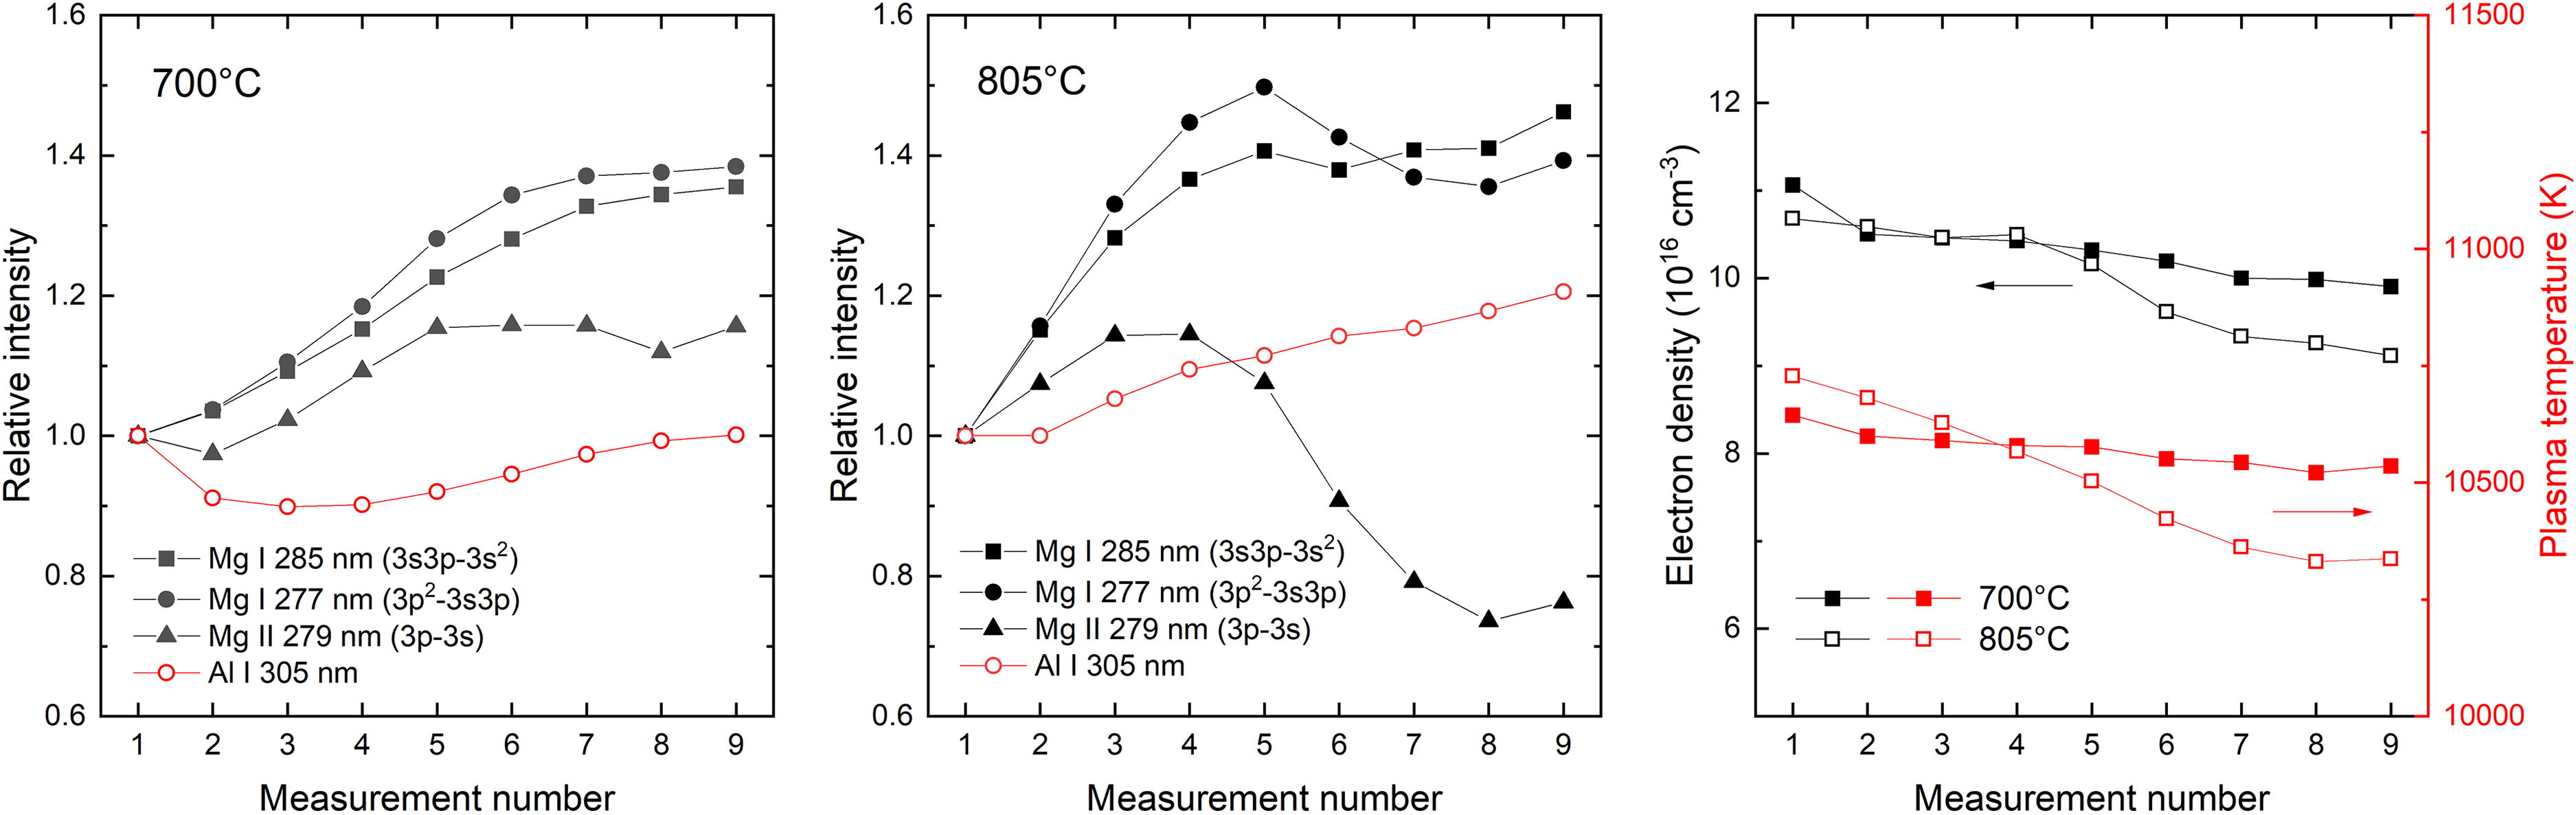
Magnesium (Mg) emission corresponding to selected transitions for successive LIBS measurements performed in a partly confined volume at a melt temperature of 700 °C (left panel, black symbols) and 805 °C (center panel, black symbols). Al(I) emission is shown for reference (left and center panels, red symbols). For clarity, all signals are normalized to the initial measurement value. Calculated values of electron density and plasma temperature, derived from Al emission peaks, are shown for the corresponding series of measurements (right panel).
Considering the curves of growth recorded at 700 °C melt temperature, shown in Figure 4, the ≈40% increase in Mg(I) emission intensity observed in Figure 5 would correspond to a fourfold to fivefold increase in the apparent Mg concentration in the LIBS measurement across the nine successive measurements. At 805 °C, the observed proportional increase is even larger, consistent with a higher evaporation rate. The successive application of laser pulses in a partly or fully closed volume must therefore be considered with care, due to the complex interplay caused by the buildup of vapor of the simultaneously emitting and absorbing volatile species. The measurement uncertainty in Figure 4, for example, where three measurements of 300 pulses were performed in sequence without retracting the measurement apparatus, can be partly attributed to the rapid change in the measured signal.
Temperature Dependence of the Vapor Phase Signal
In accordance with the above findings, a sample of molten aluminum containing 0.1% Mg was measured in the temperature range 700–805 °C, where the Mg concentration was chosen so that emission lines were strong but not overly saturated (see Figure 4), to minimize uncertainty in the determination of the “apparent” Mg concentration from the observed LIBS signal (see below). Furthermore, to minimize the effect of Mg accumulation in the measurement chamber, the measurement apparatus was fully retraced from the melt surface between successive LIBS measurements of 300 pulses. Similarly, single 300-pulse measurements were used to establish a calibration curve in the relevant concentration range at 700 °C, using spark-OES measurements on the corresponding solid samples as a reference. The integrated intensity of the Mg(I) 3p2-3s3p multiplet around 278 nm was used for quantification, but comparable results can be obtained using other emission lines. For improved accuracy, the Mg signal was normalized with a strength of the Al(I) emission at 305.0072 nm.
Figure 6 (left panel) shows how the “apparent” Mg concentration (i.e., evaluated from the measured signal using the calibration performed at 700 °C) increases approximately fivefold for a ≈100 °C increase in melt temperature. The temperature dependence is in good agreement with the expected variation in partial pressure of Mg above the aluminum surface according to Eq. 1, as shown in the figure. Correspondingly, an Arrhenius plot of the same data yields a slope of 124.6 ± 2.5 kJ/mol, which is close to the enthalpy of vaporization of magnesium previously stated. This further supports the hypothesis discussed above, i.e., that the origin of the LIBS signal of Mg mainly originates from the vapor phase above the surface of the molten metal. In Figure 6, there remains an uncertainty related to the proportion of the Mg LIBS signal that originates from Mg ablated with the liquid aluminum, rather than the vapor phase. From the LIBS signal alone, it is not possible to separate these two contributions. However, the linearity of the Arrhenius plot, which decreases if any temperature-independent contribution is subtracted from the measured data, indicates that this contribution is small, especially at the higher melt temperatures. This is further supported by additional temperature-dependent measurements shown in the Supplemental Material.
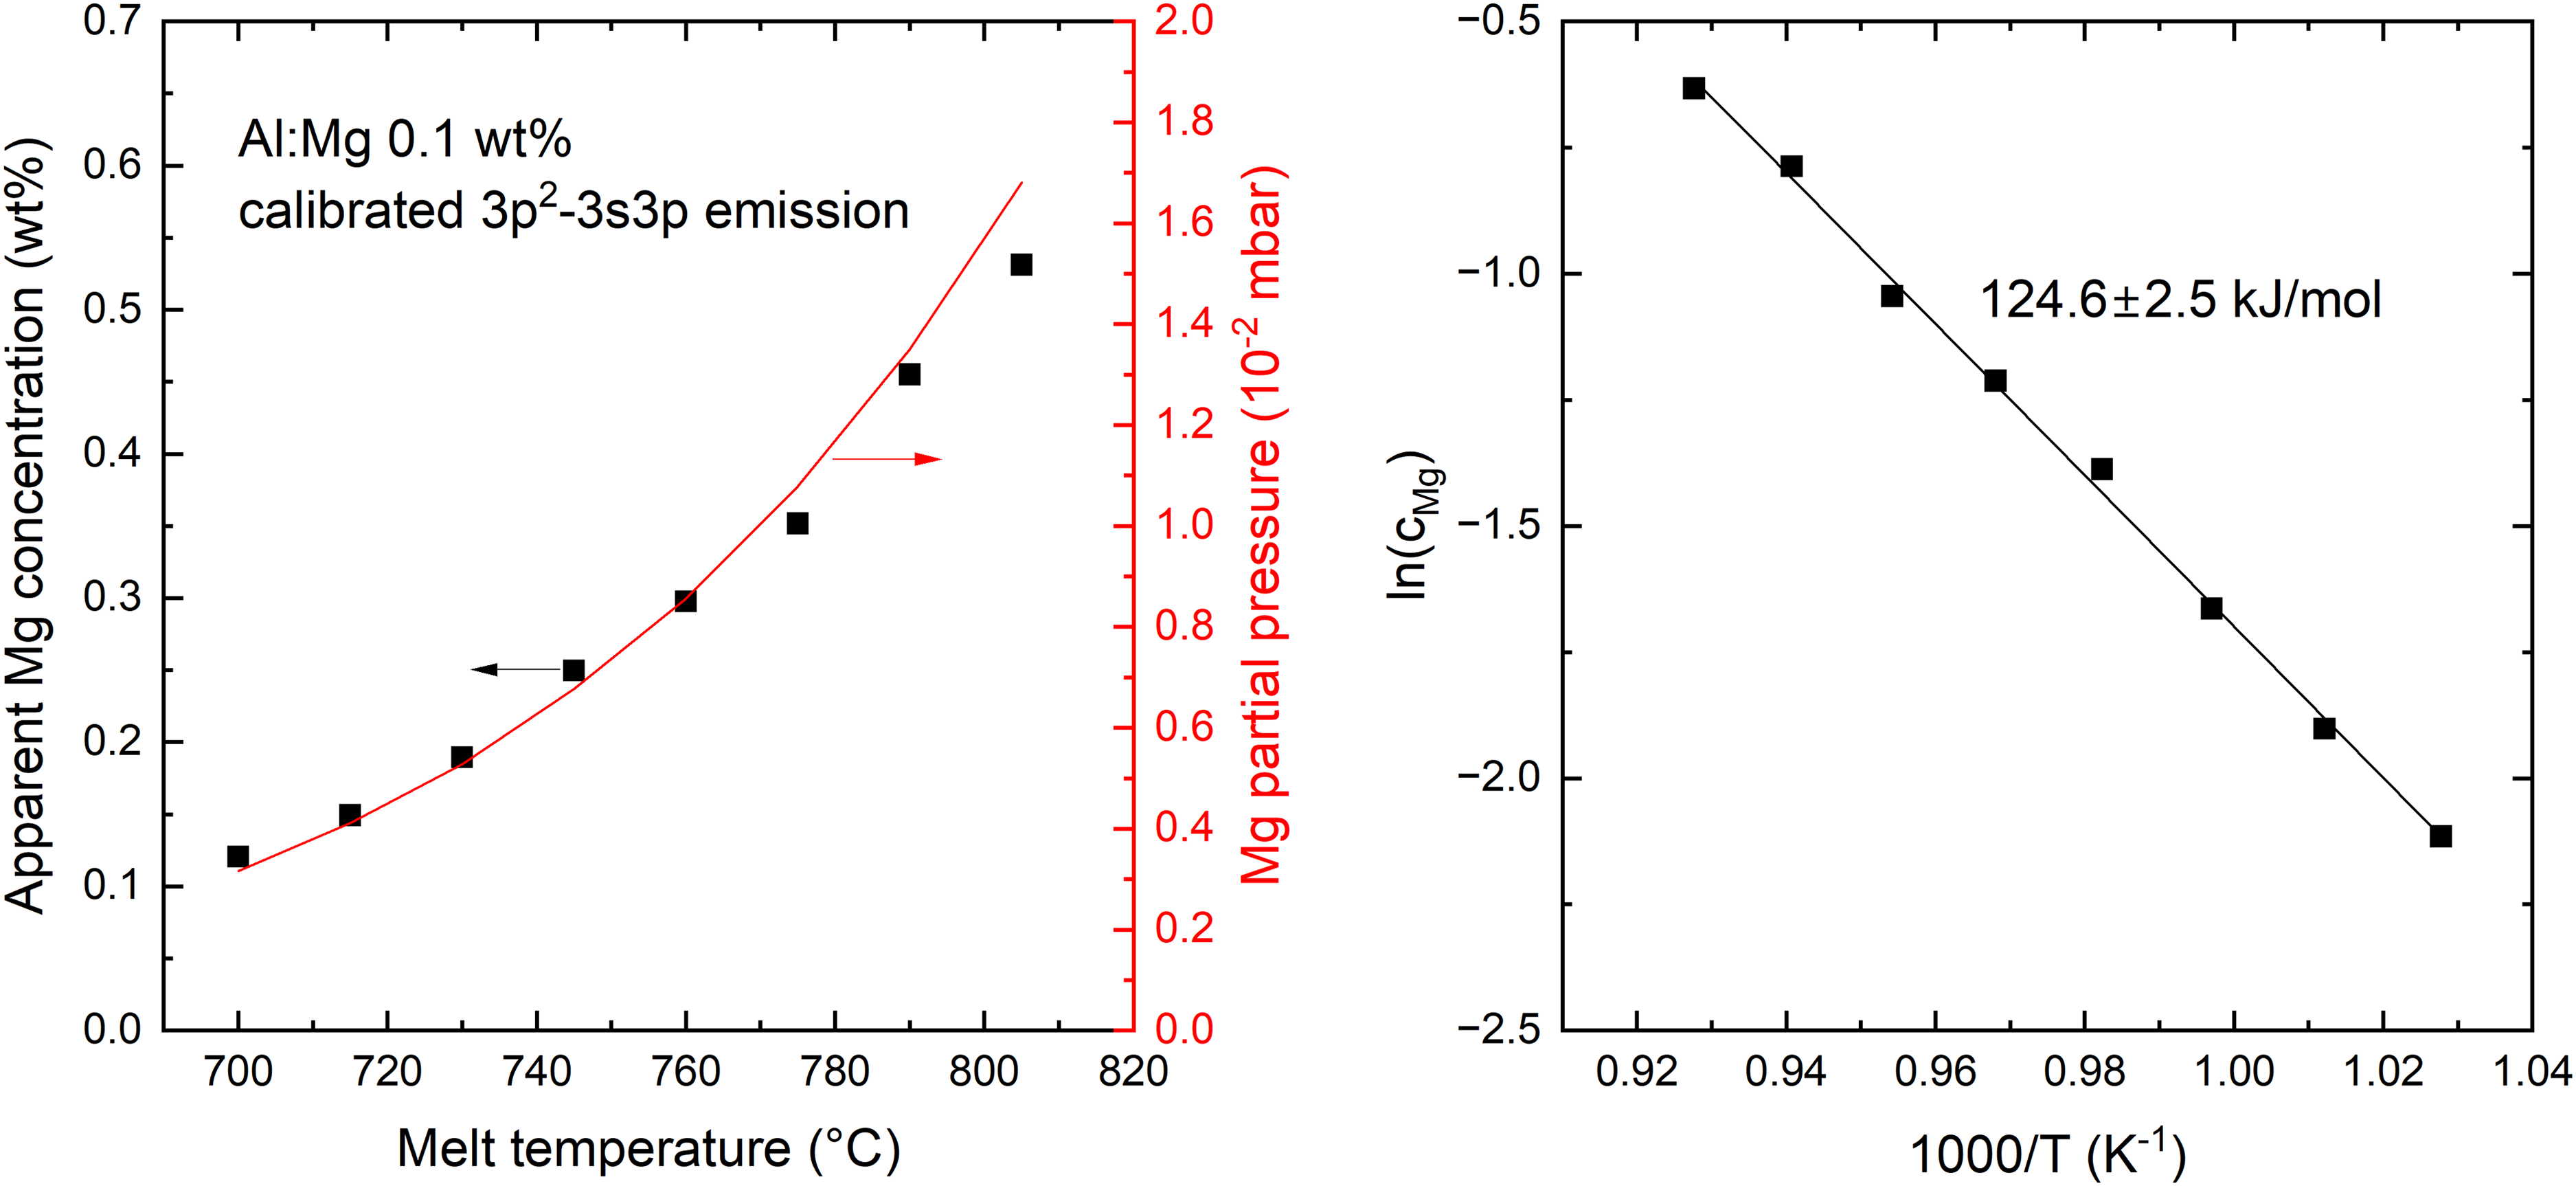
Melt-temperature-dependent Mg emission signal (integrated 3p2-3s3p multiplet emission, normalized by integrated Al(I) emission at 305.0072 nm) revealing an exponential increase in apparent Mg concentration (see details in the text) that correlates with the Mg partial pressure (left panel). In an Arrhenius plot (right panel), the data shows a fitted slope agreeing closely with the enthalpy of vaporization of pure magnesium.
Temperature dependence of the activity coefficient can result in the slope of the Arrhenius plot in Figure 6 (right panel) shifting from the enthalpy of vaporization of the pure substance (since the LIBS emission from the vapor phase is related to
Accurately deriving the concentration of Mg in solution from LIBS measurements, with the experimental conditions used in the present work, requires (as a minimum) an exact knowledge of the surface melt temperature at the time of measurement. It is clear, however, that studies of the temperature dependence of the LIBS signal of volatile species in molten metals can provide valuable information about their behavior in the melt, for example, the effects of microalloying for the mitigation of oxidative loss of Mg. 25 In a recent study, LIBS measurements on off-gassed Na and Ca from molten salts were reported, where the analysis was performed in a chamber that was separated from the molten salt reactor. 26 Such studies, as well as experimental configurations where a breakdown is localized in the vapor phase above a liquid surface, will be of value to further elucidate the mechanisms of evaporation, without contributions from the liquid phase.
Conclusion
We have presented evidence showing that, under the given experimental conditions, a significant part of the LIBS signal of highly volatile elements dissolved in molten metal can be traced to the vapor phase above the surface of the metal. At elevated melt temperatures, this substantially increases the concentration of the given species in the emitting plasma, while simultaneously increasing the self-absorption of the LIBS signal (at least in the case studied here, where the volatile species forms a monatomic gas) beyond what is observed in a conventional LIBS experiment involving nonvolatile elements in solid or liquid form. The interplay between melt temperature, gas flow, measurement geometry, laser pulse energy, and repetition rate, as well as the activity of the given species in solution, makes the interpretation of LIBS results highly challenging. In order for LIBS analysis of volatile elements in molten metal to be a reliable method of quantification, these issues must be well understood. At the same time, the dependence of the LIBS signal on melt temperature provides a way to evaluate the volatility of elements and its dependence on, for example, the interactions with other elements in the melt.
Supplemental Material
sj-docx-1-asp-10.1177_00037028231210324 - Supplemental material for Vapor-Phase Contribution to Laser-Induced Plasma Emission of Magnesium in Liquid Aluminum
Supplemental material, sj-docx-1-asp-10.1177_00037028231210324 for Vapor-Phase Contribution to Laser-Induced Plasma Emission of Magnesium in Liquid Aluminum by Kristbjorg Anna Thorarinsdottir, Mehdi Maghsoudi and Kristjan Leosson in Applied Spectroscopy
Footnotes
Acknowledgments
The authors wish to thank A. Kvithyld and G. Sigworth for enlightening discussions.
Declaration of Conflicting Interests
The authors declared the following potential conflicts of interest with respect to the research, authorship, and/or publication of this article: The authors are employees of DTE ehf., a company that develops, manufactures, and sells LIBS analysis equipment.
Funding
The authors received no financial support for the research, authorship, and/or publication of this article.
Supplemental Material
All supplemental material mentioned in the text is available in the online version of the journal.
References
Supplementary Material
Please find the following supplemental material available below.
For Open Access articles published under a Creative Commons License, all supplemental material carries the same license as the article it is associated with.
For non-Open Access articles published, all supplemental material carries a non-exclusive license, and permission requests for re-use of supplemental material or any part of supplemental material shall be sent directly to the copyright owner as specified in the copyright notice associated with the article.