
Abstract
Monitoring plastic litter in the environment is critical to understanding the amount, sources, transport, fate, and environmental impact of this pollutant. However, few studies have monitored plastic litter on lakebeds which are potentially important environments for determining the fate and transport of plastic litter in freshwater basins. In this study, a self-contained underwater breathing apparatus was used for litter collection at the lakebed along five transects in Lake Tahoe, United States. Litter was brought to the surface and characterized by litter type. Plastic litter was subsampled, and polymer composition was determined using attenuated total reflection Fourier transform infrared spectroscopy. The average plastic litter from the lakebed for the five dive transects was 83 ± 49 items per kilometer. The top plastic litter categories were other plastic litter (plastic litter that did not fall in another category), followed by food containers, bottles <2 L, plastic bags, and toys. These results are in line with prior studies on submerged litter, and intervention approaches or ongoing education are needed. The six polymers most frequently detected in the subsamples were polyvinyl chloride, polystyrene/expanded polystyrene, polyethylene terephthalate/polyester, polyethylene, polypropylene, and polyamide. These observations reflect global plastic production and microplastic studies from lake surface water and sediments. We found that some litter subcategories were primarily comprised of a single polymer type, therefore, in studies where the polymer type cannot be measured but litter is categorized, these results could provide an estimate of the total polymer composition for select litter categories.
Keywords
Introduction
Global anthropogenic litter found in the environment is dominated by plastic items. 1 We operationally define “plastic litter” to mean macroplastic items (>5 mm in its longest dimension) that have been mismanaged and have entered the environment and we define plastic following the California State Water Resources Control Board definition. 2 Plastic litter from land-based sources enters the environment (e.g., through direct input, anthropogenic activities, etc.) and is transported via stormwater, wind, or rivers to other parts of the watershed.1,3 Along this transport path, plastic litter may be deposited into freshwater lakes, where it may settle and be retained on the lakebed. Lakebed plastics are difficult to remove and will persist in the environment for decades. 4 Freshwater lakes and reservoirs are therefore at risk of becoming plastic litter sinks. However, little is known about the amount and types of submerged plastic litter accumulating in these environments.
Monitoring plastic litter in freshwater environments is critical to determining the sources of plastic pollution, understanding the movement and sinks of plastic litter, and informing policy. Plastic litter monitoring approaches reflect the scientific, management, and/or policy questions to be addressed.5–7 Generally, plastic litter monitoring efforts collect data on litter typology (e.g., bottle, cap, bag, etc.), count, weight, volume, and site information.1,7 Methodologies for monitoring pelagic plastics typically include using a net or trawl, or visually counting floating plastic litter.5,8–13 Monitoring benthic (or submerged) plastics is more difficult and has been achieved through bottom trawl surveys, self-contained underwater breathing apparatus (SCUBA) diving surveys, or remotely operated vehicle (ROV) surveys, as well as other surveying approaches.14–17 Understanding the spatial and temporal distribution of submerged plastic litter informs the sources of plastic litter, but transport and depositional processes must also be considered. For example, currents and circulation patterns can redistribute plastic litter, and lake or seabed substrate (e.g., large boulders, ledges) and bathymetric features (e.g., channels) can affect the distribution of submerged plastics.14,18–21 Although much of the prior research on submerged plastic has been conducted on microplastics (plastic particles with at least three dimensions ≥1 nm to ≤5 mm; California State Water Resources Control Board 2 ) in sediments,22–24 or on benthic plastic litter in marine environments.14,16,17,21 these prior studies can be compared to submerged litter in freshwater lakes and reservoirs to aid with understanding plastic fate and transport.
Upon entering the environment, plastic litter can undergo physical, biological, or chemical degradation. These degradation pathways often work in combination. Physical degradation results in fragmentation of the plastic debris by mechanical processes such as abrasion. 25 Biological degradation includes the ability of microbes to utilize plastics as a carbon source and degrade the polymer. 4 Chemical degradation results in changes at the molecular level and reduces the polymer's molecular weight.25,26 This includes photo-oxidation and hydrolysis. Photo-oxidation from ultraviolet (UV) light results in oxidative degradation of the polymer, making plastics brittle and subject to fragmentation.4,25,27,28 Hydrolysis is the process of water reacting with the polymer resulting in chemical changes of the polymer. 4 Changes to the chemical composition depends on the type and amount of chemical degradation.25,28 For example, prior studies have shown an increase in the carbonyl content of polyethylene (PE) and polypropylene (PP) following UV exposure.25,29
Analysis of the chemical composition of plastic litter can also provide information on the potential toxicity of plastic litter and the fate of the plastic litter. For example, analyzing the polymer type of plastic litter in aquatic ecosystems could then be compared to microplastic studies from the same water body. The type of litter polymer can also provide information on the potential negative impact on aquatic ecosystems because of polymer-dependent toxicities 30 or derived by-product toxicities (e.g., 6PPD-Quinone 31 ). In summary, there is a systematic lack of information on submerged plastic litter in freshwater lakes/reservoirs which may be important for understanding the fate of plastic pollution in watersheds.
Prior Litter Research at Lake Tahoe
Lake Tahoe is located on the border of Nevada and California in the western United States. Lake Tahoe is an important drinking water resource, habitat for aquatic species, and a popular outdoor recreation area for upwards of 15 million visitors annually. 32 Therefore, assessment of anthropogenic impacts on Lake Tahoe is important. In 2020, Clean Up the Lake (CUTL; a 501(c)3 nonprofit organization located in Nevada) led a SCUBA-enabled cleanup of litter along Lake Tahoe, Nevada, lakebed at six transects, 33 five of which are studied here. The results from this prior work by CUTL are summarized by Harrold et al. 33 The authors showed that the divers removed 797 kg of litter, with an average of 114 ± 38 kg per transect. 33 Metal was the most prevalent by weight, followed by plastic. 33 The plastic litter type most prevalent (by weight) was “other plastic” and fiberglass fragments, however, single-use items and recreational equipment were important components of the plastic litter. 33 Spatial trends showed that litter accumulation was related to the presence of a rocky lakebed and the proximity to popular visitor areas/populated areas. 33 Questions remain about the transport of litter to Lake Tahoe, the sources of litter, and the spatial variations, however, this work suggests that Lake Tahoe's lakebed may act as a sink for litter.
In addition to this prior work by CUTL, a recently published comparison of plastic particles >250 μm across 38 lakes and reservoirs from around the globe demonstrated that the surface water of Lake Tahoe had microplastic concentrations of 5.4 particles/m3 and was found to be the third most contaminated waterbody studied. 34 Across all the sites, the microplastics were primarily fibers (49.5%) and fragments (41%) comprised of polyester (PEST; 30.4%), PP (20.3%), and PE (15.7%). 34 This work showed that lakes with urbanized watersheds and lakes with high surface areas and long residence times are at risk of microplastic pollution. 34 For the Lake Tahoe surface water sample, the plastic particles were primarily fragments followed by other shapes and filaments, primarily clear, black or white in color, and comprised of PP followed by PE. 34 Questions remain about the sources of microplastics to Lake Tahoe, the spatial and temporal variation of microplastic concentrations in surface water, among other questions.
This study builds on the prior work of CUTL at Lake Tahoe, Nevada. We utilized the plastic litter collected and sorted by CUTL to count the number of plastic items by plastic litter category as an additional metric for the assessment of plastic litter present on the lakebed. Additionally, we subsampled the plastic litter to measure the chemical composition. Our goals were to address the following questions: (i) What are the most prevalent polymer types (e.g., PE, PP) found in submerged plastic litter in Lake Tahoe? (ii) Is polymer composition specific to a litter type (e.g., food containers, straws)? (iii) Are there spatial trends in submerged litter polymers in Lake Tahoe? Are there spatial trends in plastic litter counts per kilometer? In this study, we build on prior plastic litter research and research in Lake Tahoe to assess submerged plastic litter by counts, polymer composition, and litter type.
Site Description
Lake Tahoe (elevation 1878 m) is an ultra-oligotrophic lake at the border of California and Nevada in the Sierra Nevada range (elevations of 3318 m) of the western United States (Fig. 1). Lake Tahoe drains into the Truckee River basin, providing drinking water to communities around the lake and downstream cities (e.g., Reno–Sparks metropolitan area), and terminates at Pyramid Lake. The lake has a surface area of 500 km2, an average depth of 313 m, a maximum depth of 505 m, and a residence time of 650 years.35,36 Sixty-three small streams drain the 800 km2 forested watershed surrounding Lake Tahoe.35,37 Two large gyres contribute to mixing, one to the north and one in the south-central region. 38 The lakebed is characterized by a narrow and flat nearshore zone with cobble and boulder zones, followed by a steep slope to the lakebed, 39 and the lake floor is covered with mud and clay sediment. 40 Lake Tahoe is also an important habitat for many aquatic species, including endangered and threatened aquatic species. 41 There are a variety of land use types around Lake Tahoe 42 and approximately 6% of the watershed is urbanized 37 (Fig. 1). Today, approximately 15 million visitors per year visit Lake Tahoe's beaches to recreate outdoors. 32
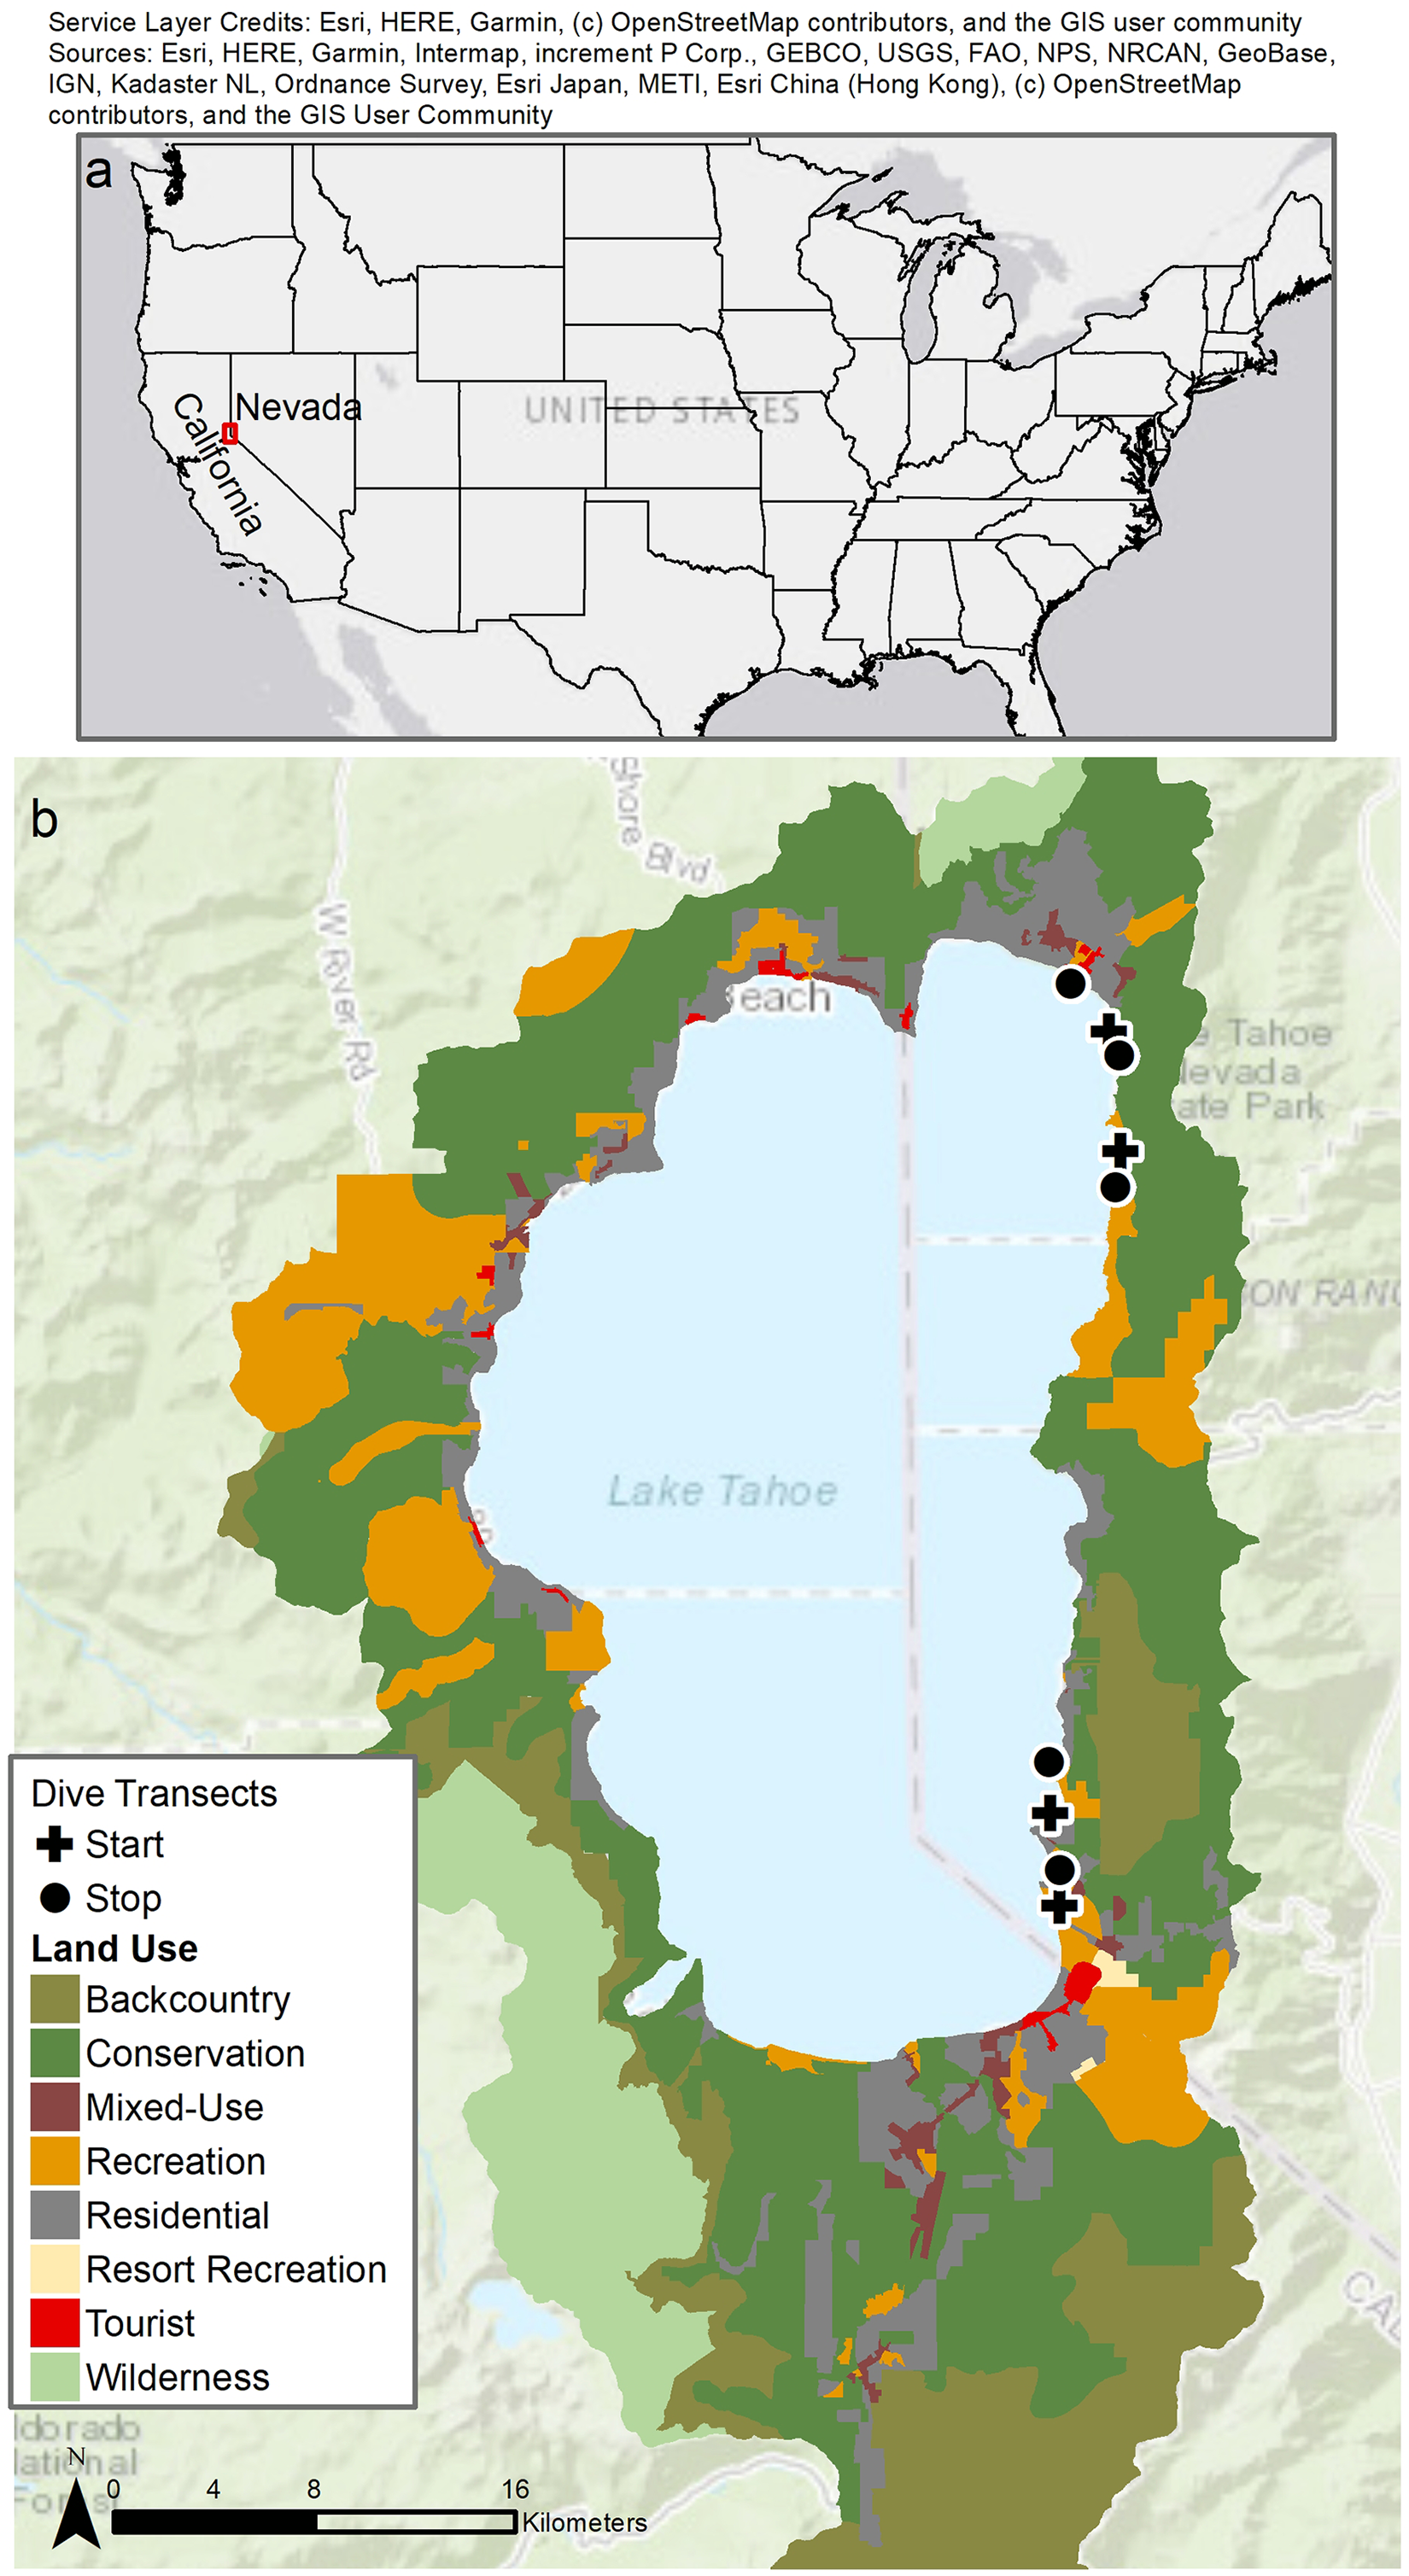
Map of the study area. (a) Map of the United States with the study area (red box) and the states of California and Nevada labeled. (b) Dive start and end locations are shown, and the dive transects are shown as black lines. Lake Tahoe land use is also shown. 42
Materials and Methods
In 2020, CUTL led a SCUBA-enabled cleanup of litter along Lake Tahoe's lakebed. 33 Herein, we briefly summarize the methods used by CUTL to collect and sort the litter and additional details are available in Harrold et al. 33 This is followed by details on the methodology used to subsample plastic litter and characterize the polymers.
SCUBA-Enabled Litter Removal
Clean Up the Lake (CUTL) conducted litter removal from 11.4 km of Lake Tahoe's lakebed across six dive days in Lake Tahoe, Nevada. 33 Five of those dive-day transects were studied here (Fig. 1). SCUBA divers collected litter from water depth < 7.6 m, traveling parallel to the shoreline. Each dive day was < 2.4 km with two to three dives per day and one to two dive groups completing the dives. Each dive had a dive plan, dive safety protocol, and a dedicated surface team. During each dive, at least two divers swam along the subsurface and collected all submerged litter into dive bags, which were then pulled to the surface using a rope. Litter from each dive was weighed and labeled by day number (e.g., days 1–6), dive number (e.g., dive 1), and group (e.g., A or B). The field parameters collected included the names of divers and surface support, start and end locations, collection date and time, total weight of trash removed per dive and per day, and other parameters (see Harrold et al. 33 for further details of field parameters). All field parameters were input into Wildnote (https://wildnoteapp.com/), a web-based data input program to ensure field parameters were input at all sites in the same manner (replacing traditional paper datasheets).
Litter Type Sorting and Data Collection
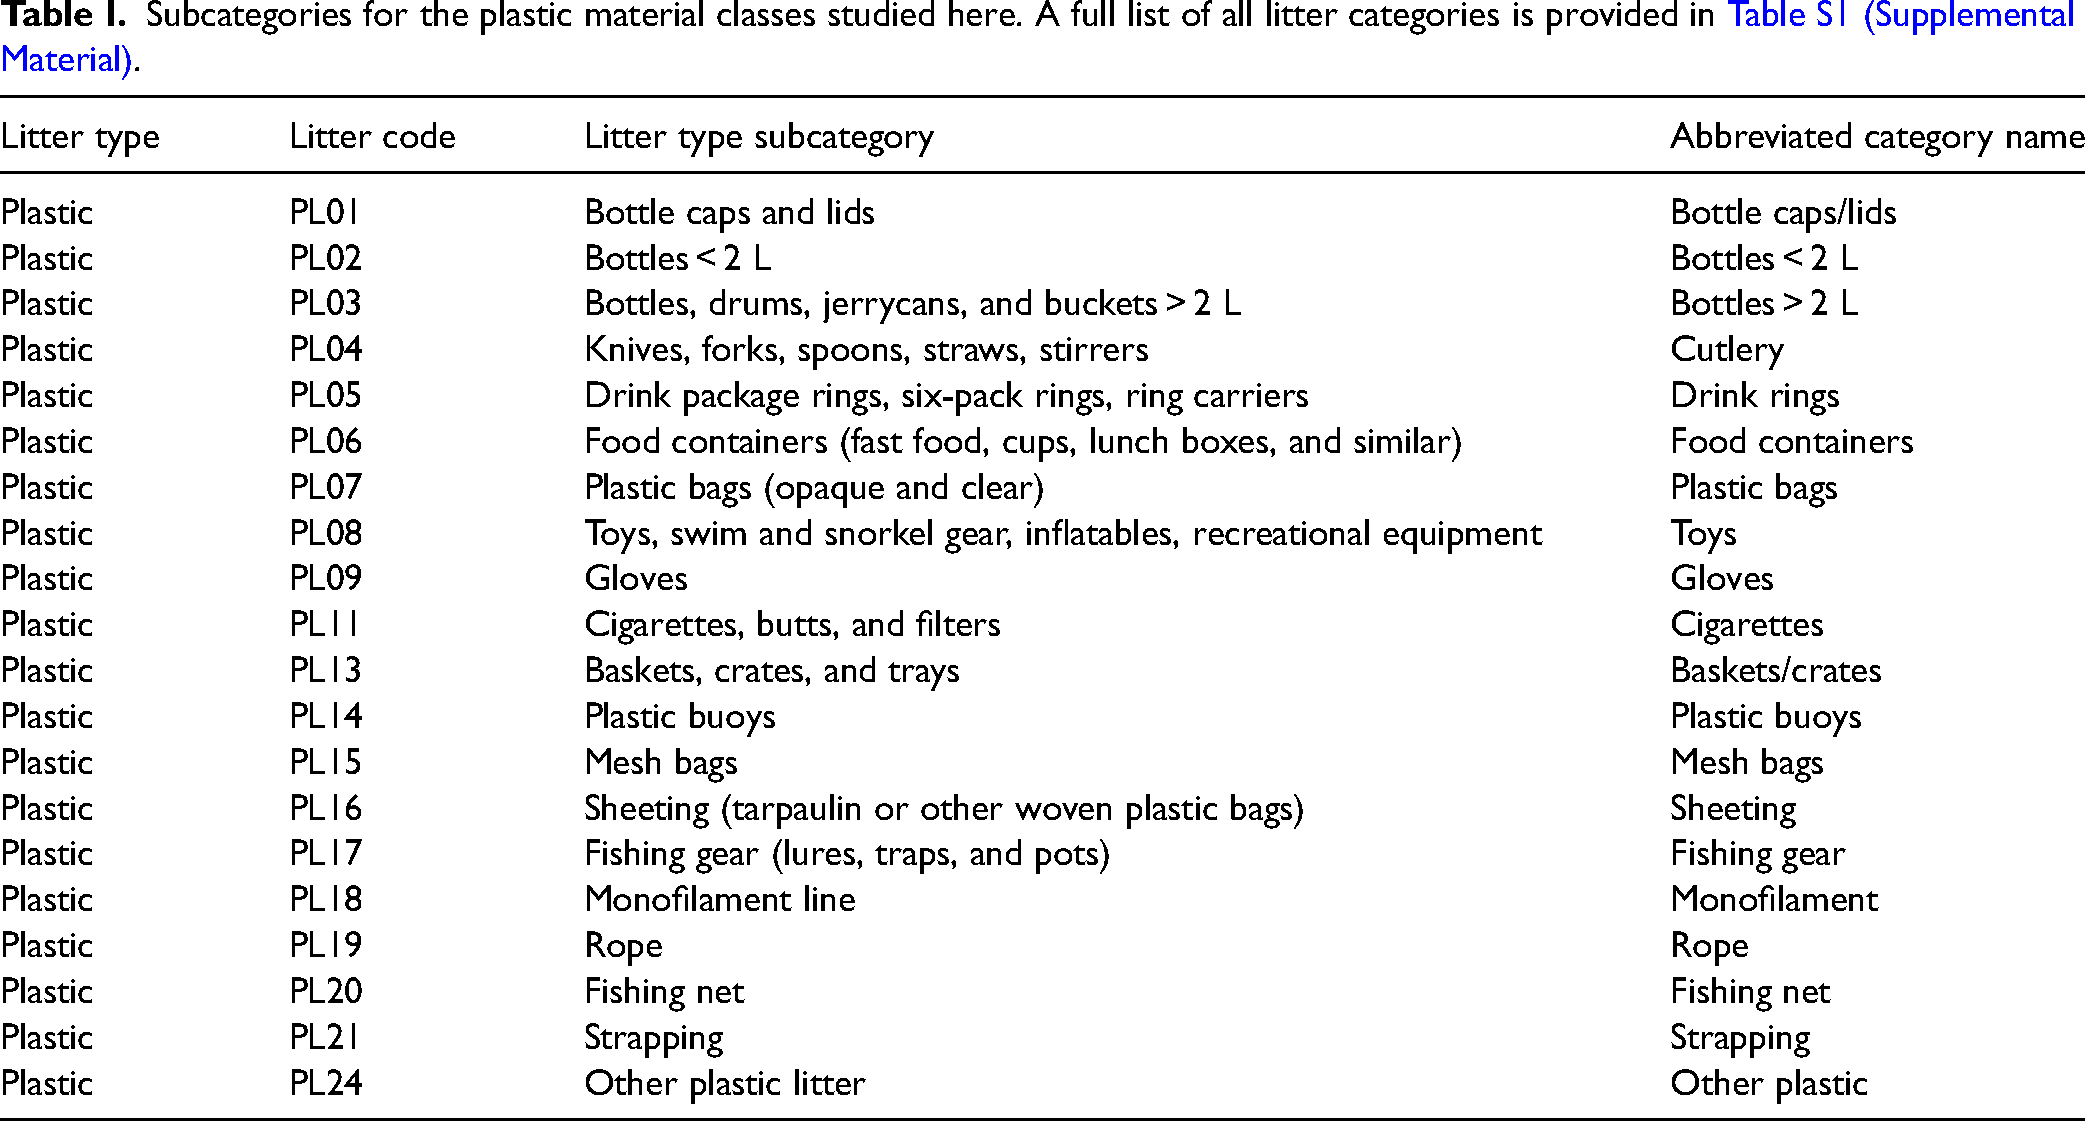
Litter was sorted into categories using the United Nations Environmental Protection/Intergovernmental Oceanographic Commission (UNEP/IOC) marine litter scheme for plastic. 43 Much like other litter sorting approaches (e.g., Hapich et al. 7 ) litter was first sorted into a material class (e.g., metal, plastic, rubber, etc.), and then into litter subcategories by item type (e.g., bottles < 2 L, bottle caps, etc.). Table S1 provides a list of all 77 litter type categories used by CUTL, with the list of the subcategories for the plastic material class studied herein provided in Table I. Some changes to the UNEP/IOC marine litter scheme were made, for example, the paper (including newspapers and magazines) category 43 was not included in CUTL's sorting (Table S1, Supplemental Material). After sorting each dive into litter subcategories by item type, CUTL weighed each category, photographed, and input the data into Wildnote.
Subcategories for the plastic material classes studied here. A full list of all litter categories is provided in Table S1 (Supplemental Material).
Upon completion of the weighing, we then counted the plastic items in each subcategory. We then subsampled the plastic items in each subcategory for polymer analysis. Subsampling was conducted using pruning shears and wearing rubberized work gloves. The minimum subsample size was 1× 1 cm, and the maximum was 4 × 4 cm. We aimed to subsample every piece of plastic litter, however, not every piece of litter was subsampled because of difficulty in subsampling or time constraints. Notes were kept on the number of plastic litter items subsampled. Subsamples were placed into paper bags or paper envelopes, labeled by day number, dive number, group, and litter subcategory, and returned to the laboratory. Litter subsamples contaminated with lake debris (e.g., biofilms, minerals) were rinsed with deionized water and when necessary, subsamples were rinsed with a 1% Micro-90 solution (International Products Corp.), which is a general cleaner, and dried. In total, 673 plastic litter items were counted (Table S2, Supplemental Material) and 516 subsamples for polymer identification were collected.
Attenuated Total Teflection Fourier Transform Infrared Spectroscopy (ATR FT-IR) Analysis
The polymer of each subsample (n = 516) was determined using ATR FT-IR using a Thermo Nicolet 6700 FT-IR (Thermo Fisher Scientific) at the University of Nevada, Reno. The spectra were collected using 32 scans with a spectral resolution of 4 cm–1 within the range of 3950 and 650 cm–1. The Norton–Beer strong apodization function was applied by the instrument software (OMNIC, Thermo Fisher Scientific), and the background was subtracted from each spectrum automatically by the software. The subtracted background was measured every six spectra (approximately every 10 min). The diamond ATR crystal was cleaned with isopropanol/methanol before every background collection. Each sample spectrum was compared to known spectra in the Hummel Polymer Library Database and a database created from the spectra of plastics in the Center for Marine Debris Research Polymer Kit 1.0 (Hawaii Pacific University, USA) 44 collected using the same settings as described above.
In the OMNIC software, we used the correlation approach for comparing the spectra to the libraries. The match value ranges from 0 to 100, with a match of 100 indicating a perfect match. The library match best fitted to the unknown sample spectrum was considered to be the identity of that sample. The polymer match was categorized as “unknown polymer” when the best match was less than a 70% similarity. All matches were additionally verified by the instrument user. For each subsample analyzed, we noted the polymer type and match.
Results and Discussion
Plastic Litter Type
A total of 673 plastic litter items were counted (Table S2, Supplemental Material). The litter category with the greatest number of items was other plastic (n = 256) followed by food containers (n = 113), bottles <2 L (n = 64), plastic bags (n = 51), and toys (n = 49). Plastic items not belonging to any of the 24 defined plastic litter subcategories (Table S1, Supplemental Material), or degraded plastic items that made the original litter source unidentifiable, were termed “other plastic”. A large amount of other plastic litter is a result of either the plastic litter item not fitting in a litter category (e.g., plastic polyvinyl chloride, or PVC, pipe was not a defined litter subcategory) or degradation that made the original litter source unidentifiable.
In their study, Harrold et al. 33 noted that the greatest plastic litter categories by weight were other plastic (65.7 kg) followed by fiberglass (43.5 kg). Harrold et al. 33 also noted that food containers and toys were not a major source of litter by weight, but these categories were an important component of plastic litter. These findings agree with the litter counts in this study, and we recommend that education on proper disposal of food containers, plastic bags, toys, and bottles would help to reduce the plastic litter entering Lake Tahoe.
The plastic litter categories with the most litter by count in Lake Tahoe were other plastic, food containers, bottles < 2 L, plastic bags, and toys. While few lakebed litter studies were found to compare with our results, these findings align with other studies. From a global compilation, the most common plastic litter in riverbeds was plastic caps and plastic bottles, whereas the most common plastic litter on nearshore seafloor was plastic bags and food wrappers. 1 A compilation of land-based cleanups compared to marine seafloor debris cleanups also demonstrated a difference in the litter composition with location. 45 In this compilation, the most common litter categories for land-based cleanups were cigarettes, plastic fragments, food wrappers, and plastic bottles, whereas seafloor debris was comprised of fishing lines, other items, and plastic fragments. 45 In Lake Ontario sediments, primarily industrial plastic pellets were found. 22 We did not observe any plastic pellets in Lake Tahoe because there is no industrial plastic production around the lake. A study from the Mediterranean coast of Israel utilized a team of SCUBA-enabled divers to conduct transects similar to the approach used in this study. 15 The most commonly found submerged plastic litter was bottles and cans, cups/food wrappers, and fishing and boating gear. 15 In the French Mediterranean, litter was identified, categorized, and georeferenced using annual bottom trawl surveys and ROV images. 20 Gerigny et al. 20 found that submerged plastic litter in the Mediterranean Gulf of Lion and Corsica Island was primarily comprised of sheeting, bags, and food packaging. While in the East China Sea, 43 benthic trawl surveys revealed that most of the submerged litter by weight was fishing nets, followed by plastic sheeting and bags. 46 Overall plastic sheeting, bags, food wrappers, bottles, and fishing debris dominate the submerged plastic litter in the studies reviewed herein, demonstrating some similarities to our observations from Lake Tahoe. The prevalence of fishing debris in marine studies reflects the high amount of offshore marine fishing.
Polymer Identification
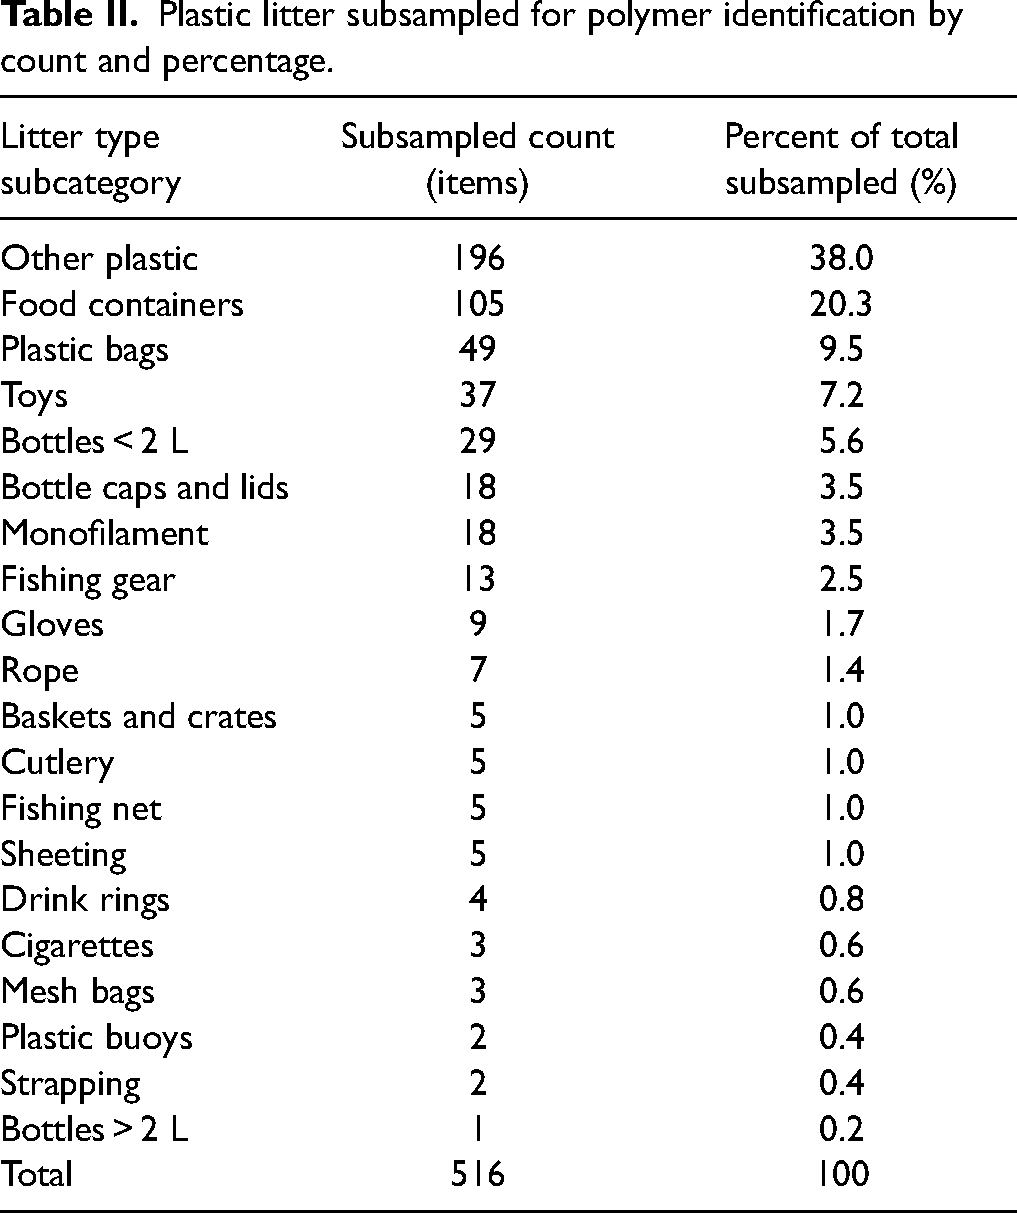
Subsamples for polymer identification were collected and analyzed from 77% (n = 516) of the 673 plastic litter items (Table S2). Therefore, this polymer dataset is considered representative of the plastics collected from the lakebed. The distribution of the subsamples by count for the litter categories studied here is shown in Table II. The top five categories subsampled were other plastic (38%, n = 196), food containers (20%, n = 105), plastic bags, (9.5%, n = 49), toys (7.2%, n = 37), and bottles < 2 L (5.6%, n = 29). Plastic litter categories not subsampled in this study were cigarette lighters, syringes, fiberglass, and resin pellets either because it was difficult to reliably subsample or because there were no plastics in that category (Table S2). Therefore, these categories were not considered further.
Plastic litter subsampled for polymer identification by count and percentage.
The 516 subsamples were analyzed using ATR FT-IR and the top polymer types detected in the subsamples were PVC (16.5%, n = 85), polystyrene (PS)/expanded PS (PS/EPS) (16.5%, n = 85), PE terephthalate (PET)/PEST (15.7%, n = 81), PE (12.6%, n = 65), PP (5.6%, n = 29), polyamide (PA6/PA66) (5.4%, n = 28), and acrylonitrile butadiene styrene (ABS; 2.1%, n = 11; Table III). These polymers make up 74.4% of all the samples analyzed; 23.1% of the subsamples (n = 119) were categorized as unknown (<70% match) polymers (Table III). For the remainder of this paper, the following polymers were categorized as “other polymers”: alkyd resin (n = 3), poly(methacrylate) (n = 2), ethylene-vinyl acetate (n = 2), poly(vinyl butyral) (n = 2), poly(ethylene:propylene:diene) (n = 1), poly(butadiene) (n = 1), poly(vinyl acetate:ethylene) (n = 1), poly(vinylidene fluoride) (n = 1), which represent 2.5% (n = 13) of the subsamples analyzed. Raw spectra are provided through the data availability statement and are plotted in Fig. S1 (Supplemental Material).
Polymers identified by count and percentage, compared to global production in 2015.
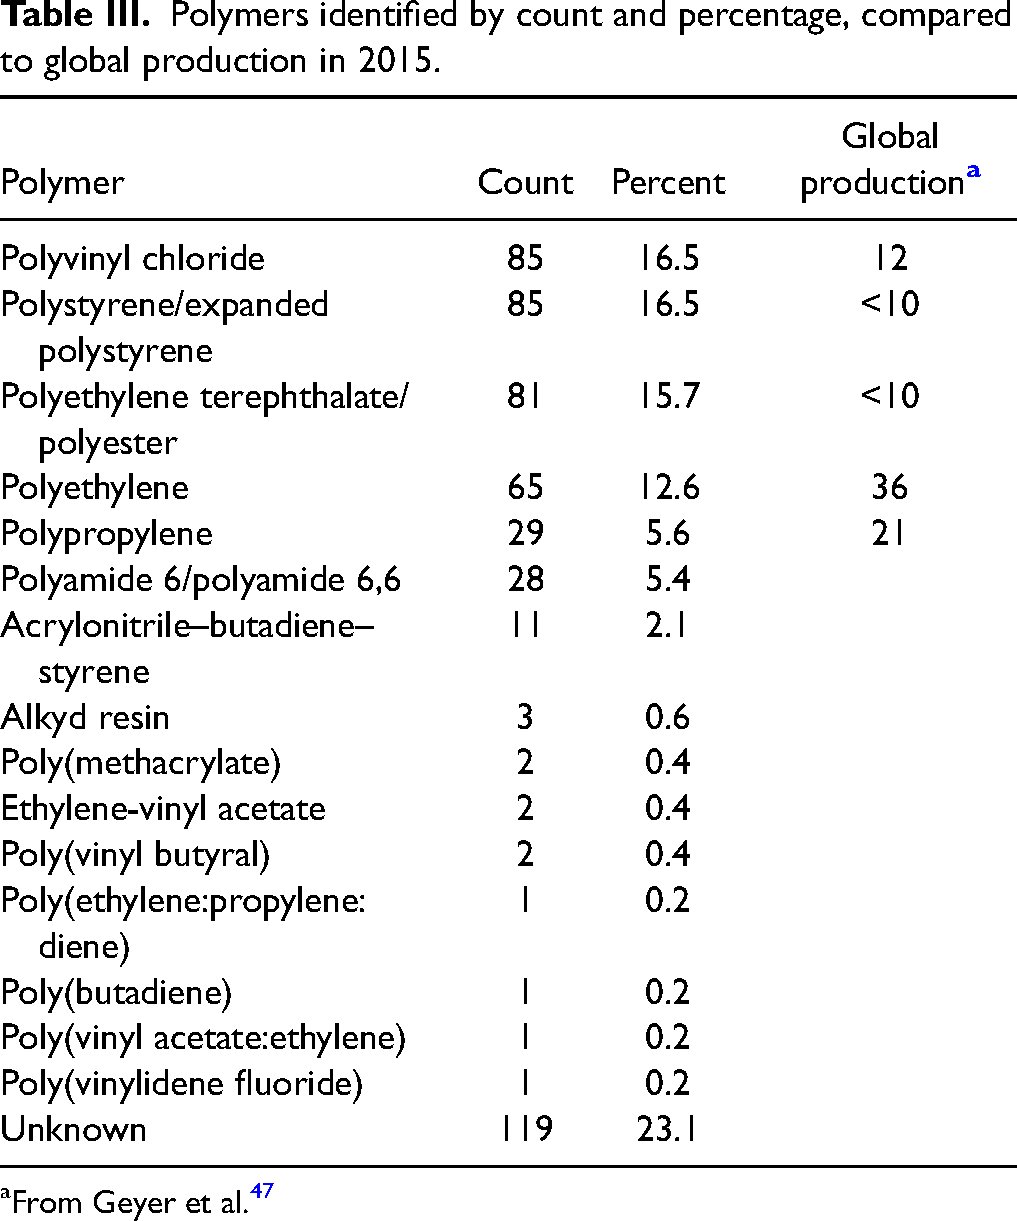
From Geyer et al. 47
Global nonfiber primary plastic production in 2015 was dominated by PE (36%), PP (21%), PVC (12%), PET (<10%), PS (<10%), and polyurethane, 47 all of which (except polyurethane) are included in the top five identified plastics in this study (Table III). In addition to production amount, density may play a role in the submergence of plastic litter. PVC density ranges from 1.37 to 1.42 g/cm3 and PET density ranges from 1.33 to 1.48 g/cm3, which may account for the abundance of PVC and PET in the submerged litter, while PE has a density range of 0.92 to 0.965 g/cm3.48,49 Biofouling or the addition of filler material in the manufacturing process can increase the density of the plastic, so lower density plastics can still become submerged.14,22
The submerged litter polymer results from this study are similar to microplastic studies from lake sediments. Global compilations of microplastic studies from lake surface water and sediments showed the most common polymers were PE, PP,23,24,34 and PEST. 34 In Lake Tahoe surface waters, microplastics identified by Nava et al. 34 were primarily PP followed by PE and others. In Taihu Lake, China, cellophane was the most common microplastic particle identified in the lake water and sediments, followed by PET and PEST. 50 Similarly, a study from Dongting Lake in China showed PET and PE were the most commonly detected microplastics in sediments. 51 In Lake Ontario, Canada, lake sediments were primarily comprised of PE followed by PP. 22 An analysis of sediments from a lake and a pond in Finland showed microplastics were primarily comprised of polyamide (PA), PE, and PP, as well as cellulose. 52 These studies show general agreement with the polymers identified in this study of submerged litter.
When comparing the match percent from pristine polymers to each litter subsample (Table S3, Supplemental Material), PVC showed the lowest percent match followed by PA6/PA66. This may be a result of degradation, the addition of fillers and additives, or incomplete contact with the diamond crystal during measurement because of curved, irregular, or nonmalleable subsamples, as these factors can affect the match53,54 as has been previously shown for PVC identification with Fourier transform infrared spectroscopy (FT-IR). 55 Additionally, the high number of unknown polymers (23.1%, n = 119) is potentially a result of the factors listed above, or a function of the limits of the available reference spectra library. For example, five spectra identified as PET/PEST from South Sand Harbor were compiled (Fig. S2, Supplemental Material). We attribute the decreasing match percent in part to environmental chemical degradation such as photo-oxidation and hydrolysis. The lower match percent is generally characterized by greater transmittance at wavenumbers ∼1715 (carbonyl group), ∼1245 (C=O stretch), ∼1100 cm−1 (asymmetric C–O–C stretching) as has been observed in other studies on environmentally degraded PET. 56 Additionally the match percent may be impacted by the other factors (dyes, additives, etc.) as discussed above.
Litter Category and Polymer Type Comparisons
We found that nine litter categories were comprised primarily of a single polymer (Fig. 2). For example, for bottles < 2 L (n = 29) and bottles > 2 L (n = 1), the primary plastic type was PET/PEST (76 and 100%, respectively). For litter categories fishing gear (n = 13), cutlery (n = 5), and drink rings (n = 4), the primary plastic type was PS/EPS (77, 80, and 75% respectively). For the monofilament line category (n = 18), the primary plastic type was PA6/PA66 (83%). The primary type of plastic for the mesh bags category (n = 3) was PE (67%) while the baskets/crates category (n = 5) was comprised of PET/PEST (60%). In the case of plastic bags (n = 49), PE comprised 57% of the subsamples. When comparing the polymer type to the primary usage, we found good agreement. For example, PET is primarily used in bottles, single-use cutlery is often comprised of PS, and monofilament line is often comprised of PA6/PA66, 49 supporting our findings.
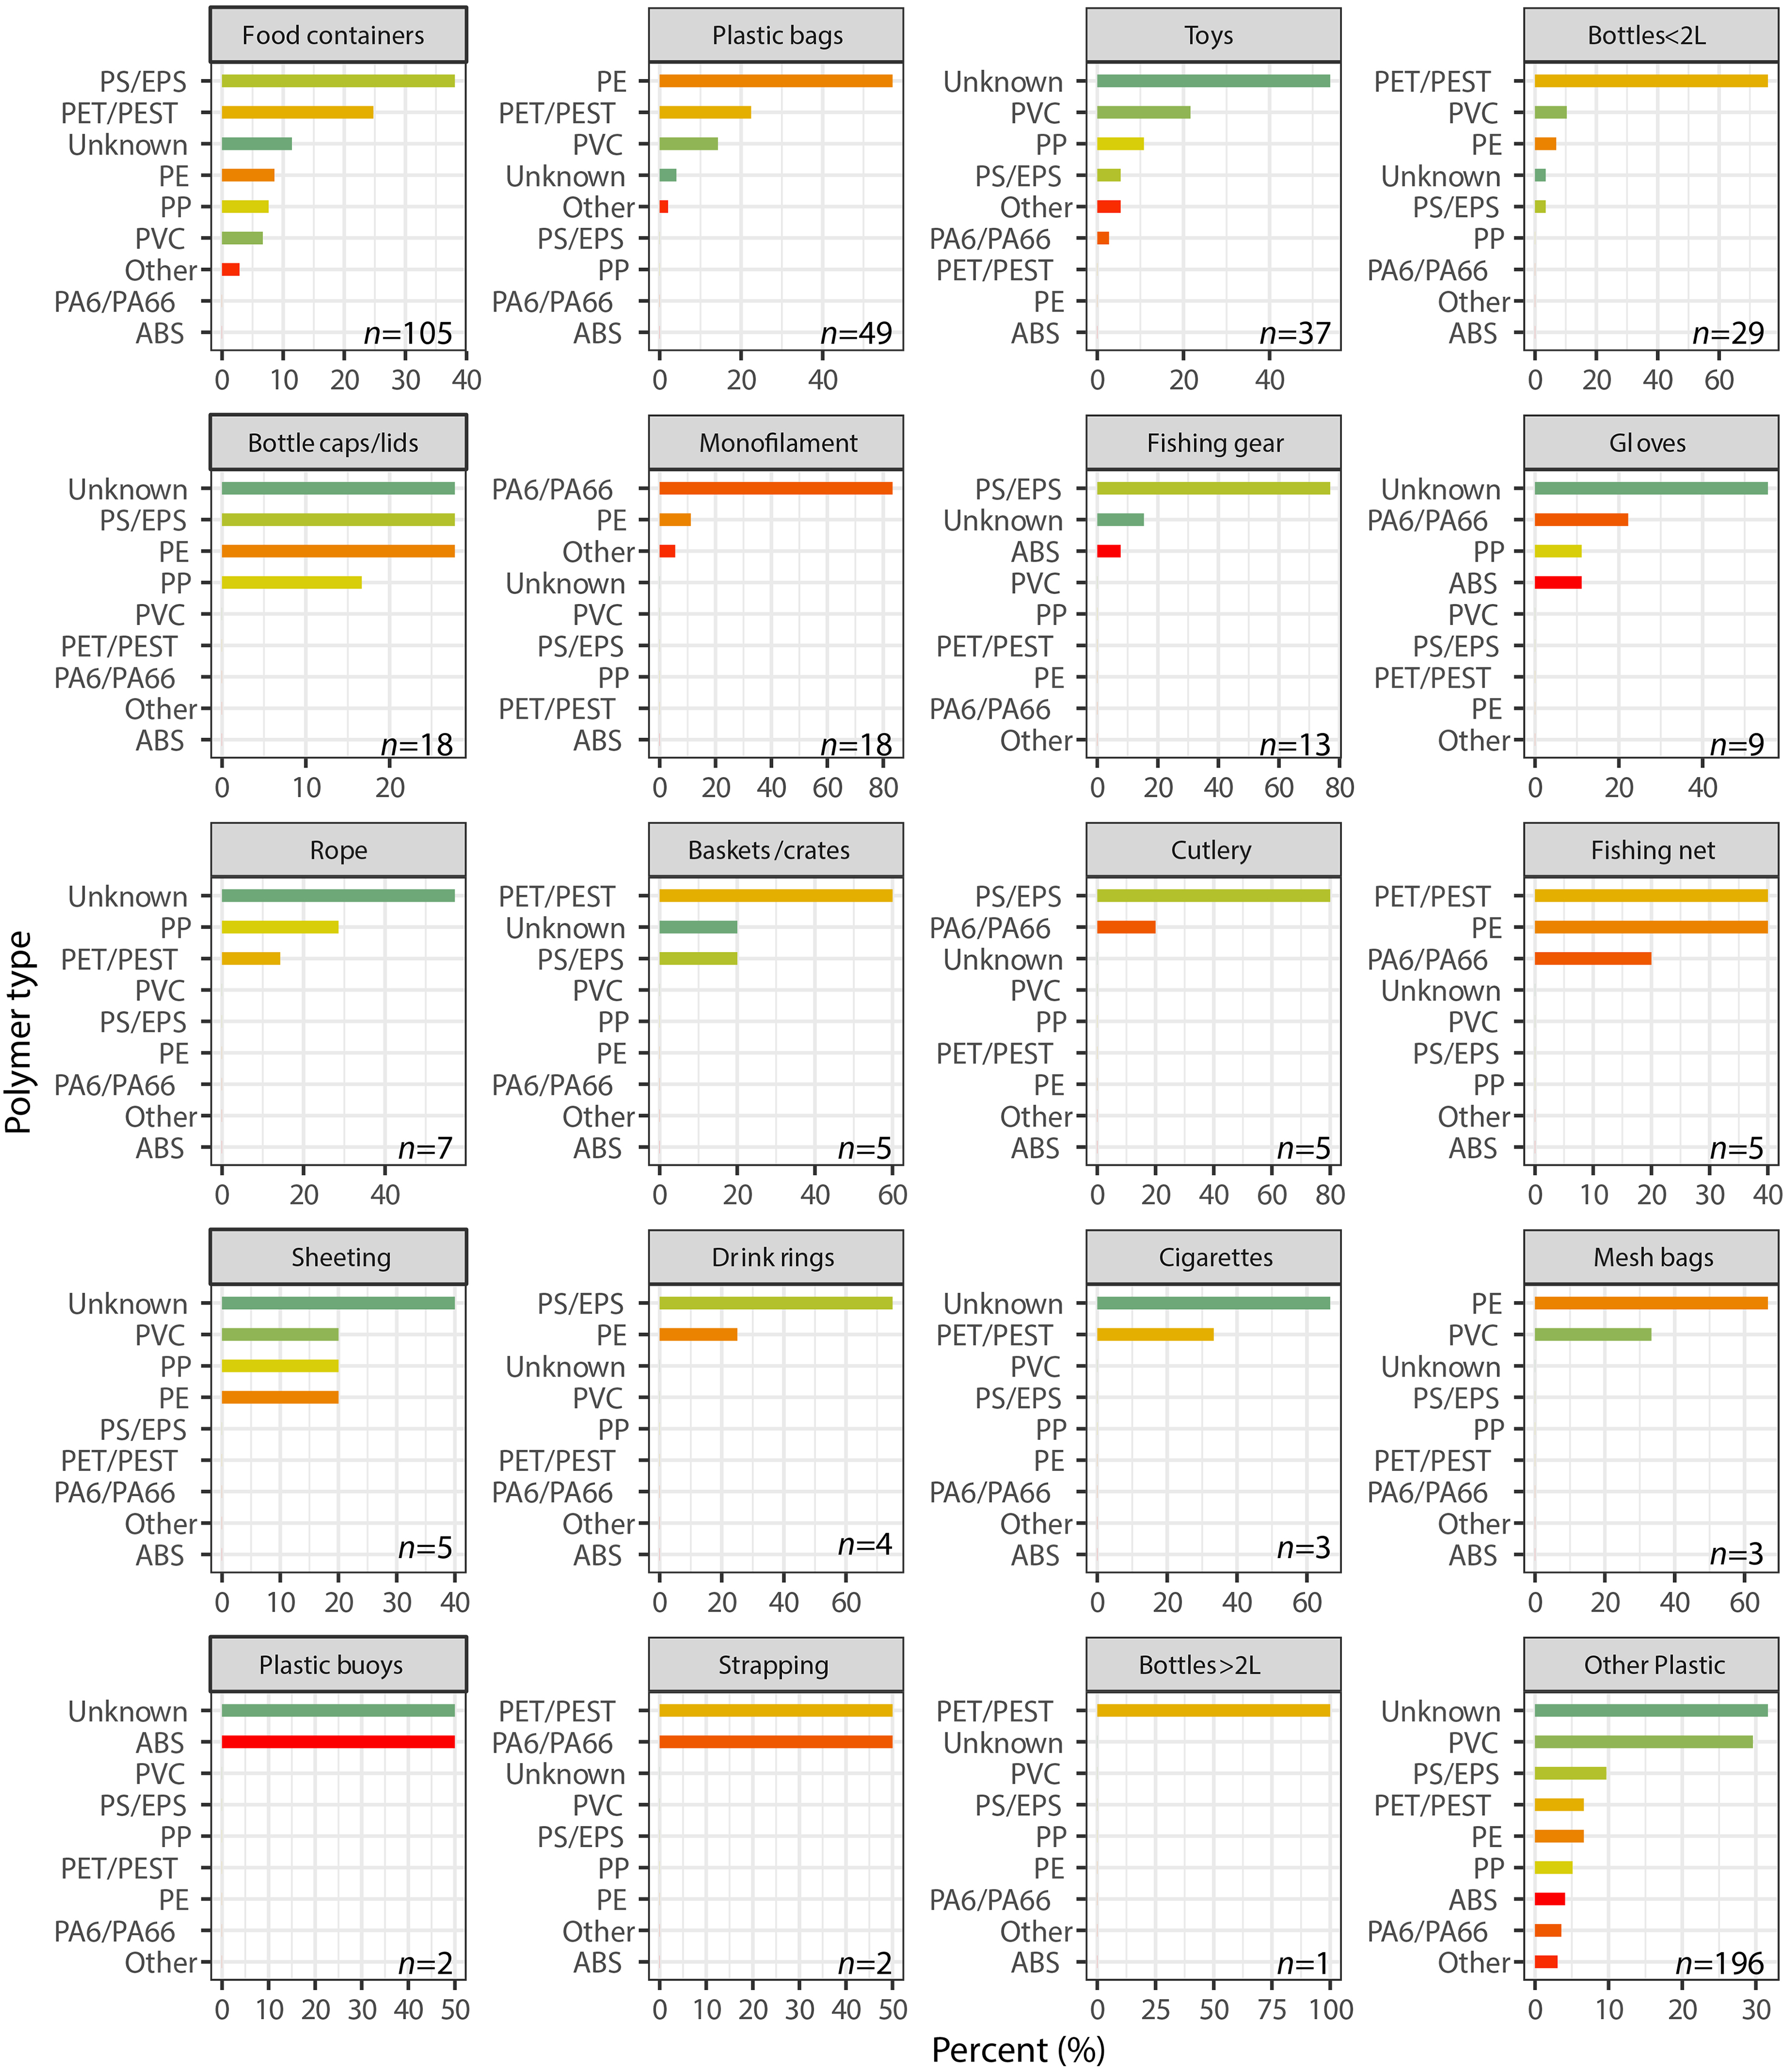
For each plastic litter category studied, identified polymers (colors reflect the polymer) are ranked from the highest percentage to the lowest percentage.
For the remaining litter types, there was no single polymer that primarily comprised the litter category. For example, the food containers category was comprised of PS/EPS in 38% of the subsamples, while 54% of subsamples from the toys category were comprised of unknown polymers (Fig. 2). Sixty-seven percent of the cigarette litter category was unknown polymers, although most cigarette filters are comprised of cellulose acetate. This suggests our spectral library is likely incomplete.
We found that PVC and ABS polymers were primarily sourced (68% and 73%, respectively) from the other plastic litter category (Fig. 3). In reviewing the notes and photos from the sorting, the other plastic litter category contained PVC pipe. These observations resulted in CUTL developing a new “PVC pipe” category for their future litter categorization. For subsamples identified as PA6/PA66, 54% were sourced from the monofilament line. For the remaining polymers, there were no primary litter categories; therefore, in this study a polymer cannot be used to indicate a specific litter source.
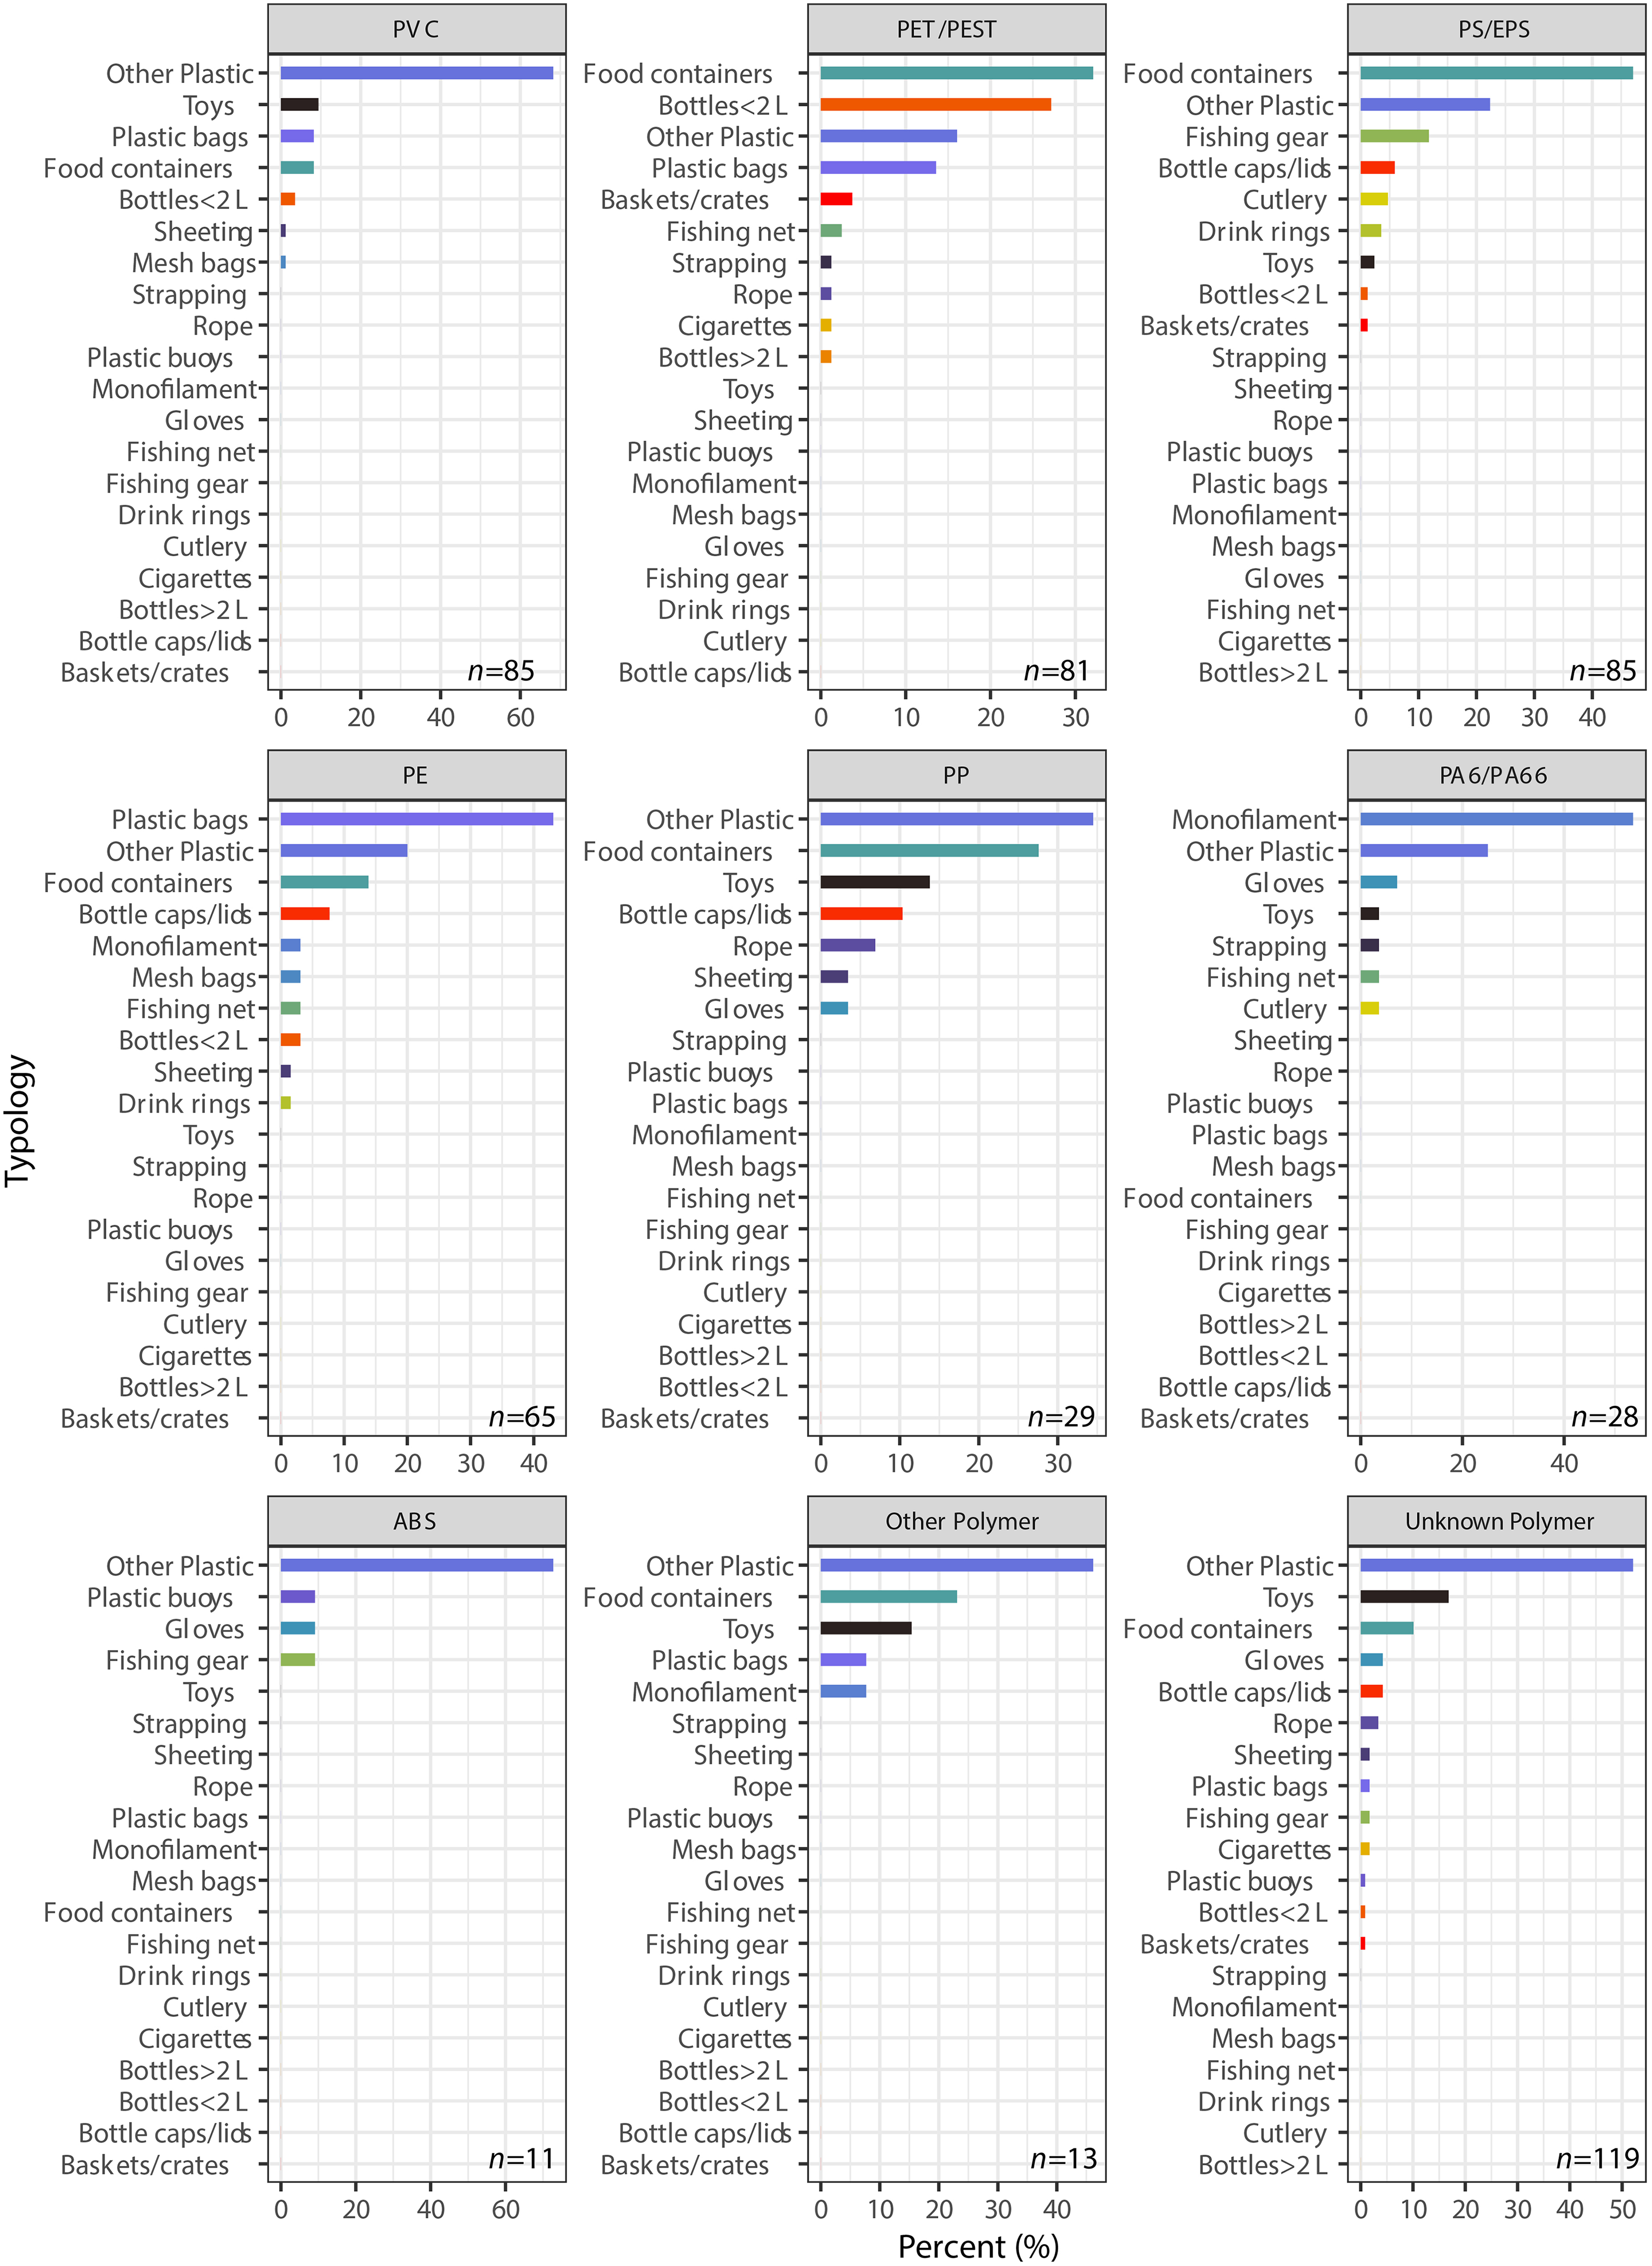
For each polymer, plastic litter categories (bar colors reflect the litter category) are ranked from the highest percentage to the lowest percentage.
Results by Location
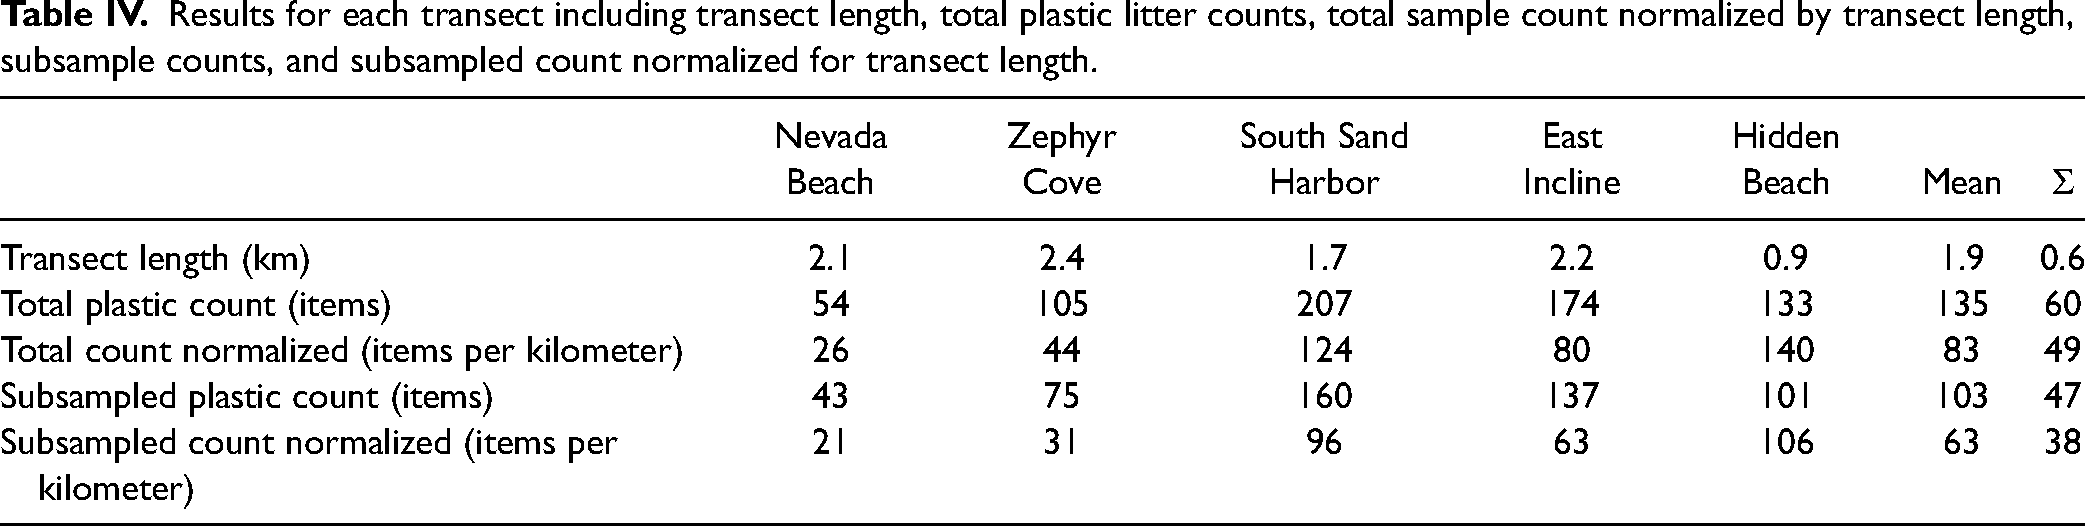
When comparing the total plastic item count per kilometer (Table IV), Hidden Beach (140 items per/km) and South Sand Harbor (124 items per kilometer) have more plastic litter per kilometer than the other sites (Table IV). The average across the five transects was 83 ± 49 plastic items per kilometer (Table IV). Previous work by Harrold et al. 33 showed that plastic litter was found at all transects and South Sand Harbor had the most plastic litter by weight per kilometer, with Hidden Beach having the second most plastic litter by weight per kilometer. The greater weight of plastic litter at these sites was attributed in part to the high visitation to this area and the substrate. 33 Both South Sand Harbor and Hidden Beach are popular recreation areas with rocky substrate that may trap the litter. 33 Collecting both counts and weights for litter can aid with comparison to other studies and can help to account for items that may have low mass but high counts (or vice versa), which may explain why South Sand Harbor had the most plastic litter by weight per kilometer, but Hidden Beach had the most plastic counts per kilometer.
Results for each transect including transect length, total plastic litter counts, total sample count normalized by transect length, subsample counts, and subsampled count normalized for transect length.
When comparing this study to prior work, care must be taken as here we only considered plastic litter and other studies included all litter types. A compilation of litter densities from seafloor canyon systems from around the globe showed a range from 0.8 to 177 items per kilometer. 57 Another study of litter from U.S. beaches on the North Pacific Coast, Southern California Bight, and Hawai’i, litter counts ranged from 28.2 to 133.8 items 500/m. 58
Of the litter subsampled from South Sand Harbor (n = 160), 24% was comprised of PVC which we attribute to the contribution of PVC pipes from the other plastic litter category (Fig. 4). Additionally, 23% of the litter subsampled from South Sand Harbor was comprised of PS/EPS and we attribute this to the food container category which accounted for 27% of the plastic litter at South Sand Harbor. For Zephyr Cove (n = 75), East Incline (n = 137), and Nevada Beach (n = 43) transects, the litter was comprised of unknown polymers (27, 29, and 37%, respectively). Hidden Beach's (n = 01) subsampled litter was comprised of PS/EPS (23%; Fig. 4), attributed to the food container litter category that made up 19% of the litter categorized at this location.
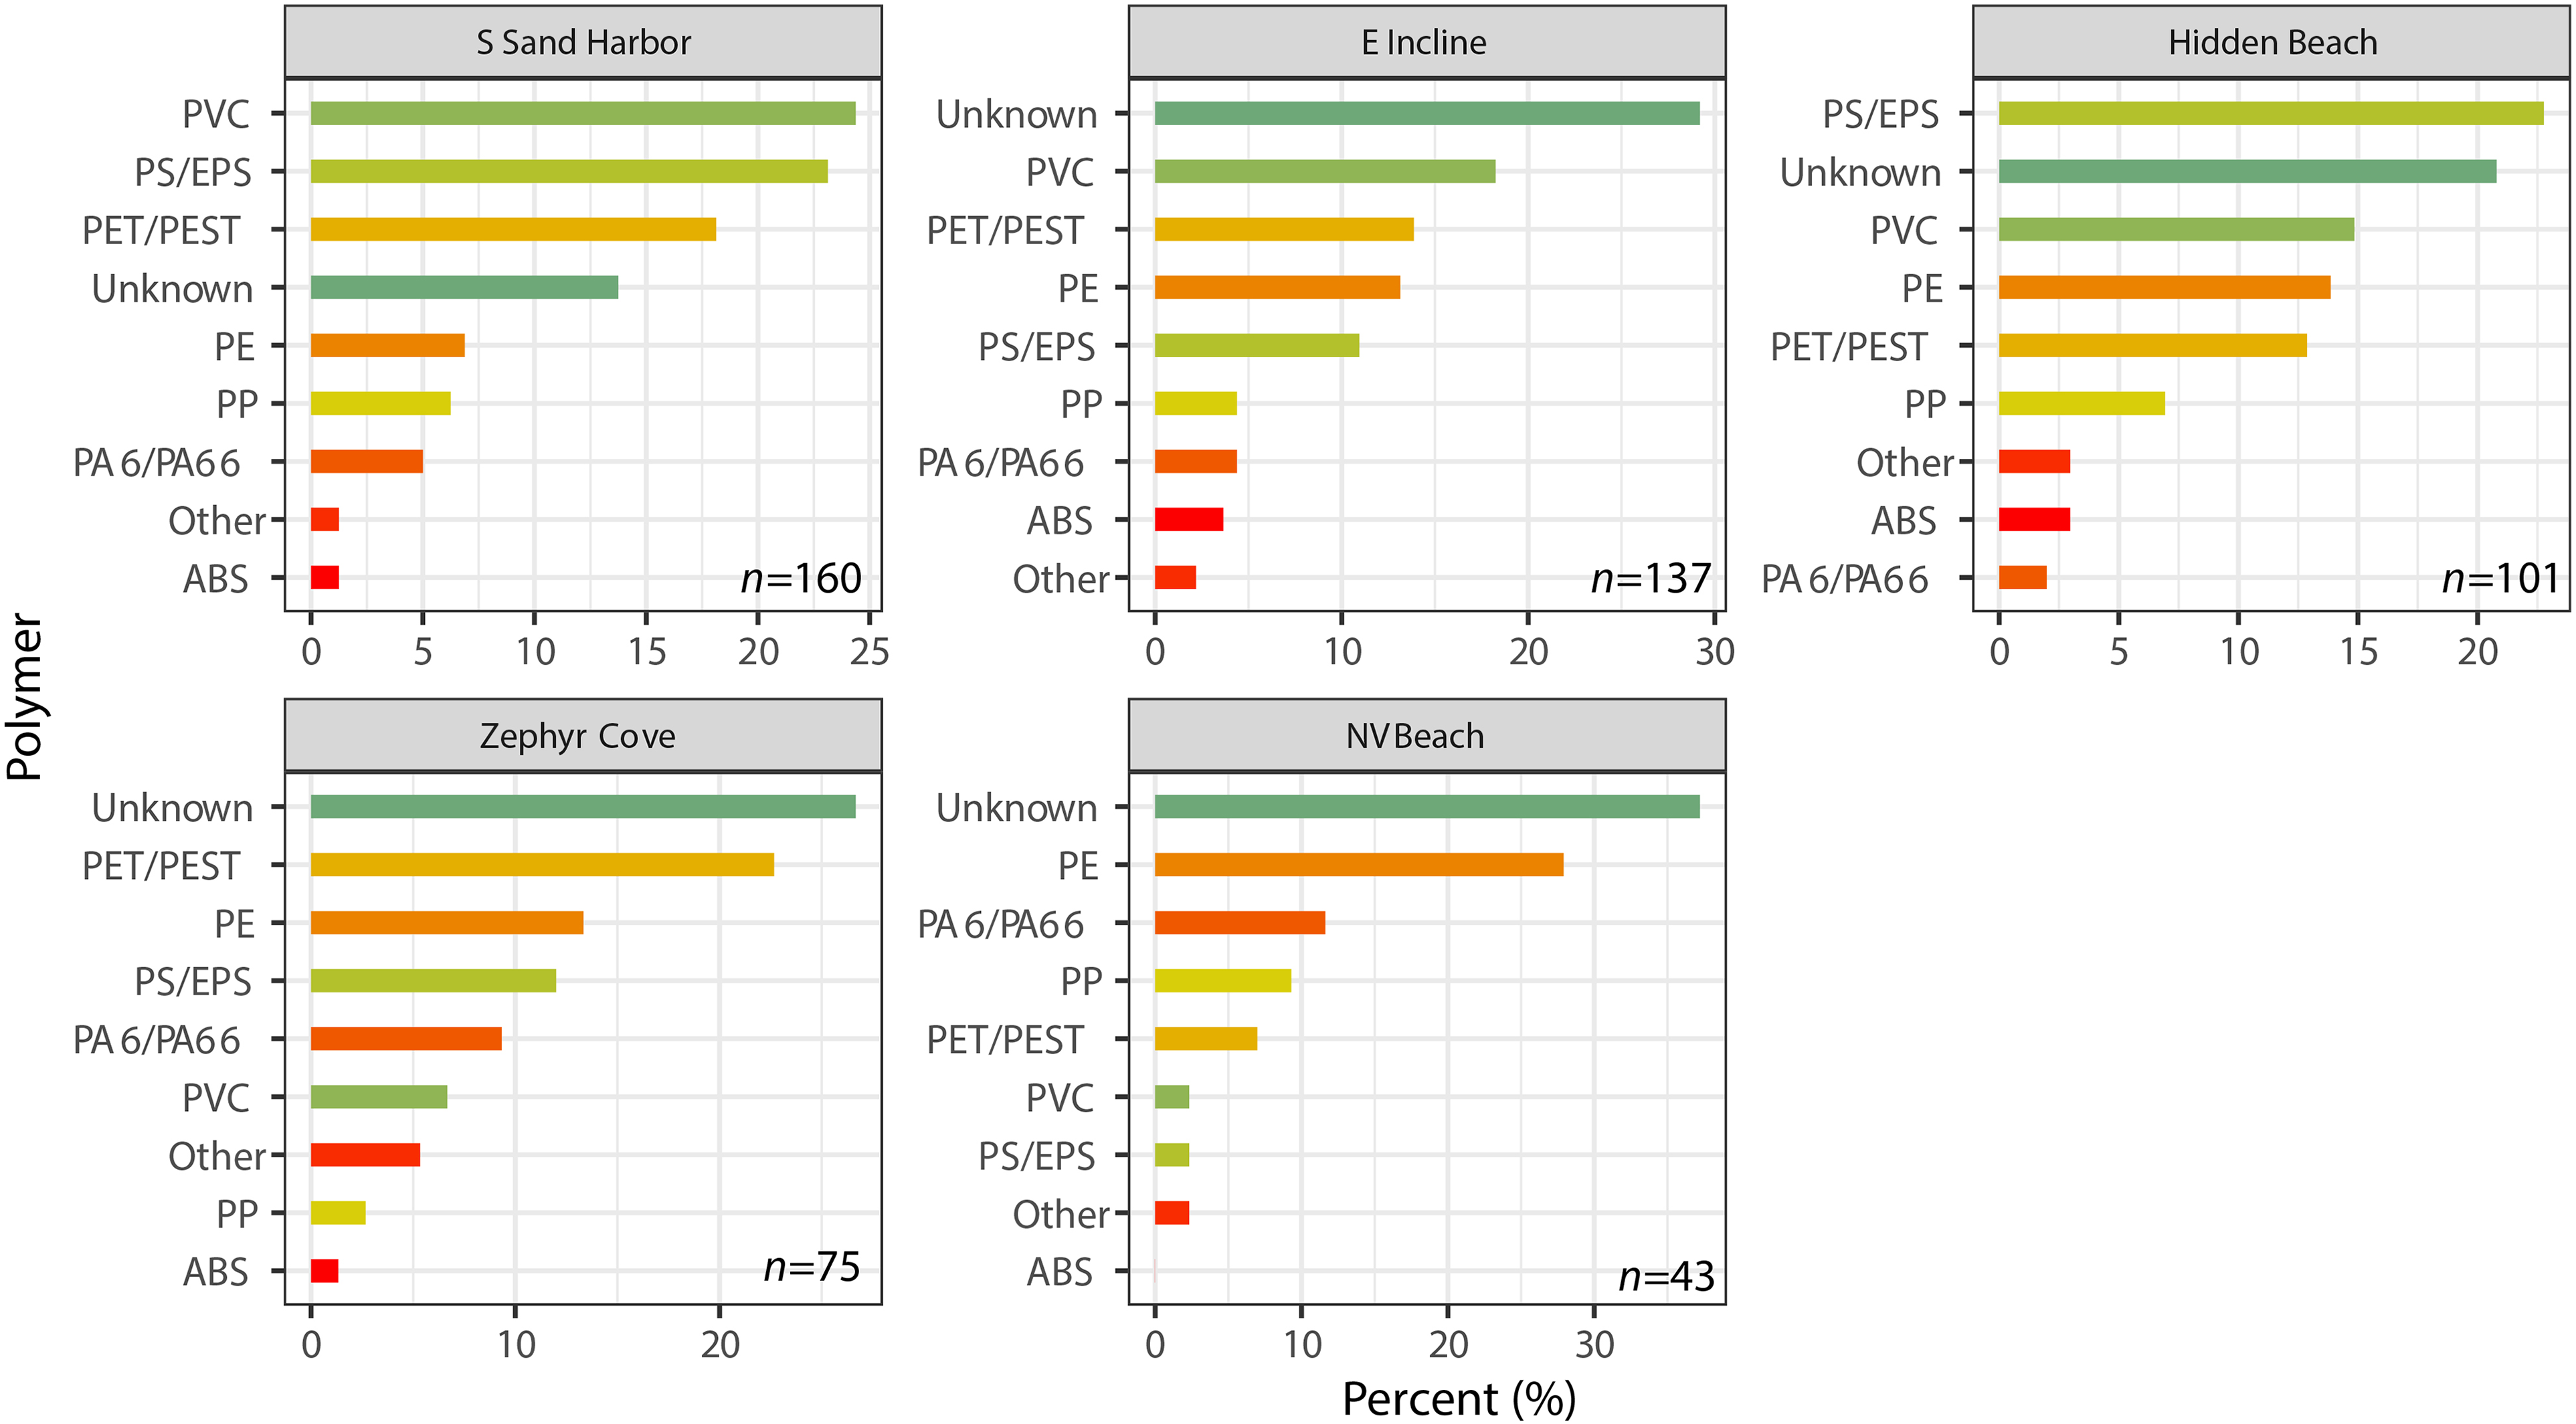
For each transect, identified polymers (bar colors reflect the polymer type) are ranked from the highest percentage to the lowest percentage.
Conclusion
Lake Tahoe is an area of natural beauty with year-round recreation opportunities, which provides a critical drinking water supply and aquatic habitat. Despite being considered an area of beauty, across five transects an average of 83 ± 49 submerged plastic litter items per kilometer was found on the nearshore lakebed. The top six polymers detected in the plastic subsamples were PVC, PS/EPS, PET/PEST, PE, PP, and PA6/PA66, reflecting the global plastic production trend and similar to a microplastic sample from Lake Tahoe 34 and other studies of microplastics from surface water and lakebed sediments.23,24
The most abundant plastic litter subcategories by count were food containers, bottles < 2 L, plastic bags, and toys, and this was in line with prior studies on submerged litter. These data suggest a need for ongoing education about proper plastic waste disposal in the Tahoe Basin and perhaps indicate a need for additional plastic litter mitigation measures such as eliminating single-use plastics through local policies, promoting plastic replacement with natural material products, or encouraging extended producer responsibility policies 59 as interventions to support sustainable development in the area.
Commonly manufactured plastic polymers, including PE, PP, PVC, PET/PEST, and PS/EPS were found at all litter collection sites. These data suggest that these plastic polymers are widespread in Lake Tahoe's lakebed environment. Plastics of unknown polymer type comprised most of the litter subsamples, likely because of polymer degradation or limitations in the spectral reference libraries. To address these issues, developing spectral libraries comprised of degraded plastics could increase the capability to identify environmental plastics because many commercially available libraries are comprised of pristine plastic materials. This has been highlighted by several studies and has been addressed by prior researchers making spectra publicly available,54,60,61 as we have done in this study (see data availability statement).
We found that nine litter subcategories (bottles <2 L, bottles >2 L, cutlery, drink package rings, fishing gear, mesh bags, monofilament line, bags, and baskets/crates) were primarily comprised of a single polymer type. In litter cleanup and monitoring studies where the polymer type cannot be measured but litter is categorized, these results could provide an estimate of the total polymer composition for select subcategories. Additionally, in Lake Tahoe, these results could also inform studies investigating submerged plastic litter as a source of microplastics. For example, the microplastic data from Lake Tahoe's surface water sample shows the plastics are primarily comprised of clear and black colored fragments, filaments, and other shapes, and comprised of PP and PE. 34 Considering these microplastic results, the breakdown of larger pieces of plastics, including litter (e.g., plastic bags and plastic sheeting), may be an important contributor of microplastics to Lake Tahoe.
Finally, very few studies on submerged plastic litter in lakes have been conducted. This is an important knowledge gap to fill because often lakes and reservoirs experience high anthropogenic activity while also serving as important drinking water resources and critical aquatic habitats. In addition, by further filling this knowledge gap, a better constraint on the fate and transport of plastic in watersheds can be developed.
Supplemental Material
sj-pdf-1-asp-10.1177_00037028231201174 - Supplemental material for Polymer Characterization of Submerged Plastic Litter from Lake Tahoe, United States
Supplemental material, sj-pdf-1-asp-10.1177_00037028231201174 for Polymer Characterization of Submerged Plastic Litter from Lake Tahoe, United States by Julia Davidson, Monica M. Arienzo, Zoe Harrold, Colin West, Erick R. Bandala, Sadye Easler and Katie Senft in Applied Spectroscopy
Footnotes
Acknowledgments
We would like to thank the 2020 CUTL Dive Team. We would also like to thank Marilee Movius, Heather Segale, Kerri Minatre, Madonna Dunbar, and other community members for their contributions to and of the litter sorting effort. We would also like to thank Sierra Dive Center, Tahoe Dive Center, Ski Run Marina, Tahoe Vista Boat Launch, and Tahoe Sports and Ski Run Boat Company for their support of this project. We also would like to thank Nicole Damon and the two reviewers for their comments which improved the manuscript.
Declaration of Conflicting Interests
The authors declared no potential conflicts of interest with respect to the research, authorship, and/or publication of this article.
Funding
The authors disclosed receipt of the following financial support for the research, authorship, and/or publication of this article: Funding for CUTL SCUBA collection of submerged litter was funded by a 2020 Lake Tahoe License Plate (LTLP 20-01) grant awarded by the Nevada Division of State Land and a subaward grant (DEP S 21-005) awarded by the Nevada Department of Environmental Protection. Additional funding was provided by NSF grants 2018848 and 2045871 to M.M.A. and DRI Institute Project Assignment funds to M.M.A and E.B.
Data Availability
Data is available at: https://doi.org/doi:10.5061/dryad.866t1g1vj
Supplemental Material
All supplemental material mentioned in the text is available in the online version of the journal.
References
Supplementary Material
Please find the following supplemental material available below.
For Open Access articles published under a Creative Commons License, all supplemental material carries the same license as the article it is associated with.
For non-Open Access articles published, all supplemental material carries a non-exclusive license, and permission requests for re-use of supplemental material or any part of supplemental material shall be sent directly to the copyright owner as specified in the copyright notice associated with the article.