
Abstract
We describe an entomological dual-band 808 and 980 nm lidar system which has been implemented in a tropical cloud forest (Ecuador). The system was successfully tested at a sample rate of 5 kHz in a cloud forest during challenging foggy conditions (extinction coefficients up to 20 km–1). At times, the backscattered signal could be retrieved from a distance of 2.929 km. We present insect and bat observations up to 200 m during a single night with an emphasis on fog aspects, potentials, and benefits of such dual-band systems. We demonstrate that the modulation contrast between insects and fog is high in the frequency domain compared to intensity in the time domain, thus allowing for better identification and quantification in misty forests. Oscillatory lidar extinction effects are shown in this work for the first time, caused by the combination of dense fog and large moths partially obstructing the beam. We demonstrate here an interesting case of a moth where left- and right-wing movements induced oscillations in both intensity and pixel spread. In addition, we were able to identify the dorsal and ventral sides of the wings by estimating the corresponding melanization with the dual-band lidar. We demonstrate that the wing beat trajectories in the dual-band parameter space are complementary rather than covarying or redundant, thus a dual-band entomological lidar approach to biodiversity studies is feasible in situ and endows species specificity differentiation. Future improvements are discussed. The introduction of these methodologies opens the door to a wealth of possible experiments to monitor, understand, and safeguard the biological resources of one of the most biodiverse countries on Earth.
This is a visual representation of the abstract.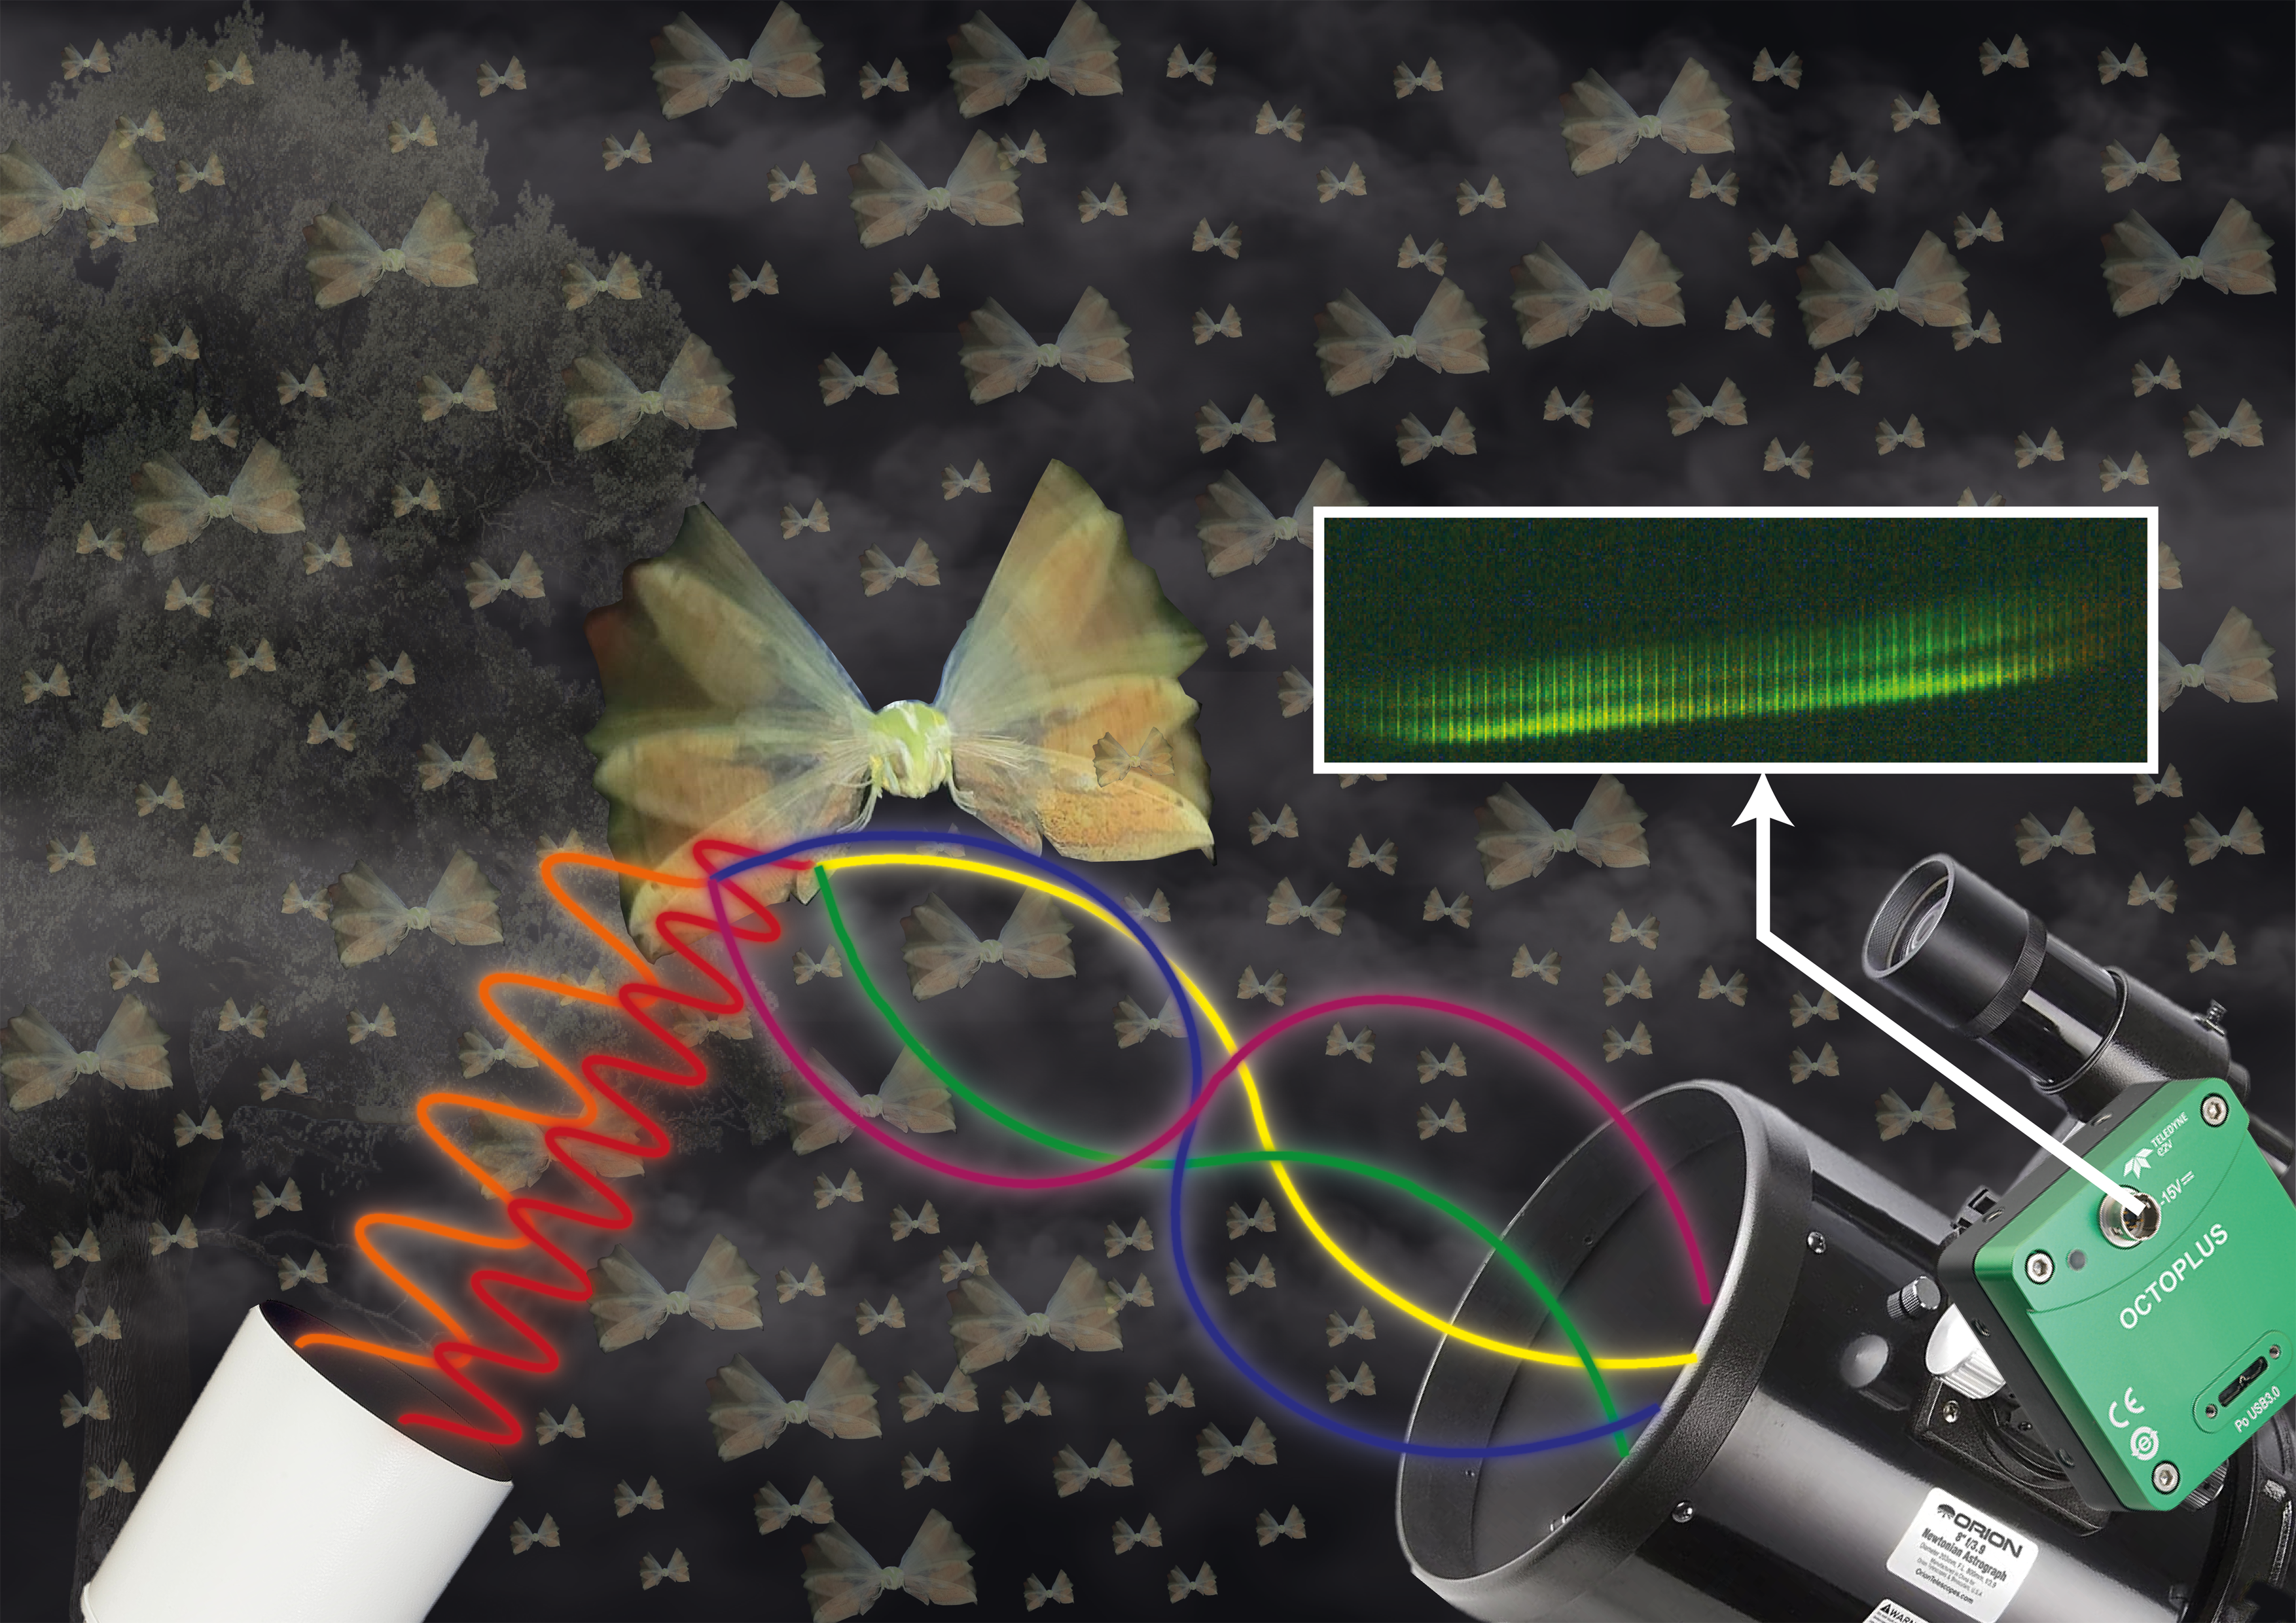
Keywords
Introduction
Assessment of biodiversity is fundamental for understanding complex interactions 1 and for preserving ecosystems. Factors such as rainfall, mountainous topography, and vicinity to the equator all increase species richness2,3 of trees, birds, mammals, reptiles, amphibians, and insects. Unfortunately, many important biodiversity hotspots, such as Andean tropical rainforests, remain poorly studied. 4 Species inventorying in a tall standing rainforest is challenging; vegetation and dense fog limit visibility and insect species are vertically stratified. 5 Conventional surveys include traps and sweep nets, 6 but generally, traps and baits are biased 7 and limit studies to subgroups of species. As an example, hundreds of species of fruit-feeding butterflies can be found at a single Ecuadorian site but are insufficiently identifiable by this approach. 8 More general estimations of insect species in the richness of tropical virgin forests are costly and complicated.9,10 Analysis of caught samples may also be exceedingly laborious. Metabarcoding can detect the presence of species in genetic databases,11–13 but fail to report on abundances. Innovative solutions with machine vision and robotics may be required to automate catch analysis. 14
Photonic monitoring approaches15–18 may be able to estimate the insect species richness in real-time in situ, without biasing, sample handling, or great collecting efforts. Furthermore, entomological lidar could access diversity throughout tall canopies of virgin forests, which are known to foster higher diversity.
The aim of this paper is to present a novel dual-band (808 and 980 nm) entomological lidar in Ecuador. In particular, we showcase the feasibility of remotely observing insects in situ during severely foggy conditions (with attenuation coefficients up to 20 km–1) and demonstrate how two bands provide complementary information, which can allow for distinguishing more species.
Materials and Methods
Field Site
The study was carried out in the private reserve, Bosque Protector Jardín de los Sueños, an evergreen forest (∼500 m above sea level) at the foot of the western Andean ridge in Cotopaxi province, Ecuador. The entomological lidar system introduced in this work and its main components are presented in Fig. 1. The instrument is shown overlooking the interrogation volume in the reserve. In this geographical location, the annual mean temperatures are 18–24 °C with a mean relative humidity of 86%. There is an average rainfall of 7 m/year, and the dry season extends between July and December, while the rainy season goes from January to May. This mountainous forest is part of the remaining Chocó rainforest region, which covers most of Colombia's Pacific coast. The location presents fog and mist through most of the day all year around. The forest includes primary virgin vegetation with tree canopies above 50 m (Fig. 2d) and some secondary forest at the edges. The site is a biodiversity hotspot and hosts a broad range of animal species on the ground, throughout the canopy, and free-flying. Because of this and other factors, this reserve has been identified as an important wildlife refuge for all taxonomic groups, with a special emphasis on bats. In 2021, the reserve was designated as an important preservation spot by the Ecuadorian Bat Conservation Program. This location provides an interesting place to study bat–prey interactions. Forest patches such as this act as a biodiversity source for the surrounding territories and is a crucial fountain of ecosystem services such as pollination, seed dispersal, and refuge for pest predators.
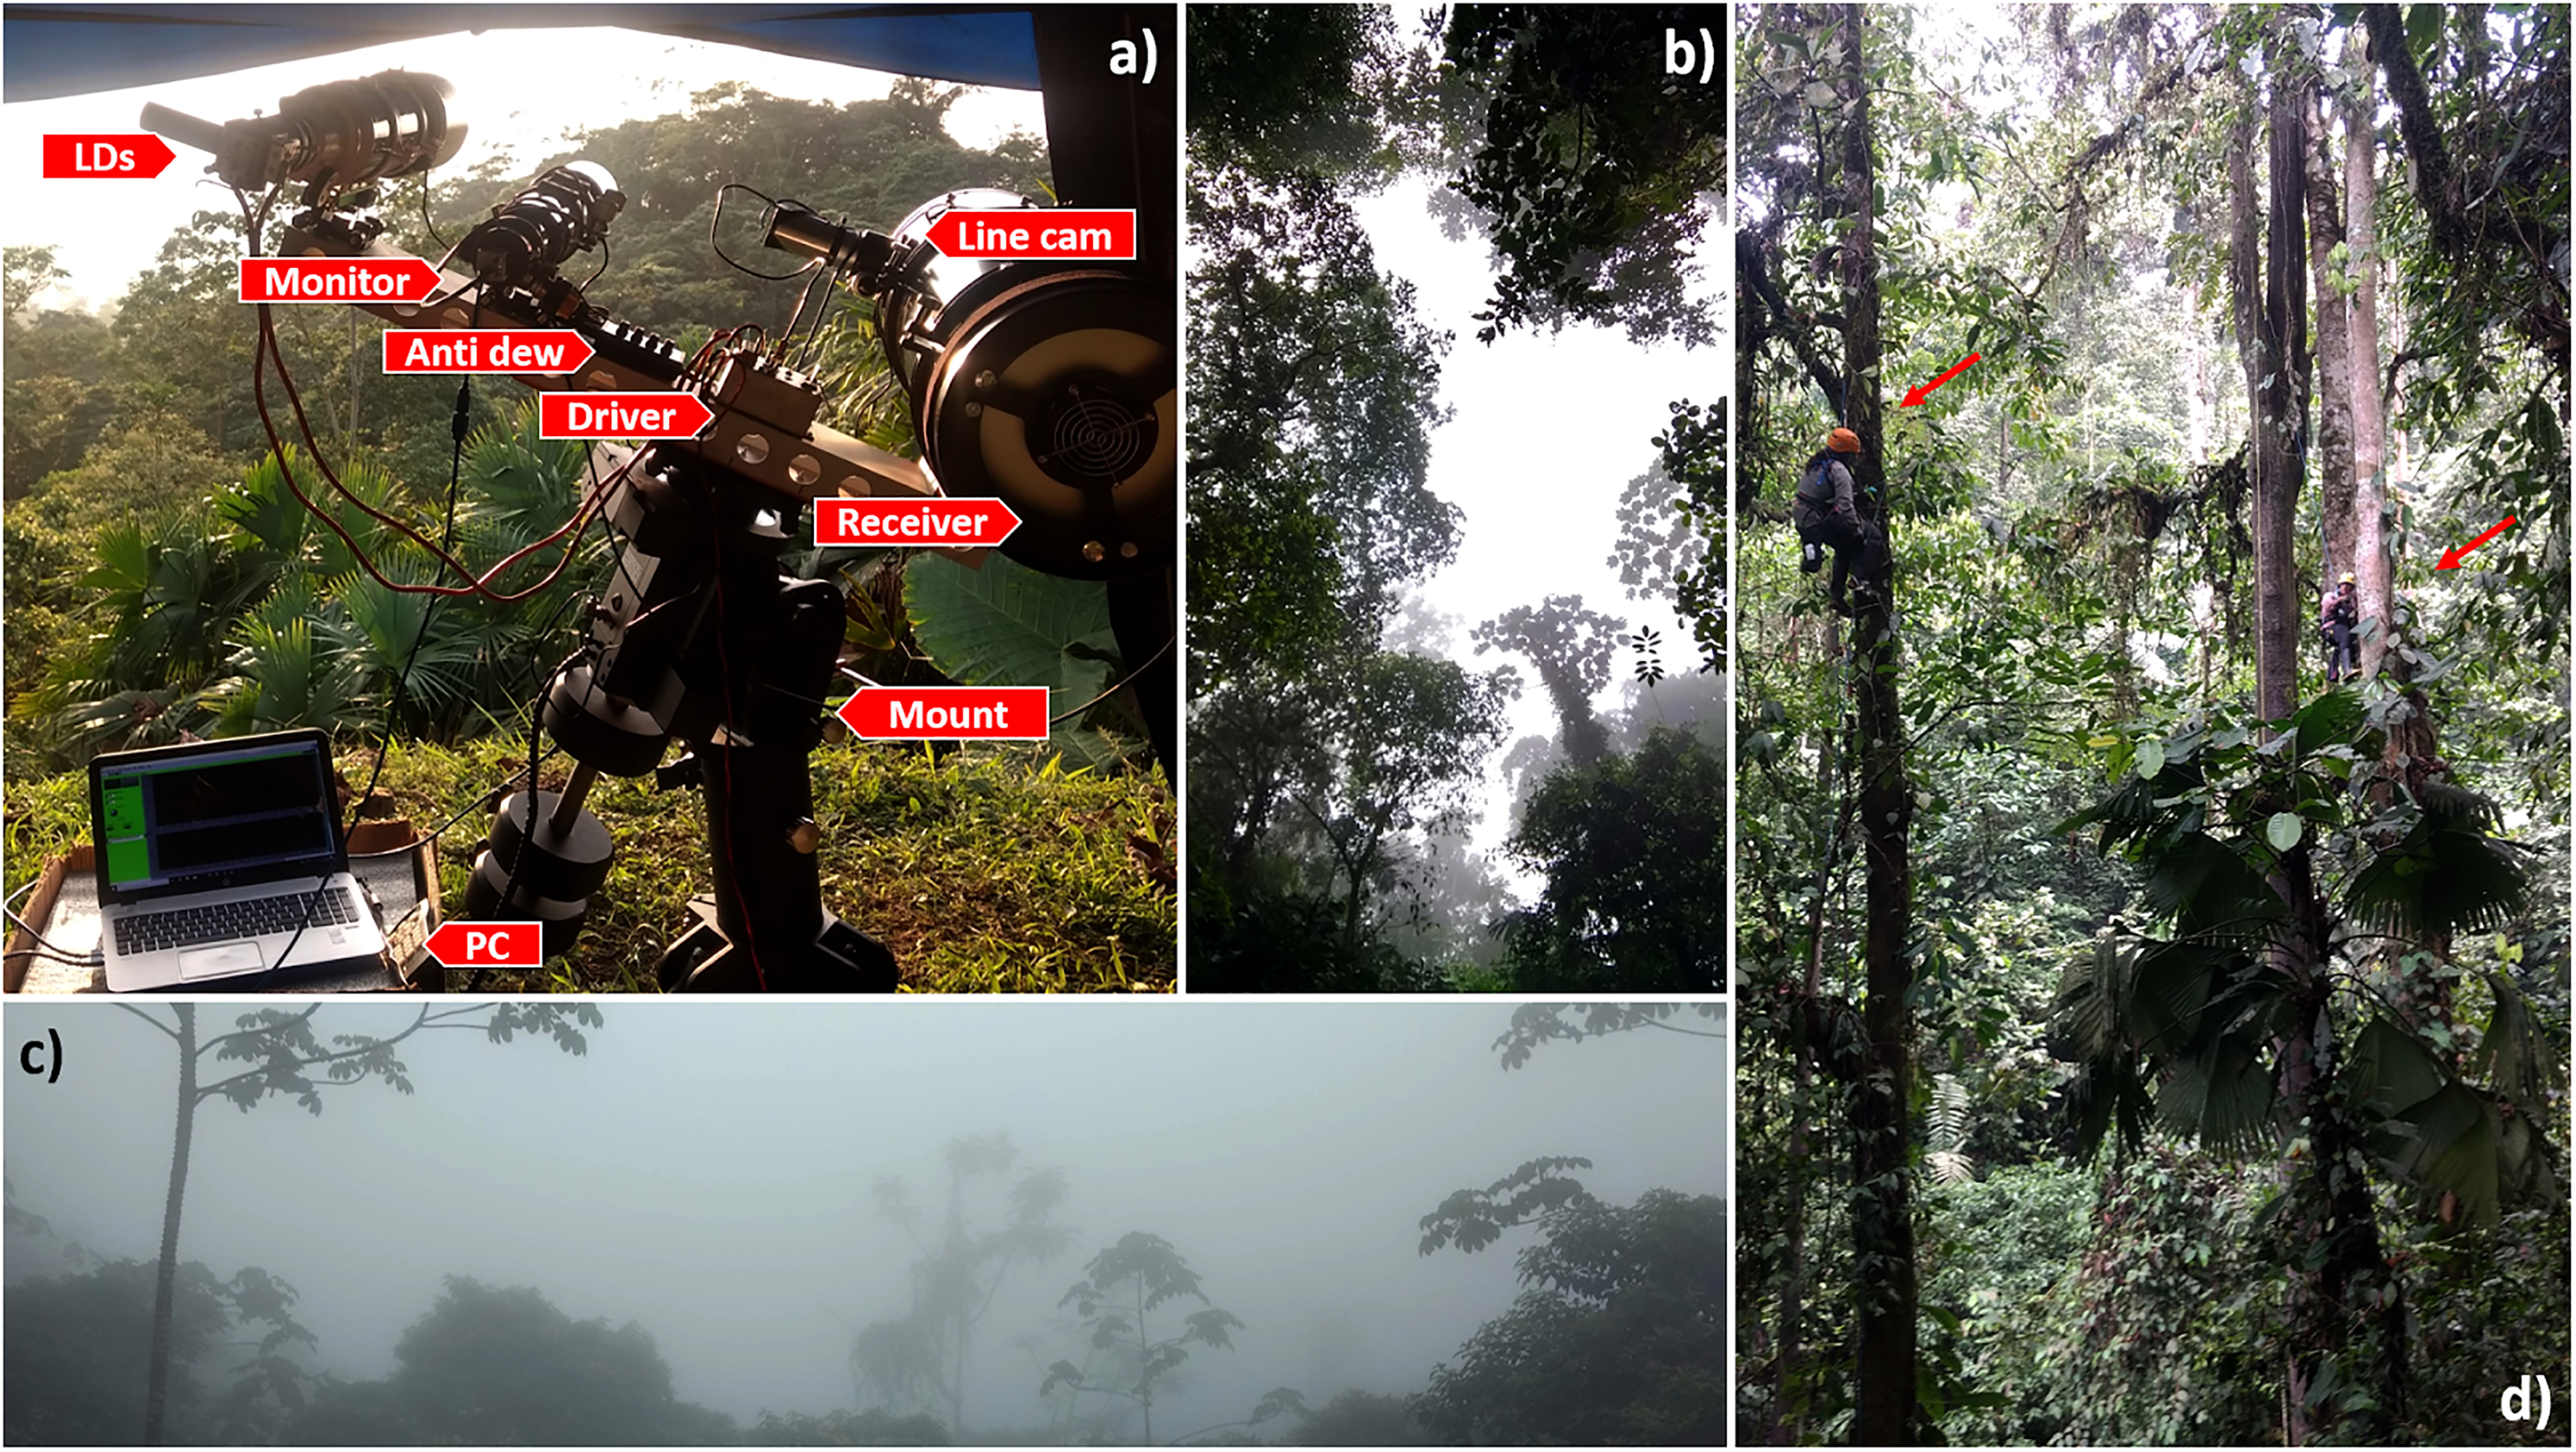
(a) Entomological lidar system and its main components overlooking the Jardin de los sueños private forest, during a clear moment (17:30). (b) A photo displaying the top of canopies at ∼30 m over ground disappearing into the mist (9:30). (c) A view from lidar toward the valley at noon (12:05), typical of the field campaign days. The mist is impenetrable. (d) Ecological studies in tropical virgin forests are challenging due to topography, tall vegetation structure, and stratification of ecological niches, here two chiropterologists install a bat net 20 m above ground.
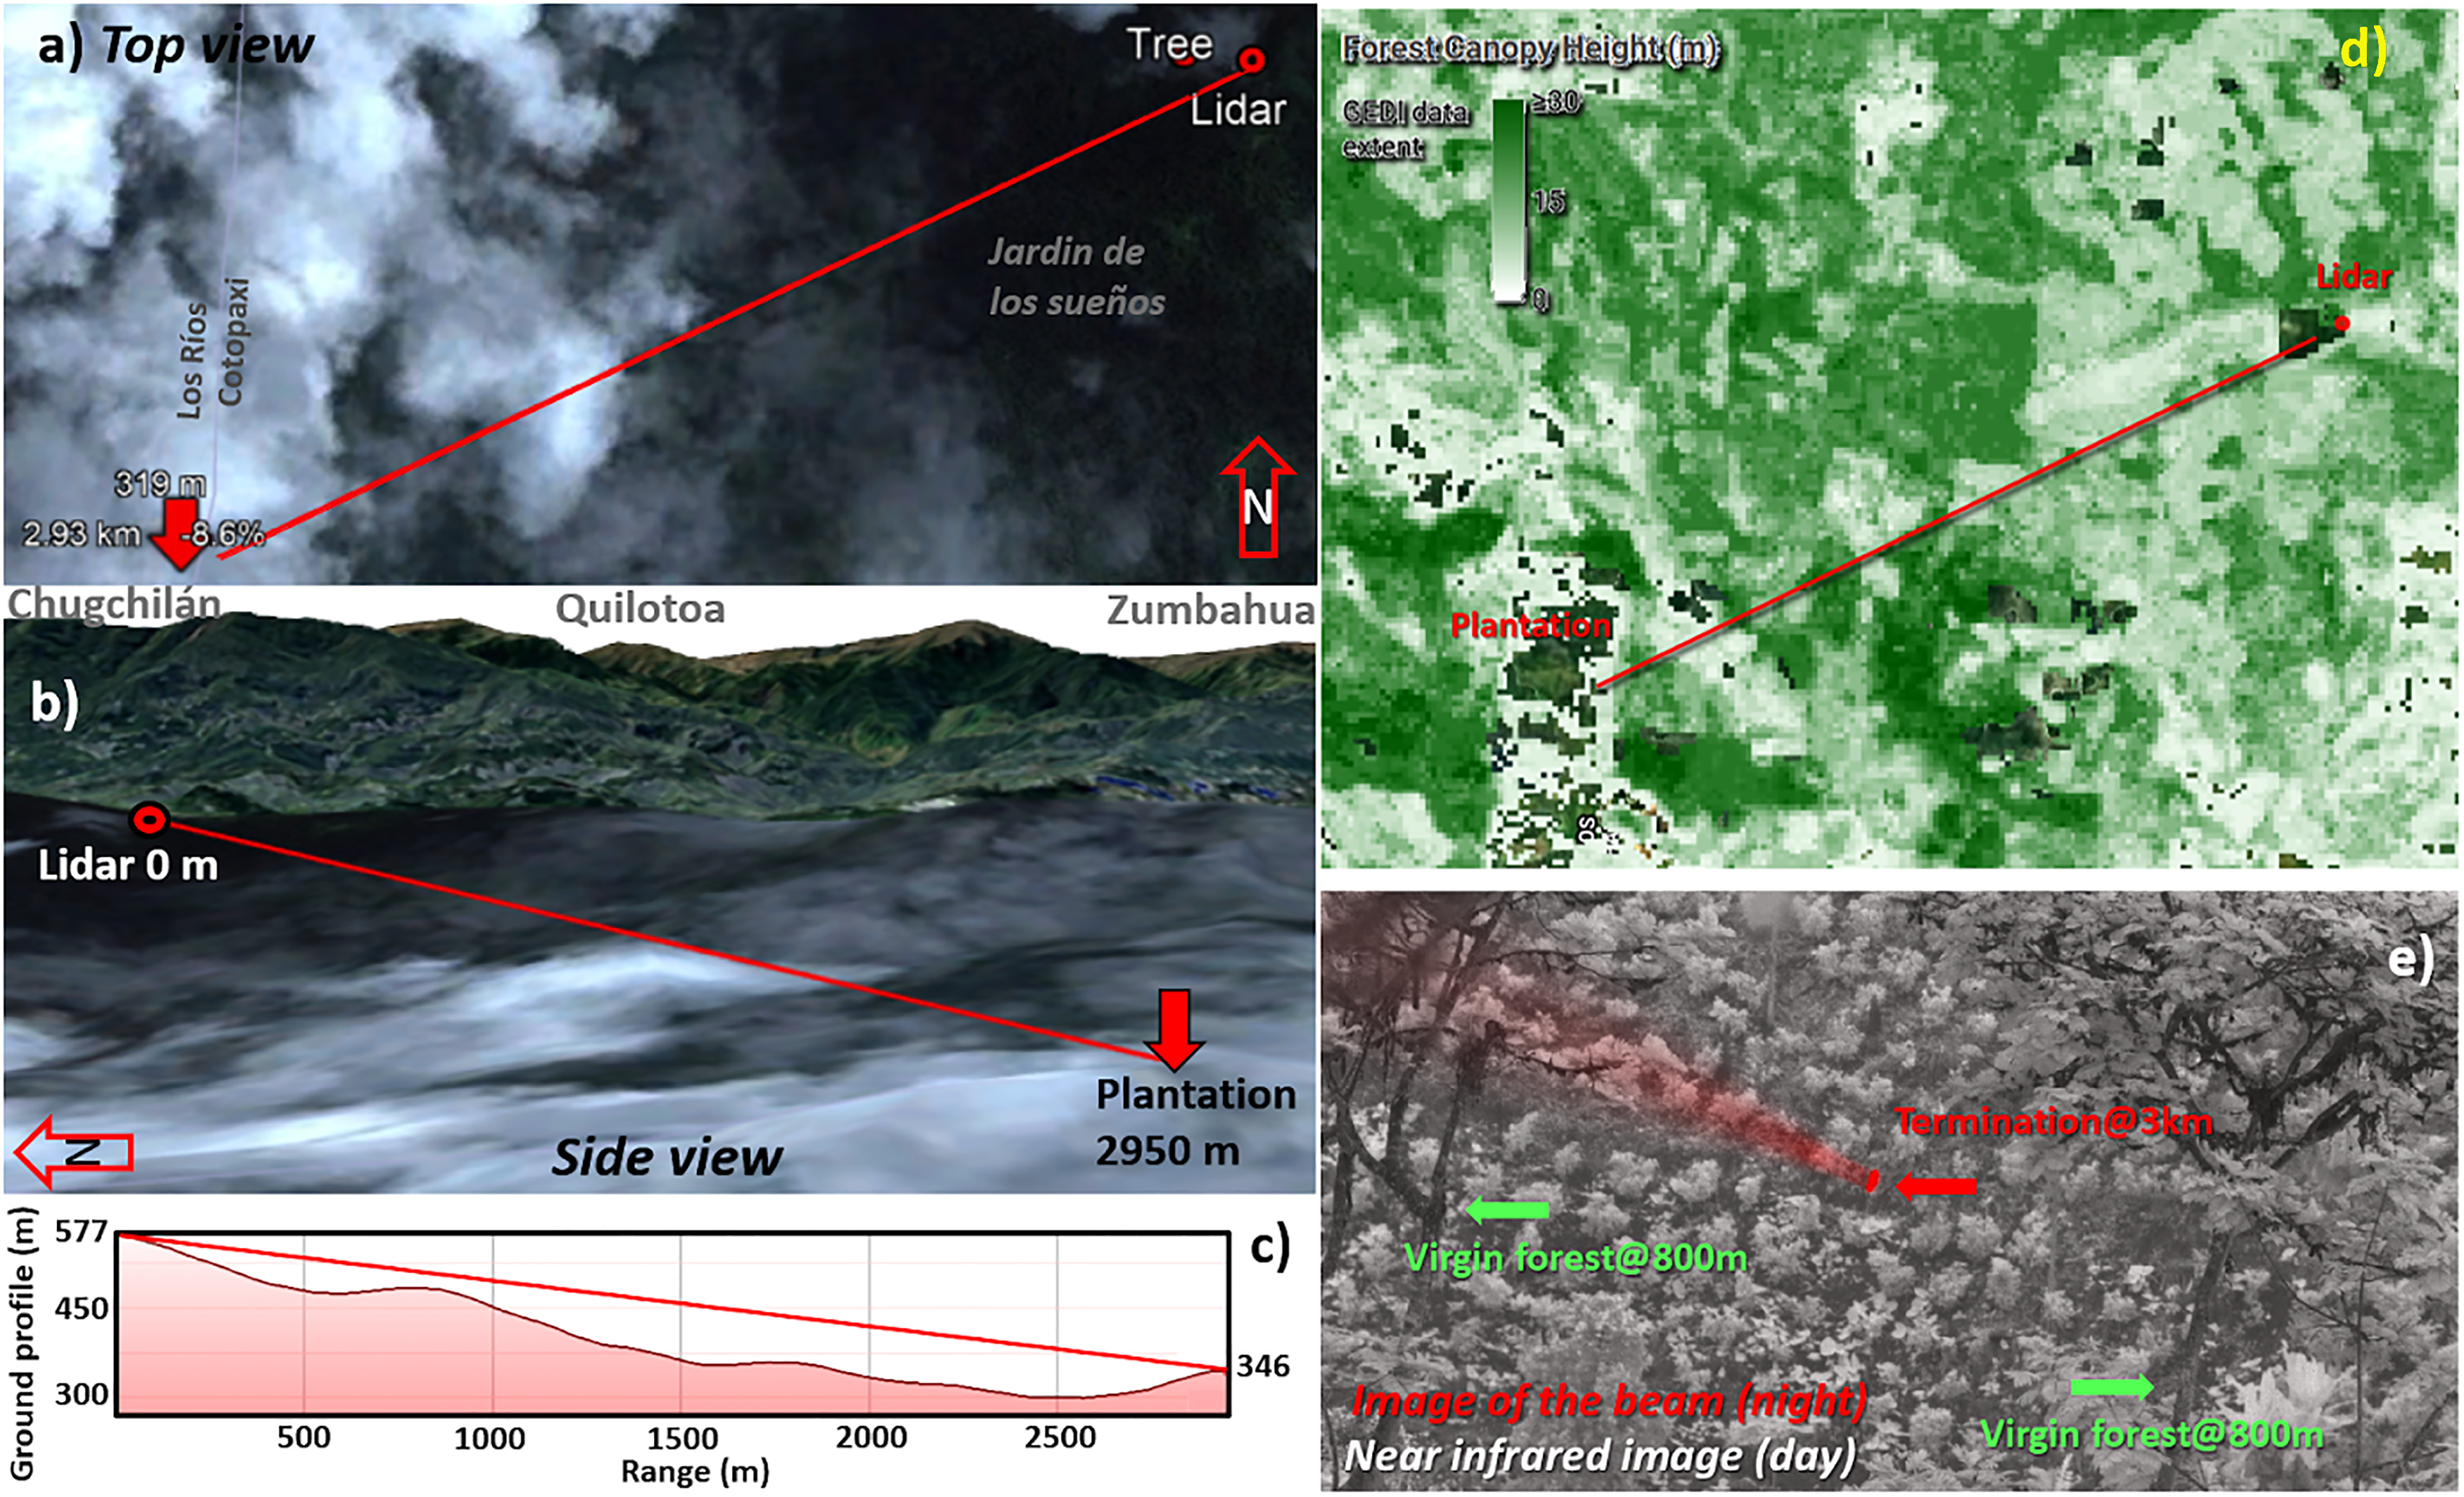
Lidar transect: (a) Top view from an overcast satellite image of the cloud forest. The laser beam terminates in the valley after propagating almost 3 km. (b) The field site is on the intermediate lowlands and is part of the great Pacific rainforest El Chocó, descending from the Andes to the Pacific Coast. (c) The beam was sent 4.5° inclined through the valley, at times with vegetation on both sides. (d) Average vegetation height from space-borne lidar, the darker green areas indicate primary forest. (e) Despite limited visibility by eye, an infrared NIR (0.8–1 µm) camera can at times form an image of the coffee plantation 3 km away where the beam terminates. The tall vegetation at a closer range is seen on both sides of the beam. A nighttime image is superimposed in red to display the backscattering in the air and the beam remote termination spot.
Test Range
For the feasibility test, the lidar system was transported to the field site and mounted in an open-side garage tent (Fig. 1a, 0°50′15.30″ S, 79°12′18.64″ W). The system was powered with a 2 kW generator placed at about 25 m in distance. The lidar was overlooking a descending skirt toward a valley covered by forest. This work reports results obtained from a transect terminating in a coffee plantation (Fig. 2d, 0°50′54.92″ S, 79°13′44.17″ W), some 2.950 km from the lidar. In its path, the beam descended at 4.5° from 577 to 346 m above sea level (Fig. 2c). Around 800 m, the beam was surrounded by tall canopies on both sides (Fig. 2e).
Dual-Band Entomological Lidar
The developed entomological lidar was designed according to the Scheimpflug lidar principle.19–22 This method employs multiplexed continuous wave lasers and triangulation in combination with the Scheimpflug focus strategy whereby sharp focus can be accomplished at all distances simultaneously despite the use of large apertures. This, in turn, allows for fast acquisition of up to several kilohertz and capturing of the oscillatory properties of nonstationary insect targets.16,23 Our system resembles previous systems on other continents,16,24–26 and it also consists of a transmitter and a receiver mounted on an aluminum baseline frame with an 845 mm separation (Figs. 1a and 3). This baseline is in turn, mounted on a heavy-duty motorized tripod (EQ8, SkyWatcher) for stable positioning and pointing. The transmitter is comprised of a beam expander with Ø120 mm/f600 mm (Startravel 120OTA, SkyWatcher) with an upgraded focal stage (Monorail R96, Teleskop Service). A dichroic beam splitter (Fig. 3a) is installed on a rotary stage at the focal port of the beam expander (#69-907, Edmund Optics, with B4CRP/M, Thorlabs). Two c-mount diode lasers are installed on the branches of the beam splitter: a 5 W, 808 nm diode, and a 3 W, 980 nm diode (MLD-808-5000 and MLD-980-3000, CNI laser). Both beams are transverse magnetic (TM) polarized with an aperture of 100 µm and rod lenses for matching the divergences. TM polarization implies that the E-field is parallel to the baseline of the lidar. The diodes are ordered with a Fast Axis Collimating lens precision glued to the device. Hereby divergence is 8° in both axes, and the collection efficiency by the f/5 telescope becomes 82%. The laser beam splitter mounting stage allows for a precise super-positioning of the two sources, while a cage system mounting permits the relative focus adjustment of the two diodes to compensate for the achromatic focal shift of the expander. For lidar overlap purposes, the beam expander is mounted on the baseline with a tangential mount (Stronghold, Baader).
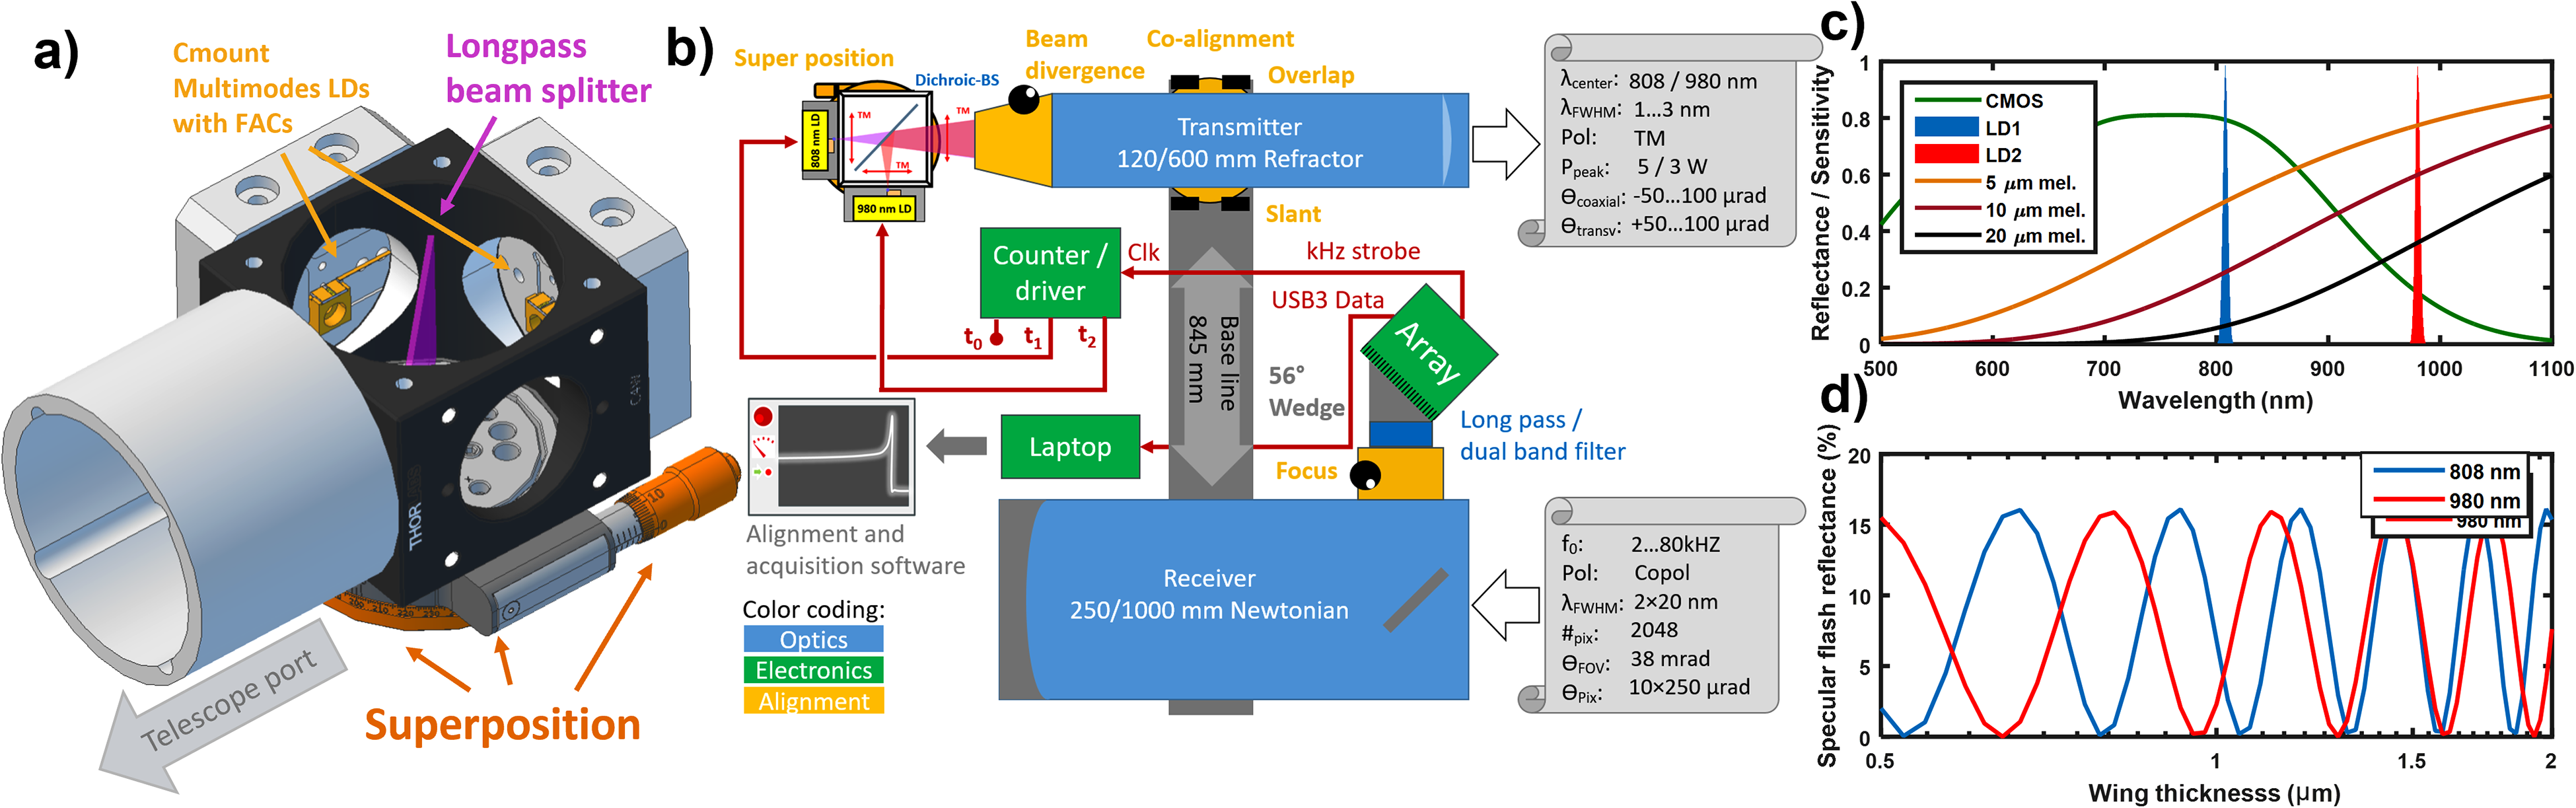
Technical details of the dual-band lidar system. (a) Close-up of dual-band laser diode assembly. The emission cones of two multimode laser diodes with fast-axis-collimators (FACs) are combined by a dichroic short pass beamsplitter on a precision alignment stage. (b) Schematics of the Scheimpflug lidar system. The sensor strobe signal alternates the laser driver between dark, 808 nm, and 980 nm. (c) Spectral overview displaying the CMOS array sensitivity and the emission of the two lasers. The reflectance model for insect targets with three different equivalent path lengths of pure melanin is displayed for reference. (d) Thin film model of the resonant backscatter for the two lidar bands as a function of typical insect wing thicknesses.
The receiver is a Ø250 mm/f1000 mm Newtonian reflecting telescope (Quattro-10S, SkyWatcher). A custom wedge is installed in the focal port. This wedge holds a Ø50 mm RG780 longpass filter (Edmund Optics). Further, the wedge supports a linear complementary metal-oxide semiconductor (CMOS) camera (OctoPlus EV71YO1CUB2210-BB1, Teledyne e2v Imaging). This 12-bit USB3 camera has 2048 pixels of 10 × 200 µm each and can reach line rates of 80 kHz. The camera emits a kilohertz strobe pulse at every exposure, this signal is used to alternate the laser driver between three states: dark, 808 nm, and 980 nm (Fig. 3b). This lock-in multiplexing method is also described in previous work.27–29 Light interaction with insects in the near-infrared (NIR) region is dominated by melanization and thinfilm 30 effects. Figure 3c displays the band placement in relation to the typical melanization of insects. 31 Figure 3d displays the ability of the two bands to produce resonant backscatter depending on the wing thickness for typical insect wing thicknesses.32,33 Entomological lidar is a noninvasive technique, meant to capture the natural behavior of insects in situ and in real time. For this, laser beams that are invisible to insects must be used when possible. On the one hand, from 800 nm to longer wavelengths in the NIR, this is predominantly true. On the other hand, fast Scheimpflug lidars are based on linear Si CMOS arrays with a kilohertz rate readout. The bandgap of these detectors allows detection of photons up to 1000 nm in wavelength. Within this spectral range, to retrieve complementary information from the target, a sensible strategy involves using multiple interrogation bands. The insect features which could cause a differential response within this range would be (a) absorption by the biopolymer melanin and (b) thin film interference effects from the 0.5- to 3-μm-thick (and smaller) chitin structures in the wing membranes. None of the generated spectral features are particularly sharp, therefore a wide possible wavelength separation is desirable. Figures 3c and 3d show our solution for this. As there are only a handful of diode laser bands in this range, we selected lasers emitting in the 808 and 980 nm bands, which are more common and efficient than others.
Finally, the lidar is equipped with an additional refracting telescope Ø102 mm/f500 mm (StarTravel, SkyWatcher) with a NIR sensitive USB3 camera (acA1920-155 μm, Bassler) for surveillance and beam alignment purpose (Fig. 2e). All telescopes are fitted with anti-dew bands to prevent water condensation on the optics (Astroshop). A complete components list is available from the corresponding author upon request.
System Operation and Data Collection
The system is operated from an adjacent laptop. The computer produces a preview of the infrared monitor camera for beam alignment purposes. The actual lidar data acquisition is done by a custom-made, real-time, user interface programmed in LabView (National Instruments). The program was set to capture frames of 30 000 exposures × 2048 pixels, it then demultiplexes the frame into a three-dimensional (3D) tensor of 10 000 exposures × 2048 pixels × 3 time slots (dark/808 nm/980 nm). The dark timeslot is identified by its minimum average total intensity and is subtracted from the 808 and 980 nm timeslot. The program then displays the minimum/median/maximum pixel profile (range echo) for each band. Also, the dark signal is displayed in a separate graph. The graphs update every time a new frame is acquired, and 12-bit raw intensity data is continuously saved on an external USB3 drive. Each filename is time stamped and each frame file is 120 Mb. In this work, the line rate was set to 5 kHz, line period 200 µs, exposure time 180 µs, preamplifier four times, gain eight times, and bias 0 counts.
Results and Discussion
Our report from this initial work focuses on the detection of insects under a dense fog, which is particularly relevant for monitoring the biodiversity of cloud forests under real, natural conditions. In Fig. 4a, the first light of the Ecuadorian lidar is presented in a time-range map displaying the first half hour of the measurements. The color coding includes the max signal from both bands as well as the median from the 808 nm band. Insects show up as green dots, bats are seen as yellow dots and the fog is identifiable in shades of blue and white. Artifacts from fireflies are also seen on some occasions. Initially, backscattered light is retrieved over the full range of 3 km, the fog then closes in and extinguishes light after 100 m. The plot is made from 250 lidar files, each spanning 6 s. In Fig. 4b, we display the time and range resolved frequency content in a single file. Even though the fog is much stronger in backscatter compared to insects, the frequency content of fog is relatively low. This implies that it may be challenging to contrast out insects inside fog in the intensity–time domain while the contrast in the power–frequency domain is much higher.
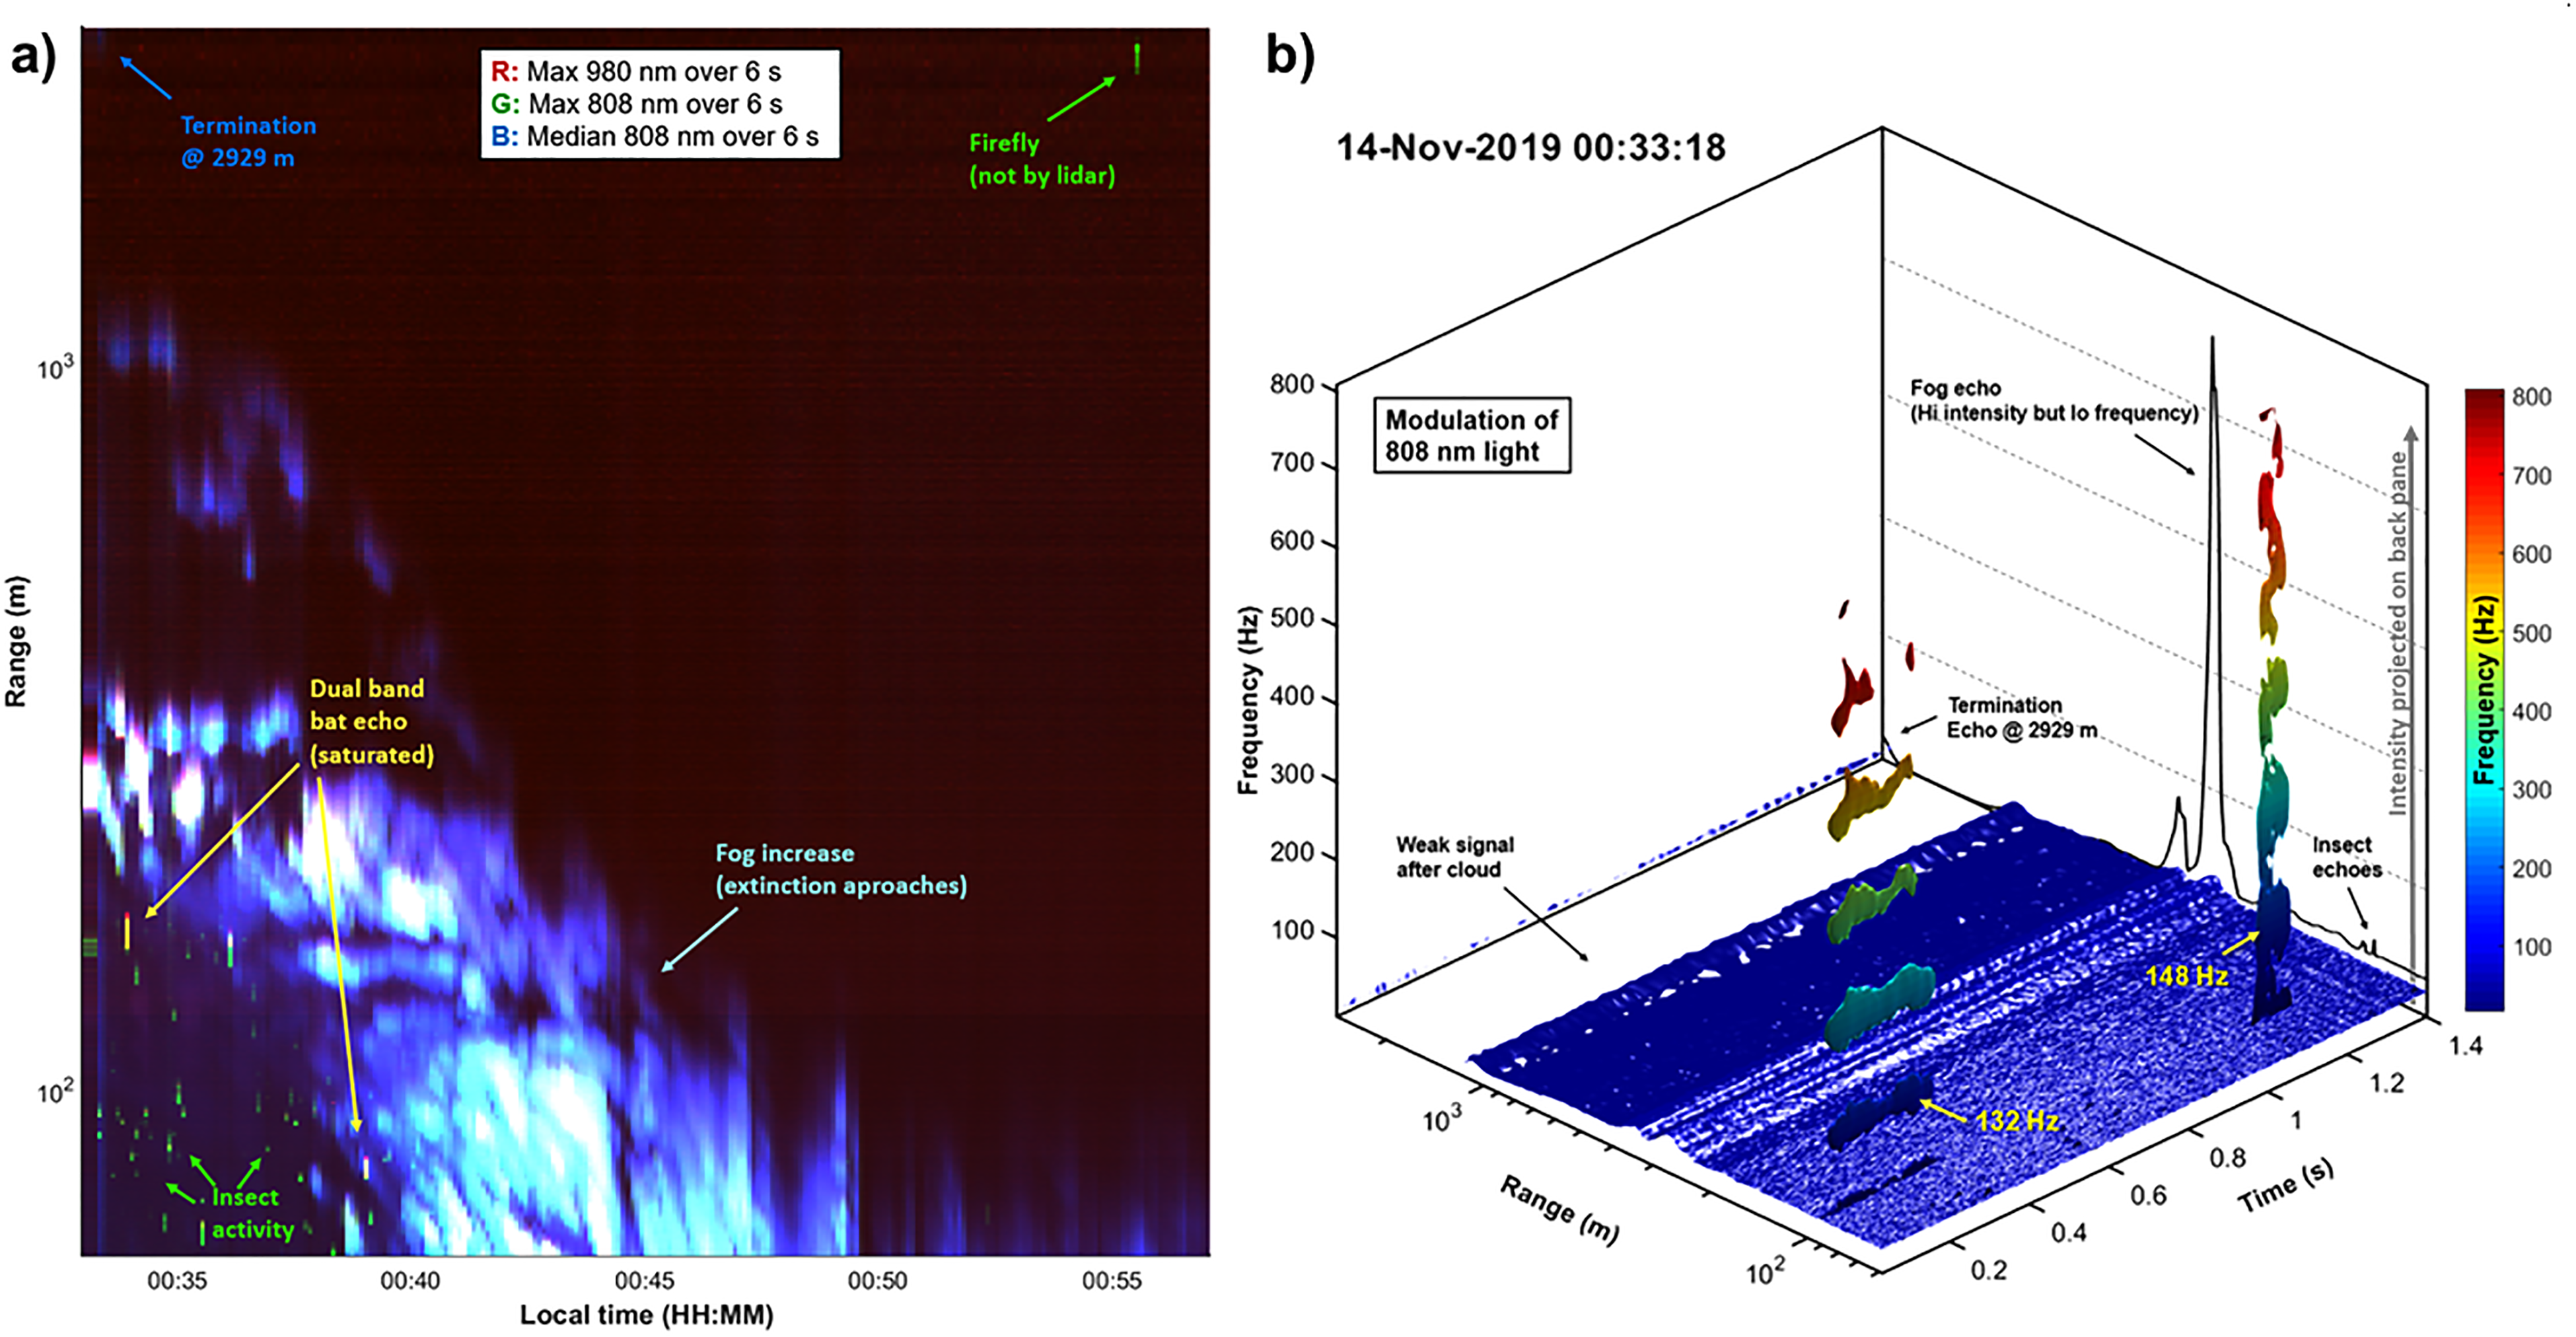
Lidar data: (a) The first half hour of the reported pilot field test is displayed in a time-range lidar map. Each column in the map represents a 6 s data file. The maxima values of 980 nm backscatter are displayed as red, the maxima of 808 nm are displayed as green, and, the median values of 808 nm, which is insensitive to insects, are displayed as blue. The beginning represents a rare occasion with a signal visible all the way to the termination 3 km away, the visibility then decreases, and light is extinguished within the first 100 m. Insects show up as green dots on the map and bats display strong echoes in both bands. Fireflies were also observed both visually and by the instrument. These signals are unrelated to the modulation of the lasers and their actual distance cannot be deduced. (b) Range resolved spectrogram of the lidar data illustrated by a 3D isosurface. The signal from the air and fog contributes low frequencies and is displayed in blue at the bottom of the plot. Two insects with distinct wing beat frequencies intercept the beam at a 100 m distance. The mean echo is displayed in the back panel on a linear scale, the signal is dominated by an intense peak from a cloud layer at a 300 m distance, and smaller echoes from the two insects and the termination are also seen. Note that the contrast between fog and insects is poor in the echo intensity domain but great in the frequency domain.
In Fig. 5, we highlight the first insect observation at a 90 m of distance during 200 ms (the same file as Fig. 4b). The signal from the insect is small compared to the fog layer at a 300 m distance, still the fog is thin enough at this point that allows light to reach the termination at 3 km and return. Figure 5b also shows that the 980 nm signal is one order of magnitude weaker than the 808 nm band. There are multiple reasons for this: (i) weaker laser power, (ii) worse spectral response of the detector, and (iii) less atmospheric scattering. The echo of the insect is, however, stronger for the 980 nm band, relative to the atmospheric signal. This is because melanin absorbs less in the 980 nm band (Fig. 3c). If the system was white calibrated against a target with flat spectral reflectance, the band ratio from the body signal would be converted into the equivalent absorption path length of pure melanin in micrometers. 31 For the wing signal, this is slightly more complicated since clear wings produce thin film fringes (Fig. 3d).32,33 Also, the body and wing signals can be seen in the time domain, as shown in Fig. 5c, as a bias envelope and an oscillatory part, respectively. A close inspection of the signal also demonstrates a highly periodic waveform with various features. The frequency content of the signals in Fig. 5d indicates a wing beat frequency of 136 Hz. The 100–200 Hz range is a common wingbeat frequency among insects,16,23,32,34 such as flies and beetles, thus we could not make more informed guesses about the family it belongs to, except that we are dealing with a clear-winged insect (not a moth) because of the spiky waveform and the numerous harmonics. This case also demonstrates that the second harmonic is often stronger than the fundamental tone which can be a challenge for a prospective automatic pitch detection. 23
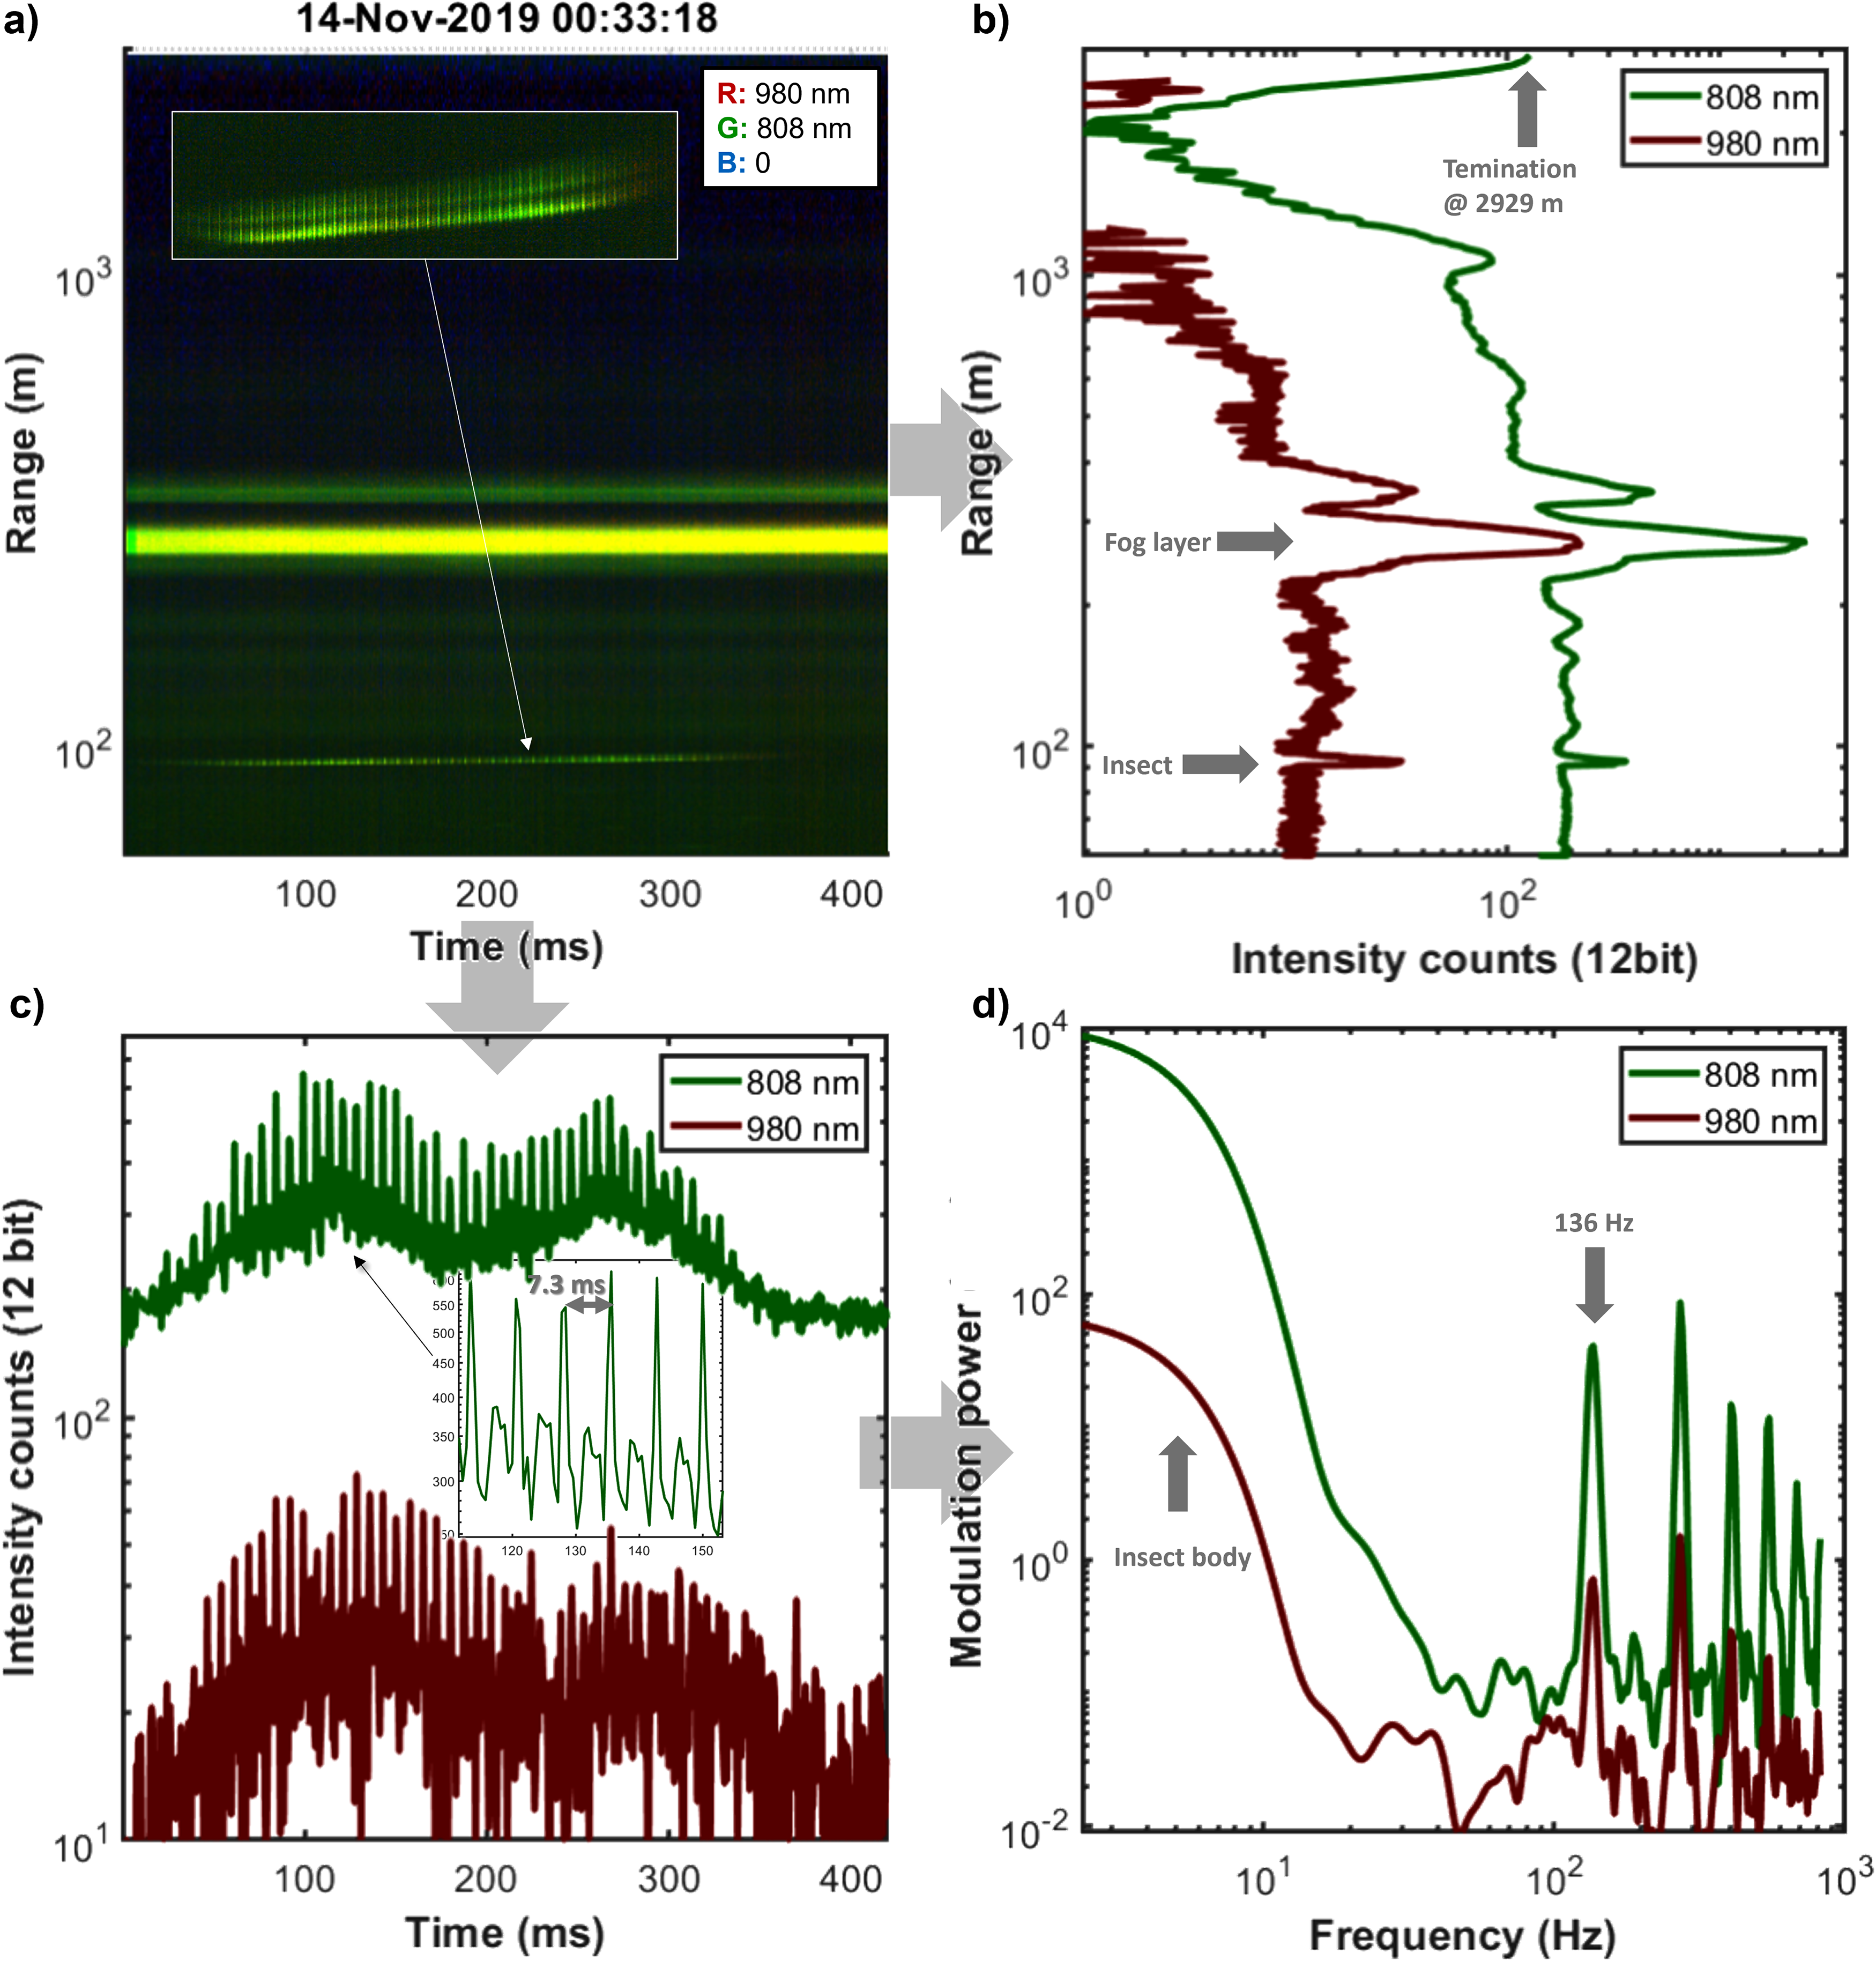
Example of insect observation by the dual-band lidar: (a) Dual-band range-time displaying fast oscillatory insect observation versus the slowly changing fog layer. (b) Average echo of the same data; insect, fog, and termination features are seen at 90 m, 300 m, and 2.929 km distance, respectively. The 980 nm signal is generally one magnitude weaker, but the insect echo is relatively stronger for 980 nm due to the lower atmospheric scattering coefficient and lower absorption by melanin. (c) Time series of the two bands composed of an oscillatory part from the wings and a bias envelope from the body, the insert displays the reproducibility of the waveform. (d) In the corresponding power spectrum, the fundamental tone is not necessarily the strongest, but in this case, the second overtone is.
The case highlighted in Fig. 6 is instead of a moth. This is supported by the hour of flight, the rather low wingbeat frequency, the smooth waveform (low-intensity skewness), and the large apparent size24,35,36 of 84 mm. A detailed inspection of the signal in Fig. 6a reveals a particular dynamics not only in intensity but also in the pixel spread value, the pattern can be explained by scattering contributions from both the dorsal and ventral sides of the left and right wings of the insect. Figure 6a also reveals for the first time oscillatory lidar extinction, where the fog backscatter beyond the moth is shaded when the wings display maximal cross-section. In Fig. 6b, the range echoes for each of the two bands are displayed at the times tfog and tmoth indicated in Fig. 6a. Signal reduction beyond the moth is seen. In theory, lidars can acquire both backscatter and extinction cross sections, and in the applications for entomological lidars is possible to determine both the geometrical cross section and the reflectance at specific bands independently. At this time of the night, laser light was extinguished after 200 m, for guidance, exponential decay (round trip) is superimposed on the graphs in Fig. 6b. In this case, the moth is detected during extremely dense fog conditions with an attenuation coefficient, µatt, in the order of 20 km–1, as obtained from the underlying exponential fitting.
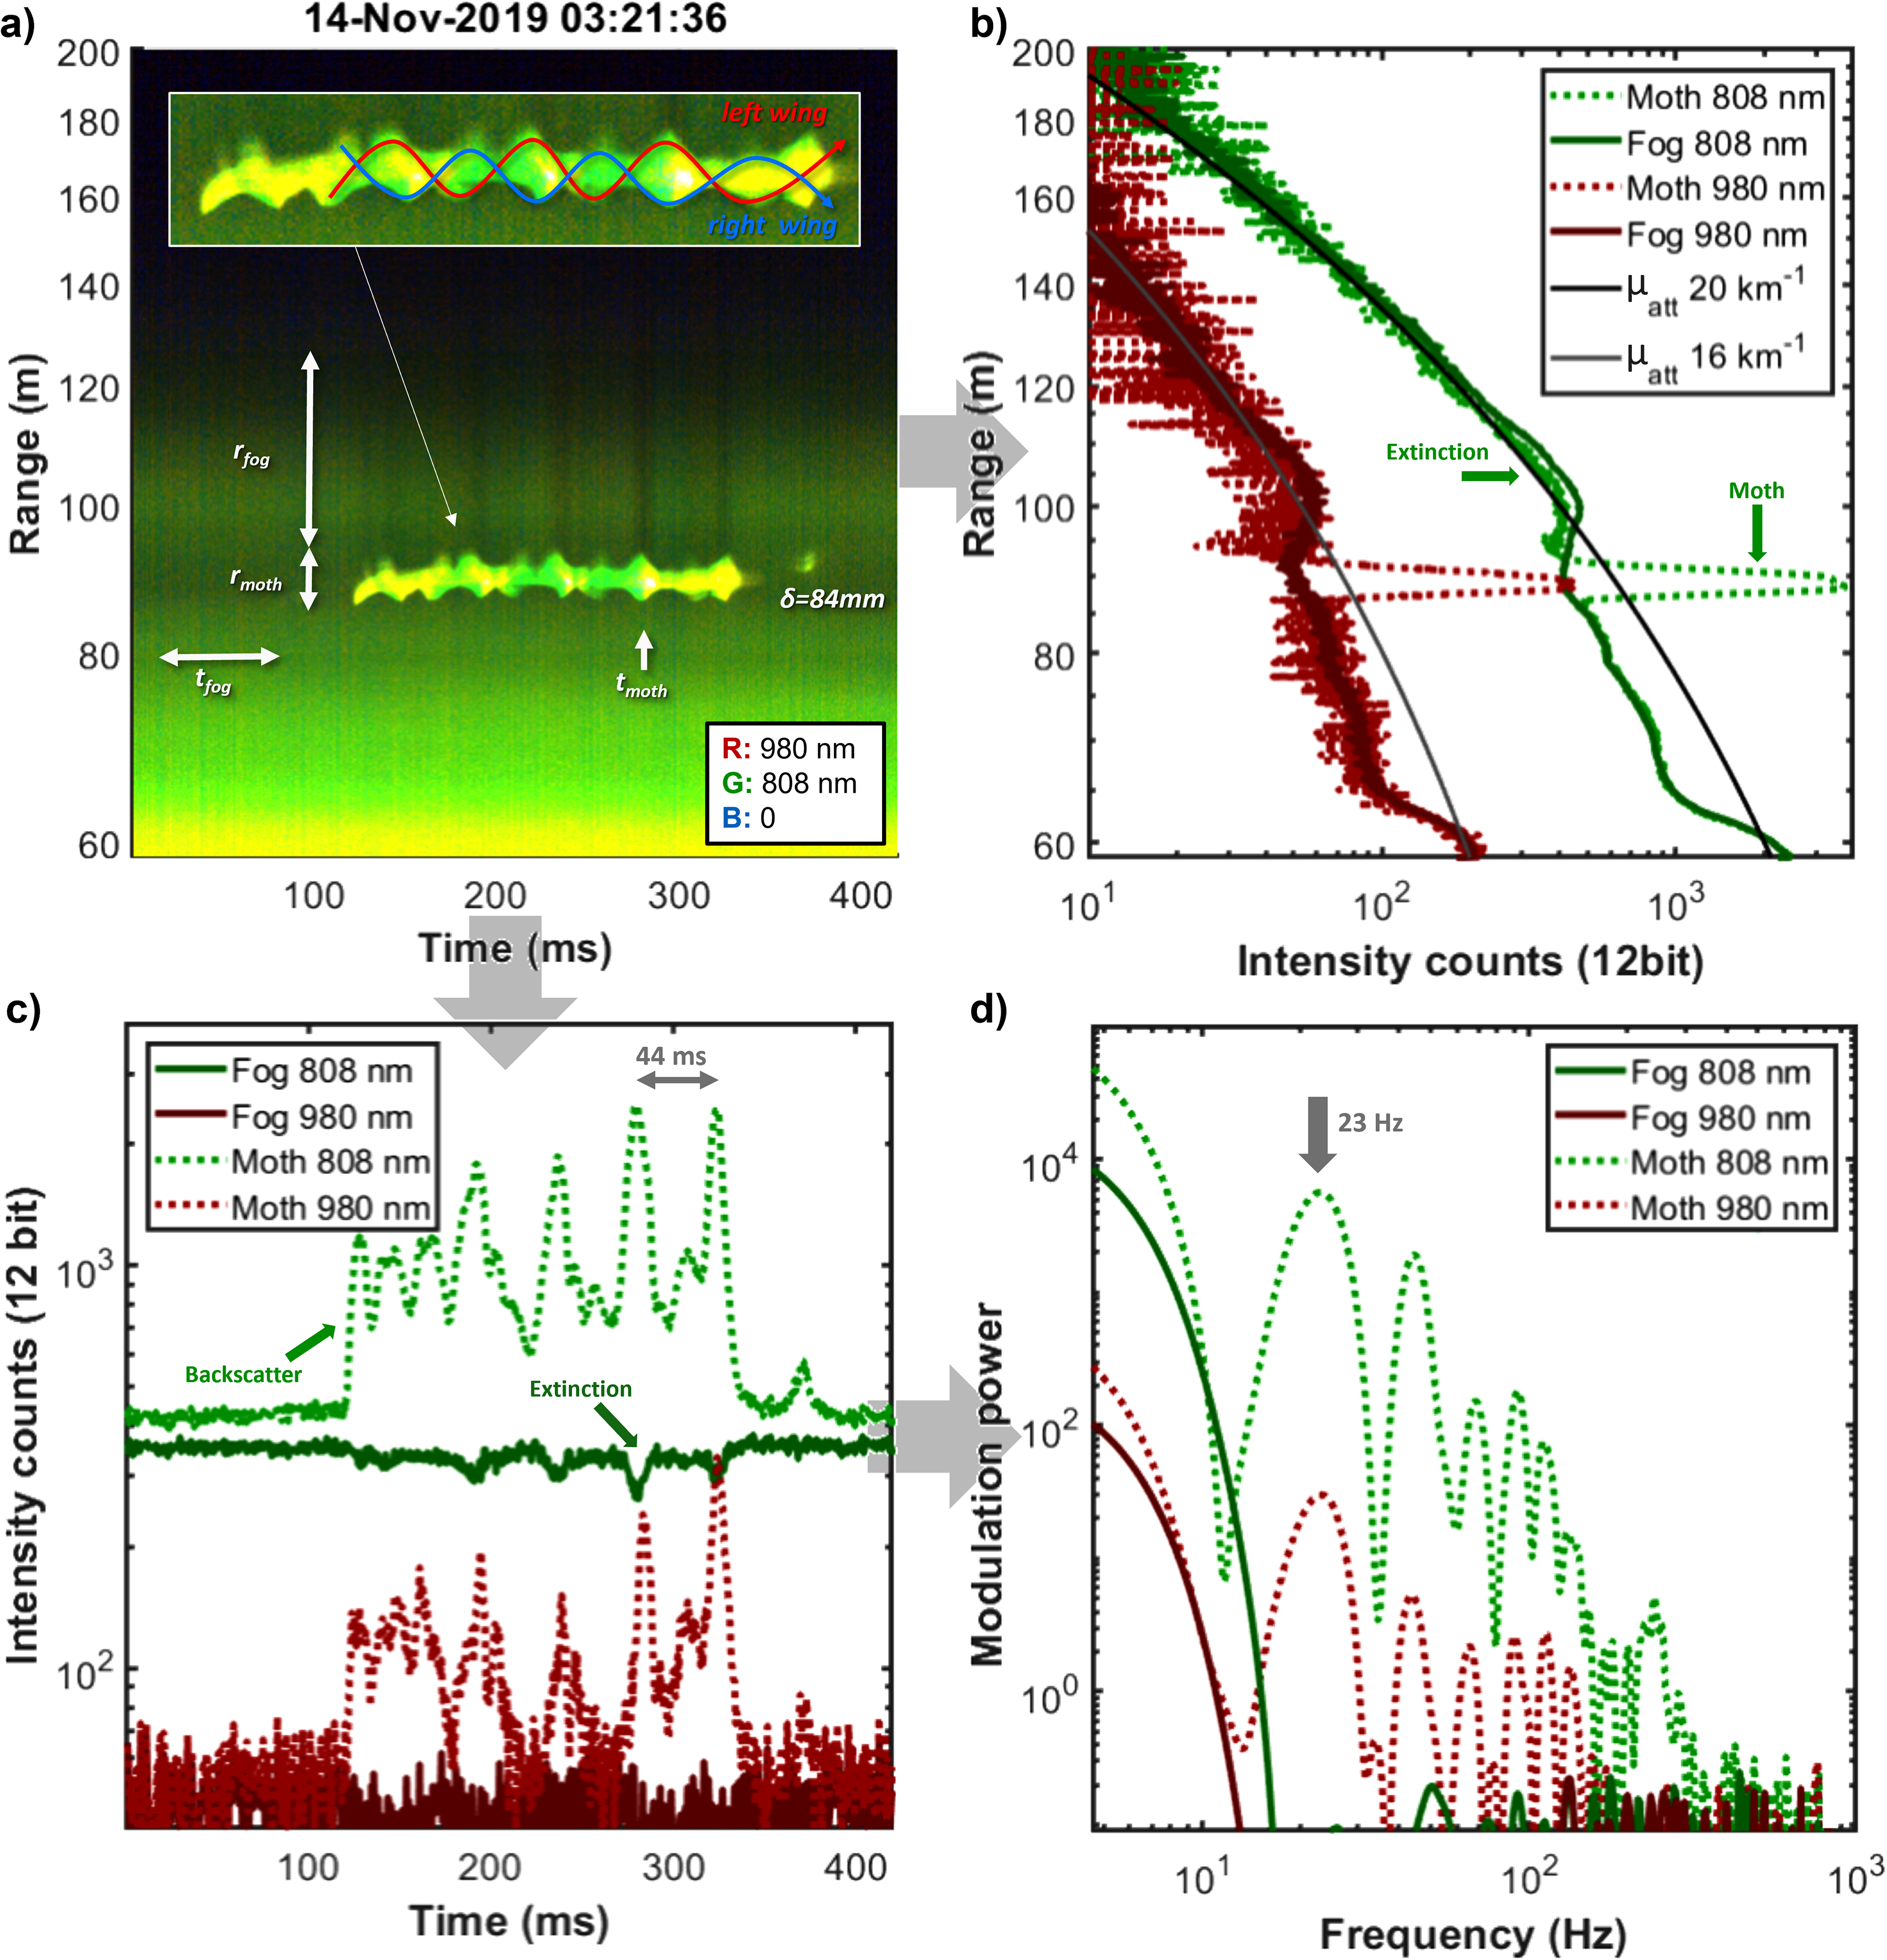
Lidar observation of a low frequent moth (a) dual-band time-range map; dense fog is seen as a gradient across the map. The apparent size was estimated to be 84 mm. The oscillatory extinction of the moth reduces the following backscatter from the fog and periodic shades are seen, e.g., at tmoth, when the wing has a maximal cross-section. (b) Comparison of echoes from fog, tfog, and from fog extinguished by the moth, tmoth. A small effect of the extinction is seen. The signal reaches noise levels after 200 m, for visual guidance two exponential decays are inserted with extreme atmospheric attenuation coefficients, µatt, of 16 and 20 km–1. (c) The time series of the two bands are composed of an oscillatory part from the wings and a stronger bias envelope from the body (as compared to Fig. 5c). (d) In the corresponding power spectrum, the fundamental tone is the strongest.
The benefits of dual-band37,38 and hyperspectral 39 detection of insects have previously been demonstrated in laboratory settings. In Fig. 7, we show that the two spectral bands contribute complementary information and that they are not simply redundant. To support this, consider that the correlation of the two bands in Fig. 7 is 72% demonstrating that they are not completely redundant but, rather, complementary (they should have been 100% correlated otherwise). If we neglect the noise, this result implies that adding the second band contributes 28% of new information. This value could obviously be greater or smaller for other species. Also, it is evident that the signals in the 808 and 980 nm bands are far from covarying throughout the approximately four wingbeats seen in Fig. 6. The trajectory in the spectral parameter plane in Fig. 7 is color-coded by the time during transit. Several repeated features can be observed; straight and fast downstrokes, wavy slow upstrokes, a secondary minor peak from the right wing, and a counterclockwise pattern due to contributions from both the melanized dorsal side and the brighter ventral side. 31 The dual-band information retrieved is indeed rich beyond the simple modulation power spectra in Fig. 6, and thus the potential of applying this complementarity to differentiate numerous species is promising. To date, there are well-established methods for signal diversity assessment, deriving from scientific communities of music analysis, speech recognition, and bioacoustics.40,41 Unfortunately, most audio approaches are insensitive to waveforms and relative phases of harmonics. The concept of including multiple bands and polarizations waveforms in diversity computations is even more exotic in this literature.
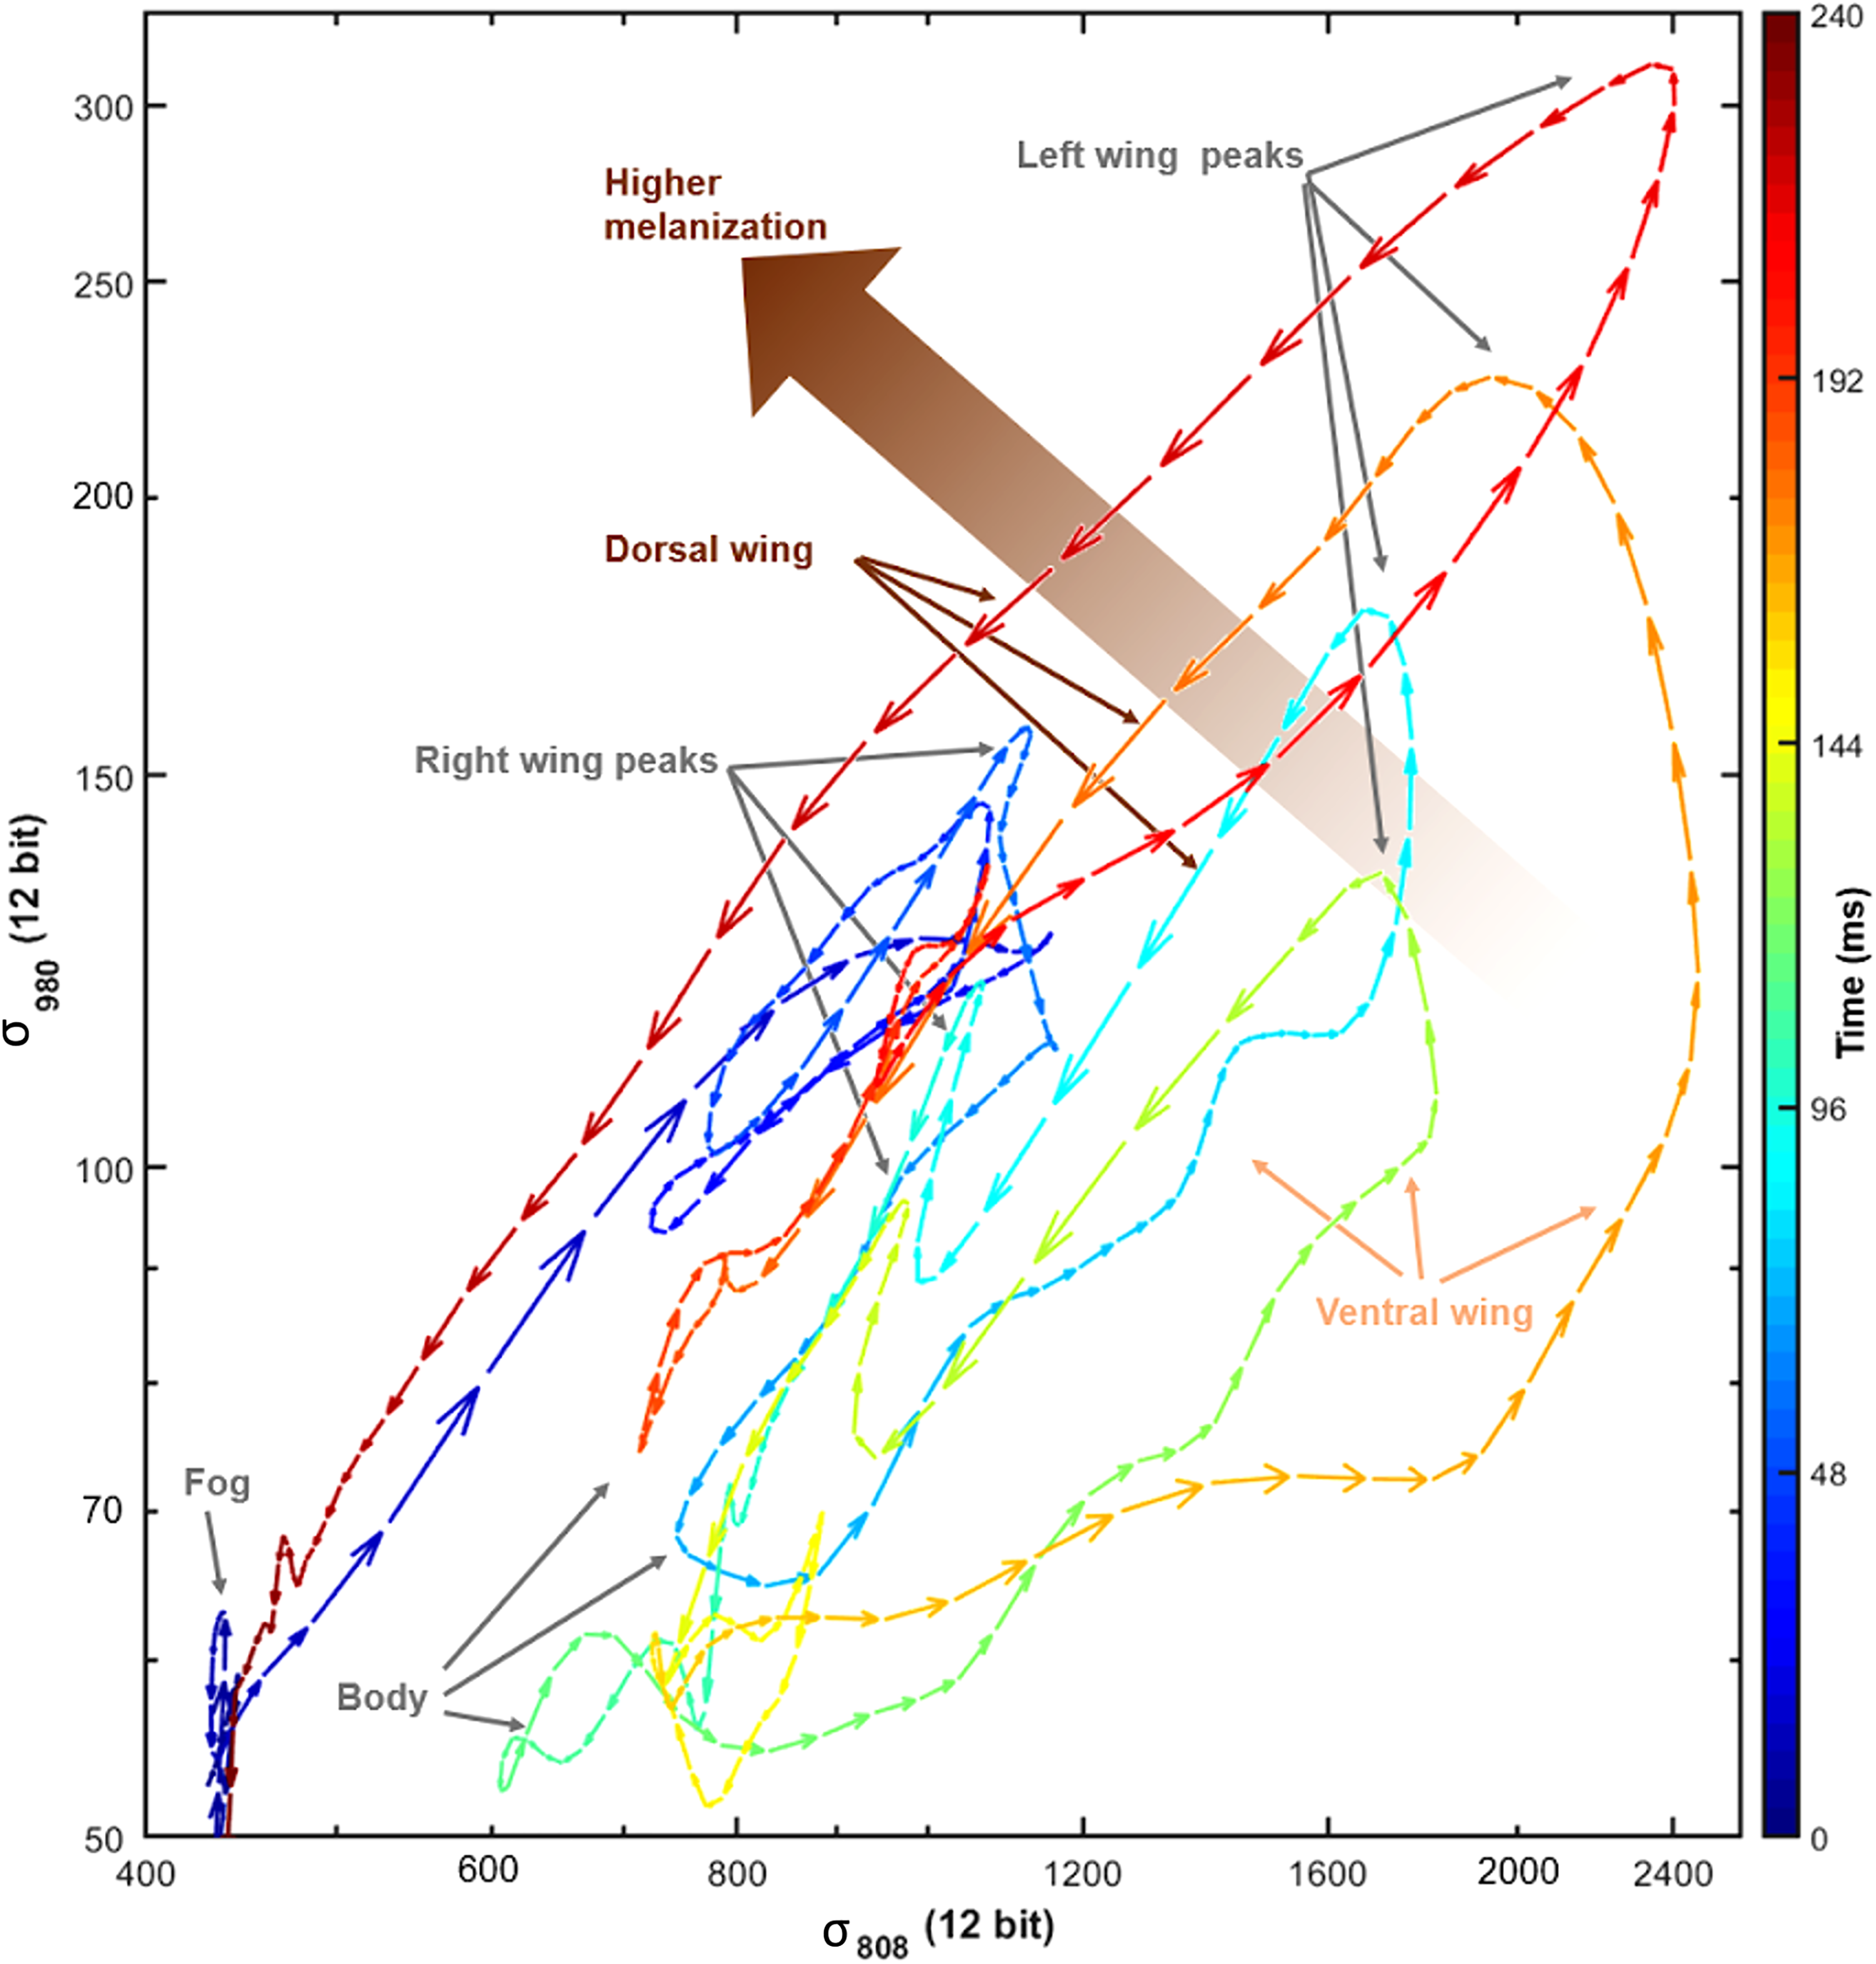
Dynamics of the backscattering signal from the moth in Fig. 6c. Each arrowhead indicates raw unfiltered backscatter intensity counts for consecutive time samples for the 808 and 980 nm bands. The color of the arrows indicates the time from 0 to 240 ms and the length indicates speed. The signals are not simply covarying (i.e., they are not linearly correlated). On this slightly challenging graph, repeated features can be observed from the consecutive wingbeats. During each cycle, both left and right wings produce a peak, and they show also higher melanin absorption on the dorsal side for further differentiation of the signals. Melanization is higher on the dorsal side of the wings. The downstrokes appear straight and fast, whereas the upstrokes appear wavy and slower.
The precision of estimating biological richness by lidar is currently unknown and still challenging to validate because the gold standard (e.g., Malaise traps) is inconsistent as well. The instrument limit of distinguishable species by entomological lidar is also unknown but the deployment of such a system at Ecuadorian sites is prone to provide this number statistically because the arthropod richness will include several thousand species on a single site.
Conclusion
We have successfully constructed a dual-band entomological lidar in Ecuador and tested it in a field campaign under particularly challenging atmospheric conditions, unlike any other previous lidar study. A hard target could be observed at a 2.929 km range on rare occasions. Insects and vertebrates were observed easily up to 200 m distance and sampled at 5 kHz in a shared dual-band multiplexing scheme. While intensity domain thresholds yield rather low contrasts for insects embedded in the fog, in the frequency domain, the contrast can be substantially higher. Thus, frequency domain thresholding may be advisable for detecting insects inside a fog. The combination of dense fog and large insects can cause oscillatory lidar extinction effects, which are displayed in this work for the first time. The applications are yet to be explored, but the effect could enable independent estimation of geometrical cross-section and absolute spectral reflectance. We demonstrated a case where left- and right-wing movements induced oscillations in both intensity and the pixel spread, and we could also associate features of the same signal with both the dorsal and ventral side of the wings by estimating melanization with the dual-band lidar.
Some considerations for future improvement can be also indicated. The employed receiver focal length is somewhat excessive and suboptimal for short ranges up to several hundred meters, which would be enough to profile through a virgin forest canopy even at an elevation angle. The long focal length also implies a high sensor tilt angle whereby the camera enclosure partly shades the Newtonian f/4 light cone impinging on the furthest pixels. The combination of a weaker laser at 980 nm and an inferior spectral response of the line camera at this band make the 980 nm signal one order of magnitude weaker than the 808 nm signal. The melanization effect of insects looking brighter at 980 nm only improves this unbalance marginally. Stronger 980 nm laser diodes with equivalent aperture are now available, however. The insect activity during our present dataset was relatively low compared to previous studies.16,23,24,35 This is presumably because the busy crepuscular rush hours were missed and because laser light was extinguished shortly after the system was near the limit most of the time. The latter issue can be fixed by a shorter receiver focal length.
The deployment of a dual-band entomological lidar in a region with one of the regions of the highest biodiversity in the world paves the way for beating several records over a global comparison: who can retrieve the largest number of distinct signals? Who can count most insects per cubic meter and time unit? What is the chronobiology of bat and bird insectivores in relation to their prey? How is the abundance and species richness stratified throughout the canopy heights? How to make robust data pipelines and benchmark this biodiversity assessment tool for the ultimate goal of better sustainable preservation and management of our planet?
Footnotes
Acknowledgments
We greatly appreciate our host and cook Christophe Pellet for accommodation and for allowing us to work on his property (Bosque privado, Jardín de los Sueños, Maná, Ecuador). We thank Andrea Caicedo, José Tinajero, and Nicolas Tinoco from Pontificia Universidad Católica del Ecuador for participating in the biological aspects of the field campaign. We thank Camilo Díaz, Elizabeth Samaniego, and Iván De la Cruz from Escuela Politécnica Nacional for their collaboration during the entire project and fieldwork. We appreciate fruitful discussions with Samuel Jansson, Meng Li, Igor Buzuk, Eric Warrant, Jadranka Rota, David Dreyer, and Hampus Månefjord. This work was partially delayed due to the pandemic situation in Ecuador.
Declaration of Conflicting Interests
The author(s) declared no potential conflicts of interest with respect to the research, authorship, and/or publication of this article.
Funding
The author(s) disclosed receipt of the following financial support for the research, authorship, and/or publication of this article: The Ecuadorian entomological lidar instrument development and test were financed by CEDIA with a CEPRA XII Project. JS and MB's participation in this study was partly supported by the European Research Council (ERC) under the European Union's Horizon 2020 research and innovation program (grant agreement No. 850463).