
Abstract
In this study, we developed a method to build Raman calibration models without culture data for cell culture monitoring. First, Raman spectra were collected and then analyzed for the signals of all the mentioned analytes: glucose, lactate, glutamine, glutamate, ammonia, antibody, viable cells, media, and feed agent. Using these spectral data, the specific peak positions and intensities for each factor were detected. Next, according to the design of the experiment method, samples were prepared by mixing the above-mentioned factors. Raman spectra of these samples were collected and were used to build calibration models. Several combinations of spectral pretreatments and wavenumber regions were compared to optimize the calibration model for cell culture monitoring without culture data. The accuracy of the developed calibration model was evaluated by performing actual cell culture and fitting the in-line measured spectra to the developed calibration model. As a result, the calibration model achieved sufficiently good accuracy for the three components, glucose, lactate, and antibody (root mean square errors of prediction, or RMSEP = 0.23, 0.29, and 0.20 g/L, respectively). This study has presented innovative results in developing a culture monitoring method without using culture data, while using a basic conventional method of investigating the Raman spectra of each component in the culture media and then utilizing a design of experiment approach.
This is a visual representation of the abstract.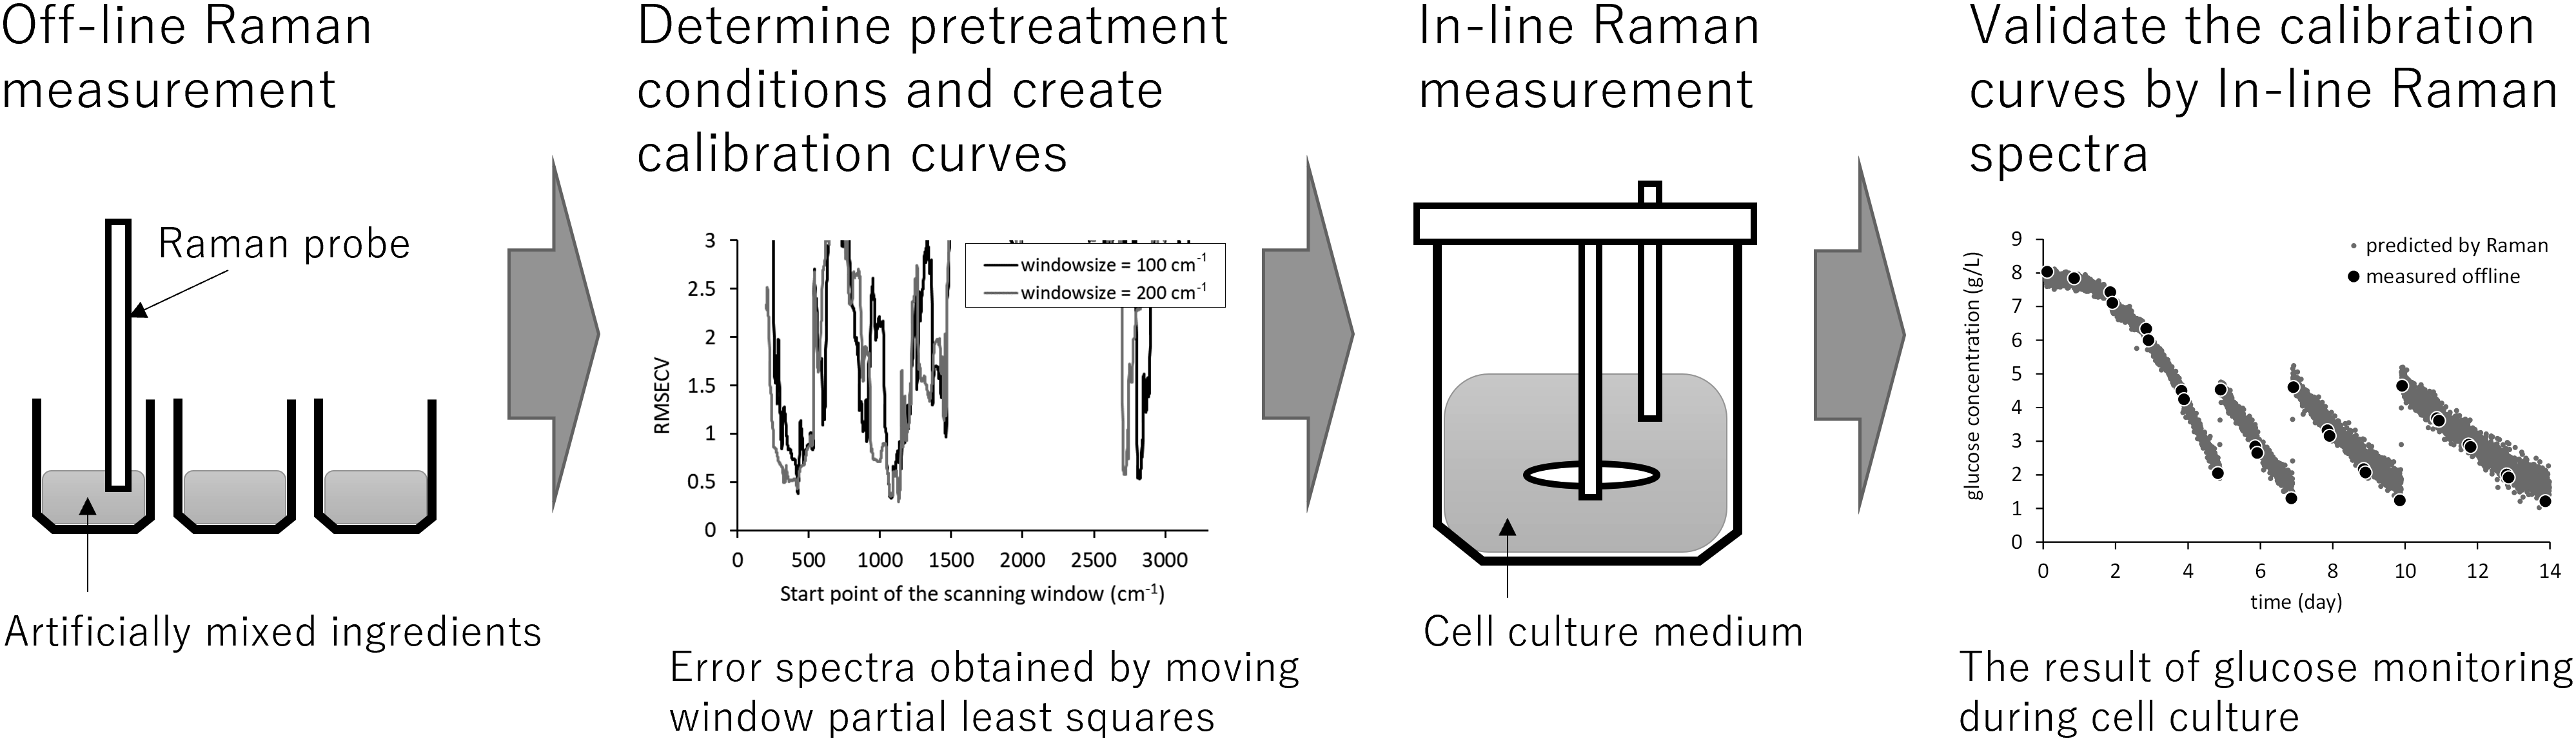
Keywords
Introduction
Real-time monitoring and control of bioprocess parameters are essential to increase their efficiency and reduce the cost of final products. The core requirements for real-time analysis include process analytical technology (PAT). PAT is a system to design, analyze, and control manufacturing through measurements of the performance and critical quality attributes of raw materials and in-process materials in a timely manner (i.e., during processing).1–4 The purpose of PAT is to ensure consistent quality of the final product and is endorsed by regulatory agencies, including the U.S. Food and Drug Administration. 5 Currently, apart from real-time measurements of pH, dissolved oxygen (DO), and temperature, many cell culture parameters such as metabolite and product concentrations, cell growth, and other product quality attributes are monitored using off-line methods. 6
Vibrational spectroscopy and fluorescence spectroscopy have attracted much attention as methods of in-line analysis of metabolite concentrations in bioprocesses.7–12 Normally, analysis of components in culture requires sampling and removal of cells, but vibrational spectroscopy allows noninvasive analysis by inserting an optical probe into the culture tank. In general, calibration models are created with spectra measured continuously in-line as the explanatory variable and metabolite concentrations measured off-line by conventional methods as the objective variable. 7
In particular, Raman spectroscopy is a promising method for quantifying cellular metabolite concentrations among vibrational spectroscopy.13–17 Raman spectroscopy is a noninvasive analytical method, and the spectrometer and measuring unit can be connected by fiber, allowing the use for industrial equipment. Compared to the other vibrational spectra, Raman spectra are less affected by water in the media, and Raman peaks can be separated relatively easily. The ability to calibrate multiple components is another advantage of Raman spectroscopy, with glucose and lactate being the most reported models, and there are also reports for antibodies, glutamine, glutamate, viable cell density (VCD), and total cell density (TCD).13,18,19 It has also been shown that in-line Raman spectroscopy analysis helps the control of the culture environment and improves culture efficiency.20,21 Thus, it is expected that Raman spectroscopy will be put to practical use and become more widely used.
An important challenge in bioprocess monitoring using Raman spectroscopy is the robustness of calibration models. It is known that calibration models are less accurate when culture conditions such as feed agent addition patterns, volumes of incubators, type of culture media, and cell lines are changed.22–25 One of the reasons for the poor robustness of the calibration models is considered that they do not directly capture the signals of the objective component. For example, in a model where the wavenumber regions are not well selected, the contribution of changes other than the objective component will be larger and more susceptible to environmental noise. It should be avoided that the calibration model reflects the characteristics of other components or samples that are cross correlated with the component of interest.
Two main approaches have been taken to address the challenges of robustness. The first approach is to prepare calibration data sets for various fermentation conditions. An example method is the use of design of experiments (DoE) to select samples of culture media that have less cross-correlation among their components to be used as a calibration set.26,27 The just in time learning (JITL) model, which accumulates data from previous fermentations and reconstructs the calibration model by re-selecting calibration sets in real time, has also been proposed.28,29 A drawback of these previous studies is the large number of fermentations required to prepare calibration data sets that yield accurate quantitative models. The greater the number of fermentations, the more time and labor intensive the experiment and the greater the cost of calibration modeling.
The second approach is to devise calibration modeling. There are overlaps in the bands of each component represented in Raman spectra, as well as baseline variation due to changes in the physical properties of the samples. Selecting a wavenumber region that reliably captures the band intensity of the target component with little overlap of other components is effective in improving robustness, as well as providing a clear rationale for the calibration model. Previous studies have reported increased calibration accuracy using nonlinear models such as Gaussian process regression and Cubist regression model rather than the more common partial least squares regression (PLSR) analysis.30,31 However, few previous studies of nonlinear models have provided a basis for calibration models based on band attribution. Some other previous studies have identified the peak positions of metabolites in the Raman spectra and then performed wavenumber selection to create calibration models that capture the band intensities using PLSR. There are methods of moving window partial least squares (MWPLS) and searching region standard normal variate (SRSNV) that have been reported to be useful in efficiently selecting spectral wavenumbers for use in calibration models.32–35 Moreover, spectral pretreatment methods to capture the peak intensity of the objective component with minimal baseline variation have been investigated, including baseline correction, intensity correction, standard normal variate (SNV), Savitzky–Golay first derivative, and Savitzky–Golay second derivative, but few reports have compared which is the best pretreatment.
This study aimed to develop a calibration model by measuring Raman spectra of non-cultured samples as a calibration set and use them for real-time monitoring of cell culture. The impact of accomplishing this research is to propose a simple and more robust method of developing calibration models for cell culture monitoring. Preparing samples of artificially mixed ingredients are experimentally less labor intensive, less time consuming, and cost effective than preparing samples of the cell culture media. Since this method does not involve culture, the calibration models can be prepared immediately in response to changes in culture media or cell lines. Moreover, the models should not be affected by feeding patterns or culture volume. It also has the advantage of being environmentally friendly, as it eliminates the need for a culture environment for the development of calibration models and minimizes the use of reagents. In order to develop more accurate calibration models using non-cultured samples, it is necessary to understand Raman spectra and set appropriate pretreatment conditions. Therefore, in this study, the peak positions, and intensities of Raman bands of the major components of the target samples were examined and multiple series of pretreatment conditions were compared. This method will provide useful insights for subsequent studies developing calibration models in spectroscopy, as the technique can be used for applications beyond cell culture.
Materials and Methods
Methodology
First, Raman spectra of single component solutions were obtained for the main components in the culture media (glucose, lactate, glutamine, glutamate, ammonia, media, feed agent, and VCD) for studying the Raman spectra of each component. According to the orthogonal array of DoE, a sample set was prepared by artificially mixing the main components in the culture media, and then Raman spectra were measured. Several combinations of pretreatment methods and wavenumber regions were compared to search for optimal calibration model development conditions. Finally, the chosen calibration model was applied to the actual culture, and calibration errors were evaluated.
Materials and Methods for Band Graph Preparation
Materials
Glucose, lactate, glutamine, glutamate, ammonia, antibody, cells, media, and feed agent were purchased from the following companies and used without purification: Glucose (D–(+)–glucose solution 45%, Sigma), lactate (sodium L-lactate 98%, Sigma), glutamine (L-glutamine solution, Fujifilm Wako), glutamate (L-glutamic acid monosodium salt monohydrate, Aldrich), ammonia (ammonium chloride, Fujifilm Wako), antibody (normal human IgG, whole molecule, purified, Fujifilm Wako), cells (K1 strain (GenScript) of floating, antibody-producing Chinese hamster ovary (CHO) cells), media (BalanCD CHO growth A w/o glucose, Irvine Scientific, Fujifilm), and feed agent (BalanCD CHO Feed 2 w/o glucose, Irvine Scientific, Fujifilm)
Sample Preparation
Single-component aqueous solutions were prepared with five levels of concentrations for the main metabolic components and inputs of the cell culture media. The concentration ranges were set to be the values that the cell culture media could take. The concentrations of glucose and lactate were adjusted to be 2, 4, 6, 8, and 10 g/L, while those of glutamine, glutamate, and ammonia were fixed to be 2, 4, 6, 8, and 10 mM. Those of media and feed agent were adjusted to be 20, 40, 60, 80, and 100%. Antibody samples were prepared in five levels of phosphate-buffered saline (PBS) solutions of 2.3, 4.0, 5.7, 7.5, and 8.8 g/L.
Cells were harvested from a Balan media with high cell viability immediately prior to the Raman spectra measurement. After measuring the TCD and VCD, the required volume of culture media was collected and centrifuged to precipitate the cells. The supernatant was discarded, and PBS was added to obtain 40 mL of viable cell PBS solution prepared for each of the five levels of 0.1, 6, 12, 18, and 24 ×106 cells/mL.
Raman Spectra Measurement
A Raman spectrometer (HyperFlux Pro Plus 785, Tornado Spectral Systems) equipped with a 785 nm laser was used to collect Raman spectra over a spectral region of 3300–200 cm−1. The conditions for Raman spectra measurement were laser power of 200 mW, exposure time of 3200 ms, and accumulation number of 60. The exposure time was set so that the spectra would not saturate during the process. Dark spectral measurement for dark current compensation was taken before each spectral measurement. Cosmic ray removal and dark spectrum subtraction were implemented using HyperFlux Pro Plus software.
The Raman spectrometer and a sapphire ball lens probe (Bio Reactor Ball lens Probe, Marq Metrix) were connected by an optical fiber (Marq Metrix). The optical fiber was fixed so that it was not subjected to strong bending stress. Raman spectra were measured for samples in 50 mL beakers set in a hot stirrer (RCH-1000, Eyela). The samples were agitated at a rotational speed of 200 rpm and heated to a liquid temperature of 37 °C. The sapphire ball lens probe was held in place using clamps and a stanchion, standing vertically with the lens directly below the liquid surface of the sample.
Raman Spectral Analysis
The analysis of the Raman spectra in this study was performed in Python. The difference spectra were calculated for each component by subtracting a solvent spectrum from an aqueous solution spectrum. In the difference spectra of the highest concentration of each component, peaks that changed linearly with respect to the change in solute concentration were classified as strong if the Raman intensity of the difference spectra was greater than 600, medium if it was between 200 and 600, and weak if it was between 50 and 200. For those that had concentration-dependent baseline variation in the difference spectra, the shape of the baseline was recorded. The peak positions and intensity and baseline changes for each component were summarized as band graphs.
Materials and Methods for Developing Calibration Models
Materials
The materials were the same as those in the Materials and Methods for Preparing Band Graph section above.
Sample Preparation
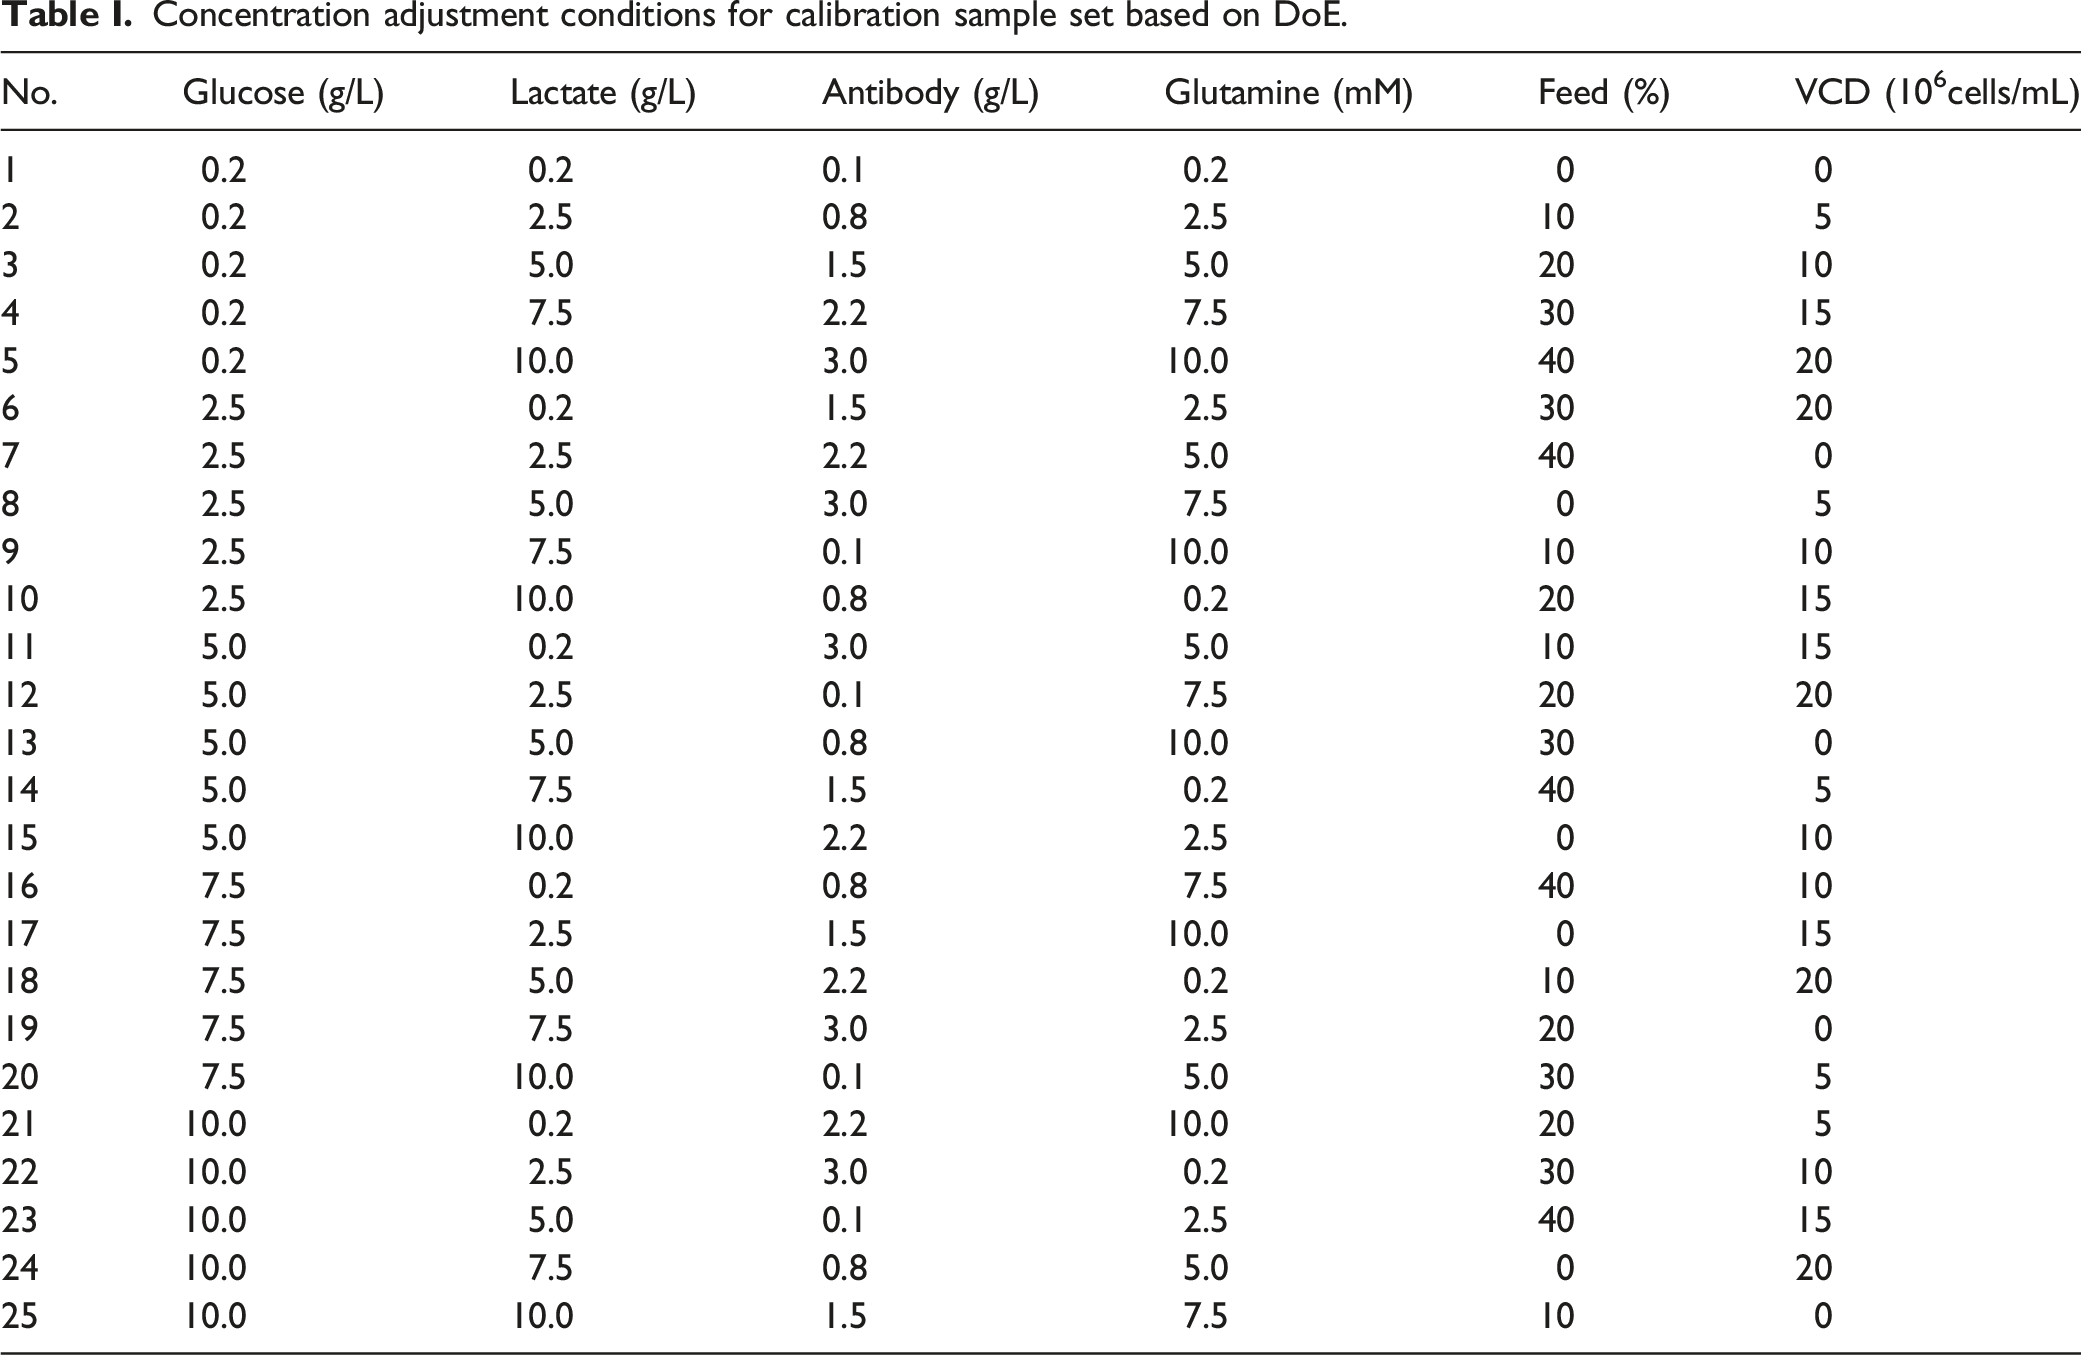
Concentration adjustment conditions for calibration sample set based on DoE.
Raman Spectra Measurement
A Raman spectra measurement method was the same as those in the Materials and Methods for Preparing Band Graph section.
Raman Spectral Analysis
RMSECV and RMSEP results of each pretreatment set.
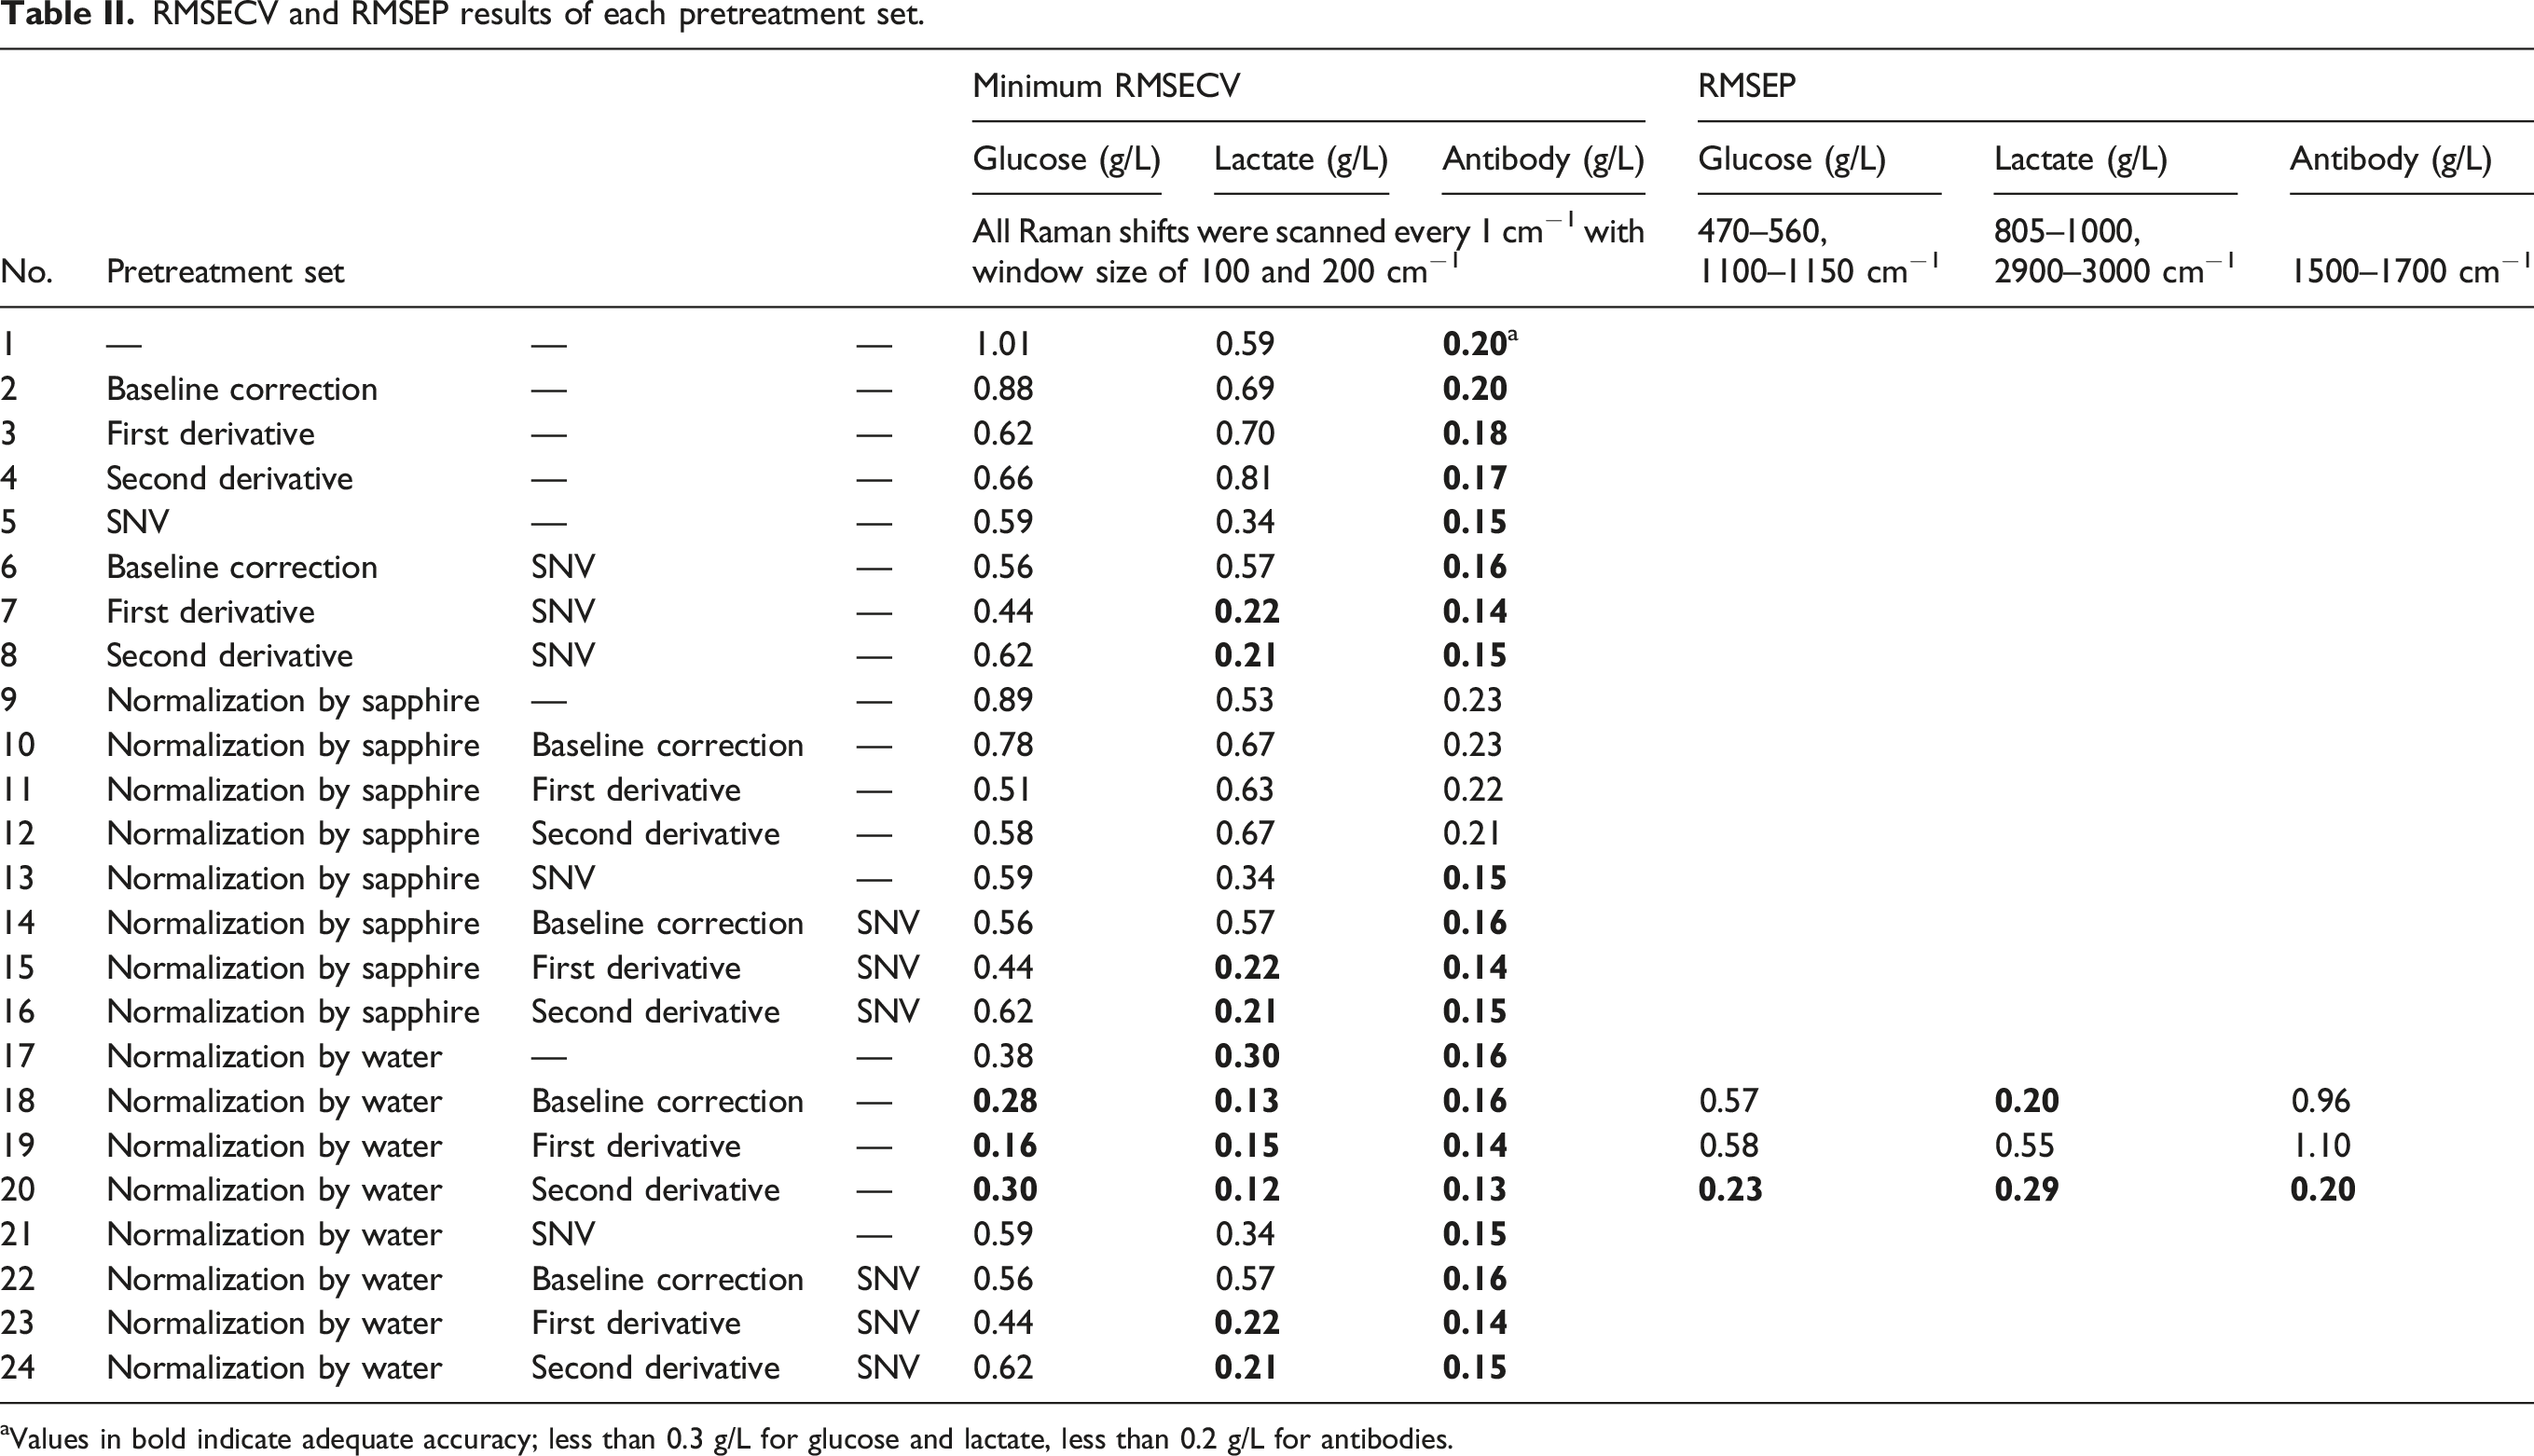
aValues in bold indicate adequate accuracy; less than 0.3 g/L for glucose and lactate, less than 0.2 g/L for antibodies.
Error spectra were calculated using MWPLS for pretreatment conditions, 1–4, 9–12, and 17–20, and SRSNV for preprocessing conditions, 5–8, 13–16, and 21–24. The window width was set to 100 cm−1 and 200 cm−1. The PLSR model was developed while scanning the window every 1 cm−1, and the root mean square error of cross validation (RMSECV) was calculated by the leave one out method. MWPLS and SRSNV were performed for three component concentrations, glucose, lactate, and antibody, and the minimum RMSECV values for each pretreatment were compared to determine the candidate pretreatment methods. The number of latent variables (LV) in the PLSR was set 2 for glucose and lactate and 3 for antibody. Although it was possible to use glutamine as the objective variable using the same method, it was excluded from this study because the range of glutamine concentration was too small to evaluate under the culture conditions employed in this study.
From the error spectra of the candidate pretreatment methods determined above, wavenumber regions with a sufficiently small RMSECV (RMSECV<0.3 g/L) suitable for quantitative analysis were selected. Referring to the band graph, the wavenumber region used in the calibration model was determined so that the peak intensity of the objective component could be well observed and was less affected by peaks of other components. When multiple regions with smaller RMSECV were obtained, they were combined.
Materials and Methods for Evaluating Calibration Models
Materials
Cells, media, feed agent, penicillin streptomycin, and anti-clumping agent were obtained from the following companies: Cells (K1 strain (GenScript) of floating, antibody-producing Chinese hamster ovary (CHO) cells), media (BalanCD CHO growth A w/o glucose, Irvine Scientific, Fujifilm), feed agent (BalanCD CHO Feed 2 w/o glucose, Irvine Scientific, Fujifilm), penicillin streptomycin (x100, Fujifilm), methionine sulfoximine (Sigma), and anti-clumping agent (x200, Gibco).
Cultivation Method
Cultures were conducted three times according to the following method. The cell acclimated to media was pre-cultured in a CO2 incubator (37 °C, 5% CO2, humidified) in a triangular flask (150 mL/500 mL) with shaking (125 rpm), and cells in the log growth phase were used for culture in the bioreactor. The media was supplemented with penicillin streptomycin, 25 µM L-methionine sulfoximine and anti-clumping agent.
An Advanced Control Bioreactor System BR1000 (Yokogawa Electric Corp.) was used as the cell culture system. To prepare the culture tank, a 5 L vessel (Able) was equipped with a pH sensor (Hamilton), a DO sensor (Mettler Toledo), a viable cell sensor (ABER), and a Raman ball lens probe and autoclaved (121 °C, 20 min). The vessel was set in BR1000 and media was aseptically flushed; the media temperature was raised to 37 °C using a heat band (Threehigh). When the temperature had reached to 37 °C and stabilized, the cells prepared in the pre-culture were aseptically seeded. The seeding volume was adjusted so that the initial density of cells was 5.0 × 10⁵ cells/mL.
The following fermentation conditions were used, and each parameter was controlled and manipulated using the BR1000's onboard functions. Culture media temperature was controlled at a constant 37 °C using a heat band. The pH was set in the range of 6.97–7.02 and controlled within the range using alkali (NaHCO3) and top surface CO2. DO was controlled at a constant level of 4 mg/L by blowing pure oxygen through a microsparger on the underside. The stirring speed was kept constant at 100 rpm, and Air+5%CO2 was constantly blown from the top surface at 1000 sccm. The feed agent was flowed 4% of the volume daily. Glucose was fed in bolus and adjusted to return to 5 g/L when it fell below 2 g/L. The fermentation period was set at 14 days.
Raman Spectral Measurement and Off-Line Concentration Measurement
The Raman spectrometer, fiber, and ball lens probe used for the measurements were the same as those in Materials and Methods for Preparing Band Graph section. The measurement conditions were also the same as those, with a laser power of 200 mW, exposure time of 3200 ms, and average number of spectra of 60. Dark spectral measurement was taken before a batch of culture. Each spectrum took approximately 3 min to be obtained and recorded.
Off-line measurements for glucose, lactate, and antibody concentrations were taken once a day under normal conditions. Additional measurements for glucose and lactate were taken before and after the addition of the feed agent on the day it was added. In total, Raman spectra of glucose and lactate were measured 80 times, and those of antibodies were measured 45 times offline in all three fermentations. A 300 µL sampling was taken for glucose, lactate, and antibody concentrations on an off-line analyzer (Cedex Bio, Roche).
Raman Spectral Analysis
The Raman spectra of the cultures obtained in-line were subjected to the set of pretreatments and then fitted with the calibration model developed in the Materials and Methods for Developing Calibration Model section. Based on the predicted values, the results of monitoring each component in the culture media were plotted. Raman spectra for use in the validation set were chosen to be the one closest in time to the reference sampling. The RMSEP of the calibration model was evaluated by comparing its predictions of the validation set with off-line measurements.
Results and Discussion
Raman Spectra of Single Components
Figure S1a (Supplemental Material) shows Raman spectra of glucose, lactate, glutamine, glutamate, ammonia, antibody, viable cells, media, and feed agent, and Figure S1b depicts difference spectra calculated by subtracting a spectrum of solvent from a spectrum of each solution. In all raw spectra, peaks originating from ball lens sapphire were observed at 2331, 753, 579, 451, 420, and 381 cm−1. Since all the samples in the experiments were aqueous solution systems, water peaks were observed at 3250–3100, 1640, and 900–200 cm−1. Calculation of the difference spectrum reveals how the spectra change with the concentration of the aqueous solution.
It can be seen from Figure S1 that the Raman spectra of the glucose solutions show strong bands at 1130, 519, and 427 cm−1, medium bands at 2904, 1465, 1376, 1068, 923, and 361 cm−1, and weak bands at 2953, 1272, and 861 cm−1 (Figure S1). Those of lactate solutions yield strong peaks at 1456, 1419, 857, and 541 cm−1, medium peaks at 2947, 2890, 1364, 1318, 1092, 1047, 932, 786 and 432 cm−1, and weak peaks at 2991, 1591, 673 and 286 cm−1 (Figure S2). The results of their peak positions and intensities were in good agreement with those of previous studies.38,39
On the other hand, only weak peaks were observed at 1428, 1351, 910, and 856 cm−1 for glutamine (Figure S3), and at 1415, 1350, and 938 cm−1 for glutamate (Figure S4). These results were also in good agreement with those in previous studies.40,41 Moreover, almost no signal was observed in the difference spectrum of ammonia (Figure S5).
Significant baseline fluctuations were observed in the difference spectra of the antibody with peaks that varied with concentration (Figure S6). Peak intensities of the spectra in Figure S6b were calculated by subtracting the baseline variation, and it was found that the antibody had strong peaks at 1675, 1458, 1346, and 1006 cm−1, medium peaks at 2943, 1246, 886, 878, and 761 cm−1, and weak peaks at 2896, 1649, 1560, 1208–1037, 965, 946, and 647 cm−1.
No positive peaks were observed in the difference spectra of the viable cell PBS solutions, and an inversely proportional relationship was recognized; in the difference spectra in Figure S7b the band intensity of water decreases as the VCD increases (Figure S7). The spectra of the media and the feed agent had the baselines that increase from 3000 to 200 cm−1 with increasing the concentrations (Figures S8 and S9). Both the media and the feed agent showed strong peaks at 1457, 1417, 1357, 1006, and 856 cm−1 and medium peaks at 2947, 1623, 948, and 541 cm−1.
The band positions, intensities, and baseline changes for each component noted above were summarized in the band graph shown in Figure 1. The band graph shows that glucose, lactate, and antibodies have numerous peaks in the 1500–400 cm−1 region, but they overlap each other. Since the band graph summarizes the signal position of each component, it was used to interpret the Raman spectra of the multicomponent mixture samples and culture media in the following the Results and Discussion section. A band graph showing peak positions, peak intensities, and baseline changes for the major constituents of the culture media and optical background.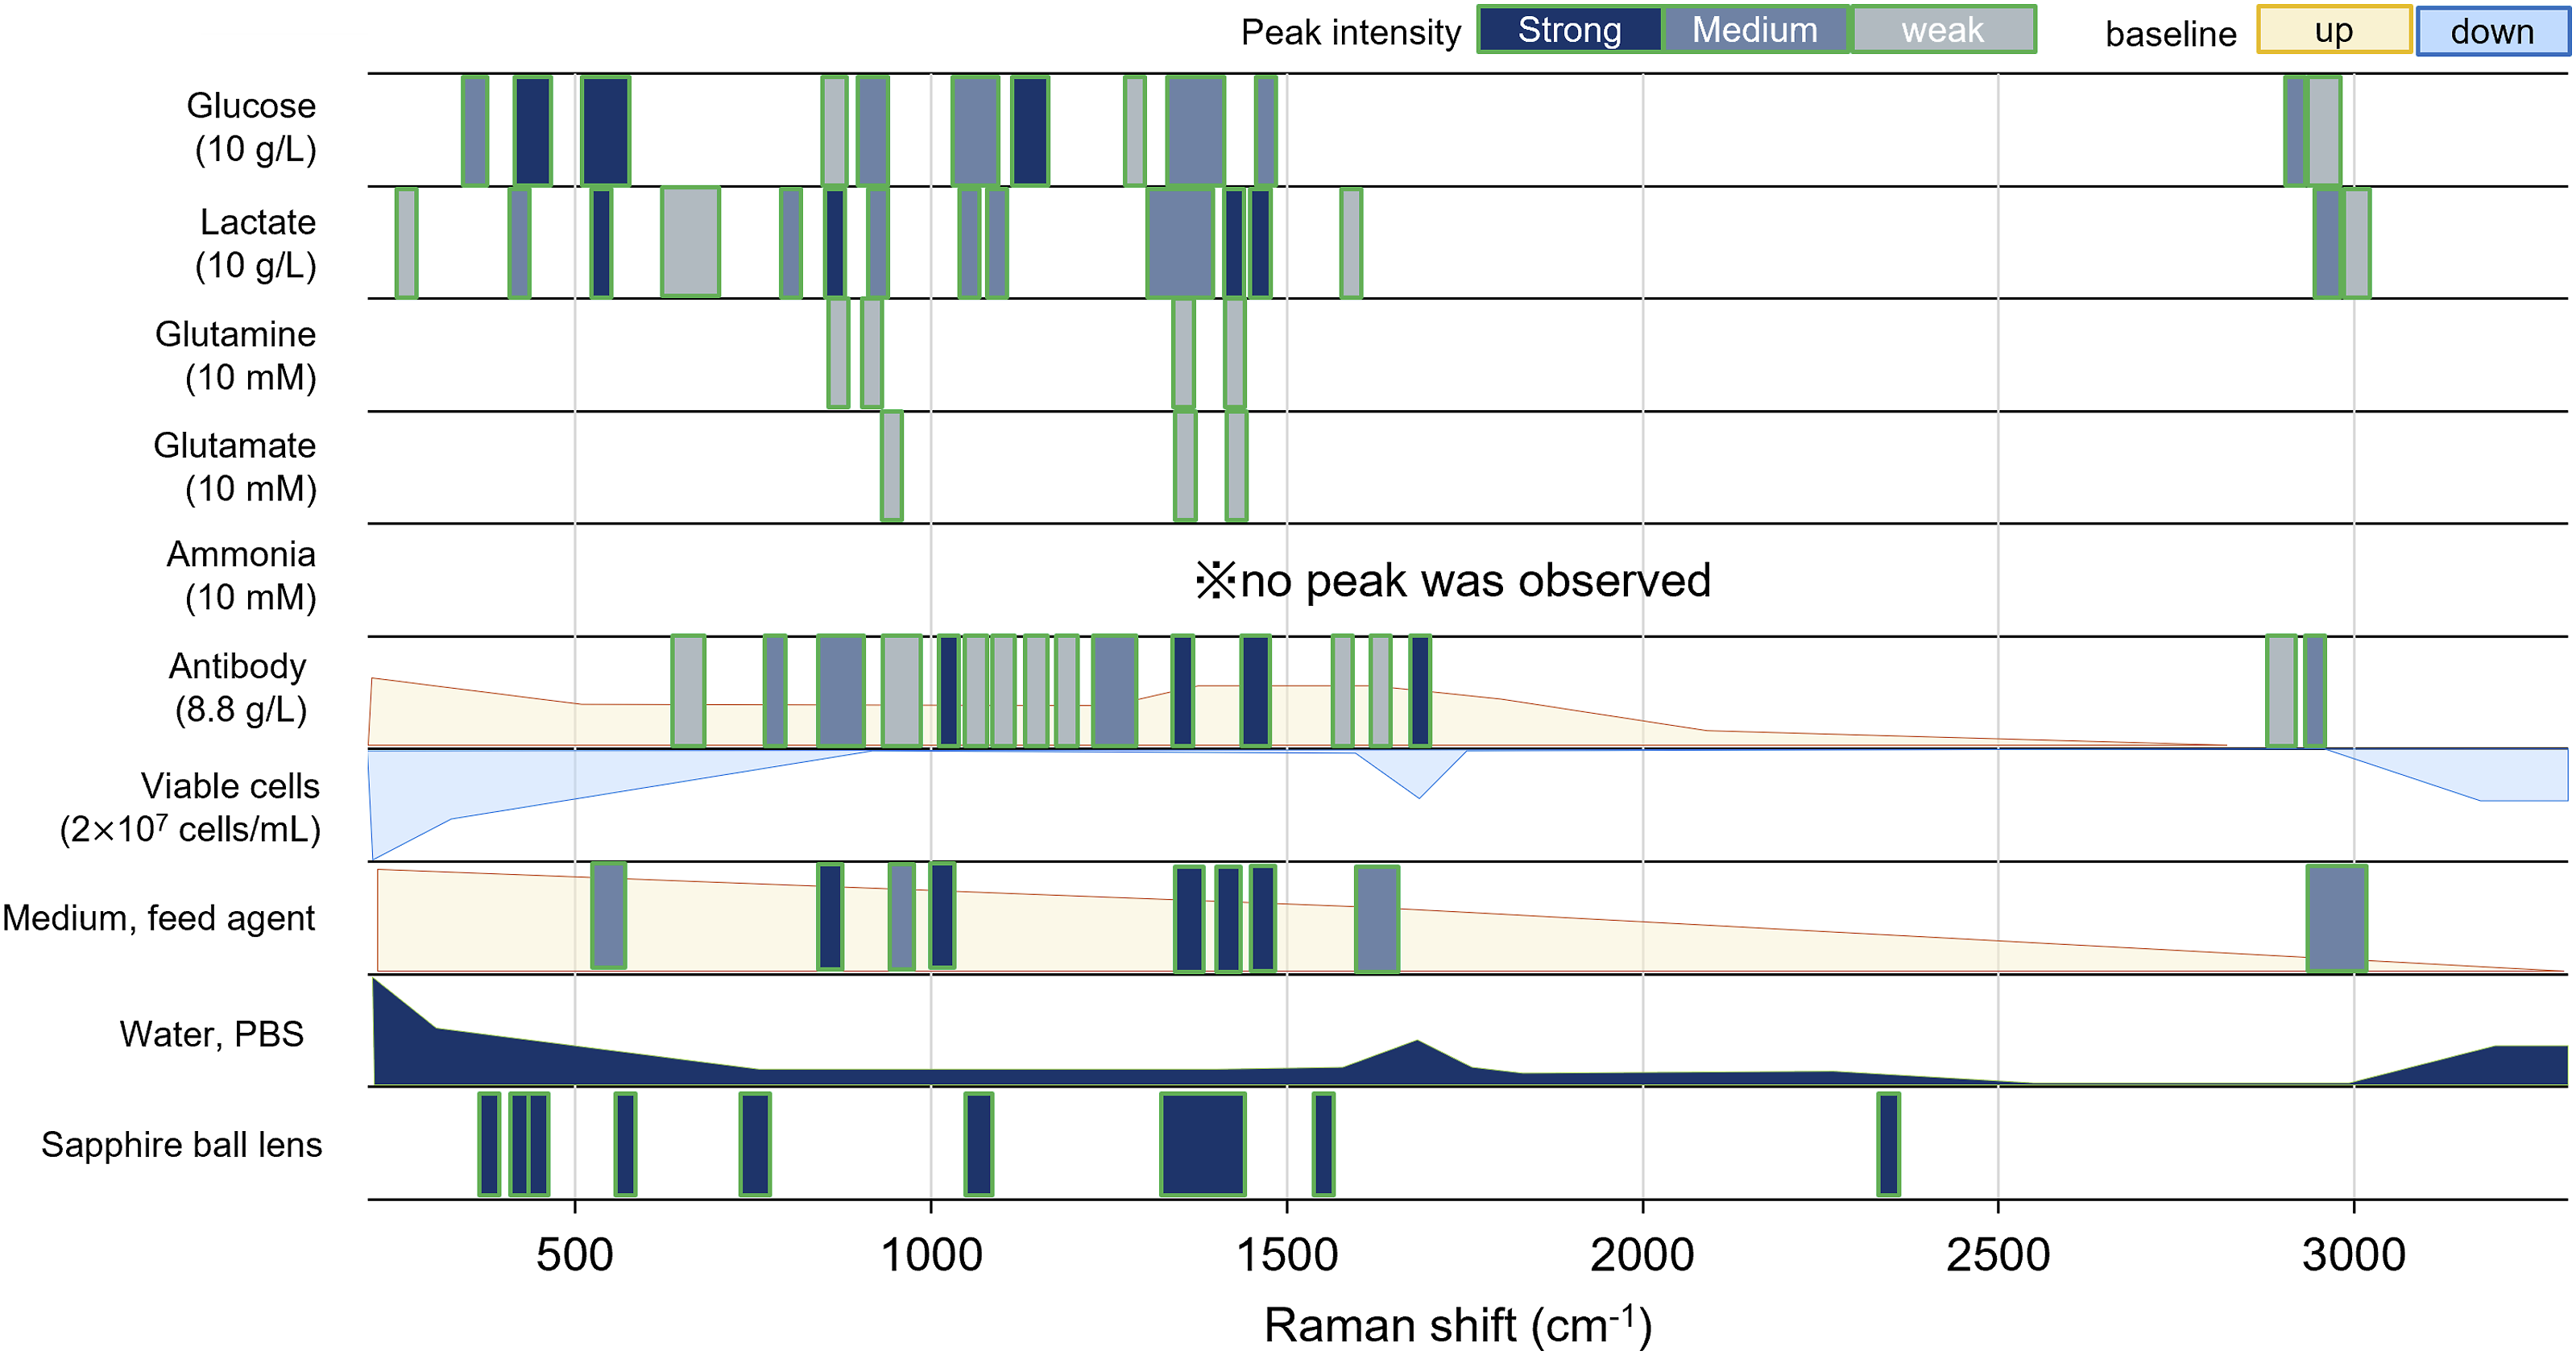
Calibration Model Development
Raman spectra of mixture samples based on DoE measured for calibration set preparation were shown in Figure 2a. The results of minimum RMSECV obtained by MWPLS or SRSNV with glucose, lactate, and antibody as objective variables were shown in Table II center and the results of wavenumber regions with the minimum RMSECV for each pretreatment condition were shown in Table S1 (Supplemental Material). The minimum RMSECV for each pretreatment condition was 0.16–1.01 g/L for glucose, 0.12–0.81 g/L for lactate, and 0.13–0.23 g/L for antibody. Comparing the RMSECV for each pretreatment condition, the RMSECV was smaller for pretreatment conditions 18 (normalization with water plus baseline correction), 19 (normalization with water plus first derivative), and 20 (normalization with water plus second derivative). This result suggested that normalization with the water peak plus baseline correction process was suitable for spectral pretreatment. (a) Raman spectra of the mixture samples prepared based on DoE and (b) Raman spectra measured in-line during the culture process.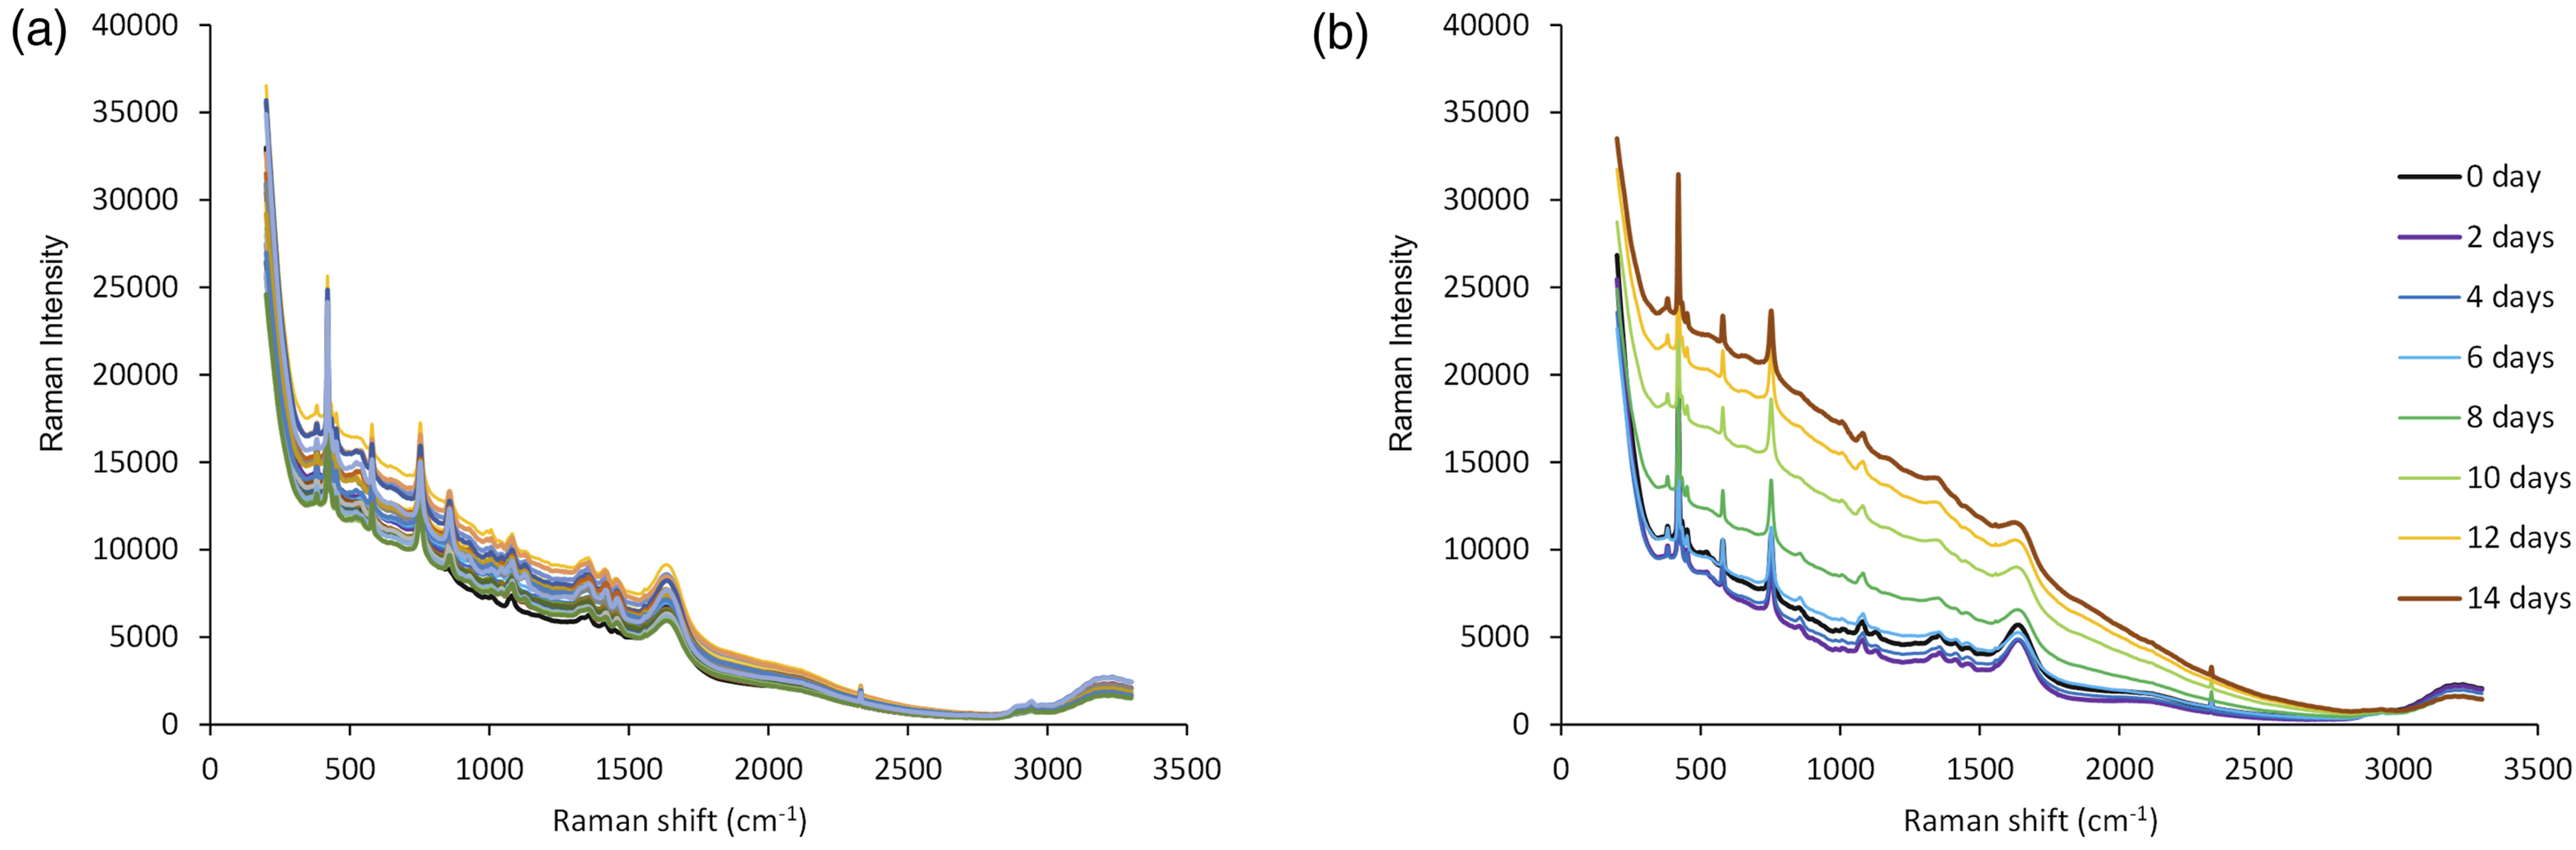
The error spectra calculated by MWPLS under the pretreatment conditions 18, 19, and 20 were shown in Figure 3. For the same objective component, the RMSECV was smaller in the same Raman spectra region regardless of the pretreatment conditions. The RMSECV was small in the 1200–1100 and 600–420 cm−1 regions for glucose, the 3100–2900 and 1000–800 cm−1 regions for lactate, and the 1700–1500 and 1300–1150 cm−1 regions for the antibody. These regions coincide with the regions where relatively strong peaks for each component appear in the band graph in Figure 1, suggesting that MWPLS was able to extract the regions of concentration correlation. Because the spectral regions selected by the error spectra also contained strong peaks other than those of the target component, the region to be used for the calibration model were determined by comparing the band graph and the pretreated spectra. Based on these results, the wavenumber regions of 1150–1100 and 470–560 cm−1 for glucose, those of 3000–2900 and 805–1000 cm−1 for lactate, and those of 1700–1500 and 1310–1150 cm−1 for the antibody were decided to be used for their calibration models. Error spectra calculated by MWPLS for each component (a) pretreatment condition 18, (b) pretreatment condition 19, and (c) pretreatment condition 20.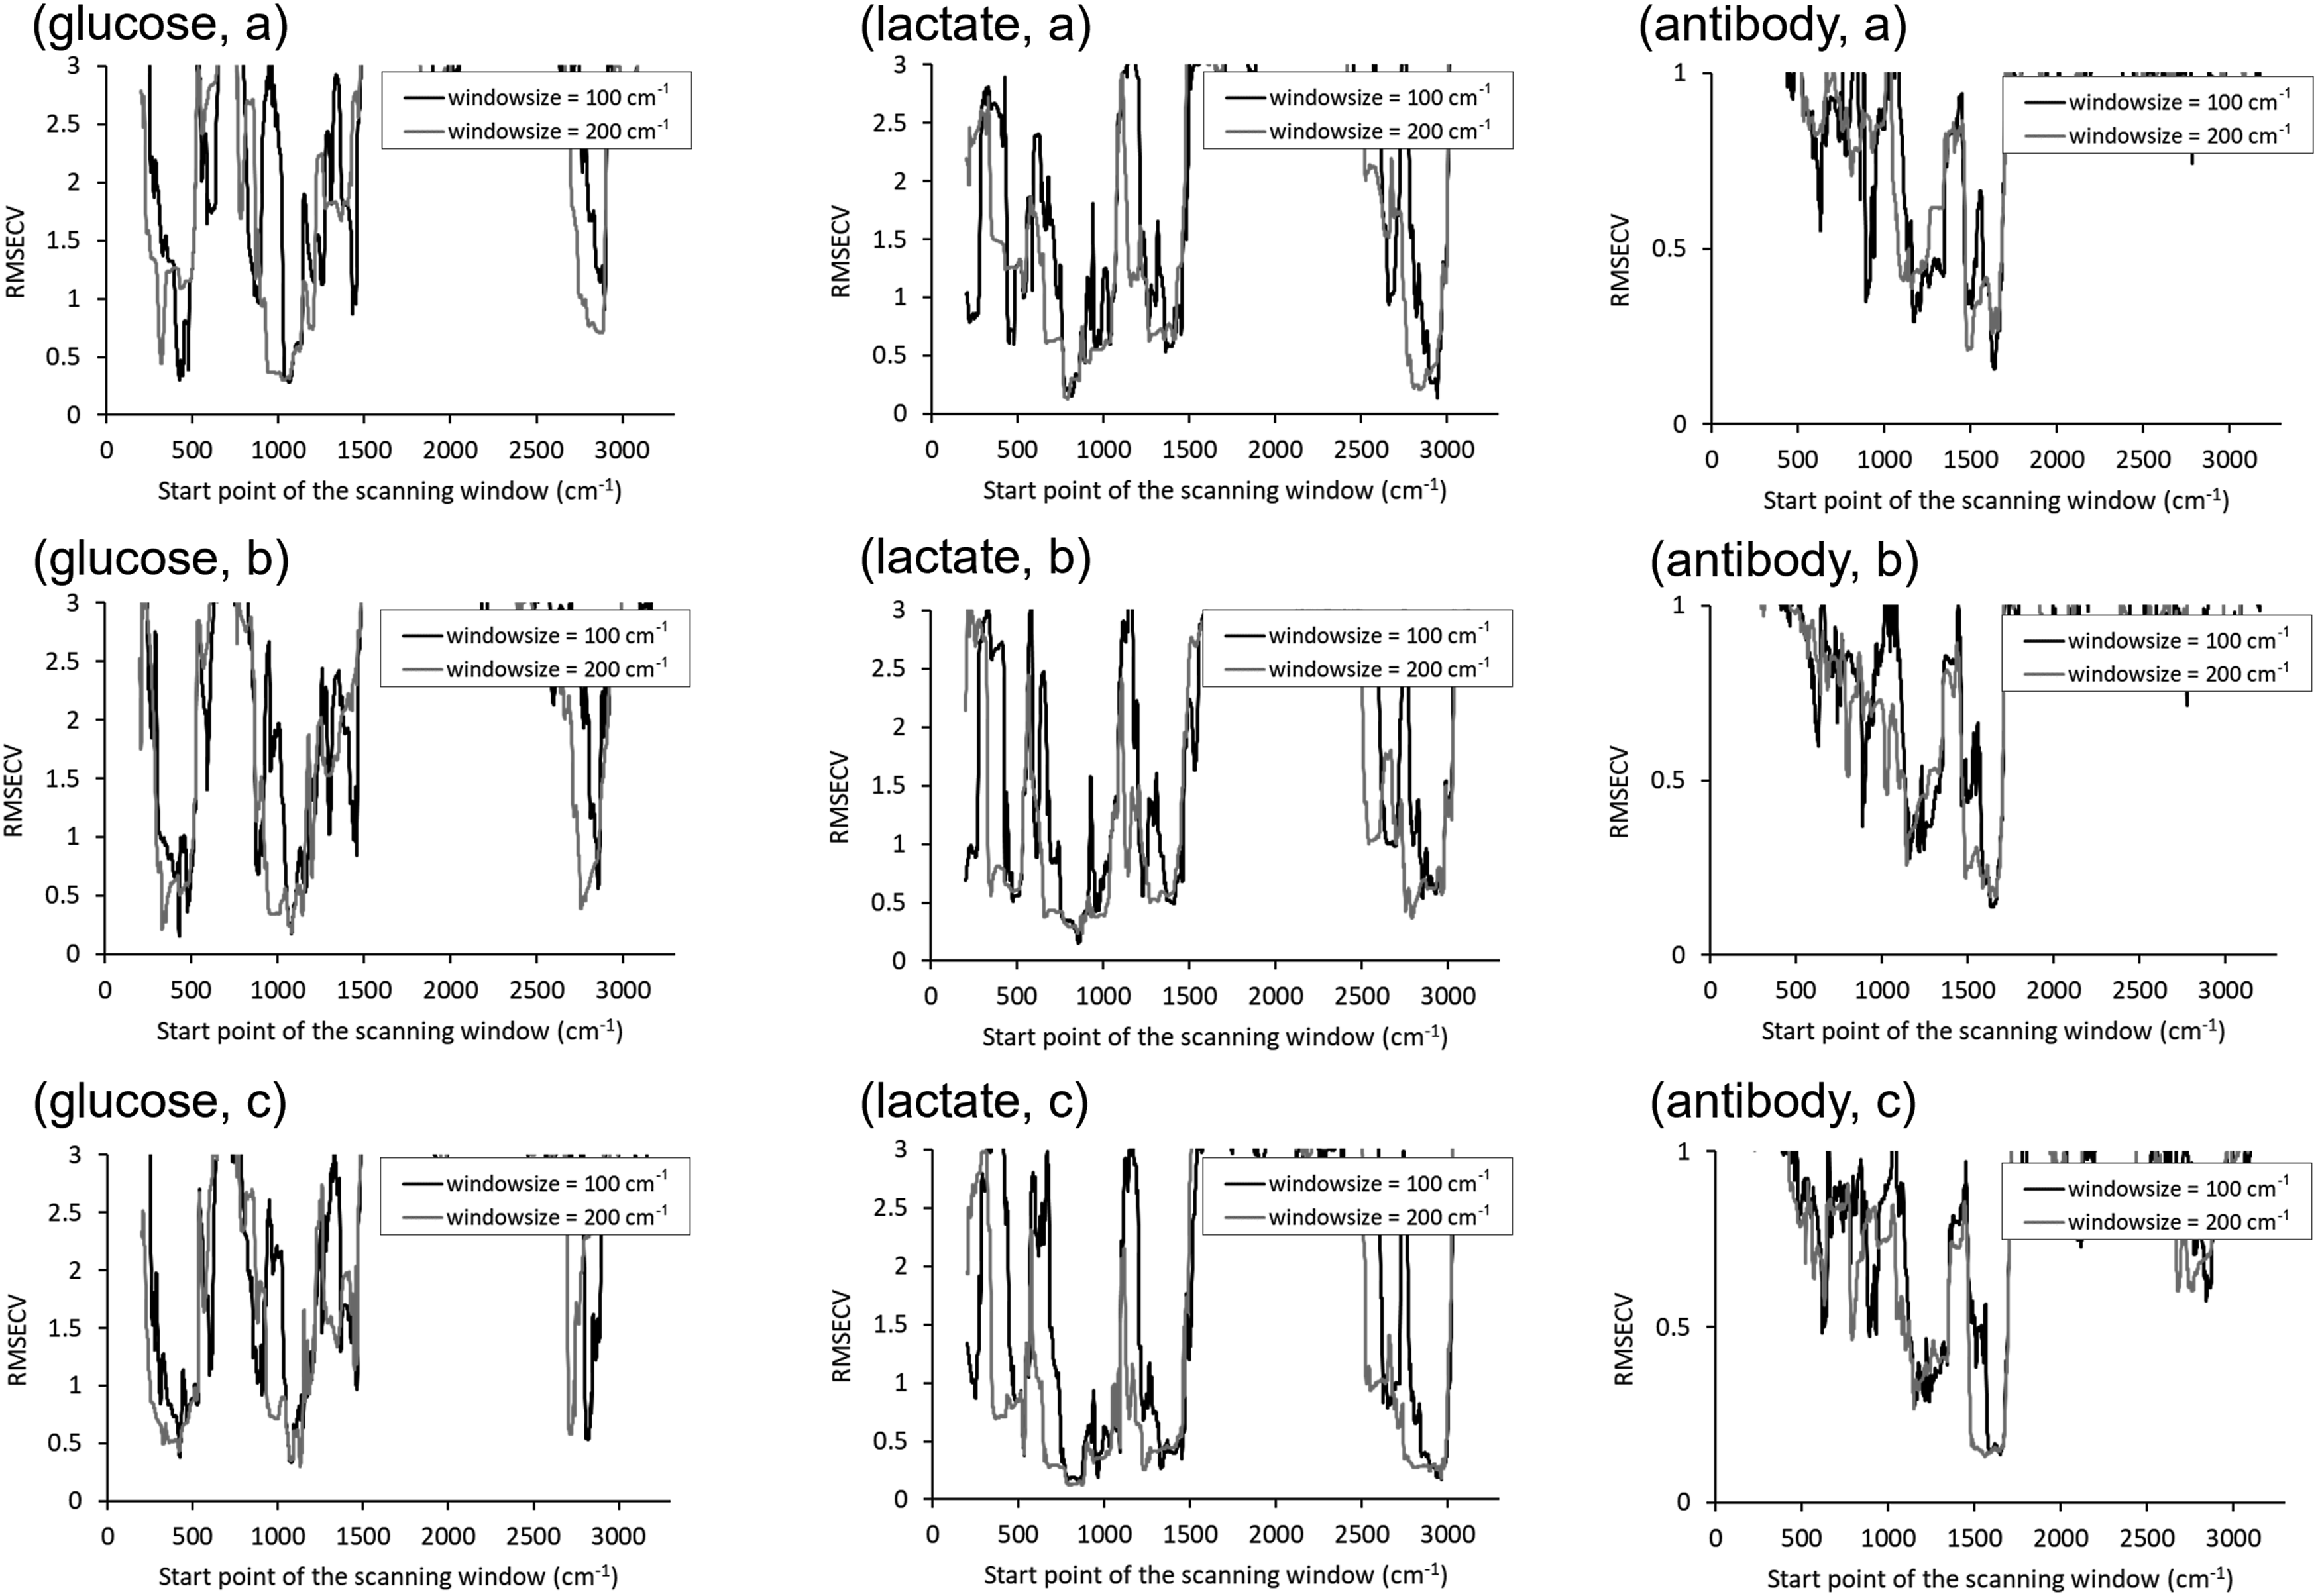
Calibration Model Evaluation by In-Line Raman Measurement of Cell Culture
Raman spectra of the culture process measured in-line for validation set preparation were shown in Figure 2b. In the spectra of the culture media, the baseline decreased for the first two days of fermentation, and then the baseline in the low wavenumber range increased as the fermentation progressed. There was no significant increase in baseline in the Raman spectra of pure components (Figures S1–S9 Supplemental Materials) and the mixture samples (Figure 2a).
The RMSEP values calculated by applying the calibration models developed to the validation sets were shown in Table II, right. For glucose and antibody, RMSEP was smallest at pretreatment condition 20 (normalization by water plus second derivative), 0.23, and 0.20 g/L, respectively. For lactate, it was smallest at pretreatment condition 18 (normalization by water plus baseline correction), 0.20 g/L. Lactate also showed good accuracy with RMSEP = 0.29 g/L even at pretreatment condition 20. These results indicate that the best pretreatment condition was normalization by water plus second derivative
The loading plot, component spectra, spectra of calibration set, and spectra of validation set for the pretreatment conditions that showed the lowest RMSEP for each objective component were shown in Figure 4. In the loading plot of glucose (Figure 4, glucose A), LV1 gives negative peaks at 1130, 540, 520, and 495 cm−1, and LV2 yields negative peaks at 520 and 497 cm−1 and a positive peak at 540 cm−1. The single component spectra (Figure 4, glucose C) showed that the peaks at 1130, 540, and 495 cm−1 were attributable to glucose, and the peak at 540 cm−1 to lactate and feed agent. In the regression coefficients, negative peaks were observed at 1130, 540, 520, and 495 cm−1 (Figure 4, glucose b). The position and width of these peaks were in very good agreement with the single component spectrum of glucose itself (Figure 4, glucose c). According to previous studies, these peaks could be assigned to δ(COH), δ(C-2–C-1–O-1) α, and δ(C-2–C-1–O-1) β of D-glucose in aqueous solution, respectively.
38
Calibration models for glucose, lactate, and antibodies developed ((a) loading plot of PLSR model, (b) regression coefficient of RLSR model, (c) Raman spectra of each component, bold line is objective component, (d) calibration spectra, and (e) validation spectra with each pretreatment set).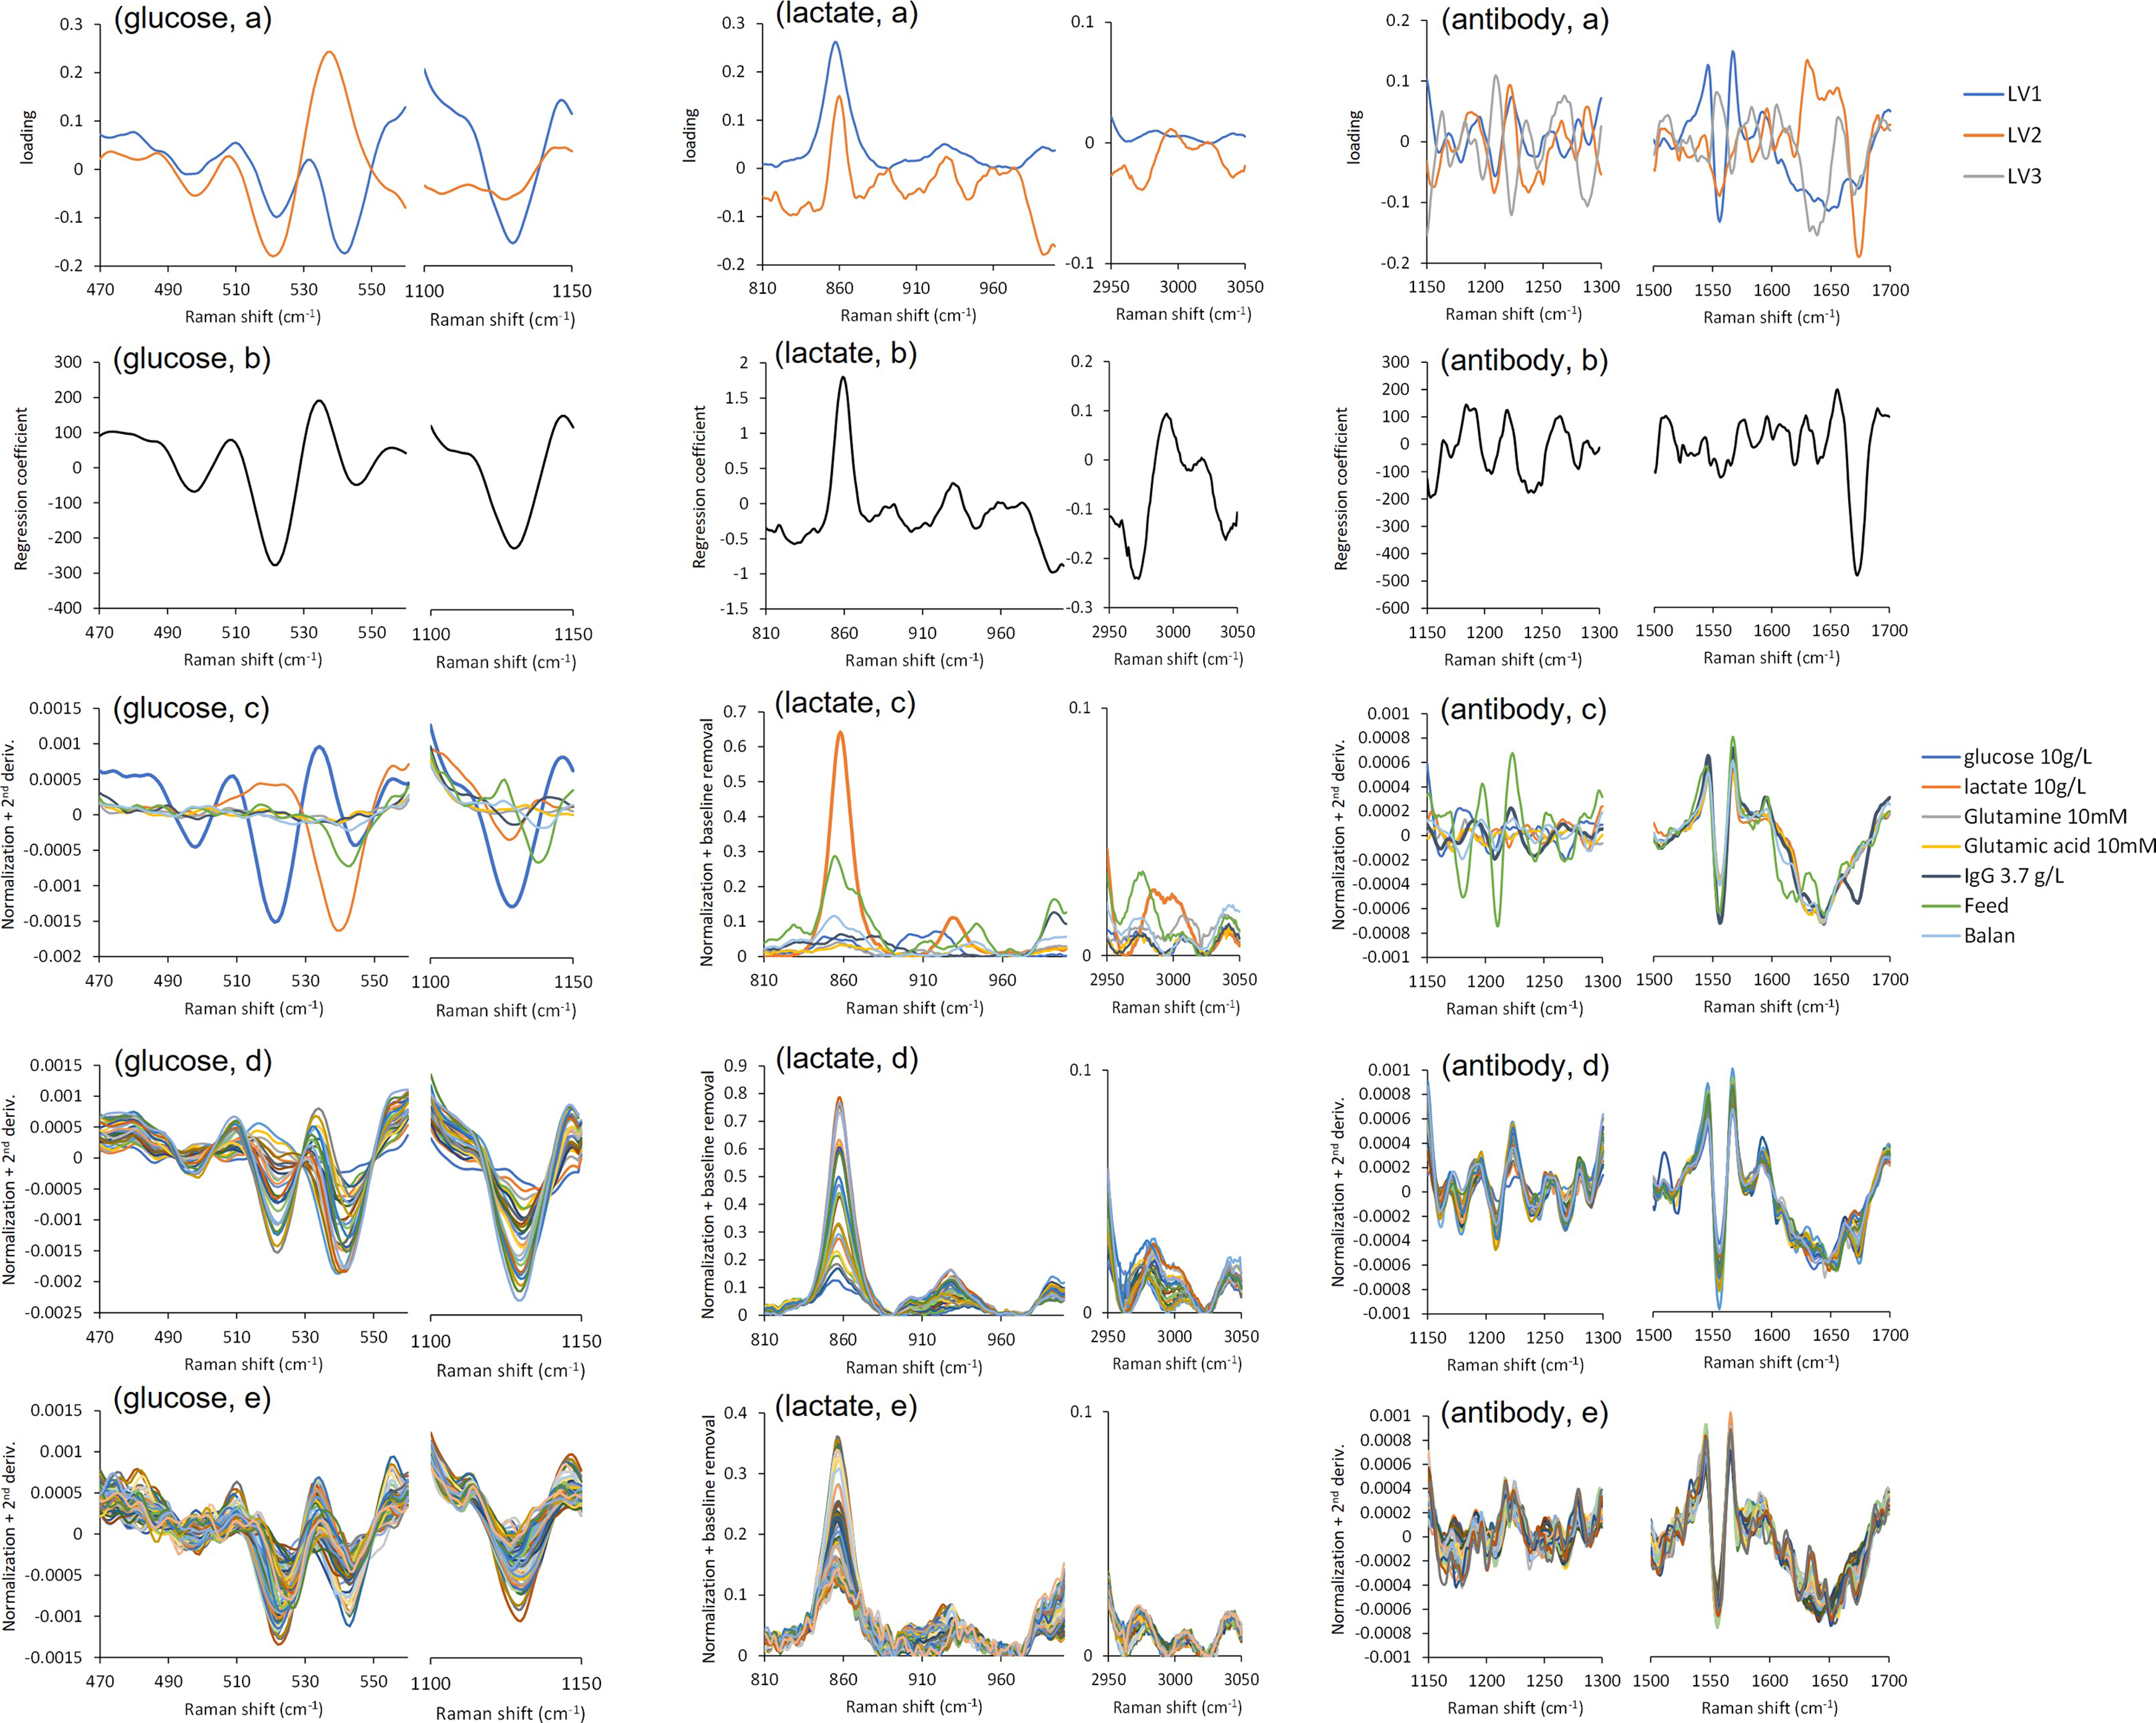
In the loading plots of lactate (Figure 4, lactate a), LV1 shows positive peaks at 2980, 930, and 860 cm−1, and LVs gives a positive peak at 860 cm−1 and negative peaks at 2970, 990, 950, and 900 cm−1. The single component spectra (Figure 4, lactate c) showed that the peaks at 2980, 930, and 860 cm−1 were attributable to lactate, while those at 2970, 990, 950, and 900 cm−1 were due to feed agent. Positive peaks at 2980, 930, and 860 cm−1 were observed in the regression coefficient (Figure 4, lactate b), and these peak positions and widths were consistent with the single component spectrum of lactate (Figure 4, lactate c). According to previous studies, these peaks could be assigned to νsCH3, rCH3, and νC–CO2– of lactate ion in aqueous solution, respectively. 39
In the loading plots of antibody (Figure 4, antibody a), LV1 shows negative peaks at 1650, 1550, and 1210 cm−1, LV2 yields negative peaks at 1680, 1240, 1210, and 1160 cm−1 and a positive peak at 1640 cm−1, and LV3 (gray) has positive peaks at 1270 and 1210 cm−1, and negative peaks at 1640 and 1290 cm−1. The single component spectra (Figure 4, antibody c) showed that the peaks at 1680 and 1240 cm−1 were due to the antibody, those at 1270, 1210, and 1180 cm−1 and the spectral patterns change in the 1650–1600 cm−1 region originated from the feed agent, and the 1550 cm−1 peak is ascribed to a background peak occurring in all samples. A large negative peak at 1550 cm−1 was observed in the regression coefficient (Figure 4, antibody b), which well reflected the specific peak in the antibody that was not present in the other components. According to previous studies, the peak could be attributed to tryptophan in the antibody. 42
The loading plots, regression coefficients and component spectra had similar spectral patterns to the spectra of calibration set and validation set, for each objective component (Figures 4d and 4e). These results indicate that the PLSR model developed was able to capture the peaks of the objective component and the peaks of the other components overlapping with it with a small number of latent variables.
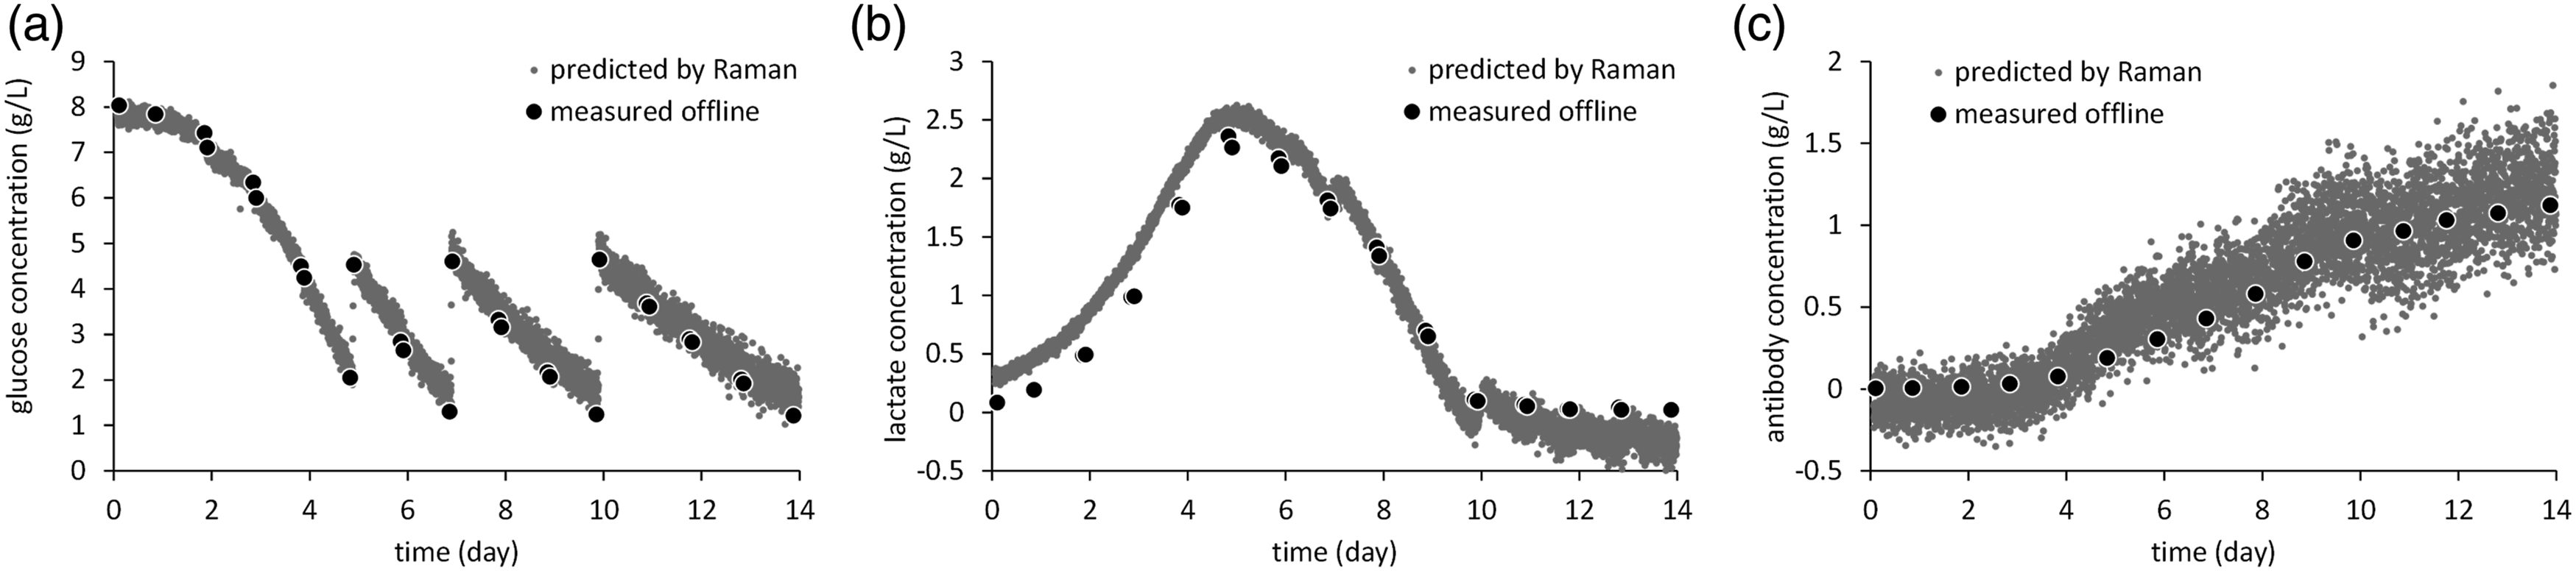
Finally, the results of reference versus prediction plots for the best model were shown in Figure 5 and those of cell culture monitoring using the above calibration models for (Figure 5a) glucose, (Figure 5b) lactate, and (Figure 5c) antibody are shown in Figure 6. For glucose, the decrease in glucose concentration over time and the increase in the concentration upon the addition of feed agent were accurately captured. For lactate, there was a discrepancy of about 0.1–0.3 g/L between the early and late stages of fermentation, but the trends of increase and decrease followed exactly. For antibody, although it appeared to be relatively noisy, it increases in the process of fermentation were able to be shown. These results indicate that even when only non-cultured off-line samples were used in the calibration set, metabolite monitoring that could be used for culture control was possible. Reference versus prediction plots for (a) glucose, (b) lactate, and (c) antibody in all three batches. PLSR model predictions for (a) glucose, (b) lactate, and (c) antibody in the first batch.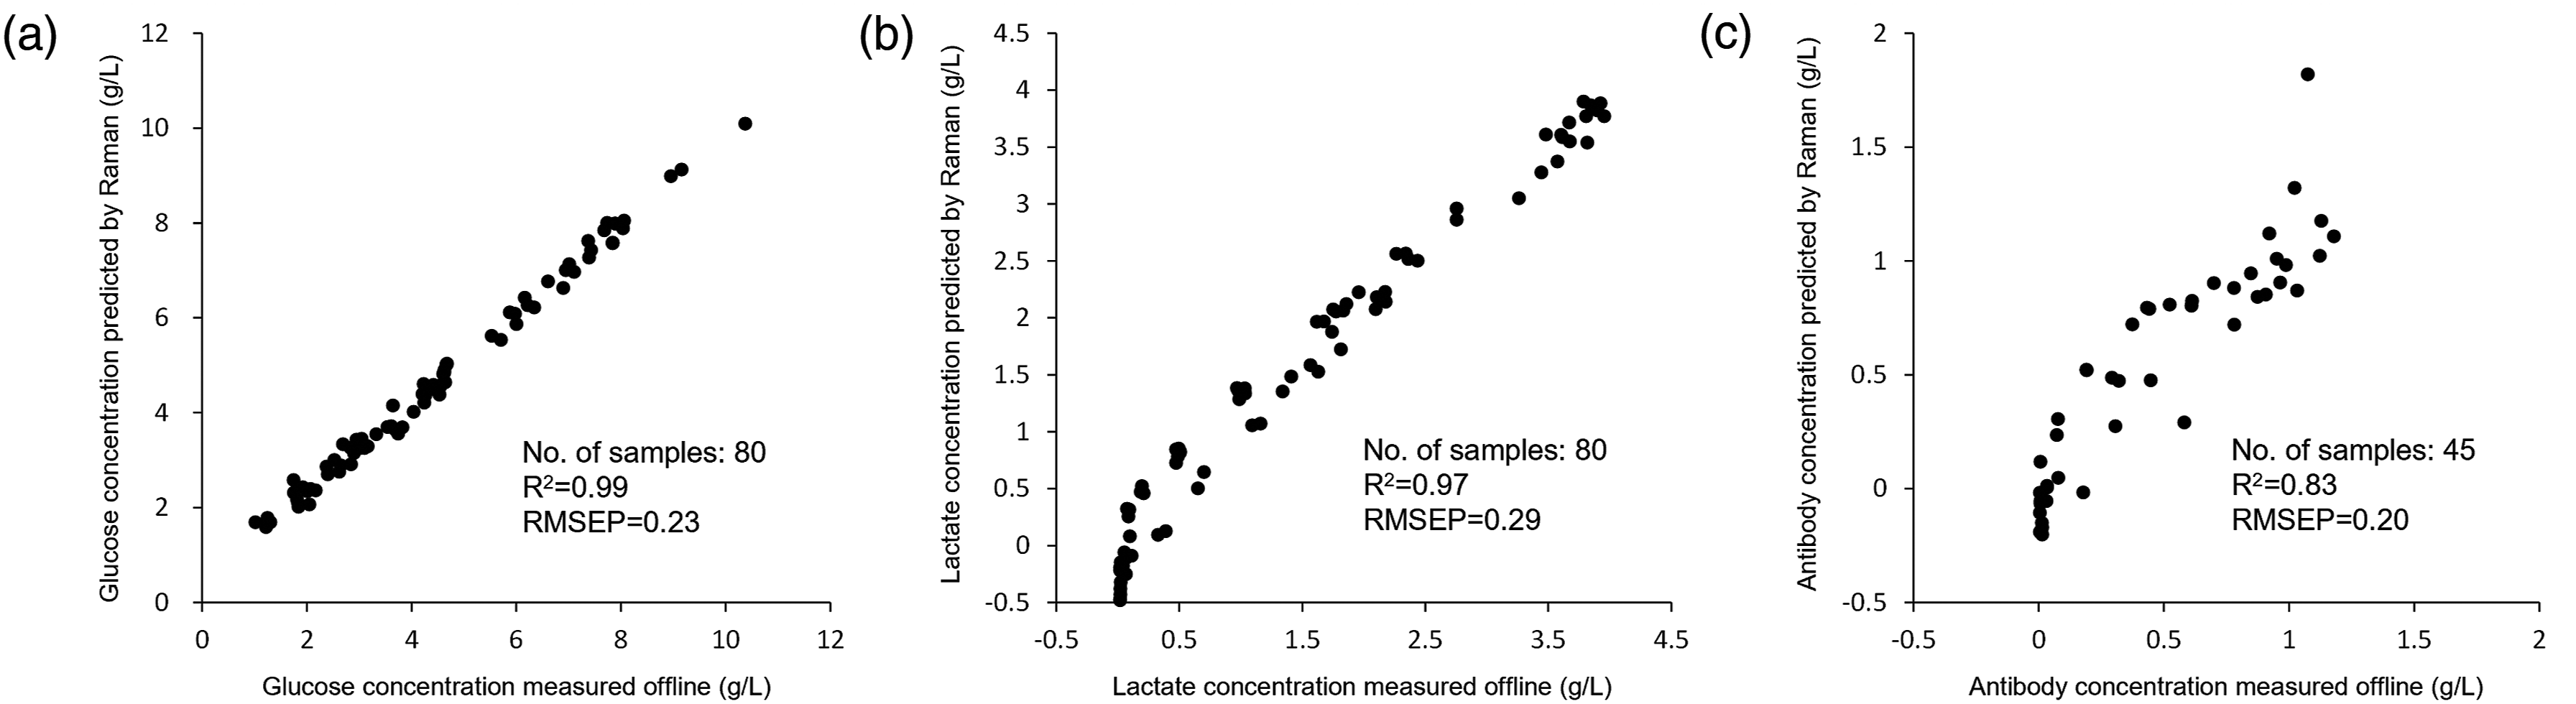
Use of Band Graph
Band graphs, like that in Figure 1, have been used from time to time for the purpose of band assignments. However, this may be the first time that they were used for developing calibration models. It was easy to discuss the origin of the spectral changes of each component in the cell culture because the peak positions and baseline changes derived from each component could be known from the band graph. Furthermore, the intensity and overlap of each peak can be known, and thus, the band graph can indicate the degree of difficulty of calibration of the objective component. For example, glucose, lactate, and antibodies have relatively strong peaks with little overlap with other components (Figure 1), and therefore, the calibration difficulty can be expected to be relatively below. On the other hand, glutamine and glutamate appear to be more difficult to develop calibration models because of the weak peaks of the components themselves and overlap with peaks of other components. This prediction, based on the band graph, was also consistent with the results of several prior papers. 19
Effects of Pretreatments
In this study, the combination of normalization by a water peak (3200 cm−1) and second derivative was shown to be the most suitable pretreatment method for Raman spectra to calibrate metabolite components in the culture media. The 3200 cm−1 peak used for the normalization is the peak top of the water band at which no peak occurs due to other components. A possible reason for the effectiveness of normalization by water could be the effect of turbidity. Figure 1 and Figure S7b show that the overall water band decreases with increasing VCD. This band change is unlikely to originate from the cell’s own Raman signal, but rather from turbidity of the culture media that increases with increasing cells and their corpses.43,44 The effect of turbidity should also extend to the peak intensity of components other than water. However, in the in-line Raman spectra in Figure 2b, the baseline in the low wavenumber region increased rather than attenuated. The reason is presumably because the increase in the baseline due to fluorescence cancels out the effect of turbidity. Therefore, the normalization at 3200 cm−1 may have had the effect of increasing the concentration response of the peak intensity of the objective component by correcting for the effect of turbidity.
The RMSECV showed sufficient accuracy for baseline correction, first derivative, and second derivative, but only second derivative showed sufficient accuracy for all objective components in RMSEP. This is because the second derivative was superior in reducing baseline fluctuations and separating peaks. The reason for the good accuracy in the baseline correction for lactate was thought to be that the peaks for lactate was relatively high in intensity and had little overlap.
The Reason Why Good Accuracy Was Achieved Without Using Culture Data
The in-line cultured spectra showed a baseline rise that did not appear in the artificially mixed samples as the fermentation progressed (Figure 2). There were three possible reasons for the good predictive results, even though the raw spectra of the two were different. First, suitable pretreatment method that could correct for baseline effects was performed; second, the calibration model captured the Raman peaks of each objective component; and third, the calibration set was based on a design of experiments and had no cross-correlation of each component.
Conversely, the weak point of this method is that only six components can be set in the L25 orthogonal array. To calibrate more components, it is necessary to prepare another set of samples or use higher-order orthogonal array. In addition, the applicability of this study to culture with different culture media has not yet been examined. This study will be a subject for future research.
Conclusion
In this study, a method to build Raman calibration models without culture data for cell culture monitoring was developed. First, Raman spectra of each cell culture component were measured, and the band positions, intensities, and baseline changes for each component were summarized in the band graph. Raman spectra of samples mixed with the above components according to the DoE were used for the calibration set. Twenty-four combinations of spectral pretreatment and wavenumber regions were compared using the MWPLS and SRSNV methods to determine the conditions for the calibration model. Finally, in-line Raman spectra of actual cell cultures were used for the validation set to evaluate the developed calibration models.
Normalization by a water peak at 3200 cm−1 and second derivative was chosen as the pretreatment conditions for glucose and antibody calibrations. On the other hand, normalization by the water and baseline correction was selected for the lactate calibration. The Raman spectral regions of 1150–1100 and 560–470 cm−1 for glucose, the 3000–2900 and 1000–805 cm−1 region for lactate, and the 1700–1500 and 1310–1150 cm−1 region for the antibody were decided to use for their calibration models. Using these pretreatment conditions and Raman spectral regions, the PLSR models demonstrated sufficiently good accuracy for the three components: glucose, lactate, and antibody (RMSEP = 0.23, 0.29, and 0.20 g/L, respectively).
There were three possible reasons for the good prediction results despite the models being developed with non-cultured samples. The selected pretreatments were able to correct for baseline changes, the calibration models captured the Raman peaks of each objective component, and the calibration samples were prepared based on DoE and there was no cross-correlation among the components.
This paper presented innovative results in developing a culture monitoring method without using culture data, while using a basic analytical chemistry method of identifying the peak positions of each component of the culture media and then using a DoE approach. This study will have important implications for studies attempting cell culture monitoring, as well as for subsequent studies attempting to develop low-cost calibration models for spectroscopic in-line measurements other than cell culture.
Supplemental Material
Supplemental Material - Development of Raman Calibration Model Without Culture Data for In-Line Analysis of Metabolites in Cell Culture Media
Supplemental Material for Development of Raman Calibration Model Without Culture Data for In-Line Analysis of Metabolites in Cell Culture Media by Risa Hara, Wataru Kobayashi, Hiroaki Yamanaka, Kodai Murayama, Soichiro Shimoda, and Yukihiro Ozaki in Applied Spectroscopy
Footnotes
Declaration of Conflicting Interests
The author(s) declared no potential conflicts of interest with respect to the research, authorship, and/or publication of this article.
Funding
The author(s) received no financial support for the research, authorship, and/or publication of this article.
Supplemental Material
All supplemental material mentioned in the text is available in the online version of the journal.
References
Supplementary Material
Please find the following supplemental material available below.
For Open Access articles published under a Creative Commons License, all supplemental material carries the same license as the article it is associated with.
For non-Open Access articles published, all supplemental material carries a non-exclusive license, and permission requests for re-use of supplemental material or any part of supplemental material shall be sent directly to the copyright owner as specified in the copyright notice associated with the article.