
Abstract
A versatile portable tunable diode laser based measurement system for measuring elevated concentrations of hydrogen cyanide (HCN) in a time-resolved manner is developed for application in the fire environment. The direct absorption tunable diode laser spectroscopy (DA-TDLAS) technique is employed using the R11 absorption line centered at 3345.3 cm−1 (2989.27 nm) in the fundamental C–H stretching band (ν1) of the HCN absorption spectrum. The measurement system is validated using calibration gas of known HCN concentration and the relative uncertainty in measurement of HCN concentration is 4.1% at 1500 ppm. HCN concentration is measured with a sampling frequency of 1 Hz, in gas sampled from 1.5 m, 0.9 m, and 0.3 m heights in the Fireground Exposure Simulator (FES) prop at the University of Illinois Fire Service Institute, Champaign, Illinois. The immediately dangerous to life and health (IDLH) concentration of 50 parts per million (ppm) is exceeded at all the three sampling heights. A maximum concentration of 295 ppm is measured at the 1.5 m height. The HCN measurement system, expanded to measure HCN simultaneously from two sampling locations, is then deployed in two full-scale experiments designed to simulate a realistic residential fire environment at the Delaware County Emergency Services Training Center, Sharon Hill, Pennsylvania.
This is a visual representation of the abstract.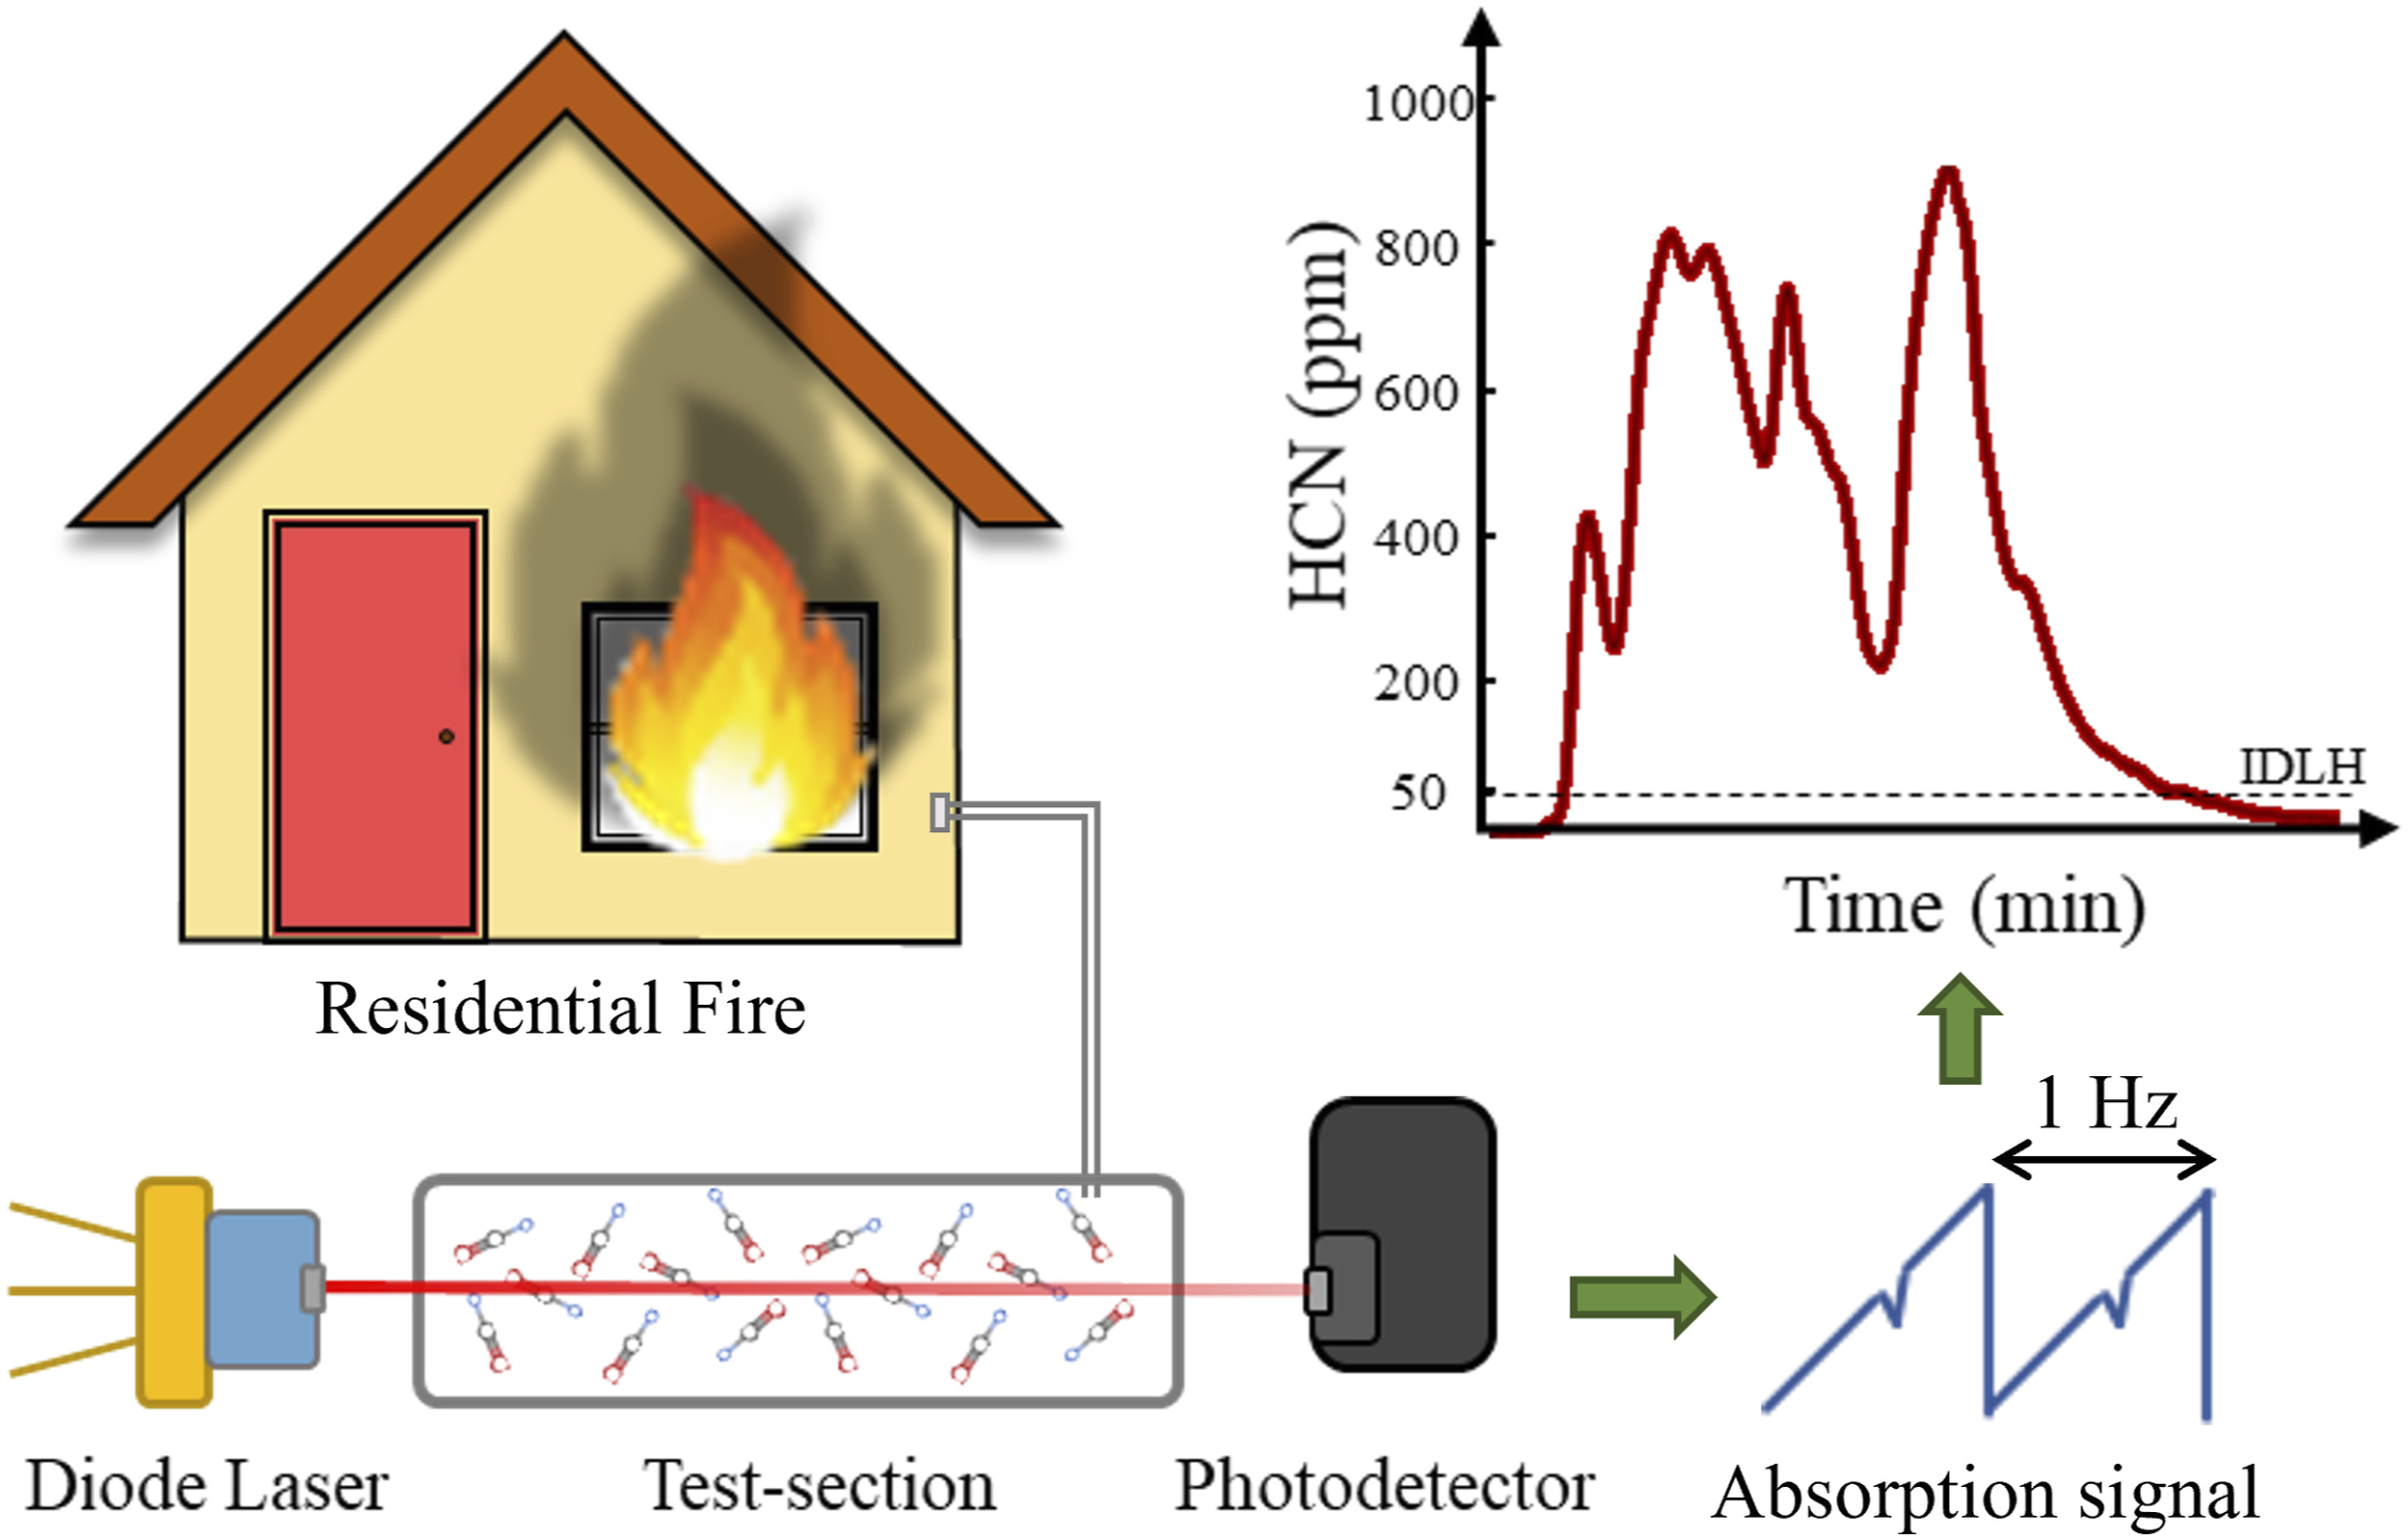
Keywords
Introduction
Over the past half century, the residential environment has evolved to include configurations with larger open spaces, lightweight construction materials, and synthetic home furnishings that are made of complex organic compounds. As a result, residential fires transition to flashover 1 more rapidly and produce more dangerous products of combustion under vent-limited conditions compared to 50 years ago. 1 The primary acute risks to potential trapped occupants and firefighters in a residential fire environment include high temperature, low visibility, oxygen deprivation, and exposure to toxic substances such as carbon dioxide (CO2), carbon monoxide (CO), and hydrogen cyanide (HCN).
According to the National Fire Protection Association (NFPA), 2 75% of civilian fire deaths and 72% of civilian fire injuries reported in 2015–2019 were caused by home structure fires. For residential fires in 2017–2019, smoke inhalation accounted for 56% of the reported fire injuries where primary symptoms were specified, of which only 14% were in combination with thermal burns. 3 For the same time period, 84% of residential fire fatalities with reported primary symptoms involved smoke inhalation. 49% of these were reported to be due to a combination of thermal burns and smoke inhalation. 4 In addition to oxygen deprivation, exposure to residential fire smoke containing toxic gases, particularly CO and HCN can result in loss of consciousness and inability to exit the structure, further endangering the life of a potential trapped occupant. 5
The recommended airborne exposure limit (REL) not to be exceeded for HCN at any time without the use of respiratory protection is 4.7 parts per million (ppm) according to the National Institute for Occupational Safety and Health (NIOSH). 6 NIOSH defines an immediately dangerous to life or health (IDLH) condition as one that poses a threat of exposure to airborne contaminants when that exposure is likely to cause death, or immediate or delayed permanent adverse health effects, or prevent escape from such an environment. 7 The IDLH limit represents the concentration of a substance in air above which accidental exposure (in case of events such as respirator failure) may cause permanent or escape-impairing health effects in healthy adults. For hydrogen cyanide, the IDLH limit is set at 50 ppm. 6
Studies evaluating smoke toxicity and fire gas composition in compartment fires8–11 have provided insight into the effects of smoke exposure on potential trapped occupants. The concentrations of combustion gases such as carbon dioxide and carbon monoxide along with the reductions in atmospheric oxygen concentration are most commonly measured as these make up the majority of the gases of acute concern in the residential fire environment.12,13 The concentrations of asphyxiant gases CO and HCN, often regarded as the most potent gaseous toxicants in residential fire smoke, have also been closely examined.10,14‐16
In fire environments, HCN concentration has been primarily measured through chemical methods such as ISO701 and NIOSH method 6010, chromatography methods such as NIOSH method 6017,17,18 and electrochemical methods such as NIOSH 7904. 19 The samples are usually collected over a series of discrete time intervals throughout an experiment in specially prepared sampling containers and sent to an off-site laboratory for analysis. The turnaround time for these samples, from collection to the report, could be anywhere from a few hours to several days. Moreover, the above stated standard methods have a working range of up to a few hundred parts per million and the concentration values reported are an average over the sampling time interval which range from a few seconds to a few hundred seconds. Spectroscopic methods such as Fourier transform infrared (FT-IR) Spectroscopy have also been used for measuring HCN in live-fire experiments.20‐22 These time-resolved measurements have a sampling interval of 5–10 seconds, which may not be able to capture sharp changes in HCN concentration. The ultra-fast FT-IR systems in the market today are either very expensive or compromise the spectral resolution or range or both. Recently, commercially available multigas detectors have been used to measure HCN concentration in a firefighter exposure study. 23 The detectors have electrochemical sensors for HCN with an upper measurement limit of 50 ppm. In a typical full-scale residential fire experiment, depending on the fuel load and the measurement location, HCN concentration exceeding 50 ppm could be detected minutes after ignition.
Various infrared spectroscopy techniques have been applied to measure HCN concentration in the combustion environment in recent years. These measurement methods utilize HCN absorption lines in the near infrared region of the electromagnetic spectrum.24‐27 With the increased availability of tunable diode lasers in the mid-infrared (mid-IR) region, it has become possible to utilize the much stronger fundamental vibration bands of HCN in the mid-IR region. Absorption lines from the fundamental C–H stretching band have been used to quantify HCN using various mid-IR spectroscopy techniques such as mid-IR polarization spectroscopy in atmospheric pressure flames 28 and mid-IR degenerate four-wave mixing in gasified biomass pellets. 29
The purpose of this paper is to describe the development and demonstrate the applicability of a mid-IR tunable diode laser absorption spectroscopy (TDLAS) based portable HCN measurement system, designed to quantify elevated HCN concentrations typical to a residential fire environment.
Measurement System
The direct absorption TDLAS technique that measures line-of-sight averaged concentration of a gas phase species, provides a continuous quantitative measurement based on the amount of light absorbed by the gas species at a particular wavelength.
Line Selection
A suitable absorption feature, having sufficient line intensity in the expected temperature and pressure range and minimal interference from the spectra of other species expected to be found in the absorption environment, must be selected from absorption spectrum of the HCN.
Hydrogen cyanide is a linear triatomic molecule with the central carbon atom triple bonded to a nitrogen atom on one side and a hydrogen atom on the other side. The charge asymmetry about the carbon atom results in the HCN molecule having a permanent electric dipole moment which results in HCN’s absorption spectrum in the mid-infrared region, shown in Fig. 1. HCN has four fundamental vibrational bands: The C–H stretching band, ν1, centered at 3312 cm−1,
30
the bending band, ν2, centered at 712 cm−1, and the C≡N stretching band, ν3, centered at 2089 cm−1. The relatively high line strength of the lines in the fundamental C–H stretching band, centered at 3312 cm−1, make good candidates for direct absorption TDLAS measurements. Mid-IR absorption spectrum of hydrogen cyanide (HCN) indicating ν1, ν2, 2ν2, and ν3 (very weak) vibrational bands. The inset shows the ν1 band with the selected line highlighted in red.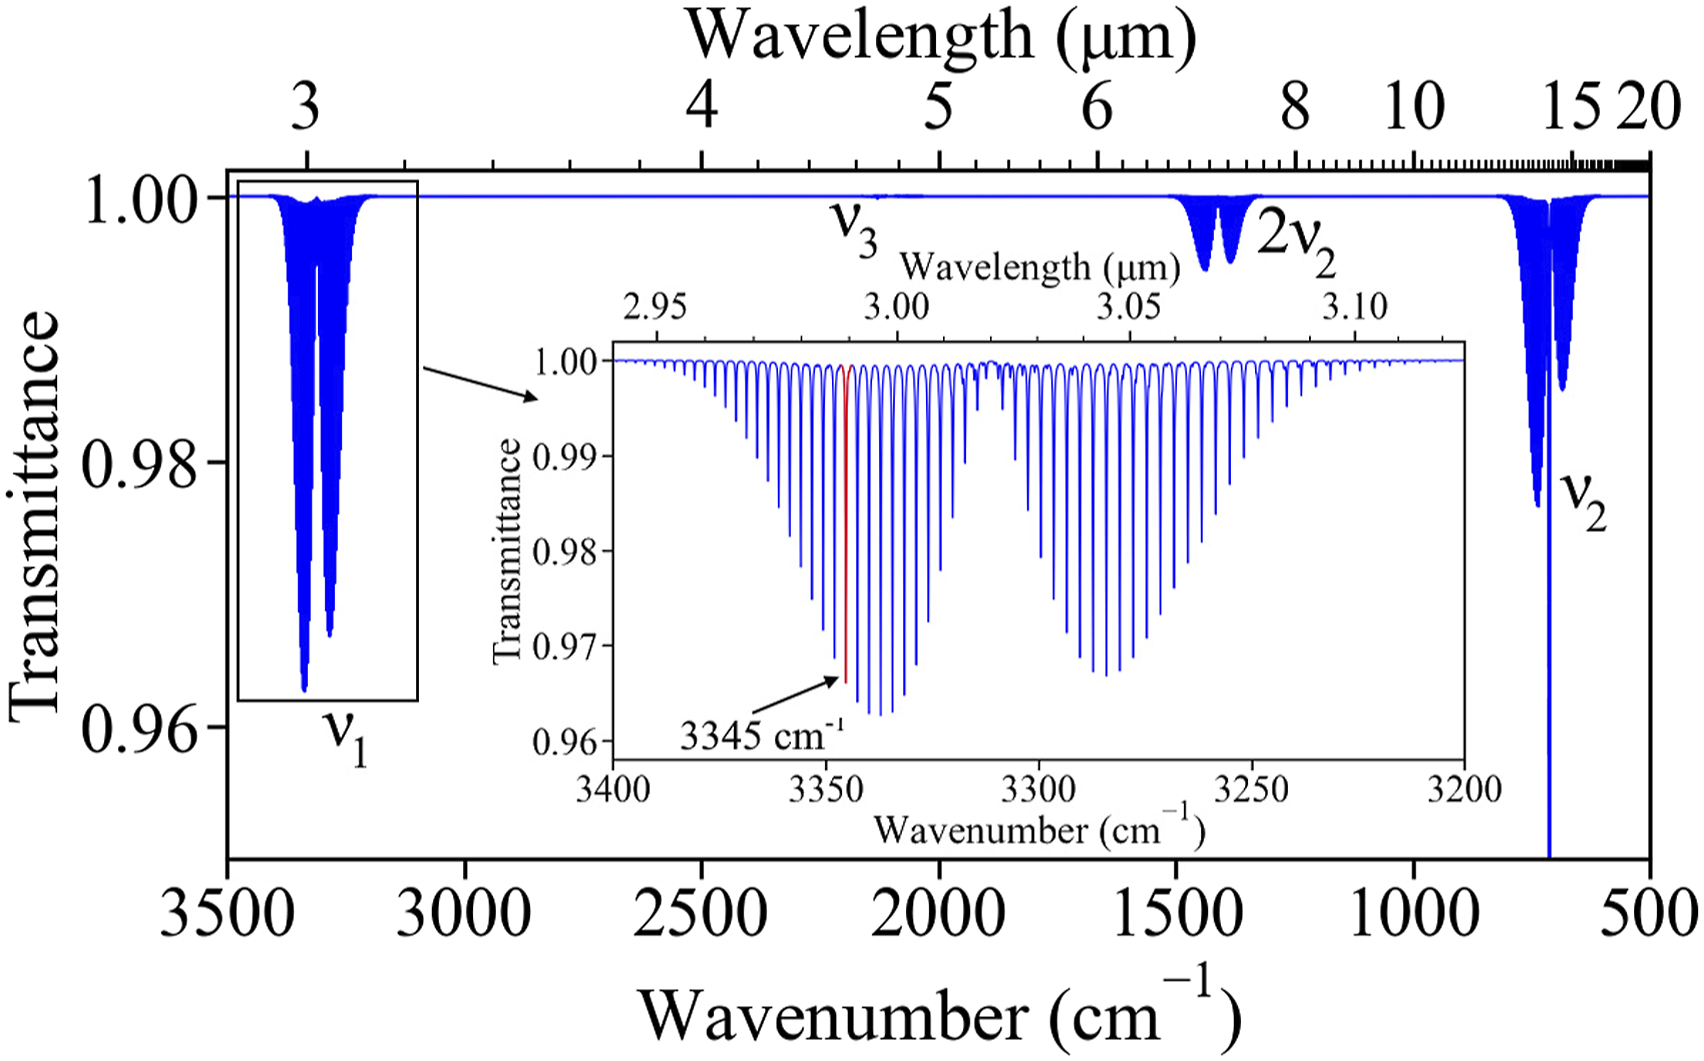
The absorption lines in the ν1 band with highest line intensity, shown in Fig. 2, are examined in further detail. The spectra of all the species listed in the high-resolution transmission molecular absorption database, HITRAN
31
are plotted between 3330 cm−1 and 3350 cm−1. Some species present in significant quantities in a typical fire environment, such as water vapor (H2O), ammonia (NH3), and acetylene (C2H2), are found to have absorption lines that overlap with the ν1 band of HCN. As it is desirable to avoid selecting HCN lines that have interference from the absorption spectra of these species, the R11 absorption line in the fundamental C–H stretching band centered at 3345.3 cm−1 (2989.27 nm) is chosen. Other species present in the fire environment such as carbon dioxide (CO2), carbon monoxide (CO), oxygen (O2), and nitrogen (N2), do not absorb in the vicinity of the selected HCN absorption line. Absorption spectra of water vapor, ammonia, and acetylene near the selected line (highlighted in red).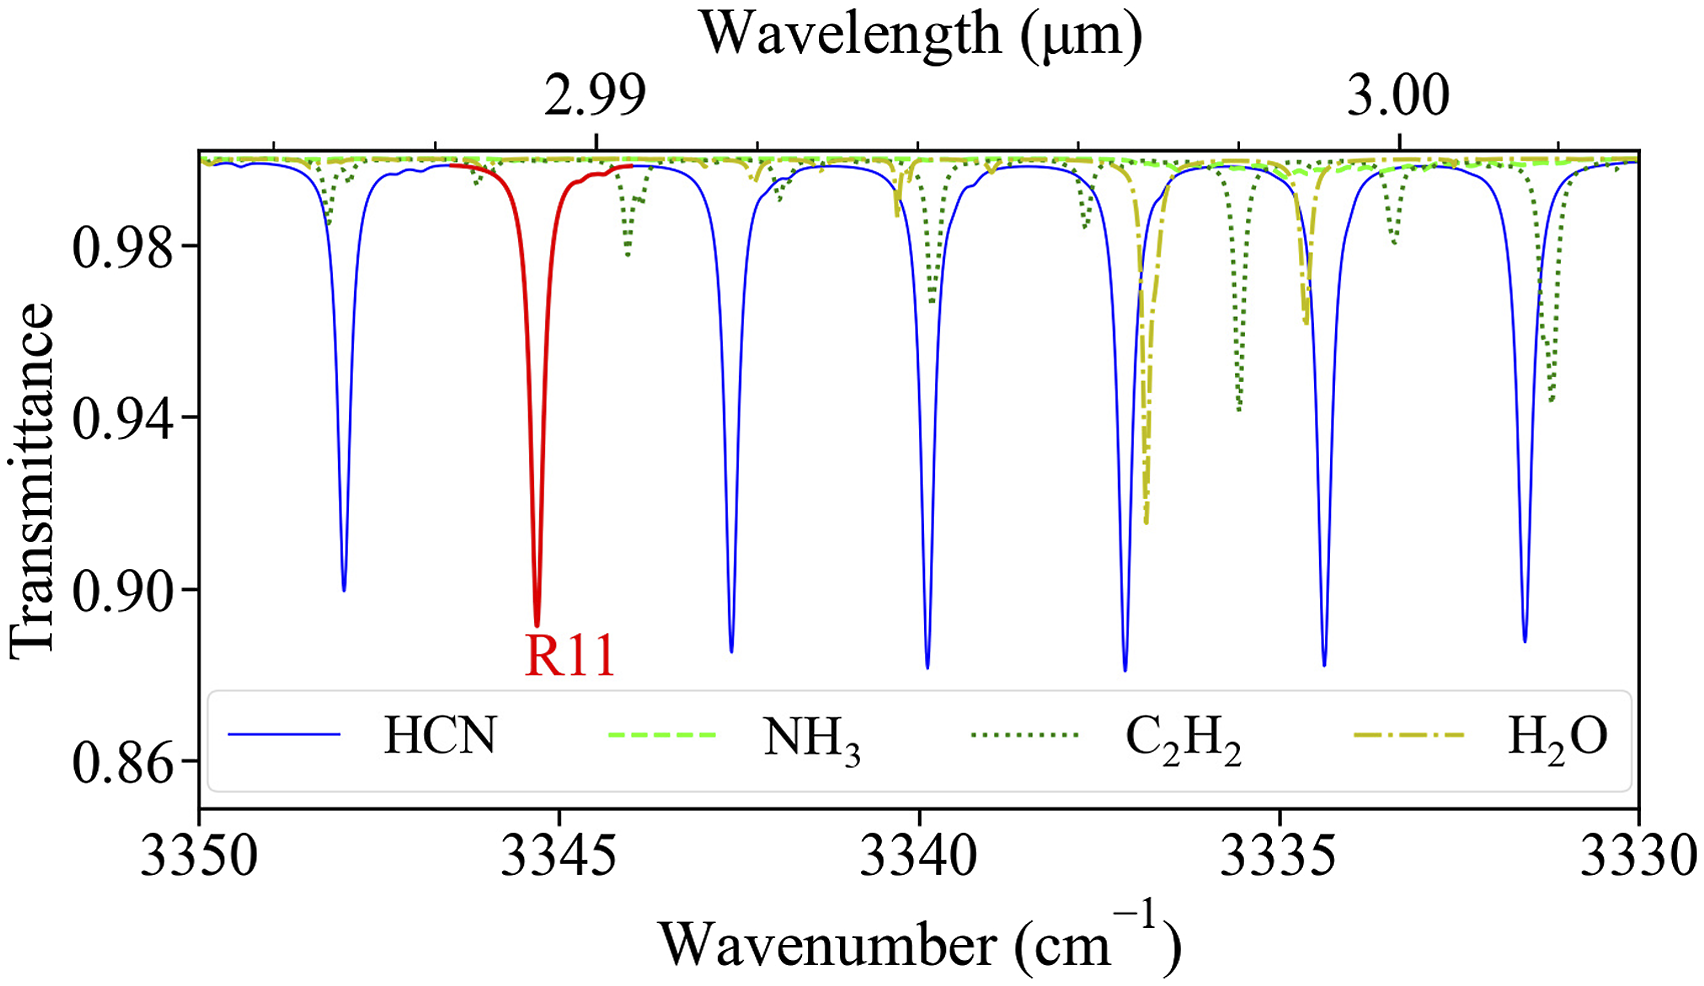
Tunable Diode Laser Absorption Spectroscopy
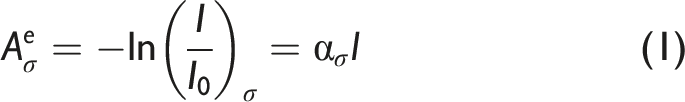
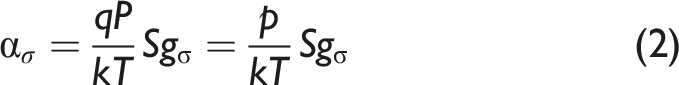
For a homogeneous medium of optical path length, l, described by total pressure, P, and temperature, T, assuming negligible losses due to light scattering, the Napierian absorbance, Aeσ is given by
System Design
A custom wavelength distributed feedback diode laser (Nanoplus America Inc., DFB-260300 series) with 2.4 mW optical power centered at 2989.2 nm (3345.37 cm−1) is used as the source. It is scanned in wavelength using a sawtooth modulation of the bias current by a laser controller (Arroyo Instruments, 6305) with an inbuilt temperature controller. The laser’s temperature is maintained by a thermoelectric cooler (TEC) integrated in the laser’s heat sink. The laser beam is passed through a custom-made cylindrical (38 mm diameter, 500 mm length) test-section (Pfeiffer Vacuum) fitted with anti-reflective (AR) coated sapphire windows (Thorlabs, WG31050-E1). A switchable gain mercury-Cadmium-tunable diode laser spectroscopy telluride (MCT) amplified photodetector (Thorlabs, PDAVJ5) is used to record the intensity of the beam transmitted after absorption as shown in Fig. 3. The gas temperature and pressure are measured at the inlet of the test-section using a K-type thermocouple (Omega, KQIN-14E-6) with a response time of 0.9 seconds, and a pressure transducer (Omega, PX309-030A5V) with a response time less than 1 ms, respectively. The gases sampled from the measurement location inside the experiment structure are filtered through a 2 μm coarse HEPA filter (Solberg, FS-10–050) and a 0.01 μm fine filter (Perma Pure, FF-250-SG-2.5G) to remove soot and other particulates before being introduced into the test-section. A diaphragm pump (KNF, UN022AVP) is used to maintain a steady flow through the system. The schematic of the constituent components of the HCN measurement system used in the fire environment. (TC: thermocouple, PT: pressure transducer, TS: test-section, PD: photodetector).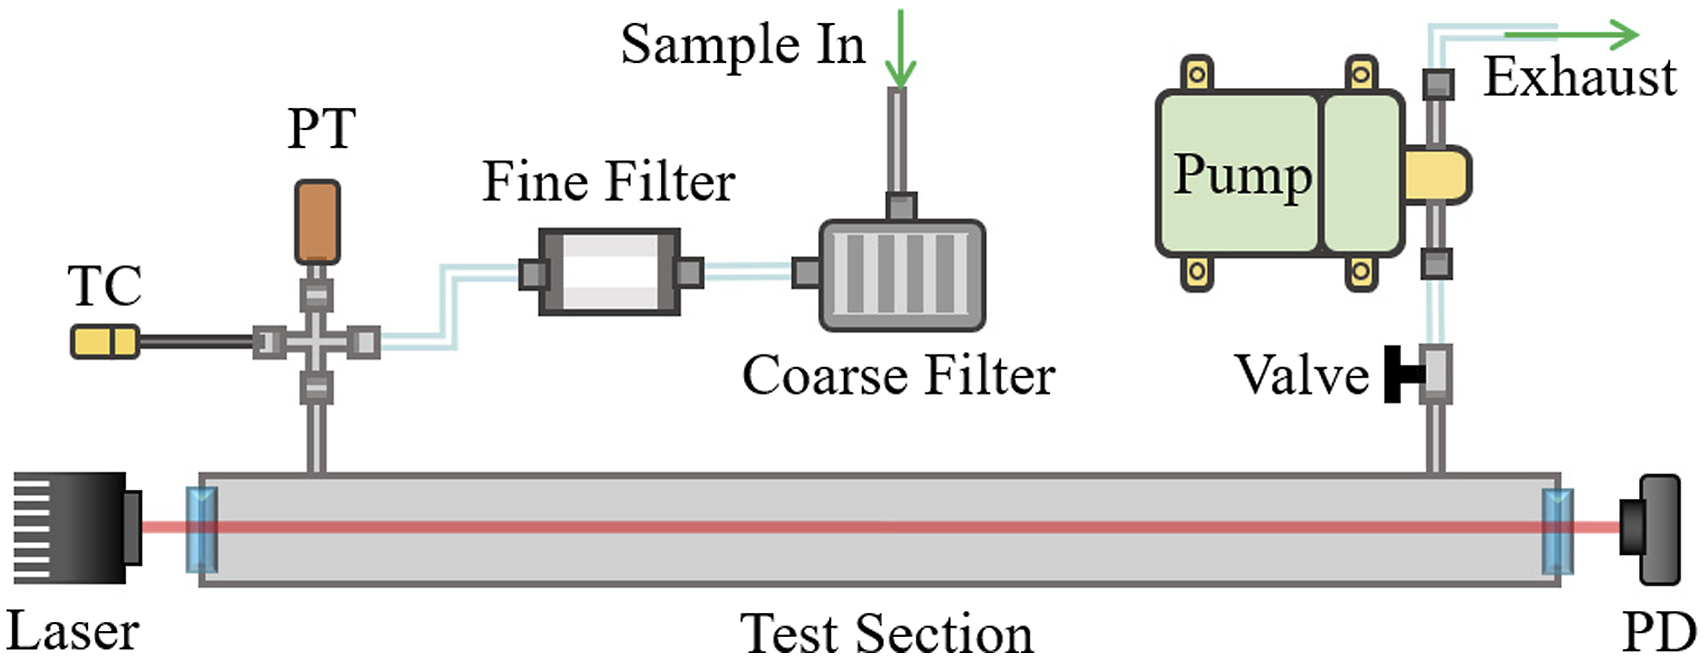
A National Instruments data acquisition (NI-DAQ) system with a Labview user interface generates a 1 Hz sawtooth waveform to modulate the laser. The photodetector (I), thermocouple (T), and pressure transducer (P) signals are recorded by the NI-DAQ system at a sampling frequency of 1 Hz throughout an experiment. The recorded T and P along with parameters from HITRAN are used to simulate the maximum spectral absorbance in the scanning wavenumber range at various partial pressures in increments of 1 ppm. A baseline is fit to the non-absorbing portion of the transmitted intensity, I, to estimate the incident intensity, I0, and the maximum observed spectral absorbance is calculated according to Eq. 1. The observed and simulated maximum spectral absorbance are compared and the partial pressure for which the difference is minimum gives the estimated HCN concentration.
The limit of detection (LOD) and limit of quantitation (LOQ) is determined according to the method described in Borman and Elder. 36 Measurement is made with no HCN in the test-section for 60 seconds at sampling frequency of 1 Hz and the standard deviation (SDblank) in the measurement is determined to be 0.3 ppm. Therefore, the LOD, defined as 3.3*SDblank/s, is 1 ppm and the LOQ, defined as 10*SDblank/s, is 3 ppm, where s, the slope of the calibration curve, is calculated to be 0.96.
Figure 4 demonstrates the estimation of I0 from I using baseline fitting for two datapoints at different HCN concentrations from different live-fire experiments. The lower HCN concentration datapoint (27 ppm) clearly shows absorption by HCN at 3345.3 cm−1. The higher HCN concentration datapoint (295 ppm), shows the chosen HCN absorption line and additional features belonging to acetylene’s absorption spectrum. Despite the acetylene feature, it is possible to fit a zero-absorption baseline between 3346.55 cm−1 and 3347.4 cm−1, and estimate the incident intensity. Estimation of incident intensity, I0 (dashed), based on transmitted intensity, I (solid) for samples of two different HCN concentrations (27 ppm and 295 ppm). The dotted line indicates the center wavenumber of the HCN absorption line used for measurement.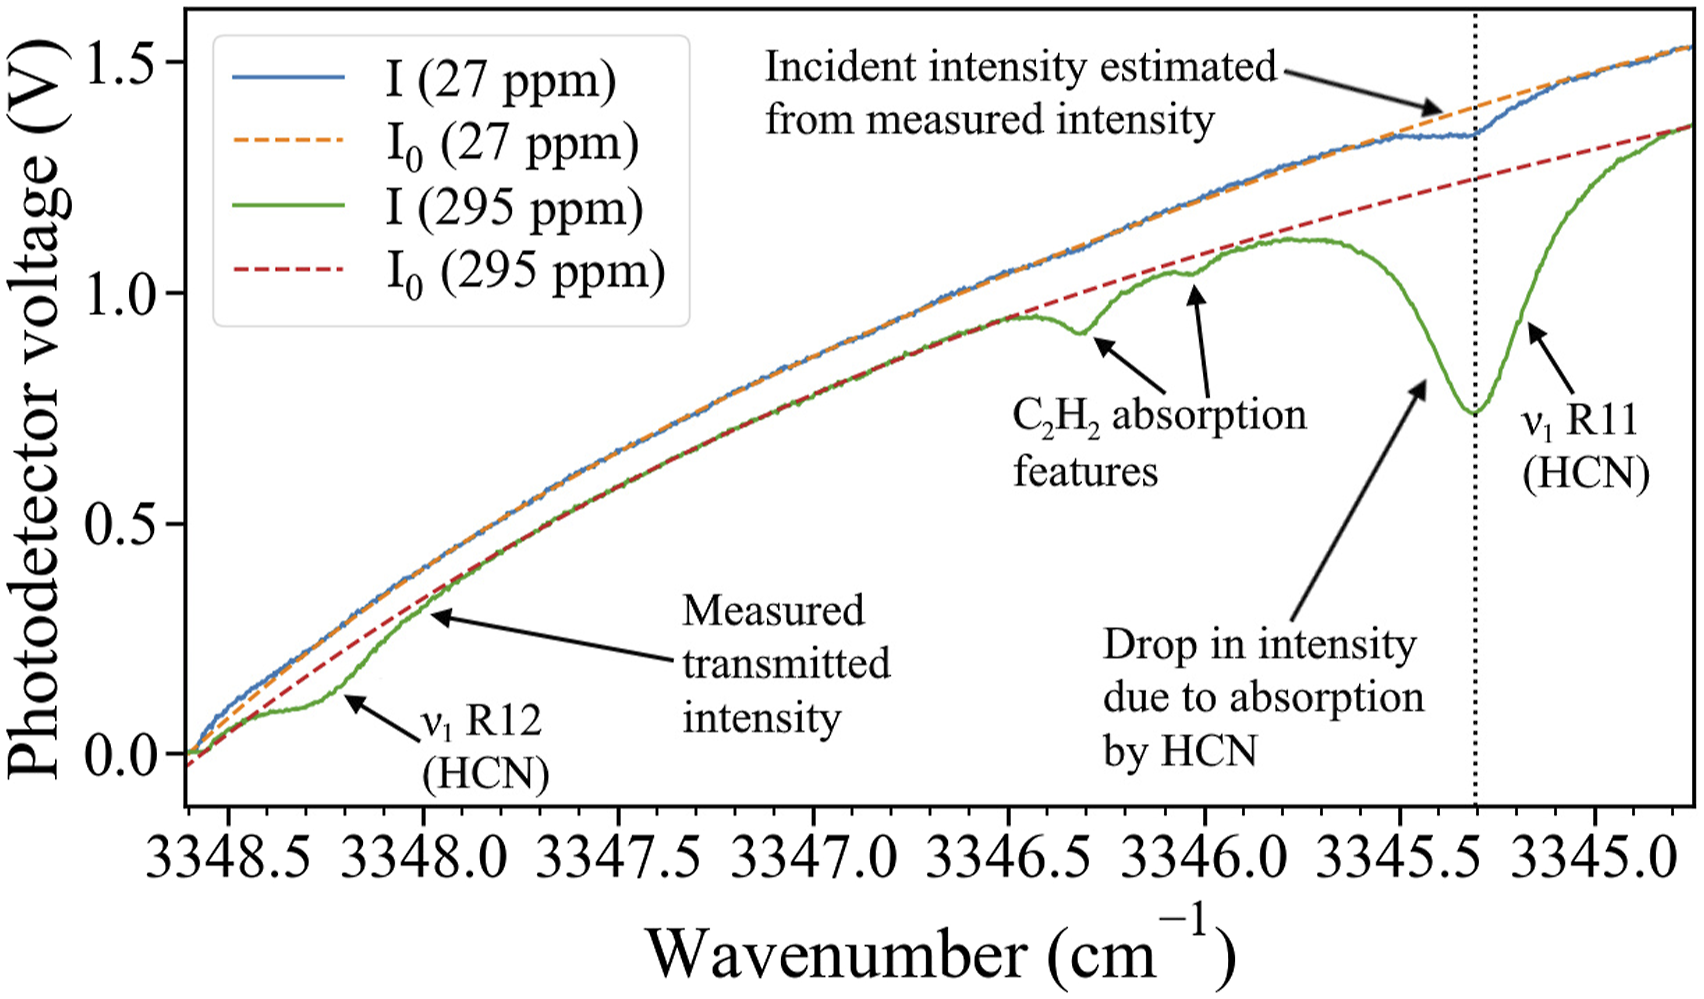
Bench-Scale Validation
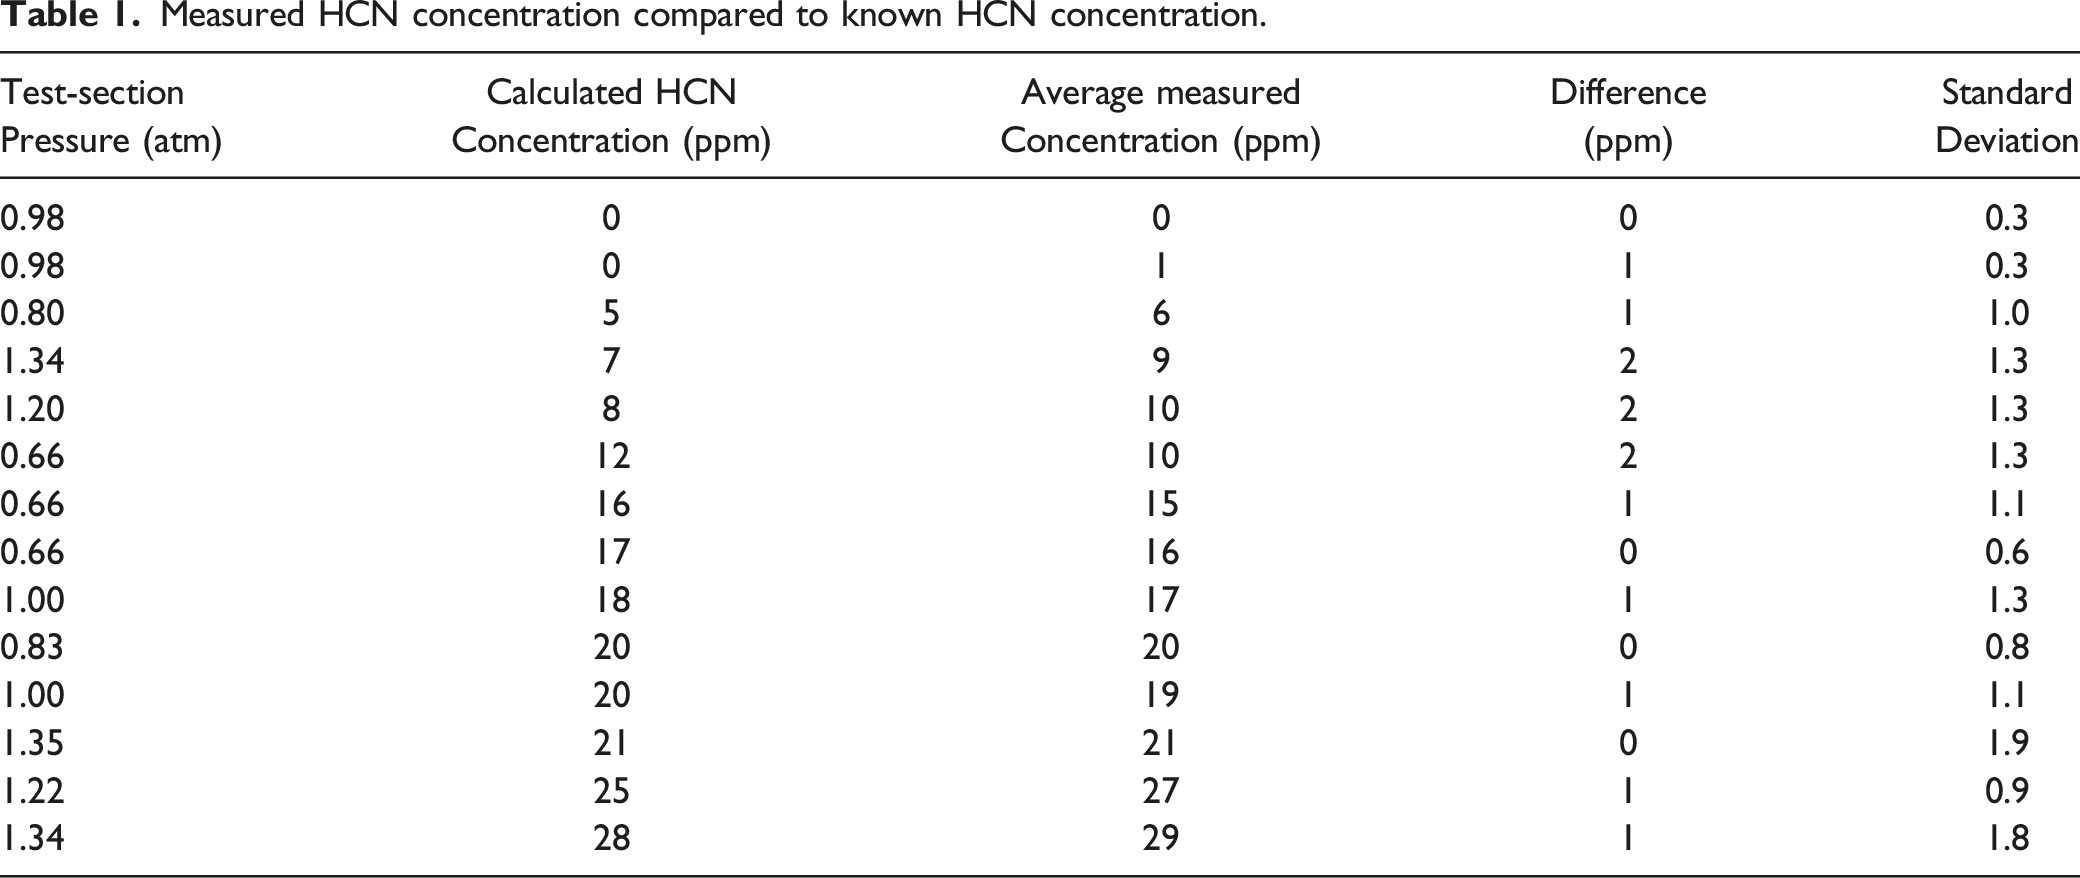
The accuracy of the HCN measurement system is verified using calibration gases of known HCN concentration, balance nitrogen (N2). At room temperature, the test-section is first evacuated to a partial vacuum using a diaphragm pump (KNF, UN022AVP) and then filled with calibration gas of known HCN concentration (10 ppm, 30 ppm, or 50 ppm) until the desired pressure is achieved. The HCN concentration expected in the test-section is calculated based on the concentration and the amount of calibration gas introduced.
Measured HCN concentration compared to known HCN concentration.
Fireground Application
After validating the measurement system, a series of three experiments is conducted in the Fireground Exposure Simulator (FES) prop at the University of Illinois Fire Service Institute, Champaign, Illinois. In each experiment, HCN is measured at a different height of interest related to occupant exposure risk in a non-fire room. The 0.3 m height from the floor approximates the height of a potential trapped occupant lying on the floor, while 0.9 m height represents an occupant kneeling or crawling on the floor or sleeping in bed and 1.5 m corresponds to a person standing or walking.
Experimental Setup
The FES prop is a three chamber structure that was developed to reproduce realistic thermal and smoke conditions experienced by a firefighter in a typical residential fire environment.
38
As seen in Fig. 5, the FES prop has a central combustion chamber (measuring 3.0 m by 2.4 m by 2.9 m) and two exposure chambers on either side (measuring 4.6 m × 2.4 m × 2.9 m) that are connected via ducts along the ceiling. The combustion chamber is equipped with sliding doors to adjust the availability of air supply to the fuel. Roll-up doors are used to access the exposure chambers from the side. Identical, commercially available three-seat sofas (2.2 m × 0.9 m × 0.9 m, 47.5 kg), a typical home furnishing in the United States, consisting mostly of polyurethane and polyester are used as the fuel load for each experiment. This fuel was characterized in a previous laboratory study and the total energy release was measured to be 650 MJ with the peak heat release rate of 4.2 MW.
39
Plan (top panel) and front elevation (bottom panel) of the FES prop. HCN is measured in exposure chamber 2 at 0.3 m (green), 0.9 m (blue), and 1.5 m (red).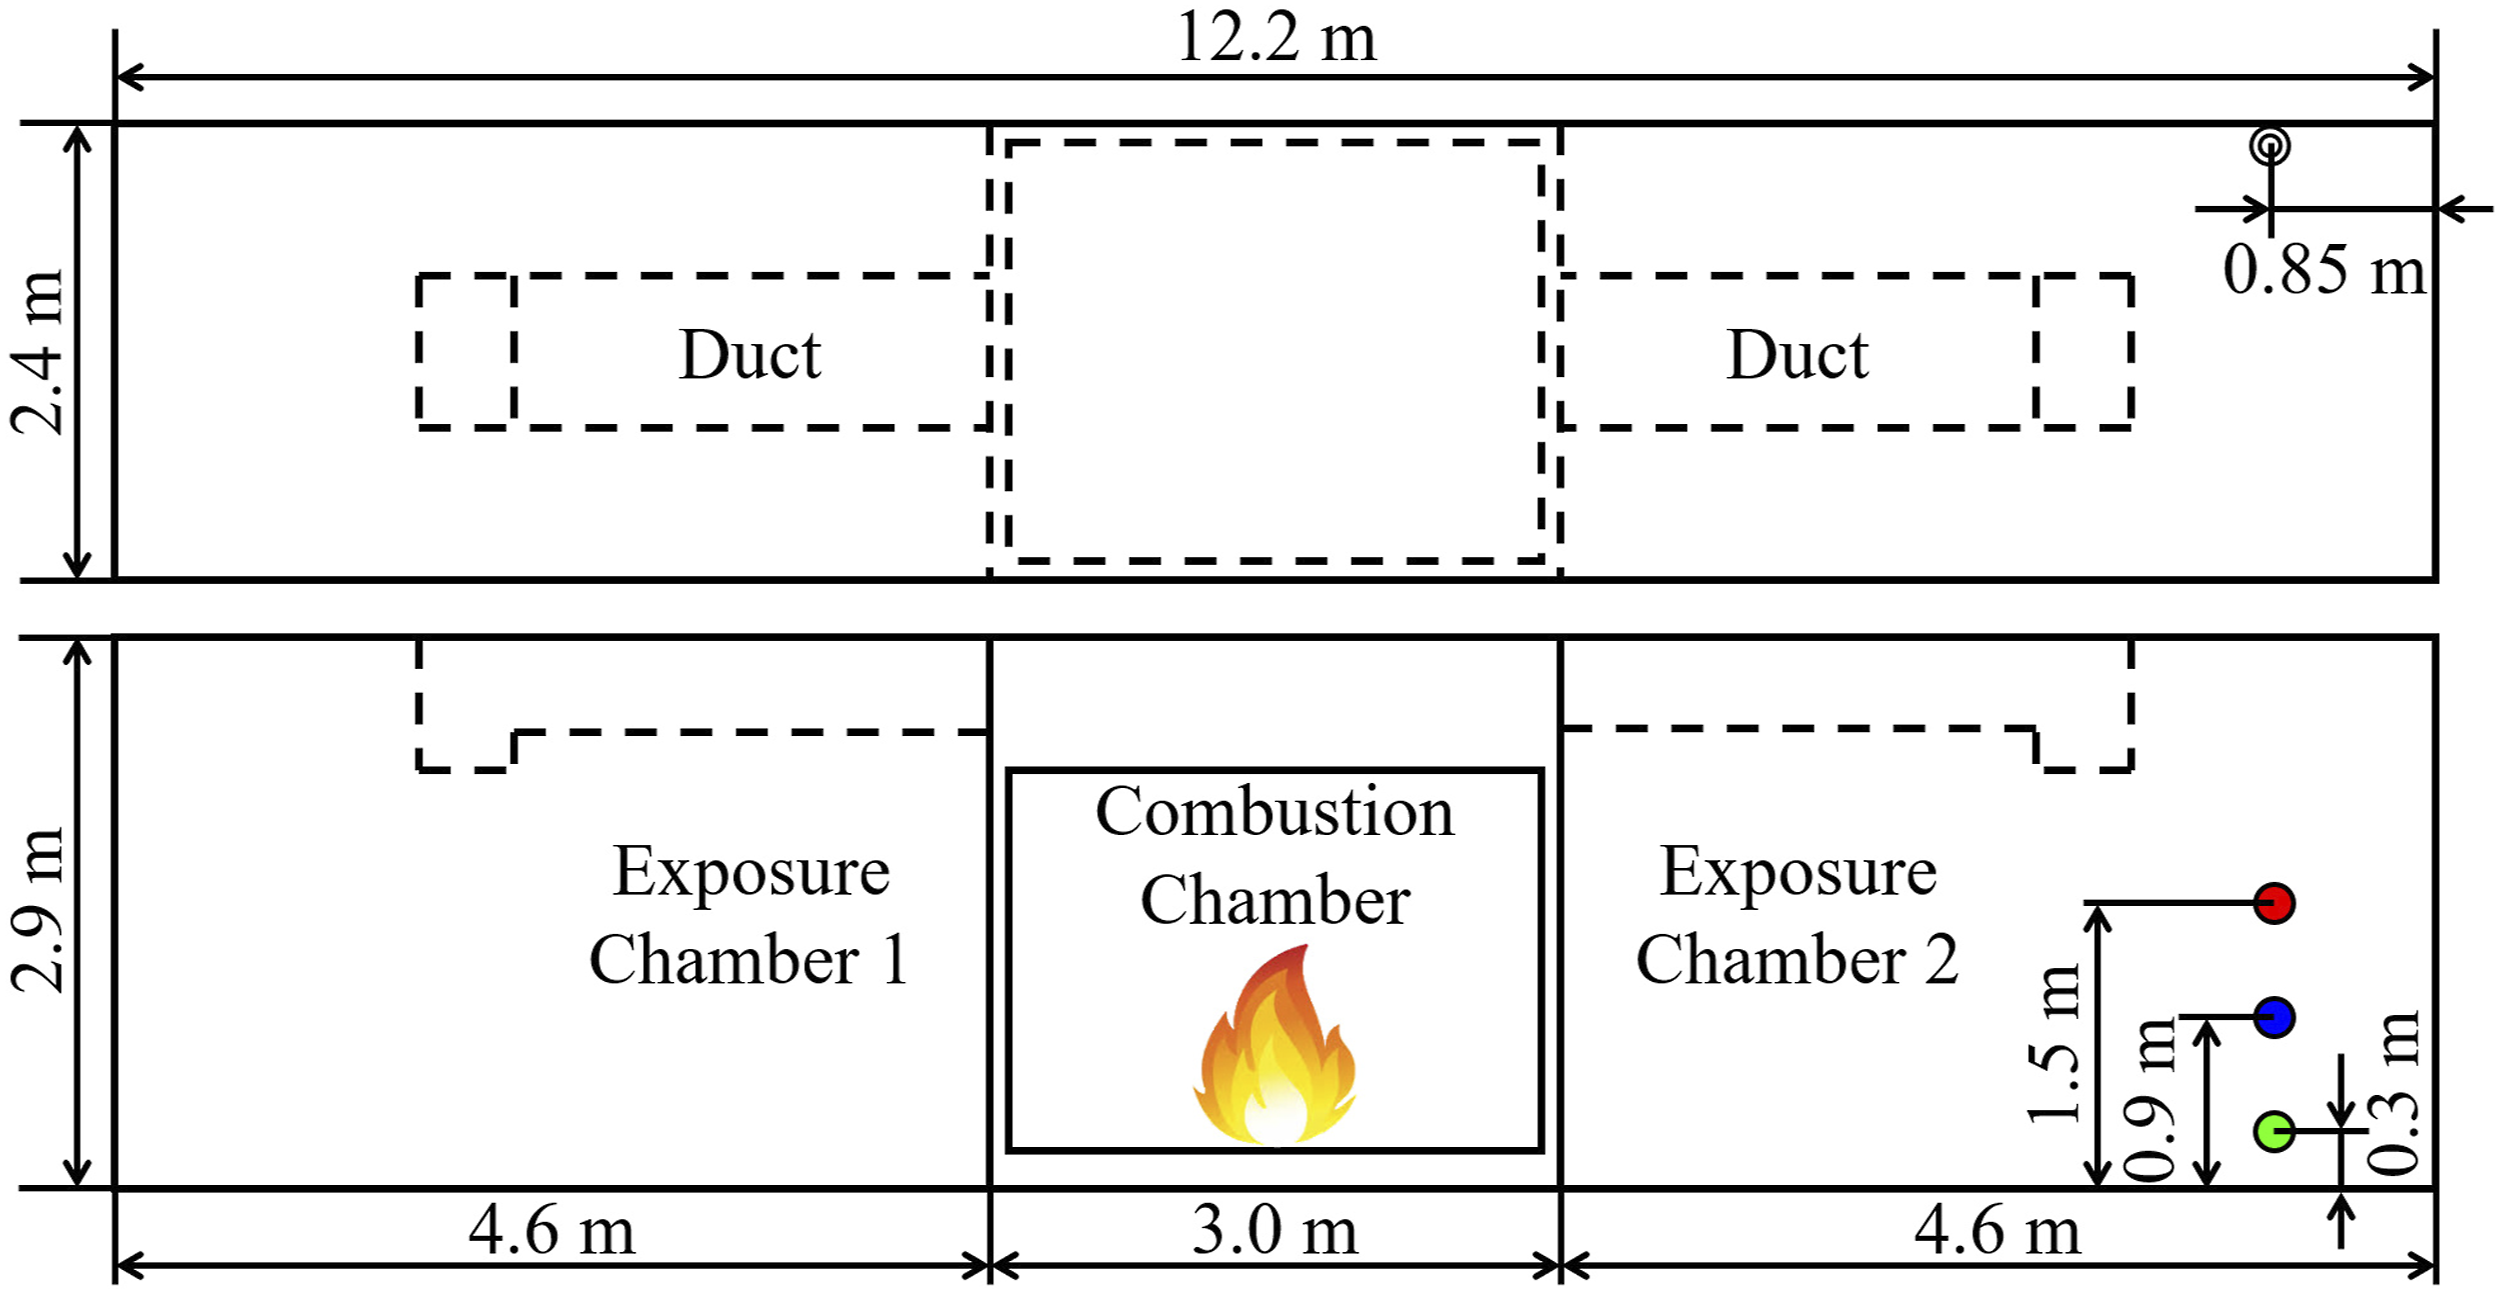
Each 15-minute experiment starts with 2 minutes of background gas sampling before ignition of the sofa with a road flare. All the doors are kept closed and the fire is allowed to grow utilizing only the leakage paths in the combustion chamber for ventilation. Fire suppression by water application occurs 6 minutes after ignition through the sliding doors. The combustion chamber doors are opened 1 minute after suppression starts. After another 1 minute, both the exposure chambers are simultaneously opened. Data is collected for another 5 minutes after all of these doors are opened as the smoke in the exposure chamber clears. These experiments follow a standardized timeline 38 such that the time of ignition, suppression and chamber opening varies by less than 1 s between experiments. HCN is measured in Exposure Chamber 2 along the rear chamber wall about 0.85 m from the roll-up door at three heights above the floor (Fig. 5).
Results and Discussion
To demonstrate how HCN concentration is estimated from the experiment data, Fig. 6a shows the observed transmittance at 1.5 m height 3.15 minutes after ignition and the spectrum simulated from HITRAN for 246 ppm HCN at the temperature and pressure measured in the test-section. Time-resolved HCN concentration measurements from the three separate experiments are shown in Fig. 6b. The vertical lines mark the ignition, fire suppression by water application, combustion chamber and exposure chamber opening events. For all the three experiments, the HCN concentration begins to change about 2 minutes after ignition. The highest HCN concentration is recorded at the 1.5 m height followed by at 0.9 m height, and the 0.3 m height records the lowest HCN concentration. The time taken to reach the maximum measured concentration is the longest at 0.3 m height, followed by the 0.9 m and the 1.5 m heights. As these experiments are conducted on three separate occasions, there is expected to be some day-to-day variations in the transport of smoke from the combustion chamber to the sampling location due to differences in environmental condition, particularly humidity, and wind direction and magnitude. Application of the HCN measurement system in the exposure chamber of the FES prop.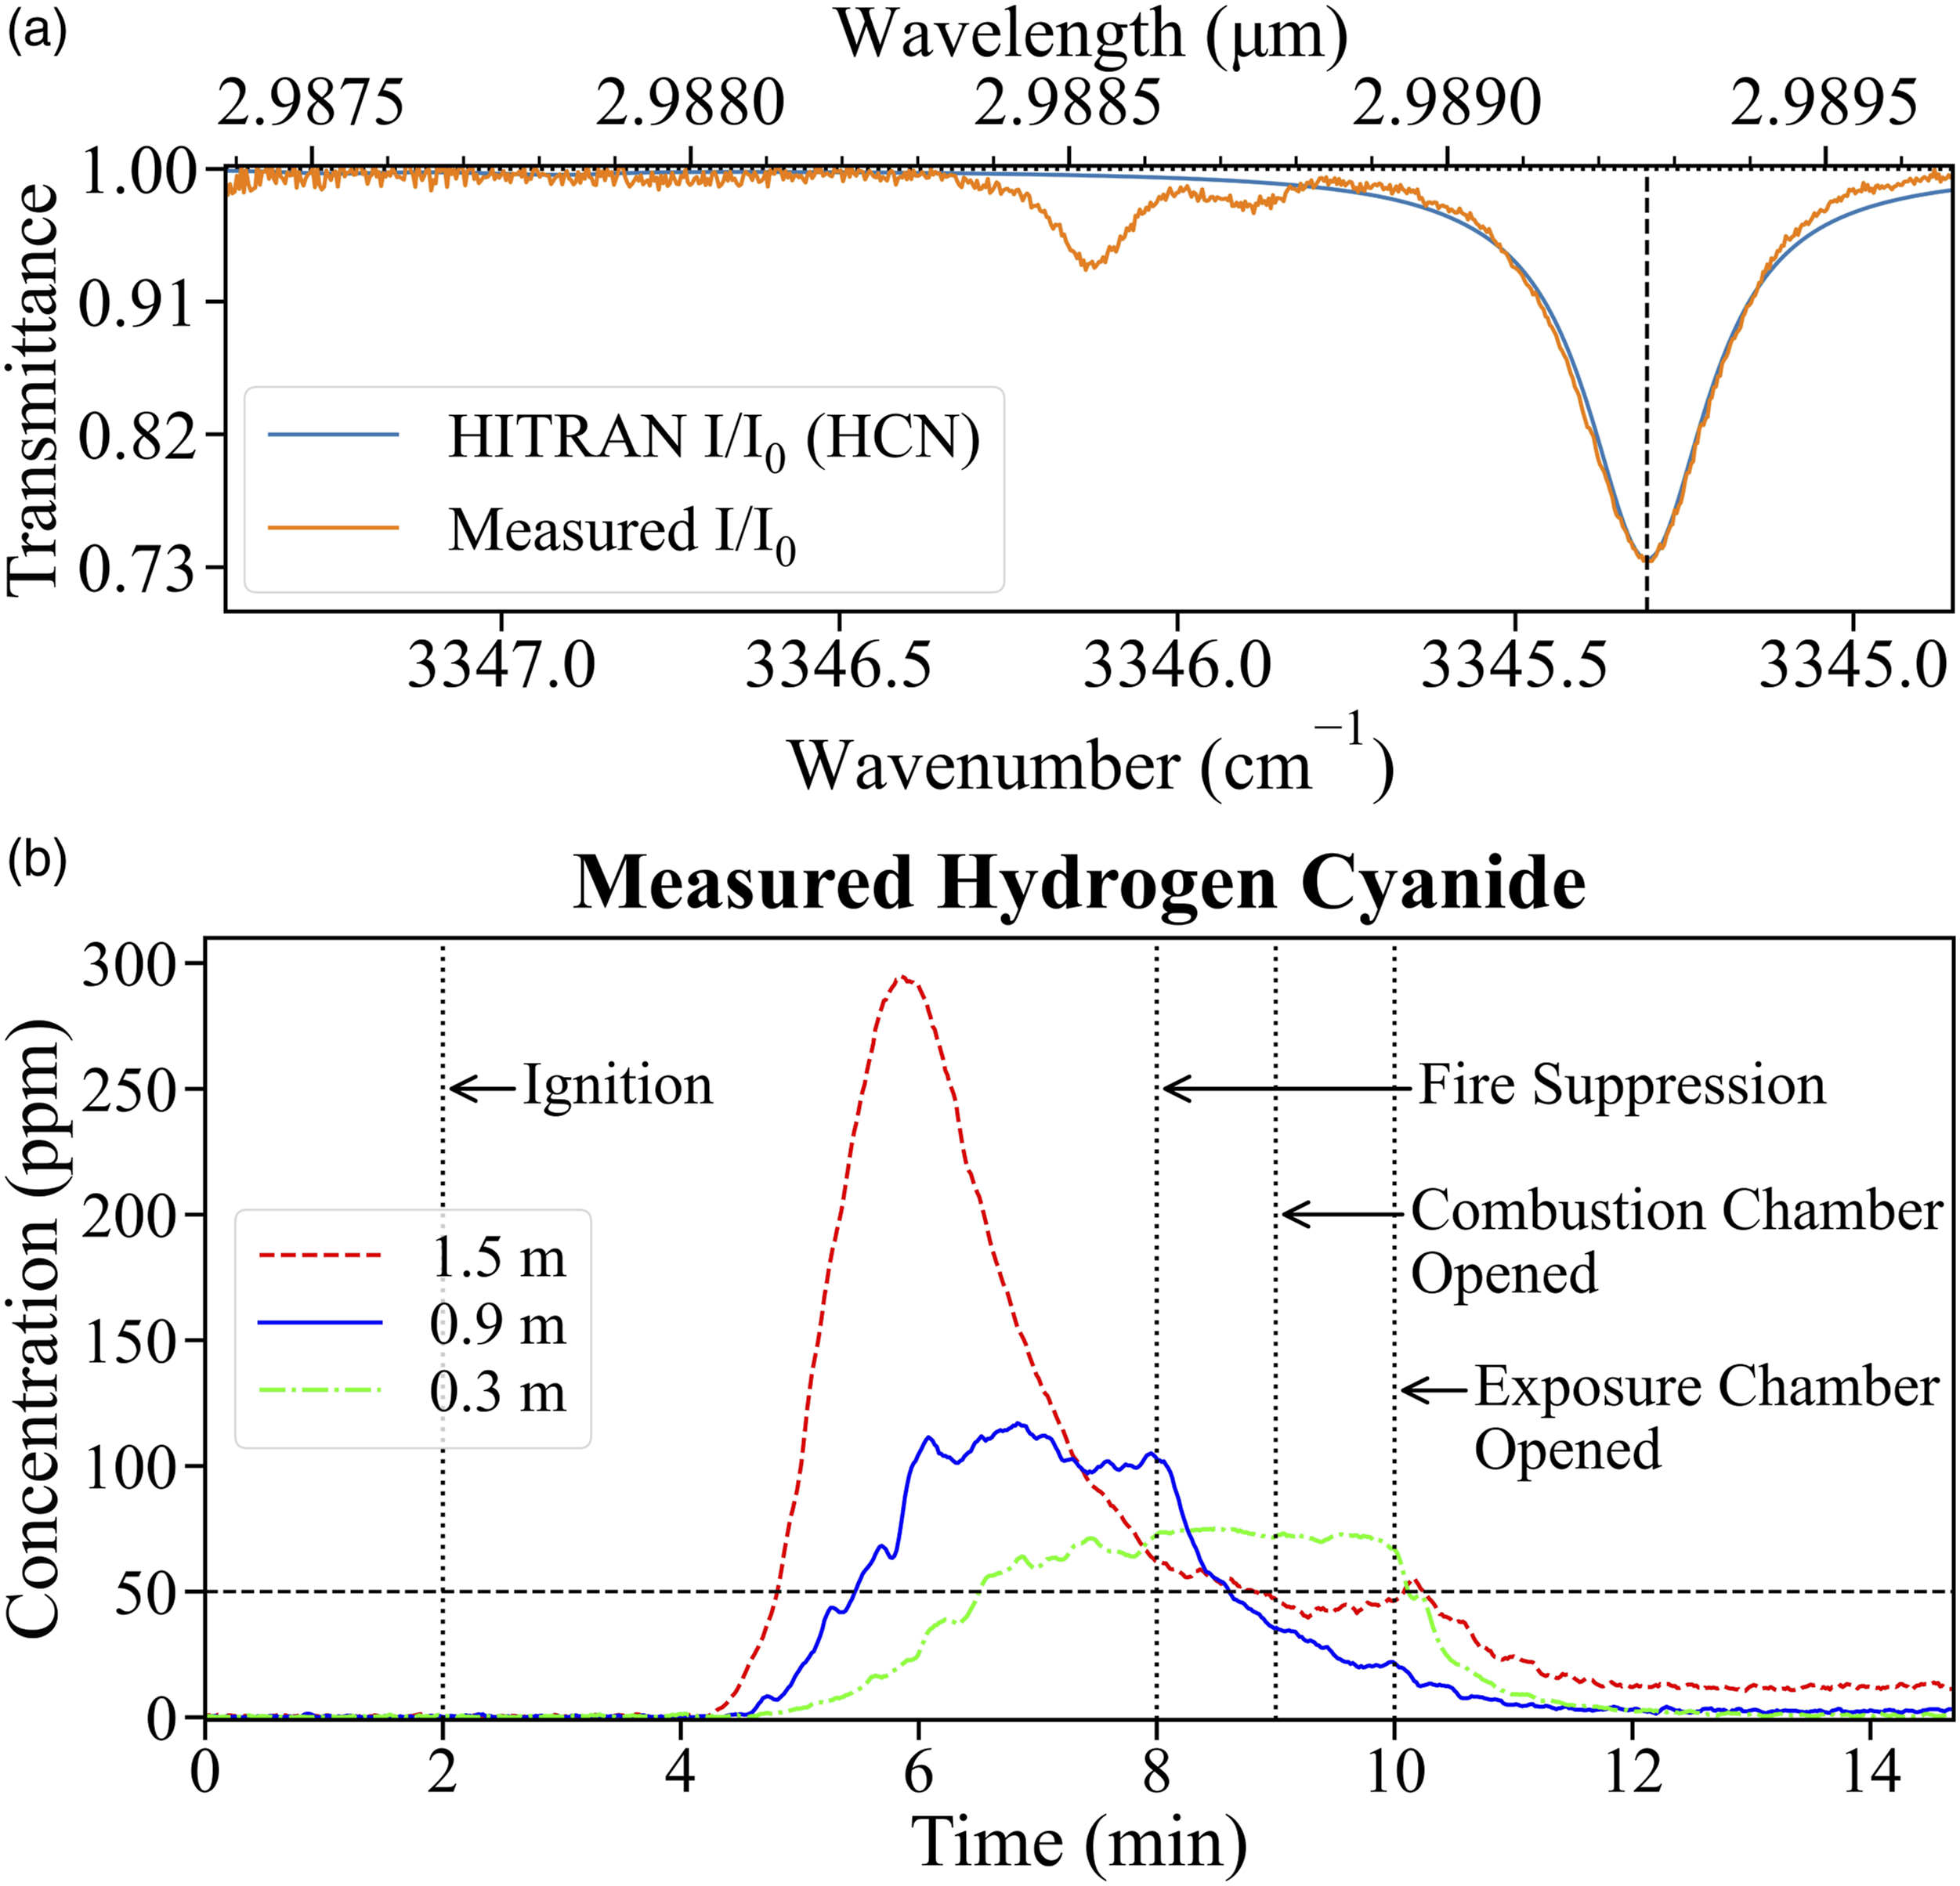
At the standing height of 1.5 m, HCN concentration increases sharply at a rate of 220 ppm/min, reaches a maximum of 295 ppm about 3.8 minutes after ignition and then drops as the fuel is consumed, at a rate of 120 ppm/min until suppression. The HCN concentration at 1.5 m height continues to decrease relatively slowly after fire suppression. Opening the combustion chamber causes a slight increase, most likely due to the remaining combustion gases being pushed through the ducts from the combustion chamber by the incoming fresh air. The concentration at 1.5 m drops after the exposure chamber is ventilated to about 12 ppm and is observed to remain elevated for several minutes even after the structure is fully ventilated.
At the 0.9 m crawling height, HCN concentration increases at a rate of 67 ppm/min until it reaches 117 ppm about 4 minutes after ignition. Fluctuations in concentration are observed but the concentration remains above 95 ppm until after suppression. The HCN concentration at 0.9 m drops steadily post-suppression, as the FES is progressively ventilated and stabilizes about one minute after the exposure chamber ventilation until the end of the experiment at an average concentration of 3 ppm.
At 0.3 m height, the HCN concentration is observed to increase until suppression at a rate of 26 ppm/min to about 75 ppm. The concentration fluctuates within 6 ppm of the maximum until the exposure chamber is ventilated after which it drops at an average rate of 58 ppm/min and reaches pre-ignition values about 2 minutes after the exposure chamber is ventilated.
The IDLH value of 50 ppm is exceeded at all the three sampling heights. However, at the 0.3 m height, the IDLH value is exceeded 1.7 minutes later than at 1.5 m height. The measured HCN concentration remains above IDLH at the 0.3 m height from about 4.5 minutes after ignition until the exposure chamber is ventilated about 8.1 minutes after ignition. At the 0.9 m height, the IDLH concentration is exceeded about 3.6 minutes after ignition and the HCN concentration drops below 50 ppm about 6.6 minutes after ignition. At the 1.5 m height, HCN concentration above the IDLH value is measured just 2.8 minutes after ignition until ventilation.
Application in Full-Scale Live Fire Experiments
The time-resolved concentrations presented in the previous section demonstrate the HCN measurement system’s capability to measure HCN in the residential fire environment despite the fireground conditions being adverse for optical measurements. This dataset also indicates that the HCN measurement system is ready to be expanded and deployed in larger and more realistic residential fire environments.
The HCN measurement system is expanded to make simultaneous measurements from two sampling locations. The source laser beam is split into two parallel beams using a beam splitter (Thorlabs, BSW511) and a mirror (Thorlabs, PF10-03-P01). An identical test-section, a thermocouple, a pressure transducer, a photodetector, a diaphragm pump, and filters are added to the setup described in Fig. 3. The LOD and LOQ remain 1 ppm and 3 ppm, respectively, with the relative error less than 4%. Right before the sampled gas is introduced into the test-section, it is passed through an additional 0.3 μm HEPA filter to remove any residual particulates.
The two location HCN measurement system is deployed in two identical fully furnished ranch-style single story residential structures built at the Delaware County Emergency Services Training Center in Sharon Hill, Pennsylvania. The objective of these experiments is to study the impact of the ignition location, the isolation of fire and non-fire compartments, the various search and rescue tactics and their timing relative to fire suppression, on firefighter safety and occupant survivability. The findings of the larger study are detailed in technical reports published by UL Fire Safety Research Institute.40,41 Due to the number of factors that influence fire development and suppression, the rate of rise and fall in HCN concentration, along with the peak values vary considerably between experiments.
Each identical residential structure features four bedrooms, two bathrooms, an open concept kitchen, and living room area as shown in Fig. 7. The ignition locations for the two separate experiments (Kitchen or Bedroom 4) and the gas sampling locations for HCN concentration measurement are also indicated. For the kitchen ignition experiment, HCN concentration is measured in gases sampled from the back of the hallway at 0.9 m height and 0.3 m height above the floor. For the Bedroom 4 ignition experiment, HCN is measured in gases sampled from the 0.9 m height above the floor, at the back of the hallway and inside Bedroom 1. The layout of the full-scale residential experiment structure with dimensions and room labels, also indicating ignition and HCN measurement locations.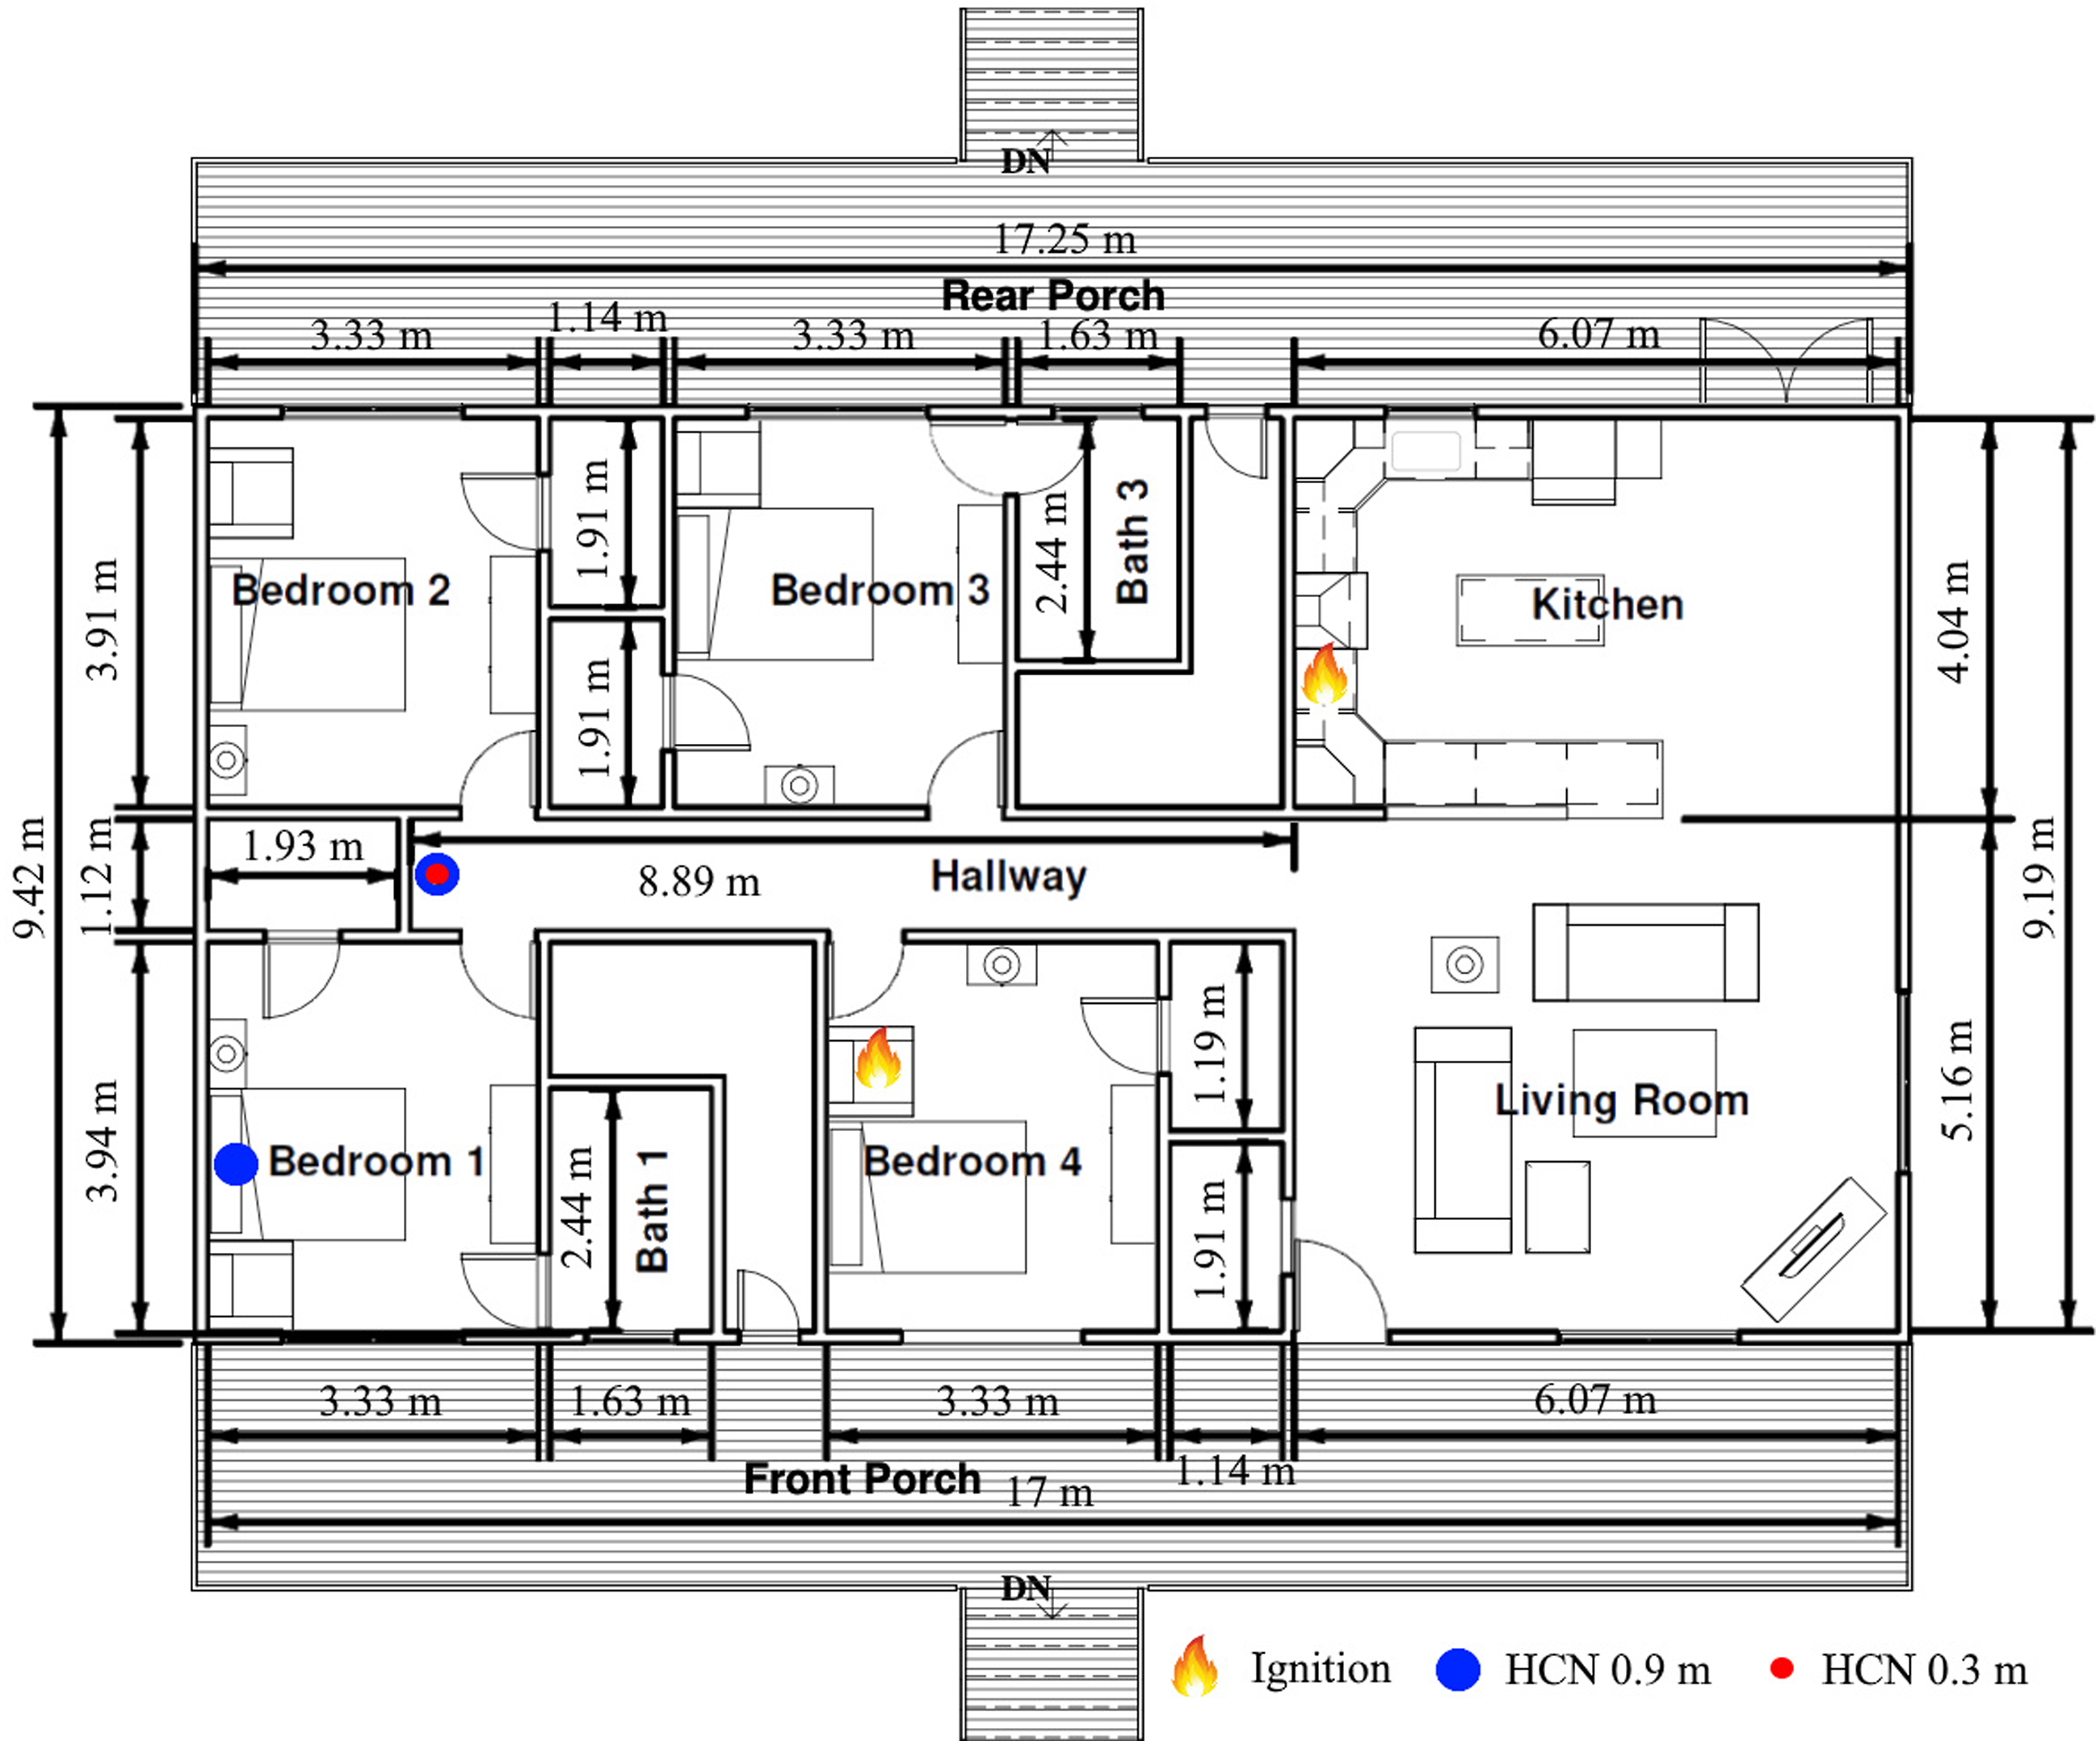
At each of the sampling location, the gas is sampled through a stainless steel intake port inside the structure and filtered through 5 μm and 3 μm HEPA filters to remove large particulate matter. The gas is then passed through a condenser (stainless steel coil in an ice-water bath) to remove moisture. As the HCN concentration is much lower than the saturation vapor pressure in the condenser coil and the solubility of HCN in water is calculated to be less than 0.58 ppm for a gaseous concentration of 2000 ppm, HCN losses in the condenser are considered to be negligible. The particulate and moisture free gas is then introduced into the HCN measurement system. The transport time from the inlet of the sampling port to the HCN measurement system’s test-section, which ranges from 12 to 21 seconds, is determined prior to each experiment and the HCN concentration data is corrected to ensure temporal synchronization with the events of the experiment. A representative spectrum overlaid with the HITRAN simulation spectrum for the corresponding HCN concentration from the kitchen experiment is shown in Fig. 8a and from the bedroom 4 experiment is shown in Fig. 8b. The time-resolved HCN concentrations for the two experiments are presented in Figs. 8c and 8d. Application of the HCN measurement system in full-scale residential structure fire experiments to quantify and track changes due to simulated firefighting activities. The dashed line indicates the IDLH concentration of 50 ppm.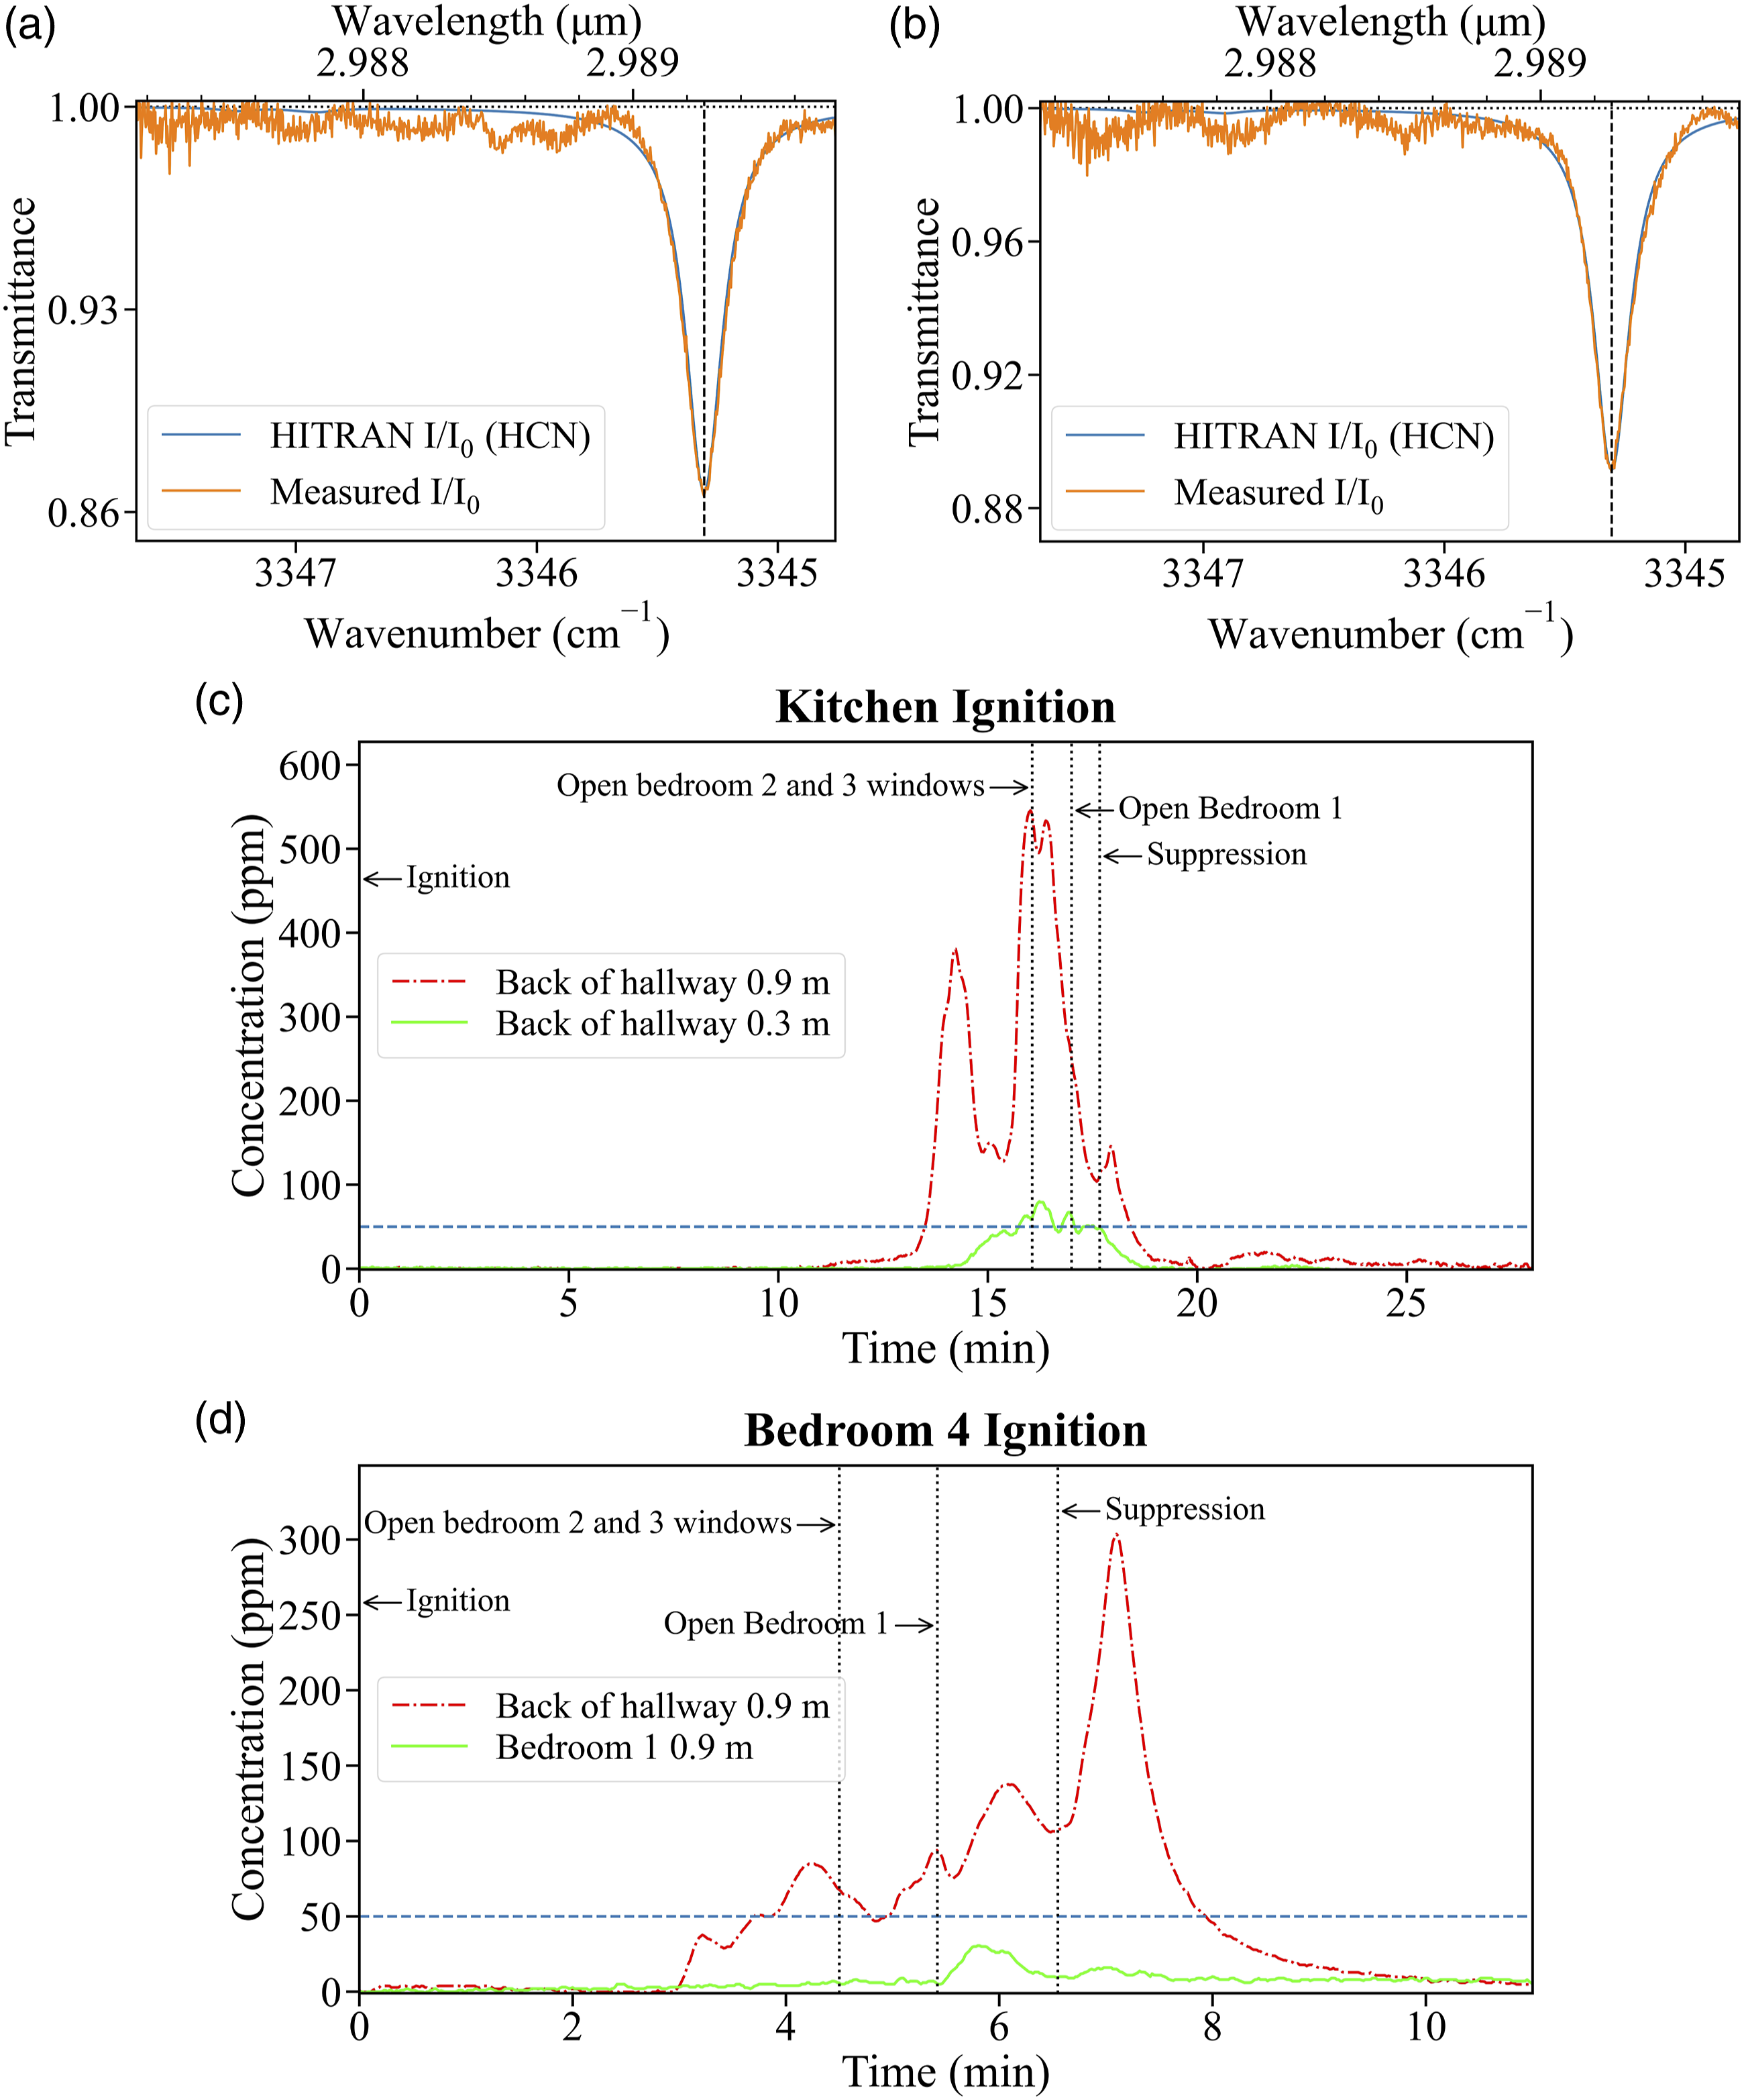
At the start of both the experiments, the door to Bedroom 1 is closed while the doors to Bedroom 2 and Bedroom 3, and the front door are open. The windows in Bedroom 1, Bedroom 2, and Bedroom 3 are all closed. The fire in the room of origin (either kitchen or bedroom 4) is allowed to grow and transition to flashover. Firefighting activities begin with simultaneously opening the windows in Bedroom 2, and Bedroom 3, marked in Fig. 8 as “Open Bedroom 2 and 3 windows”. The door to Bedroom 1 is then opened (“Open Bedroom 1” marker) and then closed 10 seconds later. After 15 seconds, the Bedroom 1 window is opened. The fire suppression crew then enter the structure through the front door (“Suppression” marker) and apply water on the fire using firefighting hose and a smooth bore nozzle. After completing the simulated firefighter intervention activities, hydraulic ventilation 2 is performed to remove combustion gases accumulated in the experiment structure.
For the kitchen ignition experiment, the fire is ignited on the kitchen counter near the stove (see Fig. 7) by using a 4 kW propane burner to heat up 3/4 cup (about 180 mL) of canola oil to its auto-ignition point in an aluminum pan, to simulate an unattended cooking fire scenario. The fire then spreads to the rest of the kitchen and the living room. At the back of the hallway, 0.9 m height above the floor, the HCN concentration is first observed to change about 11 minutes after ignition. A sharp increase is observed about 13 minutes after ignition and the IDLH limit is exceeded about 13.5 minutes after ignition. The HCN concentration peaks at 381 ppm about 14.2 minutes post-ignition and then drops to less than 150 ppm before spiking to an overall maximum value of 546 ppm about 16.1 minutes after ignition, just before the Bedroom 2 and Bedroom 3 windows are opened. The concentration then drops rapidly, most likely due to gases leaving the structure through the bedroom windows. The HCN concentration reaches below the IDLH about 18.4 minutes after ignition. The average HCN concentration after hydraulic ventilation until the end of the experiment is measured to be 6 ppm. At the 0.3 m height, the HCN concentration increases about 14.2 minutes after ignition, crosses the IDLH limit about 15.7 minutes after ignition, and reaches the overall maximum value of 80 ppm about 16.3 minutes after ignition, just after firefighter intervention. Post-intervention, the HCN concentration then fluctuates around the IDLH concentration but does not drop below 42 ppm until after suppression. A steady decrease is observed after suppression and the HCN concentration reaches below 5 ppm about 18.6 minutes after ignition.
The observations from this experiment are in line with the gradient of HCN concentration with height above the floor observed in the FES experiments. However, due to larger quantity and variety as well as more complex composition of the fuel in the full-scale experiments, the magnitude of HCN measured is also greater than the FES experiments.
For the bedroom 4 ignition experiment, the fire is ignited with an electric match placed on the seat cushion of the bed-side chair (Fig. 7). The fire then spreads to the bed and the rest of bedroom 4. At the 0.9 m height at the back of the hallway, the HCN concentration starts to increase about 3 minutes after ignition, exceeding the IDLH concentration about 3.7 minutes after ignition, recording a maximum pre-intervention value of 85 ppm about 4.3 minutes after ignition. A distinct drop in HCN concentration is observed at the start of bedroom 1 search as the gases from the hallway spread into the bedroom when its door is opened. The HCN concentration continues to increase, spiking after suppression to an overall maximum of 304 ppm at about 7.1 minutes after ignition. The HCN concentration then drops rapidly until the hydraulic ventilation. The HCN concentration remains above IDLH concentration of 50 ppm until about 7.9 minutes after ignition. The average post-ventilation HCN concentration is recorded to be 7 ppm. In bedroom 1, at the 0.9 m height, the HCN concentration does not change substantially until about 5.5 minutes after ignition, when bedroom 1 door is opened. The HCN concentration remains below the IDLH limit for the entirety of the experiment. The overall maximum concentration of 31 ppm is recorded post-intervention at about 5.8 minutes after ignition. The average post-ventilation concentration, until the end of the experiment is recorded to be 8 ppm.
This experiment demonstrates that a physical barrier such as a closed bedroom door between the fire and the sampling location is effective against exposure to HCN in a residential fire environment, even with the door being temporarily opened to the rest of the structure for search operations. The maximum HCN concentration measured in the closed door bedroom is about 10 times lower than that measured at the back of the hallway, just outside bedroom 1 door. Similar conclusions about the effectiveness of a closed door have been arrived at in other experimental studies that have focused on concentrations of CO, CO2, O2, and water vapor.1,42‐44 This work provides the first report of the effect of residential bedroom door position on HCN concentration. Together with CO, CO2, and O2 concentration measurements, this new approach to quantify HCN concentration in live-fire experiments can provide a more complete understanding of the risks and possible protective measures for occupants trapped in residential fire environments.
The two different full-scale experiments reported here provide a robust test for the TDLAS system for quantifying HCN in “room and contents” fires with different composition and quantity of fuels (typical bedroom furnishings vs kitchen appliances) at a range of different sampling locations relative to the fire compartment. The maximum HCN concentration at the 0.9 m height in the hallway for the kitchen fire experiment is 1.8 times higher than for bedroom fire experiment, although it takes nearly 2.3 times longer to reach the peak HCN concentration. Overall, the kitchen experiment is 3.7 times longer from ignition to hydraulic ventilation.
Conclusion
A portable tunable diode laser based measurement system for measuring elevated concentrations of hydrogen cyanide in a time-resolved manner is developed for application in the fire environment. The design and development of the measurement system is described in detail along with initial demonstrations of its potential applications. It is first validated in the laboratory with calibration gases of known HCN concentration. It is then deployed in a controlled fire environment on a firefighter training fireground to measure and track HCN concentration from ignition of a typical residential upholstered furniture item through fire suppression and ventilation of the structure. These time-resolved measurements are then used to compare HCN concentrations at three heights of interest in terms of exposure in a non-fire room, using identical fuels.
The versatility and portability of the measurement system is further demonstrated through HCN concentration measurements made in gases sampled from two locations in a full-scale realistic residential fire environment. The changes in HCN concentration due to simulated firefighter intervention activities are tracked throughout the experiment. These measurements represent one of the first attempts to quantify elevated HCN concentrations in a realistic residential fire environment using an optical laser-based technique at a sampling frequency of 1 Hz.
In future work, these measurements could be used to improve existing tenability assessments with actual time-resolved HCN measurements in place of commonly used methods that average concentrations over the duration of the measurement or modeled estimates. Furthermore, the HCN measurement system could be employed to gather time-resolved HCN concentration data in a variety of fire environments including but not limited to multifamily residential fires, aircraft fires, industrial fires, storage facility fires, wildland urban interface (WUI) fires, etc. Different conditions of fuel, ventilation and structure configurations, as well as impact of various intervention activities in such environments on HCN concentration and its consequence on tenability of those environments could also be studied in the future.
Footnotes
Acknowledgments
We would like to thank Holli Knight and Craig Weinschenk for their support during the development of this manuscript.
Declaration of Conflicting Interests
The author(s) declared no potential conflicts of interest with respect to the research, authorship, and/or publication of this article.
Funding
The author(s) disclosed receipt of the following financial support for the research, authorship, and/or publication of this article: This work was supported by the Department of Homeland Security Fire Prevention and Safety Grants no. EMW-2015-FP-00361 and no. EMW-2017-FP-00628.