
Abstract
Enhanced emission was observed in the laser-induced breakdown spectroscopy (LIBS) atomic emission spectra of bacterial cells deposited upon a nitrocellulose filtration medium in the presence of one-micron silver microparticles. A deposition chamber was constructed that allowed a uniform coating of the filter with trace amounts of silver microparticles. Masses from 10 to 100 μg were deposited in a circular area of 52.18 mm2. A 30 s deposition time was used for all experiments resulting in a mass deposition of 39 μg ± 17 μg. This mass coverage on the filter provided for a single laser shot silver mass ablation of 3.3 ng per laser shot. LIBS spectra were acquired with single-shot 1064 nm laser pulses from specimens of E. coli, M. smegmatis, and E. cloacae deposited on both microparticle-coated filters and blank filters. An increase in emission intensity for all elements detected in the bacterial LIBS spectrum as well as the carbon emission which derives in part from the nitrocellulose filter medium was observed due to the ablation with silver microparticles relative to the intensity measured from the ablation of bacterial cells deposited on a blank filter. The ratio of emission intensity with microparticles to emission intensity without microparticles was measured to be 3.6 for phosphorus, 4.5 for magnesium, 5.3 for calcium, 4.0 for sodium, and 1.2 for carbon. An enhancement in LIBS emission intensity in the range of 1–10 was observed for all the spectra, with an average enhancement ratio of 4.3.
Introduction
Laser-induced breakdown spectroscopy (LIBS) is a rapid elemental analysis technique that involves focusing a high energy pulsed laser onto a target in order to produce a weakly ionized micro-plasma. 1 The plasma consists of highly excited atoms, ions, and free electrons from the ablated target that reach temperatures up to approximately 50 000 K, before subsequent expansion and cooling. 2 As the plasma cools, excited electrons transition to lower energy levels in the atoms and ions, emitting characteristic photons. At a suitable delay after the initiation of the plasma, typically on the order of microseconds, these photons are dispersed in a spectrometer to obtain a characteristic time-resolved plasma emission spectrum. 3 The intensities of the spectroscopically narrow emission lines in the spectrum are measured in order to identify and quantify the presence and abundance of specific elements contained in the ablated target material. 4 The entire process of ablating a sample medium and determining its elemental composition can be accomplished on a time scale shorter than one second, with the added advantage that sample treatment and preparation can be minimal to non-existent or extensive and optimized depending upon the desired outcome. 5
The use of LIBS for the identification or classification of harmful pathogens, particularly bacteria, has been an area of considerable effort.6,7 While the technique has been shown to consistently demonstrate sufficient sensitivity and specificity to warrant interest as a real-time diagnostic, the variety of approaches adopted for cell preparation, specimen mounting, and data analysis has precluded any standard protocol from being developed or implemented. With the exception of the testing of aerosolized cells, the majority of experiments have been conducted by depositing a relatively low number of bacterial cells upon a variety of sampling substrates.7,8 The choice and preparation of the sampling substrate must be considered to be an essential component of the technique’s diagnostic capability and can have a profound influence on the resulting LIBS spectrum. 9 In the work described here, silver microparticles were used to modify a disposable filtration medium utilized as a sampling substrate to increase the LIBS emission intensity from all of the elements detected in the spectra from the ablated bacterial cells as well as the carbon emission intensity, which is due in part to ablation of the nitrocellulose filtration medium as well as the native carbon in the cells.
Recently, the use of metallic nanoparticles (NPs) to enhance emission intensities in LIBS spectra has been demonstrated among various research groups. 10 These NPs, commonly used to enhance the Raman scattering intensity in a technique known as surface-enhanced Raman spectroscopy (SERS), are typically gold or silver. 11 A thorough description of the physics behind the LIBS enhancement mechanism is not appropriate and is provided in a review by Dell’Aglio et al. 12 A brief explanation shows that upon irradiation of a deposition of gold or silver NPs on a surface by an ablation laser pulse, a plasmon resonance is created. The laser pulse induces coherent oscillation of the conduction electrons in the metallic NPs which in turn amplifies the incident electromagnetic field. This has the overall effect of increasing the electromagnetic field in the vicinity of the particle surface, resulting in more efficient ablation and greater plasma excitation which increases the LIBS emission signal. This increase in observed spectroscopic emission has been named nanoparticle-enhanced LIBS, or NELIBS. Significantly, the use of NPs and LIBS has been investigated for rapid bacterial detection, although in that work the Ag NPs were deposited to enhance Raman emission in a dual LIBS/SERS apparatus and not specifically to enhance LIBS emission. 13 It has been observed that the preparation of nanoparticle-embedded filter substrates requires a high concentration initial NP solution prior to substrate fabrication and that this can be cost-prohibitive which partially motivated the use of microparticles described in this work. 14
In this work, silver microparticles (MPs) have been deposited upon disposable filtration media to determine if the MPs also can enhance the emission from the LIBS spectra obtained from bacteria subsequently centrifuged through the modified filtration media. It is important to point out that the enhancement mechanism is not the same as described in NELIBS. The presence of the metallic MPs is expected to enhance emission due to increased plasma temperature and electron density just as if the bacteria had been deposited upon a slab of bulk silver, with the MPs providing a more readily digestible source of electrons and atoms than the bulk due to their high surface area to volume ratio. In this way, the benefits of enhanced ablation can be achieved while still maintaining a porous surface suitable for use during centrifugation, and without having to acquire expensive silver membrane filters or synthesize silver nanoparticles.11,15,16
Microparticles fall between 1 and 100 μm in size and include typical particles that we encounter daily such as pollen, dust, sugar, flour, and sand. 17 Tungsten MPs have previously been used by our group to test the ability of our deposition process to separate larger contaminant particles from the bacterial specimens using dual centrifugation. 18 In the present work, silver MPs have been deposited upon disposable nitrocellulose filters and bacterial LIBS spectra from three species of bacteria were obtained utilizing these modified filters. A sealed chamber to allow the uniform and repeatable deposition of Ag NPs upon the surface was created and the mass coverage as a function of deposition time was investigated. The aim of this work was to determine if enhancement of the bacterial LIBS emission could be observed using the easy-to-obtain MPs in an attempt to lower the limit of detection of the bacterial cells.
Experimental
Microparticles
All experiments were performed with 13 mm diameter nitrocellulose filters with a nominal 0.45 μm pore size (HAWP01300, Millipore-Sigma). The filters are sterile and composed of biologically inert mixtures of cellulose acetate (C164H174O111) and cellulose nitrate (C6H7O2 (ONO2)3). Due to the diameter of the insert constructed to fit within a standard centrifuge tube, the filter media were cut with a punch and die set to create a 9.5 mm circular diameter filter. The use of these filter media has been described previously. 19 Spherical silver powder, APS 0.5–1 μm, 99.9% purity (41 597, Alfa Aesar) was acquired to modify the filters. The uniform deposition of trace amounts of silver MPs on the filter medium is nontrivial.
Microparticles do not form colloidal suspensions like NPs. They aggregate and cluster together along the surface of a liquid solution. Agitation or vortex mixing of the suspension does not increase the miscibility of these particles. Common practice with depositing NPs includes submerging surfaces in the colloidal NP suspensions or adding microdroplets of the NP solution to the surface. 20 Because the MPs clump together, neither of these aforementioned deposition techniques are viable for producing a uniform coverage of deposited microparticles on the surface of the nitrocellulose filters without more extensive surface chemistry modification. Pipetting the MPs or mixing them with the bacteria samples prior to centrifugation introduced several issues. These included clumping and subsequent clogging of the apex hole of the aluminum cone used during centrifugation and the formation of an overly concentrated deposition of MPs on the filter medium. This area of dense Ag MPs led to scorching of the nitrocellulose filters and damage to nearby deposited bacteria upon laser ablation due to the formation of an overly intense laser-induced plasma. In addition, such ablation resulted in spectra that were dominated by Ag emission lines. Lastly, mixing any particles with the bacteria in fluid suspension (and it is believed this will be true for NPs as well) prior to centrifugation-filtration contaminated multiple pieces of equipment and apparatus with MPs that were extremely difficult to remove afterward even with very aggressive cleaning procedures. These trace MPs then contaminated subsequent spectra collected from specimens where the MPs were not included. Therefore, a new method was developed to uniformly distribute dry MPs upon unused filter media to create microparticle-coated filters upon which the bacteria could be deposited at a later time.
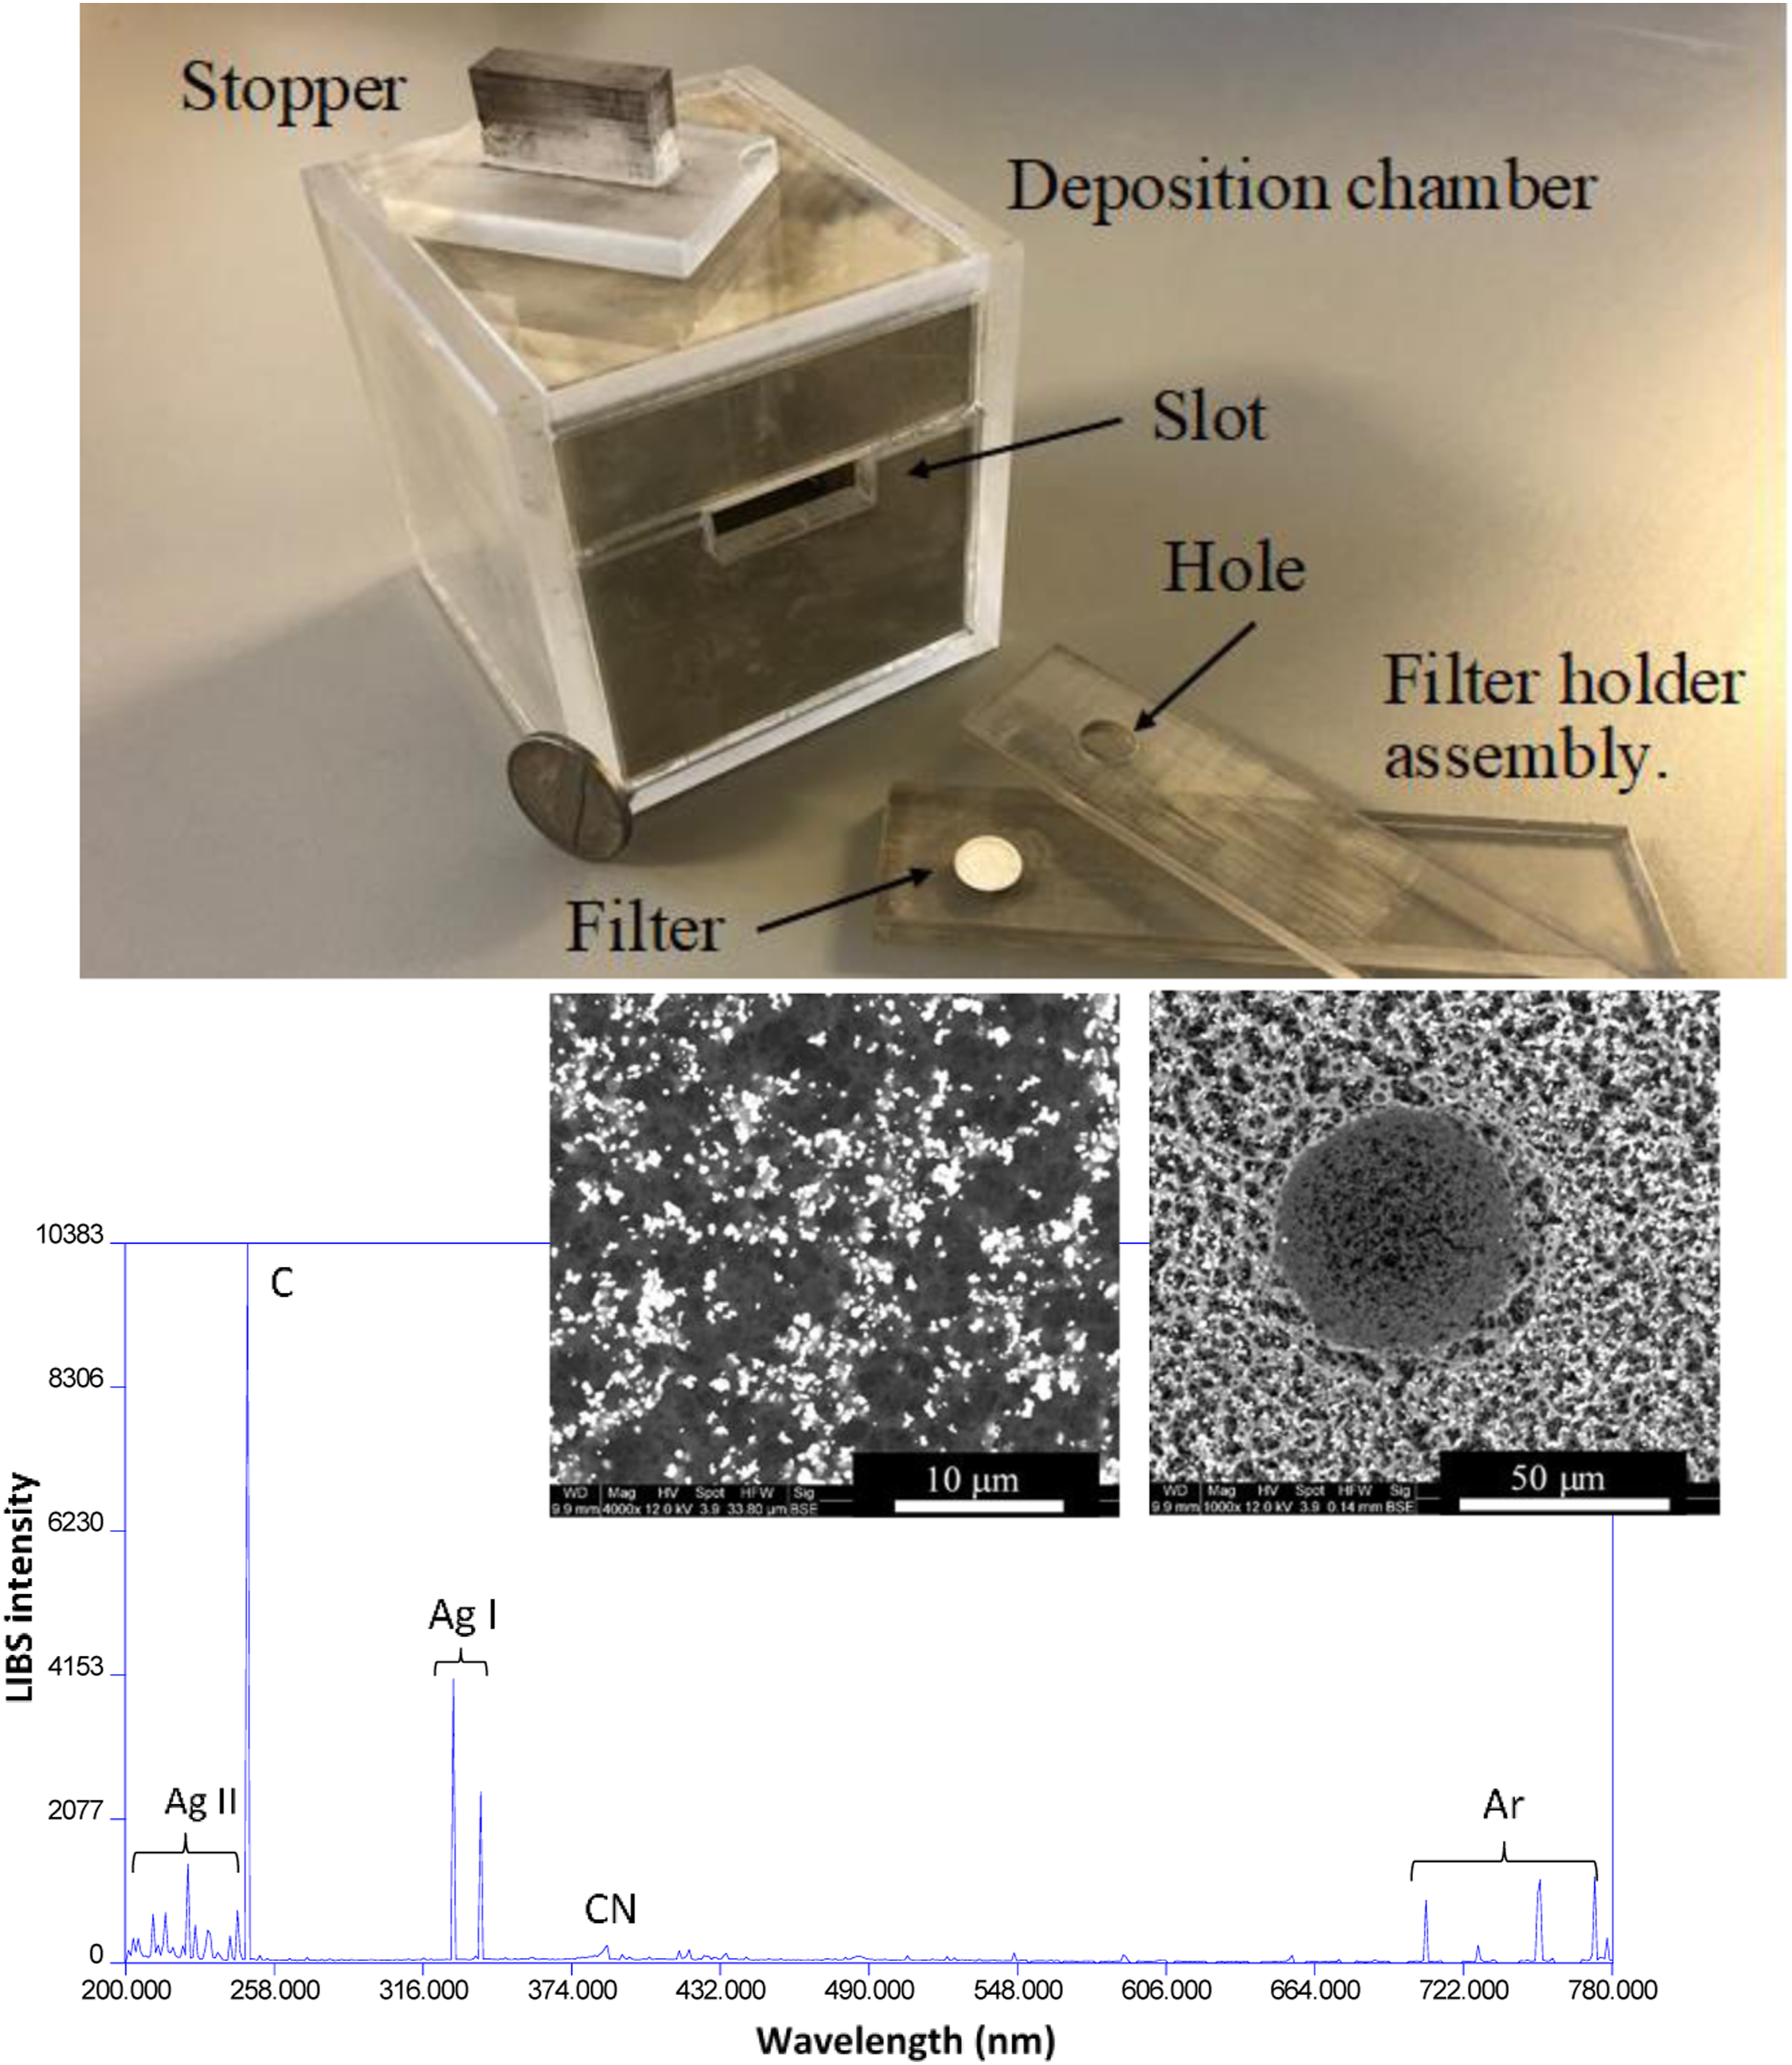
An Ag MP deposition chamber was designed and constructed out of Plexiglas, shown in Fig. 1. The chamber consisted of a cube-shaped box with a rectangular slot opening that could be blocked by a plug/stopper. All the other joints in the chamber were sealed with glue to create a tight, sealed chamber. The inner dimensions of the chamber were 63.5 mm x 63.5 mm x 63.5 mm. The slot was intentionally vertically offset from the geometric center of the chamber. The bottom of the slot was 35.9 mm from the floor of the chamber and the top of the slot was 19.5 mm from the top of the chamber. The chamber was filled with approximately 5 g of Ag MPs after construction by pouring the MPs without modification directly into the chamber though the slot. The stopper was secured in the slot to prevent the escape of any MPs and the chamber was vigorously agitated manually. This vigorous agitation caused all of the MPs to disperse throughout the chamber uniformly. After agitation, the chamber was placed stationary on a rigid surface and for some period of time lasting for tens of seconds subsequent to agitation, a fine “aerosol” of MPs would settle to the bottom of the chamber under the influence of gravity. Due to the interaction with air in the chamber, it was anticipated that the larger, heavier MPs would settle out most quickly while the smaller, lighter MPs would take the longest time to settle to the bottom. Silver microparticle deposition chamber with a US nickel and a ruler for scale. The stopper that seals the entrance slot during agitation is sitting on top of the deposition chamber. The filter holder assembly is shown disassembled (no hinge) in the bottom of the figure. The lower part of the filter holder assembly holds a 9.5 mm diameter nitrocellulose filter. The hole in the upper part of the assembly through which the MPs can settle when the assembly is clamped together and inserted into the box through the slot is clearly visible.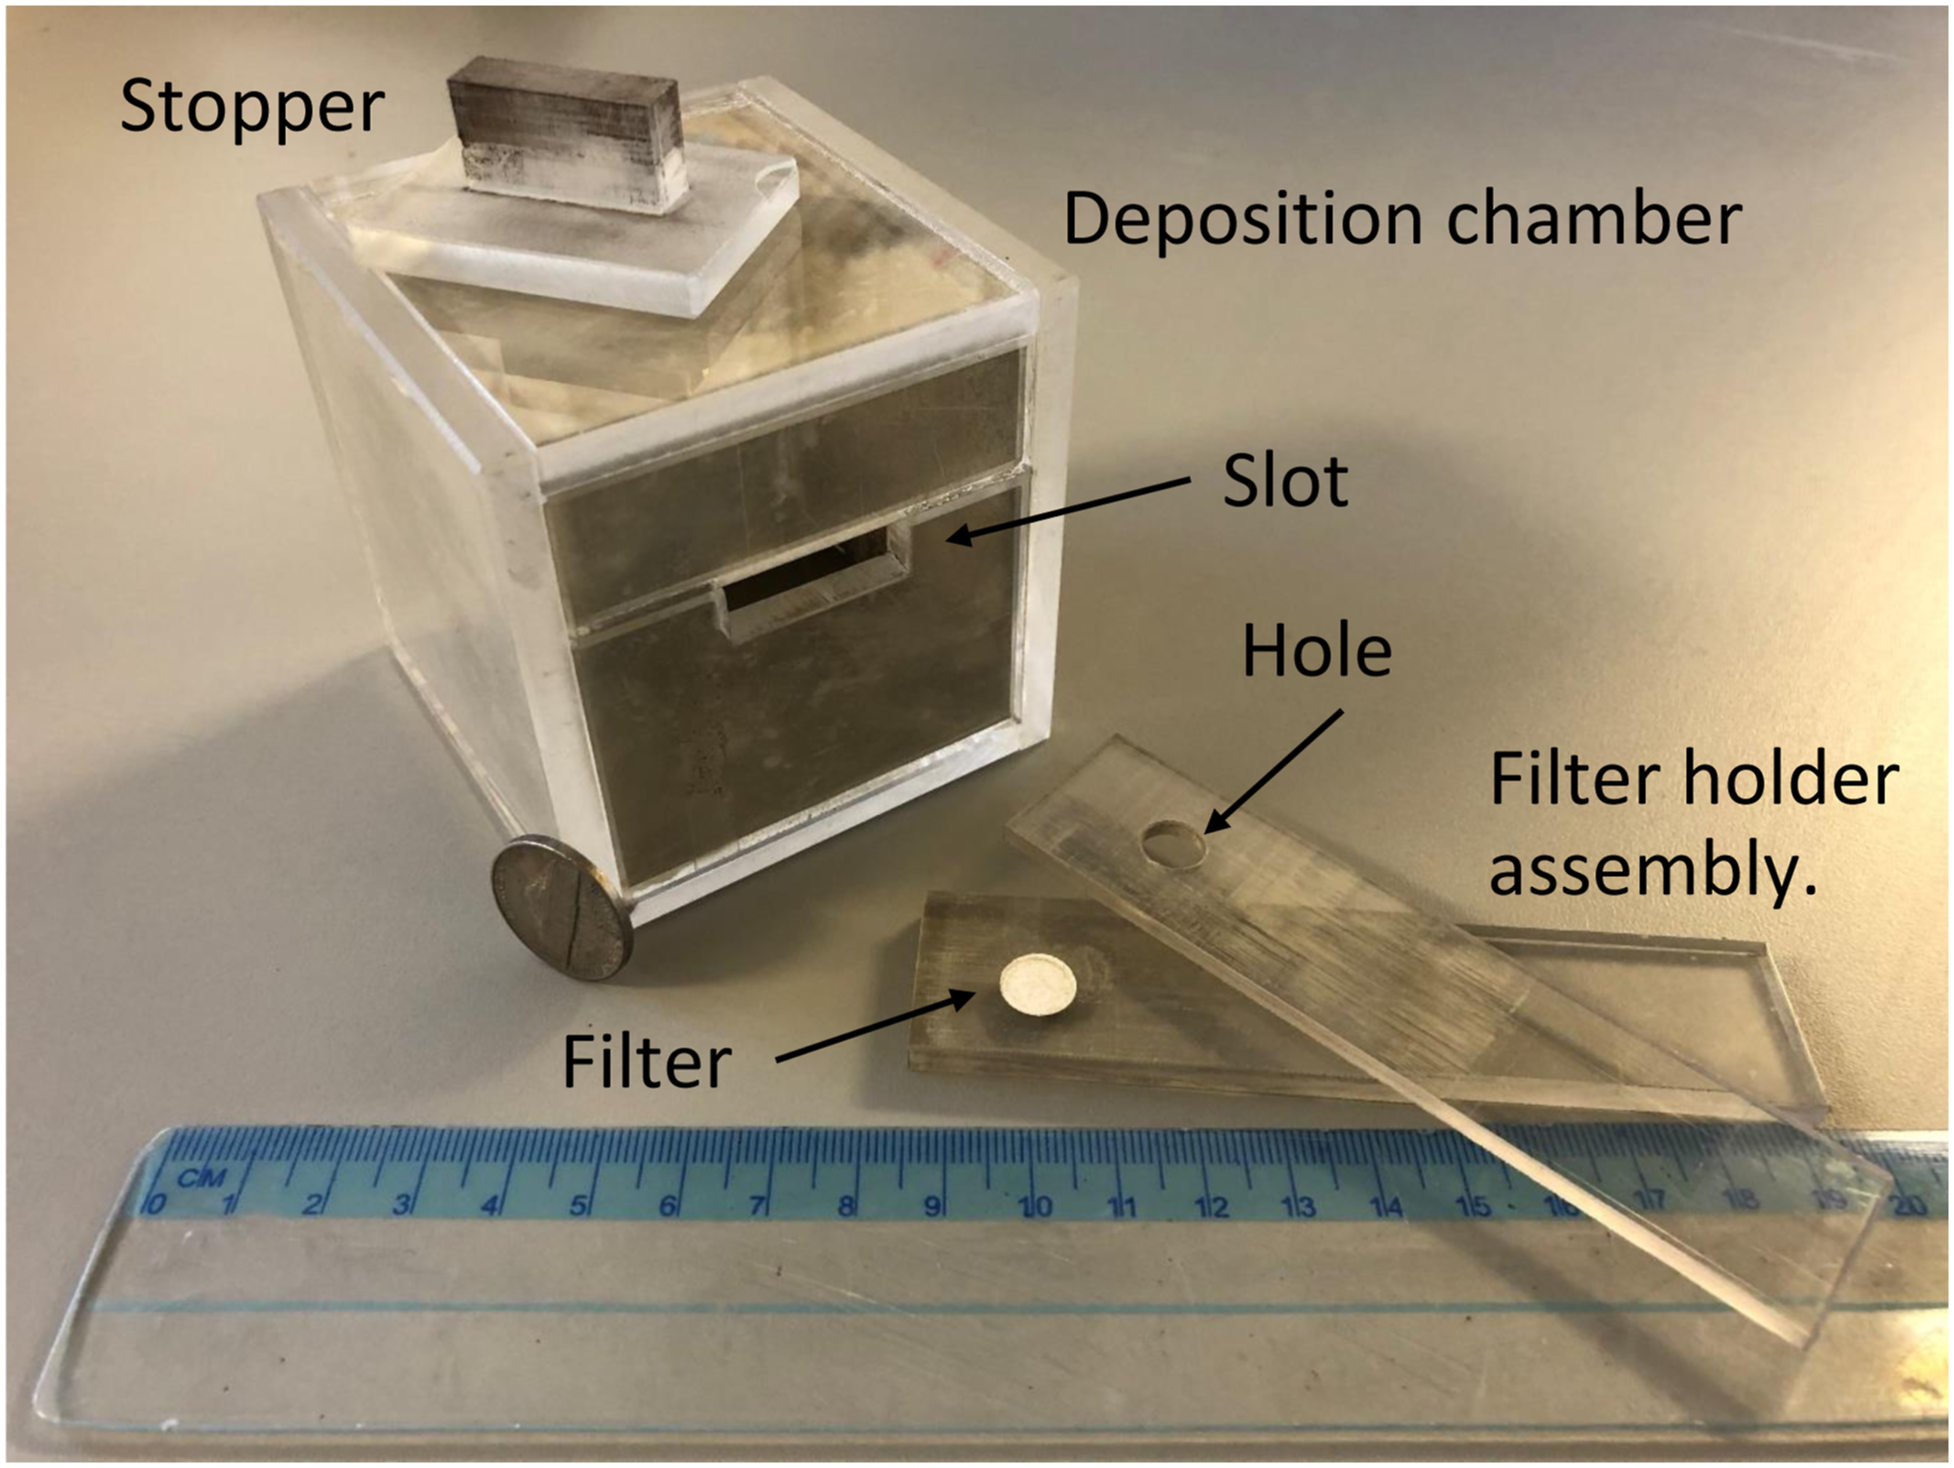
To deposit microparticles upon a nitrocellulose filter, a filter holder assembly (shown in Fig. 1) was designed to securely hold a filter in place and then introduce the filter into the chamber while the MP aerosol was settling to the bottom of the chamber. This filter holder assembly was constructed of two hinged pieces. The bottom piece supported a nitrocellulose filter and the top hinged piece contained an 8.15 mm circular opening which was positioned over the filter. In this way, settling MPs would fall upon the filter when the filter holder assembly was placed into the chamber. The thickness of the filter holder assembly when completely assembled was 8.1 mm, the same thickness as the slot, creating a fairly tight seal to prevent any Ag MPs from leaving the chamber when it was in place. The filter holder assembly was designed to hold a filter in the geometric center of the chamber with respect to the width and depth of the chamber, the center of the filter being 31.75 mm from the front and back walls, as well as both side walls. As noted above, the filter was intentionally not centered vertically in the chamber.
To deposit MPs upon a filter, a clean filter was positioned on the lower piece of the filter holder assembly and the top piece was clamped down on top of it to hold the filter securely in place. With the stopper in place, the chamber was manually agitated and then set on a stationary surface as described above. The choice of the agitation time is discussed below. After a certain amount of time (the waiting time) had passed, the stopper was removed and the filter holder assembly was slid quickly into place. The removal of the stopper and the insertion of the filter holder assembly took one to two seconds. The choice of the waiting time is discussed below. Once inserted, the filter holder assembly was kept in place for a variable amount of time (the settling time) as the MPs settled upon the filter surface. An investigation of the settling time is presented below in the Discussion section. During this settling time a fine layer of MPs would settle on the filter through the hole in the filter holder assembly, uniformly coating the filter with a small mass of silver MPs. The filter holder assembly was then carefully removed from the chamber which took several seconds and the stopper was re-inserted into the chamber slot. The filter holder assembly was then unhinged and the Ag MP-coated filter could be removed for use in LIBS experiments.
Due to the vertical asymmetry of the chamber, the deposition could be performed with the filter having 19.9 mm of space between its upper surface and the roof of the chamber if the chamber was positioned with the slot being above the midline of the chamber, as is shown in Fig. 1. However, if the chamber was inverted 180°, there would be 36.3 mm of space from the upper surface of the filter to the roof of the chamber. Due to the sealed nature of the chamber, no other investigation of this vertical position was possible. All experiments were performed with the filter positioned above the midline of the chamber (19.9 mm of space above it, as shown in Fig. 1) because the intent was to collect only the smallest and lightest MPs upon the filter. Using the chamber in the inverted orientation, using too long a settling time, or using too short a waiting time tended to deposit too much mass of silver. This was evidenced by subsequent mass measurements and the observation of scorching of the nitrocellulose filter medium during 1064 nm laser ablation. This scorching was only observed when a significant mass of silver was deposited. It was this scorching of the filter medium that actually motivated the construction of this chamber which allowed the controlled deposition of tens of micrograms of silver which would not lead to scorching.
Bacterial Deposition
The Ag MP-coated filters thus prepared were then used as filtration media upon which bacterial cells were deposited as has been described in detail elsewhere.21,22 Briefly, these filters were secured in a custom-fabricated centrifuge tube insert. A light-weight hollow aluminum cone was fabricated to fit within the top of the centrifuge insert. When in place, the apex of the metal cone, which contained a 1 mm diameter hole through which liquid could pass, was pressed slightly into the surface of the filter medium. 1.5 mL of a suspension containing bacterial cells was pipetted into the cone in the top of the centrifuge insert which was then placed in a standard centrifuge tube and centrifuged at 5000 rpm generating 2500 g-force for five minutes. During centrifugation, the cone forced the liquid through the 1 mm diameter opening, concentrating all the bacterial cells onto an easily identifiable central region of the nitrocellulose filter. After centrifugation, the insert was disassembled and the filter was removed and mounted for LIBS testing.
Liquid suspensions of Escherichia coli, Mycobacterium smegmatis, and Enterobacter cloacae were prepared after culturing on solid growth media and washing of the cells with de-ionized water. Cells were then suspended in pure de-ionized water and uniform concentrations were achieved by monitoring the fluid concentration using optical densitometry. 1.5 mL aliquots of these suspensions were pipetted into the centrifuge cone for testing.
Laser-Induced Breakdown Spectroscopy
The LIBS apparatus and protocol utilized to obtain MP-enhanced LIBS spectra has been described in detail previously.21–23 The apparatus utilized a 1064 nm neodymium-doped yttrium aluminum garnet (Nd:YAG) pulsed laser (Quanta Ray LAB-150-10, Spectra Physics) to generate laser-induced plasmas. Pulse energies at the target sample were 8 mJ. The Nd:YAG laser operated with a 10 Hz repetition rate and produced pulses with a 10 ns pulse duration. The pulses were focused down to a diameter of 75 µm using an AR-coated 5× microscope objective with a 40 mm working distance. All ablations were performed in an atmospheric pressure argon environment with an argon purge at a flow rate of 567 L/h.
Light from the laser-induced plasma was directed into a 1 m steel-encased multimodal optical fiber using two matching off-axis parabolic aluminum mirrors placed in proximity to the plasma. Light emitted from the plasma was detected using an intensified charge-coupled device (ICCD) camera (Kodak KAF 1001) after it was dispersed in an echelle spectrometer (ESA 3000, LLA Instruments, Inc.). The timing of the laser, echelle spectrometer, and gating of the ICCD were controlled with a computer equipped with ESAWIN v3.20 software (LLA Instruments, Inc.). Spectra were acquired at a delay time of 2 μs after plasma formation using an ICCD gate window width of 20 μs. Data were acquired from a single laser shot and the sample was then translated 150 μm to acquire a spectrum from an undisturbed area of the target.
Results
Ag MP Surface Coverage: Mass Measurements
As described above, three experimentally relevant times were investigated: the shaking or agitation time of the chamber before the stopper was removed, the waiting time after shaking before the stopper was removed and the filter holder assembly was inserted, and the settling time during which the airborne silver MPs would settle upon the filter. A shaking time of 30 s was chosen and held consistent for all experiments to deposit silver MPs on the filters. This time was sufficient to generate as much airborne particulate matter as possible and no advantage to extended shaking was observed.
The waiting time is necessary to control both the amount of airborne MPs and also the mass distribution of the MPs. At very long times, all the airborne particulates will have settled to the bottom of the chamber due to gravity. At very early times, too much coverage of the filter resulted, the goal being to deposit a trace but uniform coverage. At slightly longer times, the density and mass of the airborne MPs was changing as the more massive MPs or clusters settled to the bottom of the chamber and the more fine MPs remained aloft. A 10 s waiting time before inserting the filter holder assembly was chosen after several experiments and subsequent visual examination and weighing of the filters.
Using a 30 s agitation time and a 10 s waiting time, five settling times were investigated. Five pairs of filters were weighed using an EA microbalance before and after allowing silver MPs to settle on them for 10, 20, 30, 40, and 50 s. Only one filter could be prepared at a time with our deposition chamber. The average filter mass without silver was approximately 4 mg with less than a 0.5% standard deviation between the 10 measurements. The measured Ag masses deposited for the five settling times is plotted in Fig. 2 and an essentially linear dependence was observed. The uncertainty in the measured mass was due to the resolution of the EA balance. The uncertainty in the settling time was due to a necessary slow removal of the sample holder from the chamber. The linear fit to the data indicates a mass deposition rate of 1.36 μg/s. This fit was constrained to pass through the origin, as no silver at all was present if the filter was not inserted into the deposition chamber. For the 10 s settling time, one of the depositions did not deposit enough powder to be measured by the microbalance within its resolution. For the 20 s and 30 s settling times, the measured masses were the same for both filters of the pair of measurements, appearing as only one datum at each time in Fig. 2. In the case of the 50 s settling times, too much Ag mass was deposited on the filter, leading to scorching of the filter during ablation. The ability to measure MP masses below the microgram range accurately was not physically achievable using only the microbalance, so a settling time between the lower and upper deposition limits was chosen. Based on the consistency and observable coverage of each pair of filters, the 30 s settling time was chosen as the most reproducible deposition time. The mass of Ag MPs deposited upon 10 nitrocellulose filter media for five settling times after 30 s of agitation and a waiting time of 10 s. Masses were obtained for the filters before and after MP deposition using an EA microbalance. The pair of filters with a 20 s settling time possessed an identical mass of Ag within the reading uncertainty of the EA microbalance, as did the pair of filters with a 30 s settling time. A linear fit to the data constrained to pass through the origin was performed to estimate the mass deposition rate, yielding a result of 1.36 μg/s.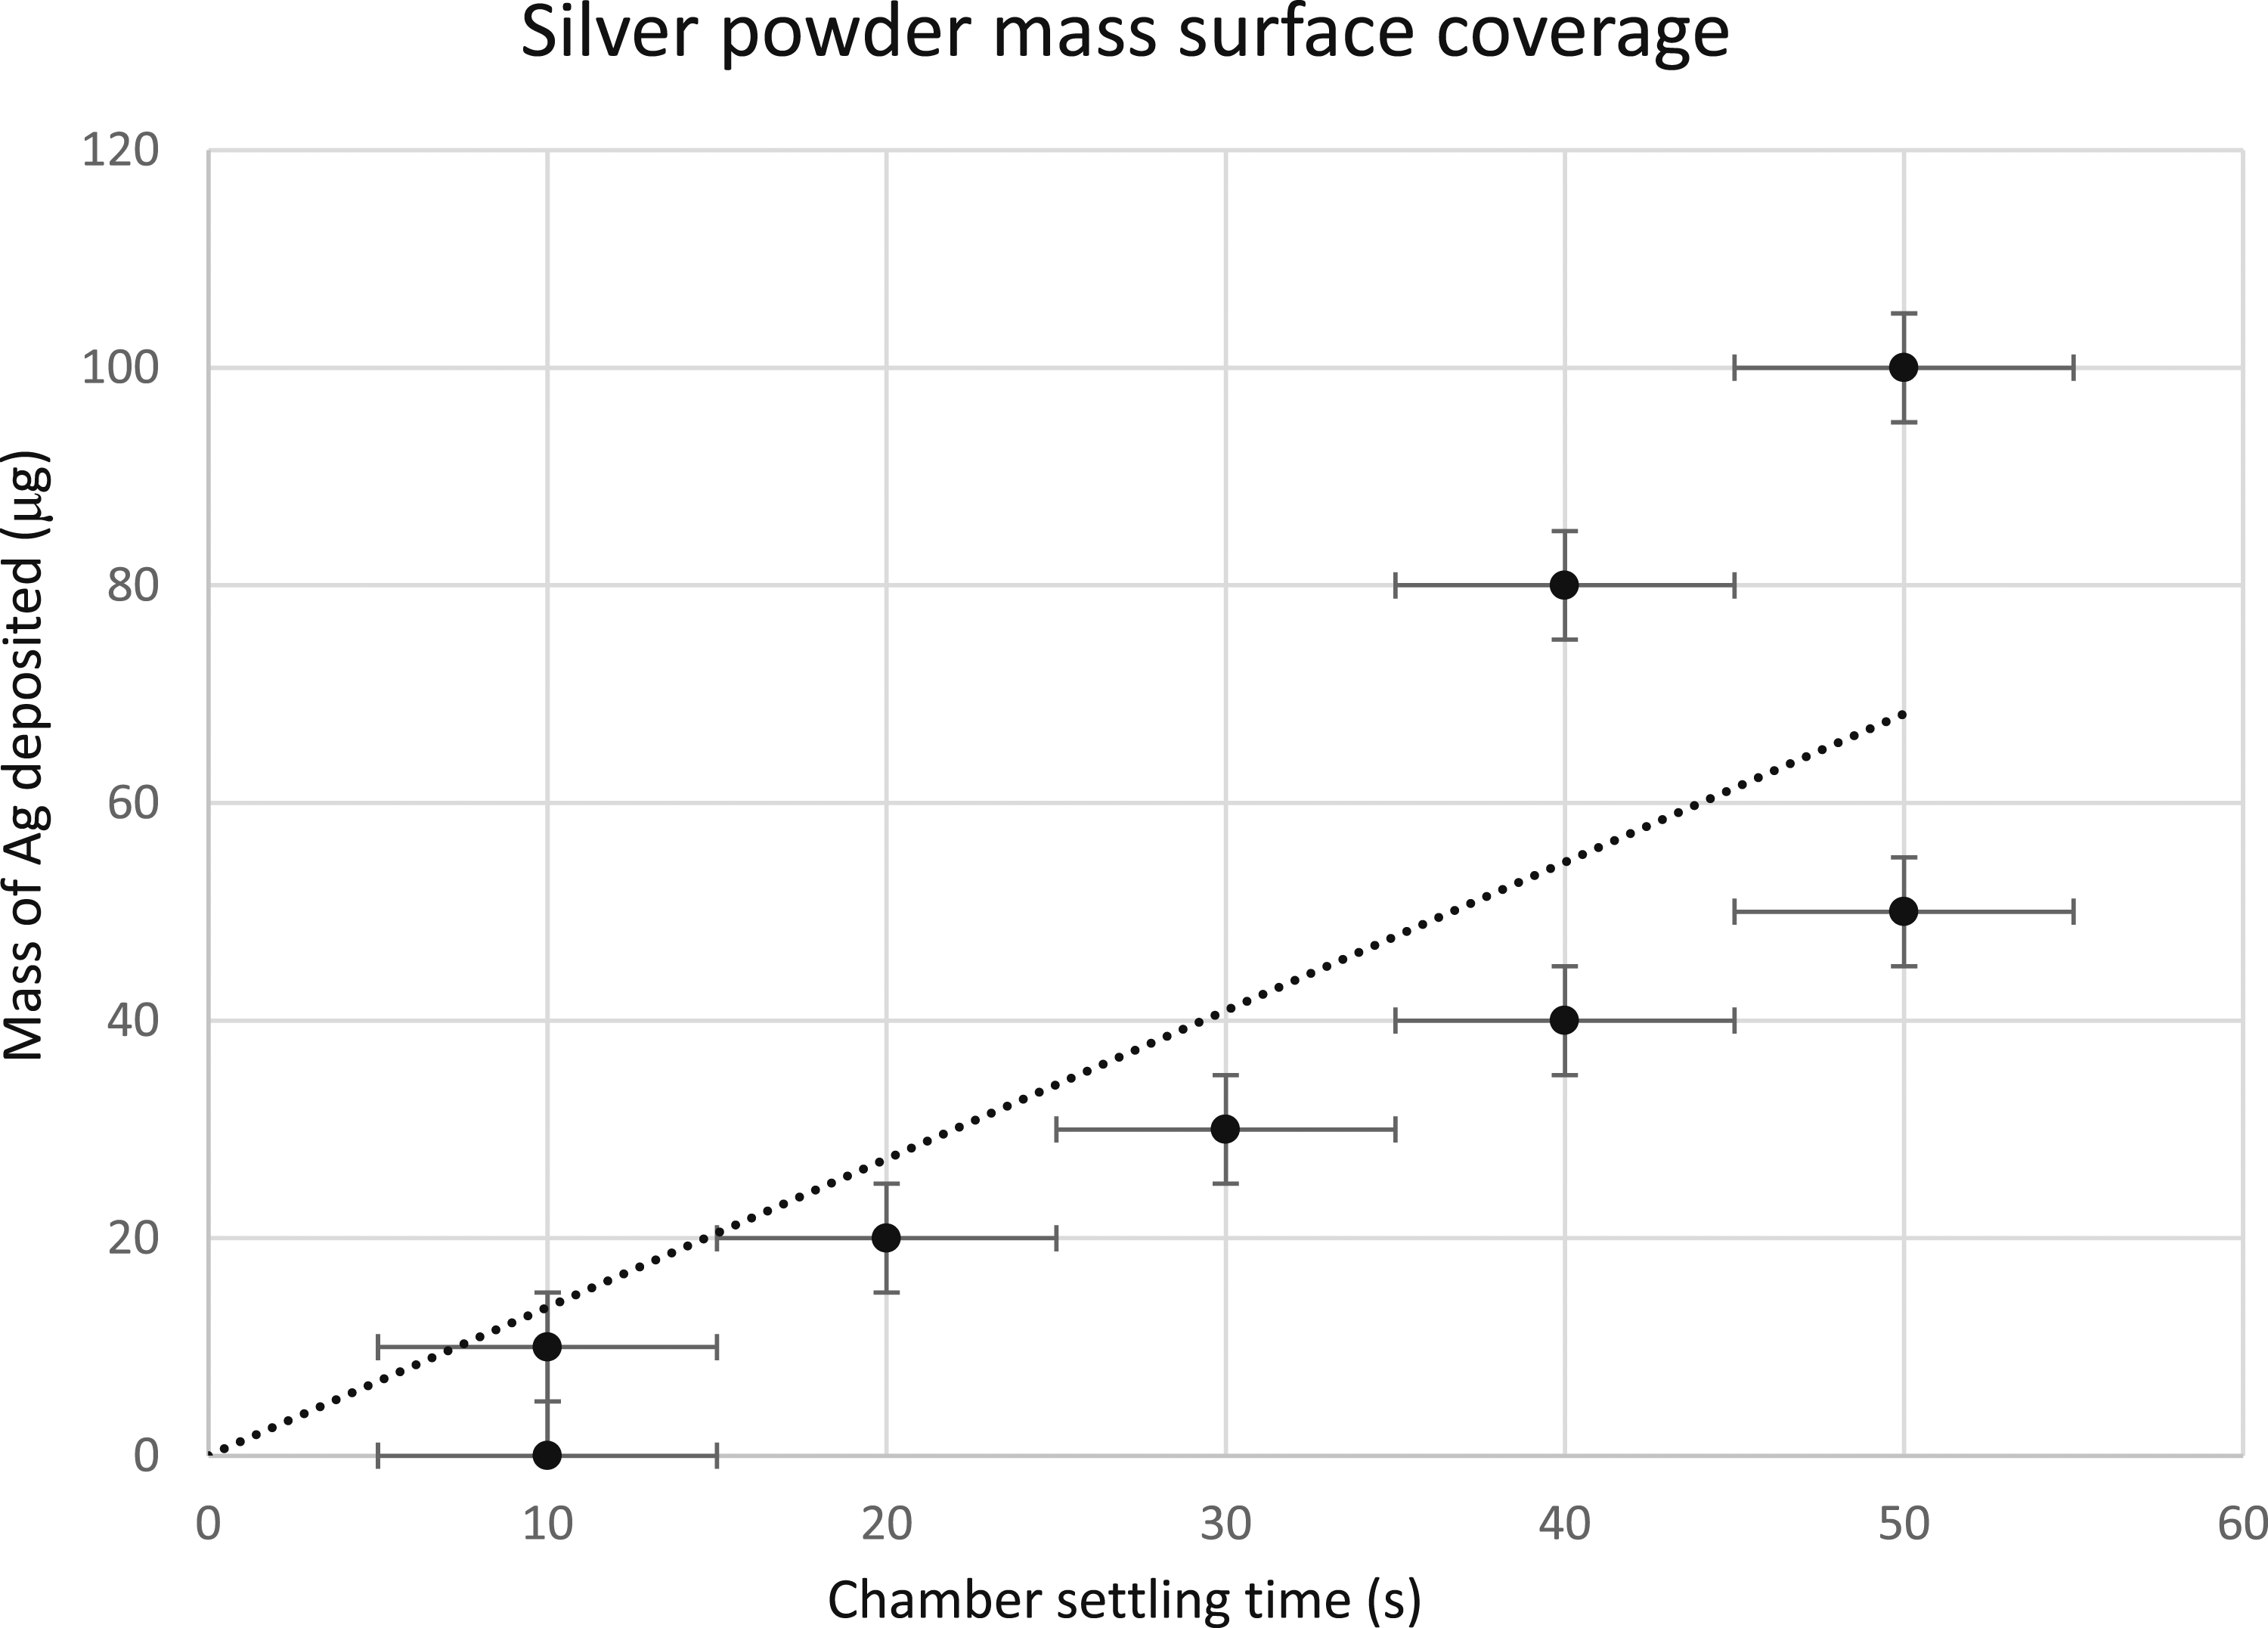
Ten additional filters were prepared using only the 30 s settling time and the masses were determined using the EA microbalance. The diameter of the circular opening in the filter holder assembly was used to determine the area of the exposed filter surface upon which MPs were deposited. This deposition area was 52.18 mm2. The average amount of silver MPs deposited and measured by the EA microbalance on the surface of the filters after a 30 s settling time was 39 μg ± 17 μg (one standard deviation). Assuming uniform surface density, confirmed by visual inspection and scanning electron microscopy, this resulted in a surface mass density of 0.75 μg/mm2 or 7.5 x 10⁻⁷ μg/μm2. For a 30 s settling time, this resulted in a final surface mass density deposition rate of 2.5 x 10⁻⁸ μg/μm2⋅s. In the later LIBS experiments, ablation was performed with a 75 μm diameter laser pulse, yielding single laser shot silver mass ablation of 3.3 x 10⁻³ μg or 3.3 ng per laser shot.
Ag MP Surface Coverage: Scanning Electron Micrographs
Diluted bacteria suspensions were prepared in sets of two from initial aliquots of E. coli, M. smegmatis, and E. cloacae and tested with LIBS. Each of the pair of suspensions was deposited onto both an unaltered nitrocellulose filter and a nitrocellulose filter coated with trace amounts of Ag MPs deposited using the deposition chamber with a 30 s settling time. In addition, LIBS spectra from “blank” filters and filters with Ag MPs and no bacteria were acquired.
Scanning electron micrographs of the filters with and without Ag MPs after laser ablation as well as filters with bacteria deposited upon them are provided in Fig. 3. In Fig. 3a, the cellulose structure of the filter is easily observed and in Figs. 3b–3d the uniform deposition of the silver MPs can be seen relative to the size of the 75 μm ablation crater. The silver MPs show up as very bright white particulates with highly uniform size in these backscatter mode micrographs. Micrographs taken of the bacterial film deposited upon the Ag MPs do not clearly show the MPs although more are visible through the film in the higher magnification image in Fig. 3f. Individual bacterial cells are not distinguishable or clearly visible in these scanning electron micrographs (SEM) which were acquired with optimized conditions to show the Ag MPs. Also, the fragile cells were often damaged during imaging which was performed in a relatively high-pressure environmental SEM which allowed the imaging of biological materials without a traditional conducting thin film coating. A micrograph taken of a filter that more clearly resolves the micron-sized bacterial cells is shown in Figure S1 (Supplemental Material) for comparison. Scanning electron micrographs micrographs of (a) LIBS ablation craters on a blank nitrocellulose filter, 500x magnification. (b) LIBS ablation craters on a nitrocellulose filter coated with Ag MPs deposited using the deposition chamber, 500x magnification. The metallic silver MPs appear as bright white dots in the SEM backscatter-mode images. The laser ablation crater is approximately 75 µm in diameter. (c) LIBS ablation crater on a nitrocellulose filter coated with Ag MPs deposited using the silver chamber, 1000x magnification. (d) Ag MPs deposited on nitrocellulose filter 4000x magnification. Ag MPs are approximately 0.5–1 μm size compared to the 10 μm scale. (e) LIBS ablation crater on a nitrocellulose filter coated with Ag MPs deposited using the silver chamber, with Escherichia coli bacterial cells deposited onto the silver-coated filter, 1000x magnification. (f) Ag MPs and Escherichia coli bacterial cells deposited on nitrocellulose filter 4000x magnification. Larger Ag MPs and Ag MPs closer to the surface are visible in white, while a majority of the silver MPs are hidden underneath the film of bacteria.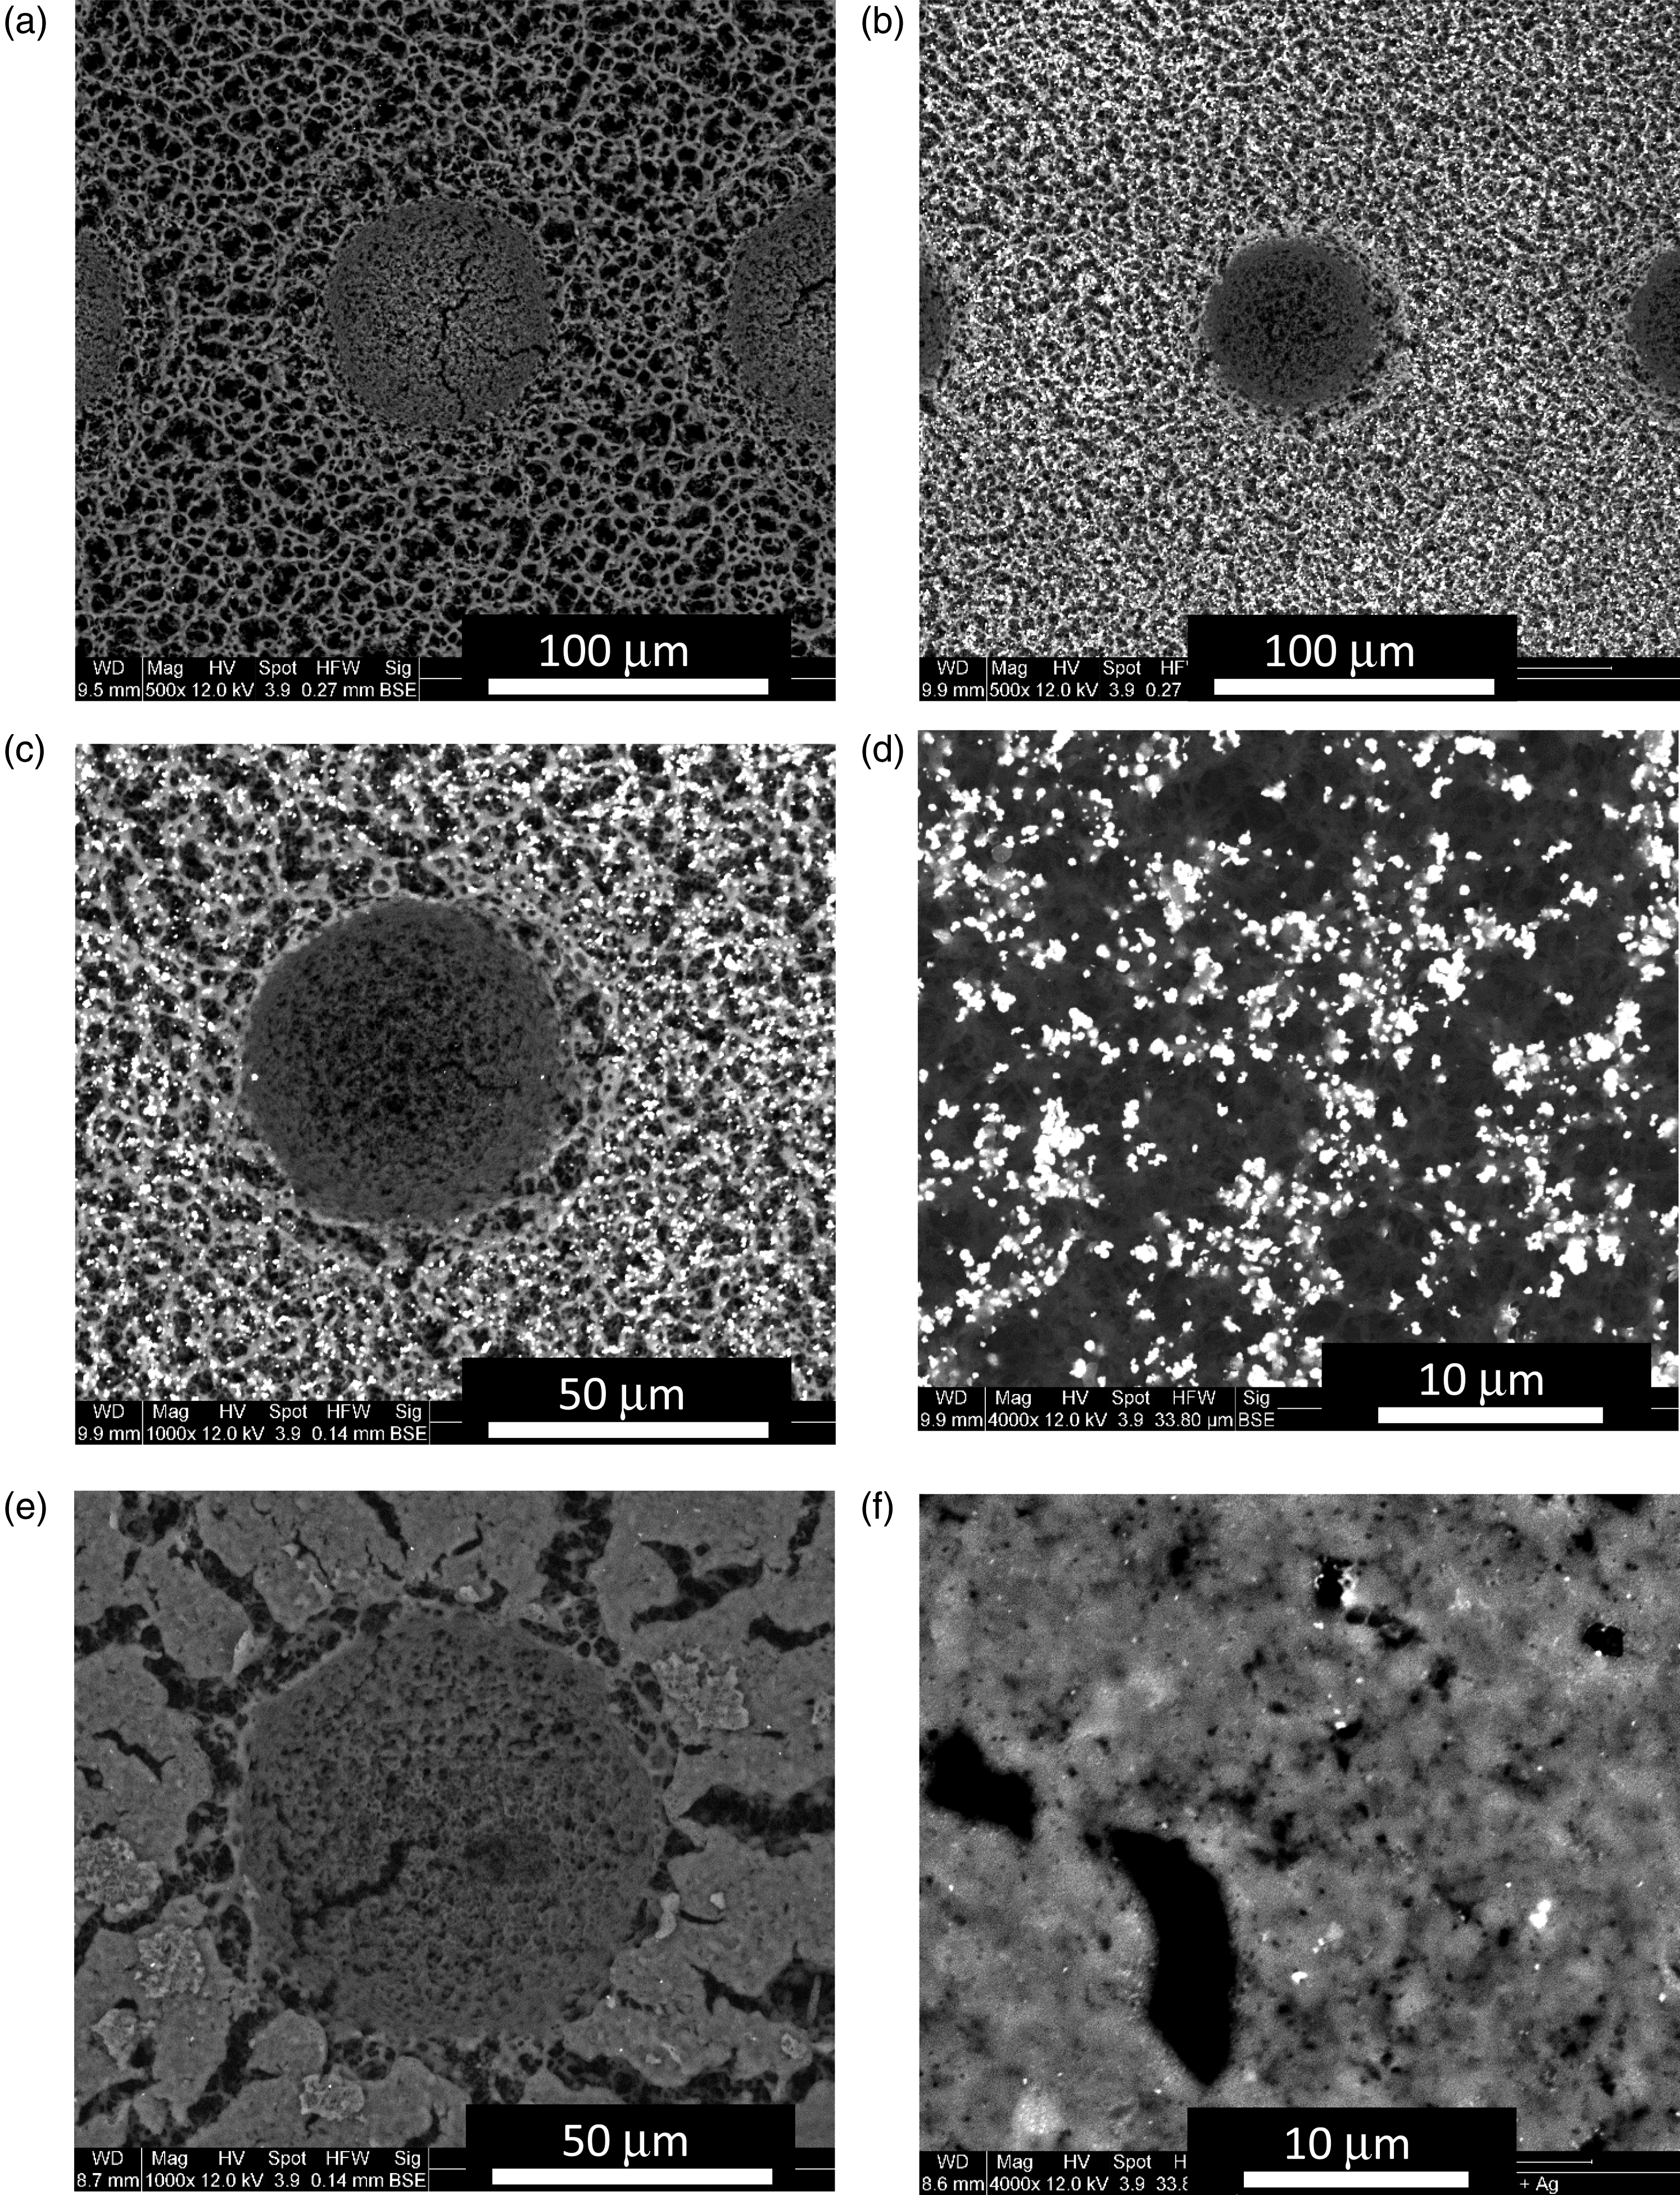
Ag MP-LIBS: Blank Filter Versus Filter with Microparticles
Twenty single-shot LIBS spectra were acquired on each filter and the background-subtracted integrated area under the curve of the observed elemental emission lines in each spectrum was calculated. Spectra could also be averaged together in the ESAWIN software prior to emission line intensity measurement to reduce the noise and improve the visibility of certain lines. Figure 4 shows two averaged spectra, a LIBS spectrum from a blank nitrocellulose filter (Fig. 4a), and a LIBS spectrum from an Ag MP-coated filter (Fig. 4b). Both spectra are the average of 10 single-shot spectra. Notable emission lines are identified in Fig. 4a, specifically the carbon emission line at 247 nm and the CN molecular emission band at 388 nm (which was not analyzed in this work) which both arose completely from the nitrocellulose filter medium. The argon lines were due to ablation in the argon environment. No other lines of any appreciable intensity were ever observed in the single-shot filter spectra. Importantly, none of the elemental emission lines observed in the bacterial spectra shown below were ever reliably detected or quantifiable in the single-shot LIBS spectra from the filter medium. Averaged spectra acquired from 10 single-shot laser-induced breakdown spectroscopy spectra obtained from (a) a blank nitrocellulose filter and (b) a filter coated with Ag MPs deposited with the deposition chamber (30 s settling time). Notable elemental emission peaks are labeled, including significant emission from neutral (Ag(I)) and singly-ionized (Ag(II)) silver. Each laser shot ablated approximately 3.3 ng of Ag microparticles. Molecular emission from the CN molecule created by ablation of the nitrocellulose filter was observed but not measured. All spectra were acquired in an argon environment.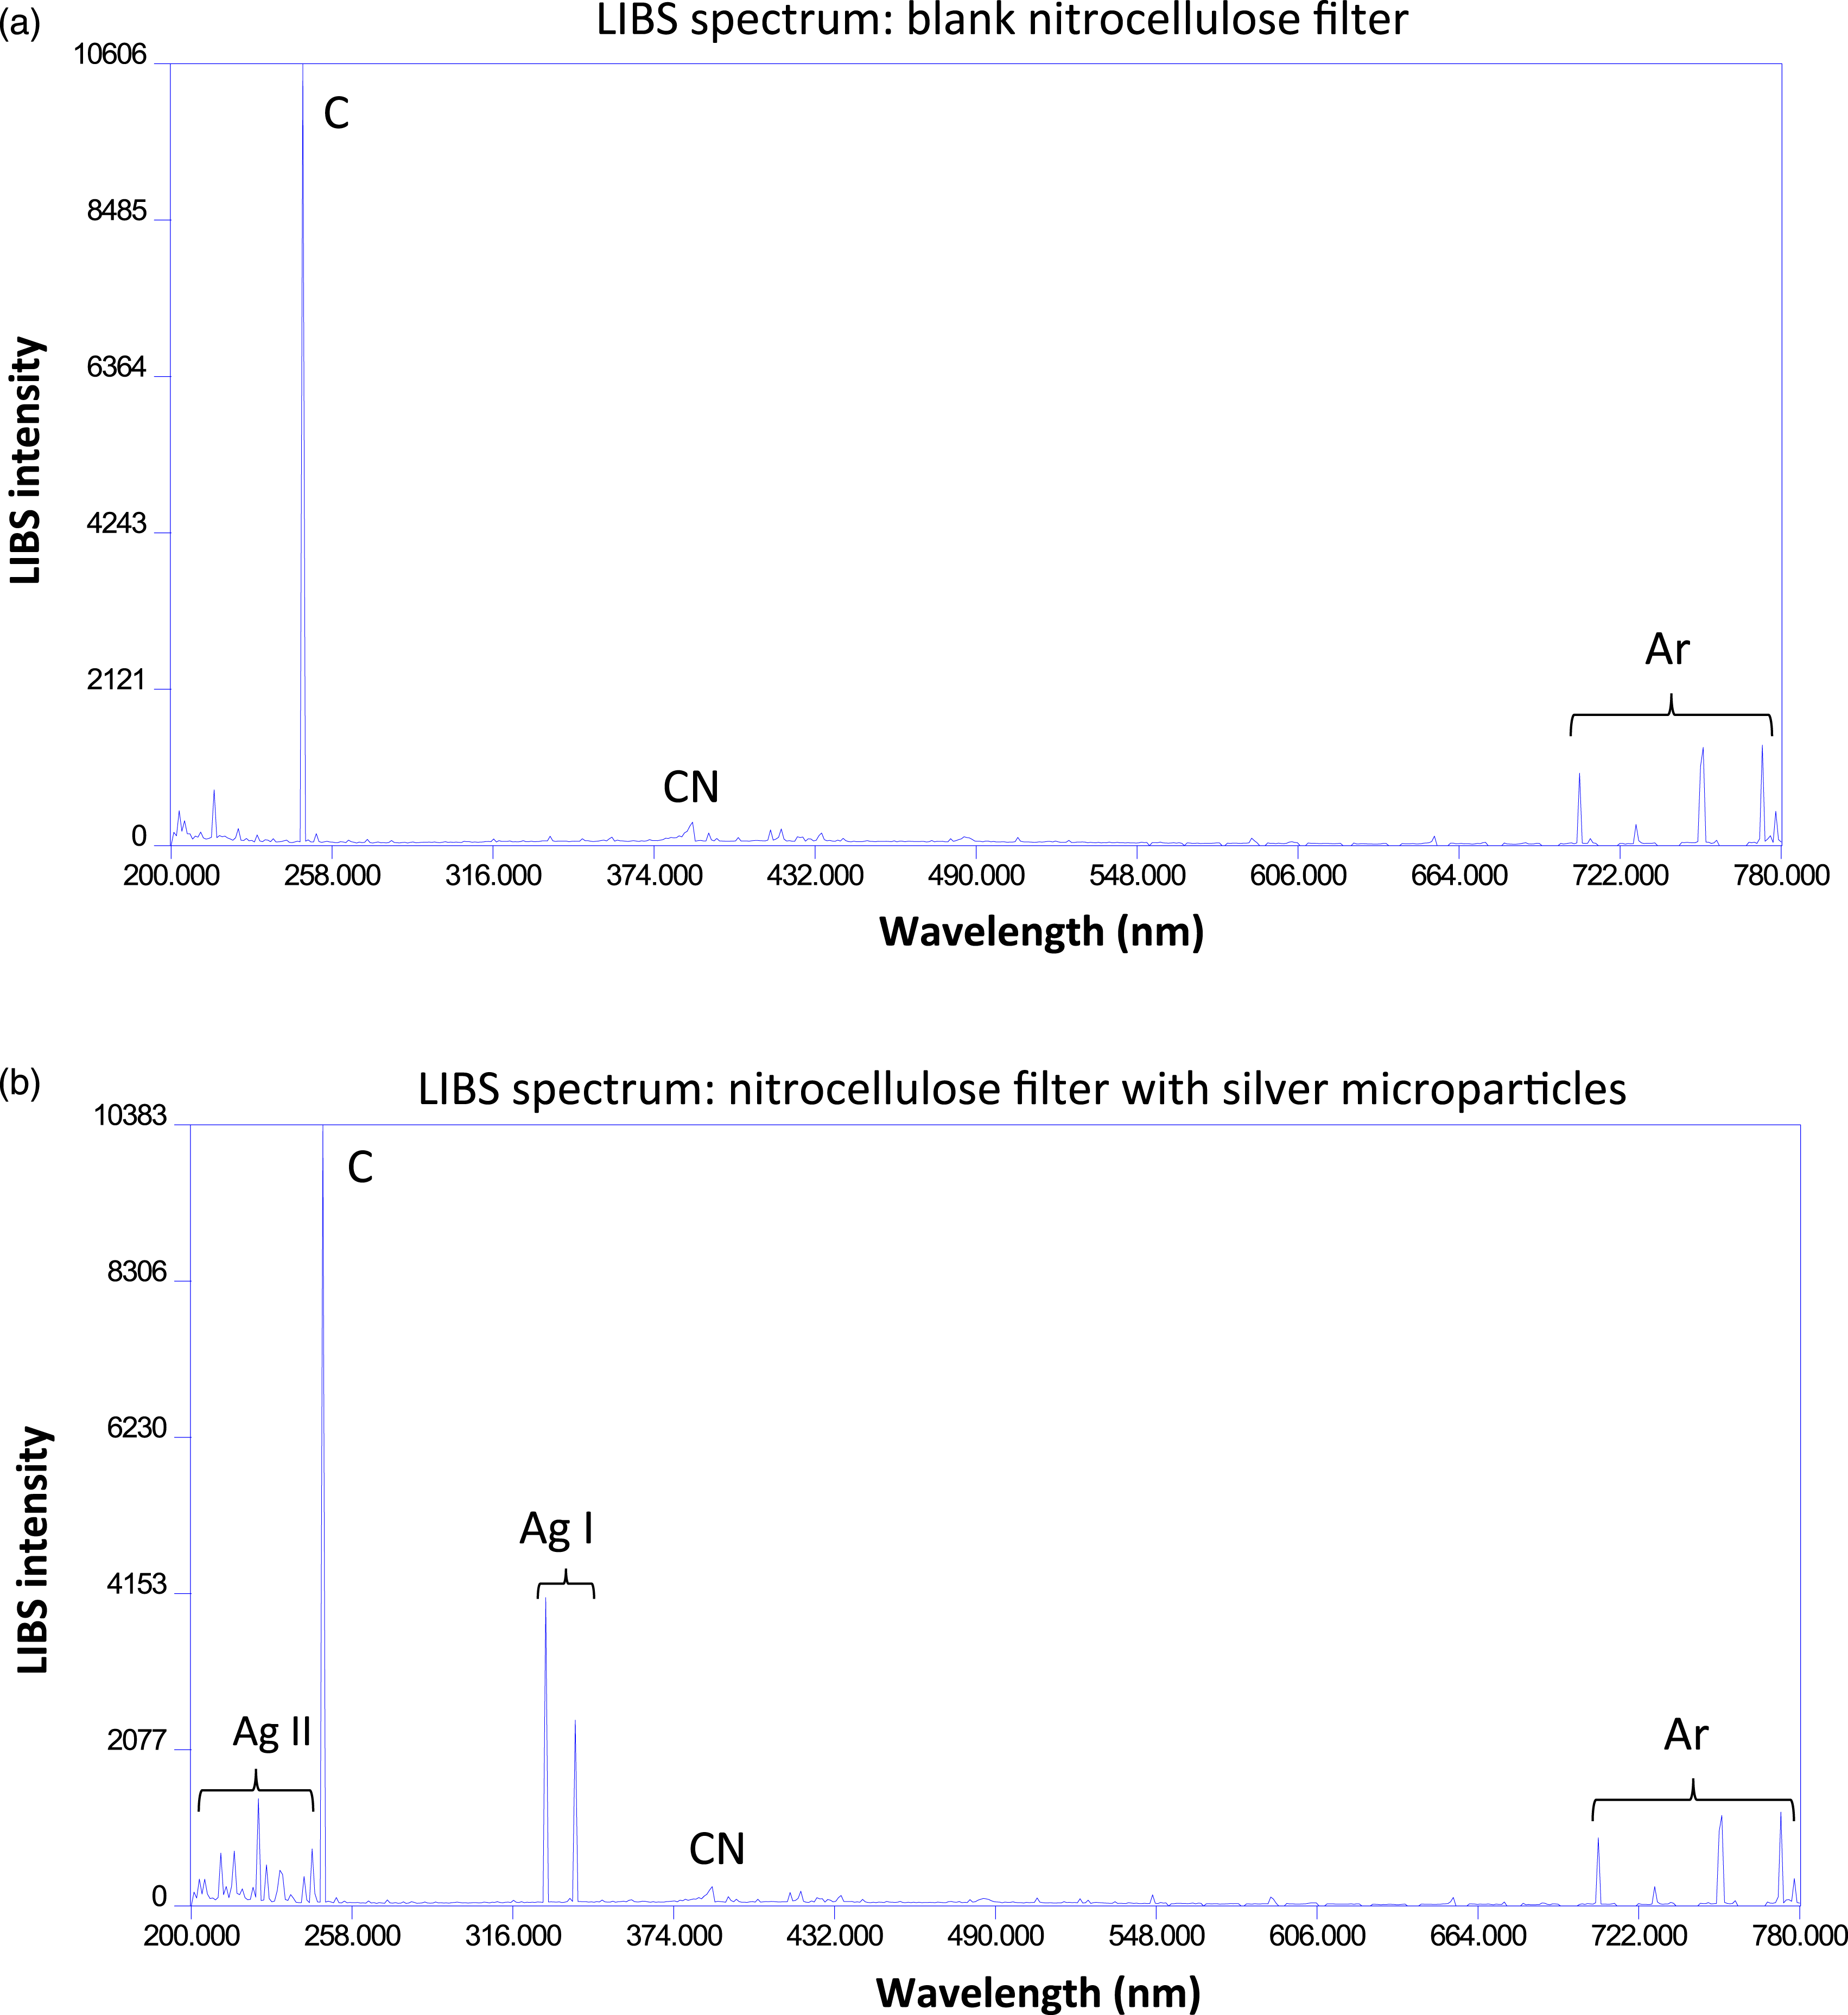
Silver emission was only ever measured in filters introduced to the deposition chamber as is shown in Fig. 4b. At the 2 μs delay times used in these LIBS experiments, the Ag(I) emission lines at 328.07 nm and 338.29 nm dominated the silver emission, although UV Ag(II) emission lines at wavelengths lower than 247 nm were also observed. The deposition experiments described in Fig. 2 were performed to identify a settling time that would result in an Ag MP mass density that would ensure that the silver emission lines would not dominate the spectrum. In the mass regime chosen resulting from a 30 s settling time, the carbon emission line at 247 nm from the ablated nitrocellulose was still the most intense emission feature measured even in the presence of Ag MPs. Increased Ag deposition such as what was deposited with a 50 s settling time altered this and led to scorching of the filter and a domination of the spectrum by silver emission. It can be seen in Fig. 4b that other emission features in the LIBS spectrum such as the CN molecular band emission at 388 nm and the Ar emission lines from the buffer gas were essentially unaffected by the presence of the Ag MPs.
Ag MP-LIBS: Bacteria on Blank Filter Versus Bacteria on Filter with Microparticles
Figure 5 shows averaged spectra calculated from 20 single-shot LIBS spectra from E. coli deposited on a blank filter (Fig. 5a, red) and E. coli deposited on an Ag MP-coated filter (Fig. 5b, black). While the C, CN, Ag, and Ar lines are similar to what was seen in Fig. 4, elemental emission lines due to elements present purely in the bacterial cell are now visible in Figs. 5a and 5b. Nineteen emission lines from C, P, Ca, Mg, and Na have been used in our previous studies for the analysis of the bacterial LIBS spectrum.
21
Other than the carbon 247 nm line, these 19 lines were not observed in the single-shot LIBS spectra from the filtration medium and are almost wholly attributable to the presence of the bacterial cells. These emission lines are identified in Table S1 (Supplemental Material). Averaged spectra calculated from 20 single-shot laser-induced breakdown spectroscopy spectra from E. coli deposited on (a) a blank filter (red) and E. coli deposited on (b) an Ag MP-coated filter (black). Both spectra were acquired at a delay time of 2 μs. Identical aliquots of E. coli were deposited on the two filters, but the presence of the Ag MPs caused increased emission from all of the measured lines, including carbon, which is primarily attributable to the ablation of the underlying nitrocellulose filter medium. Emission from all the other elements (except for Ar) is attributable only to the bacterial cells, including the important phosphorus emission. Both spectra are plotted with the same vertical scale.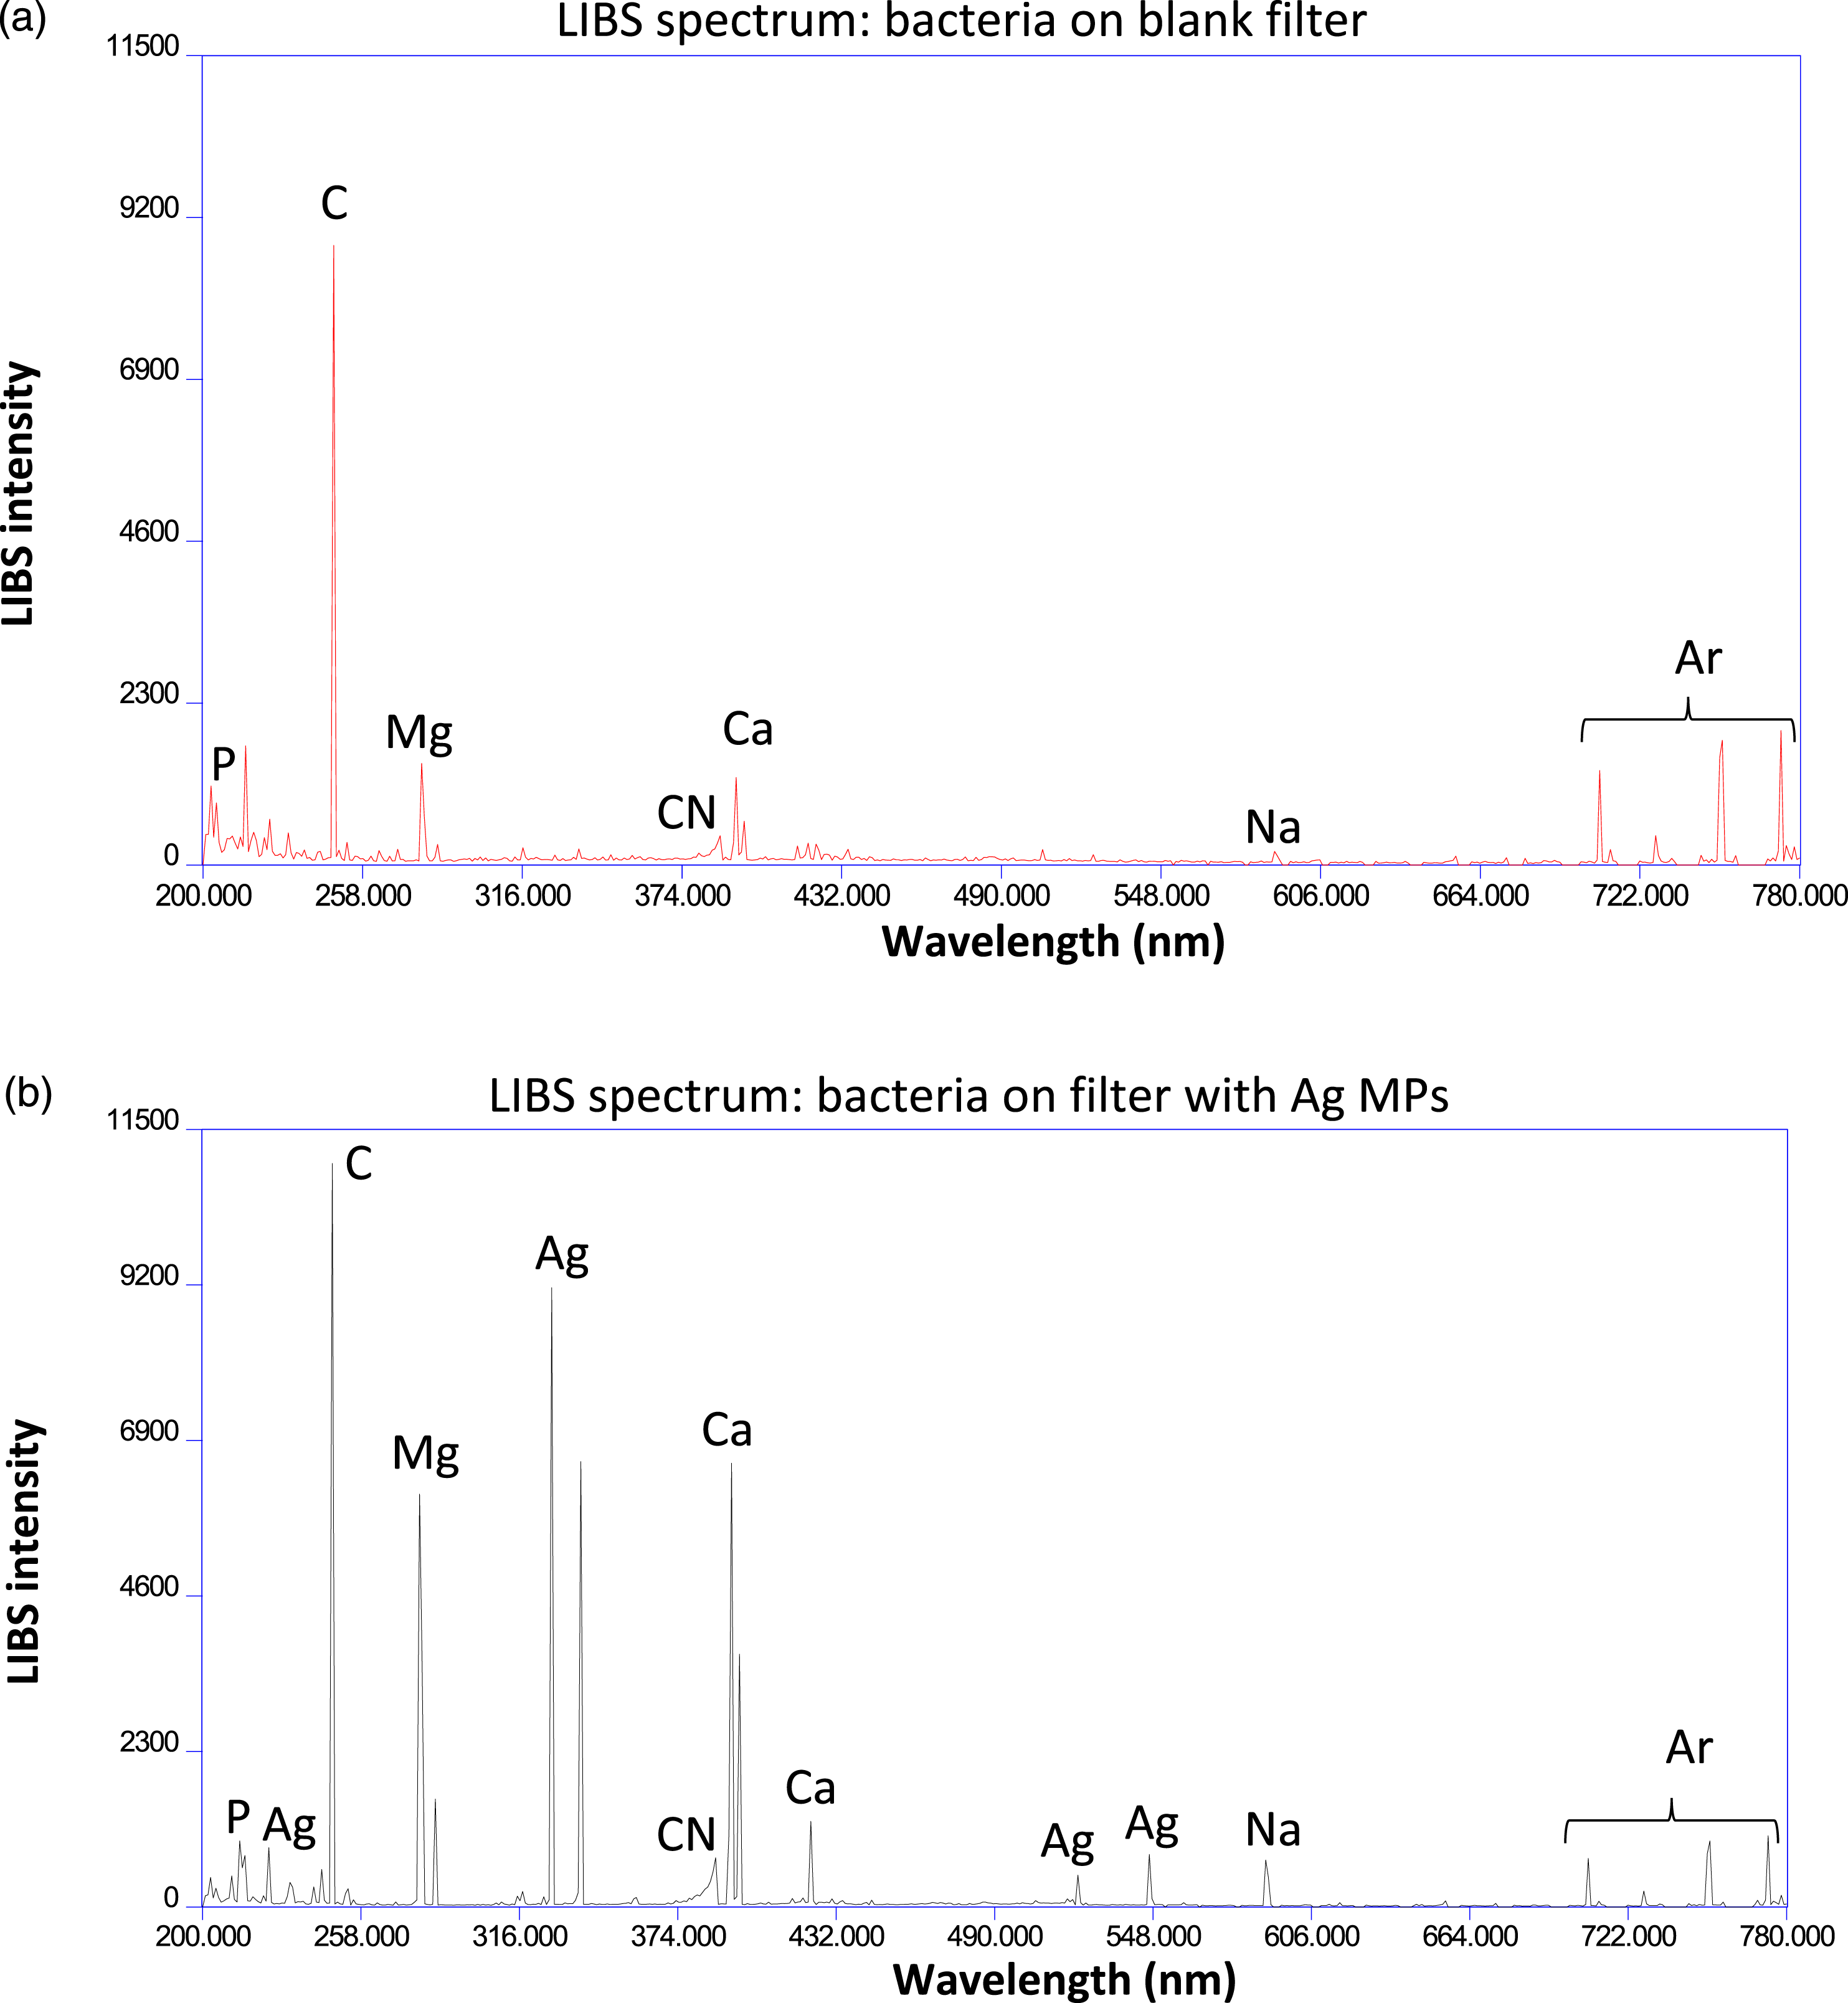
Figures 5a and 5b show enhancement of the neutral and ionic magnesium lines, the neutral and ionic calcium lines, the neutral sodium lines, and importantly, all of the neutral phosphorus lines. The carbon line which is mostly attributed to the underlying nitrocellulose filter experienced the least enhancement relative to the other elements. Figure S2 shows an overlay of the two spectra shown in Fig. 5 in six zoomed in spectral regions containing emission lines from all five of the important elements to allow a clearer appreciation of the relative sizes of the emission lines in the presence and the absence of the Ag MPs.
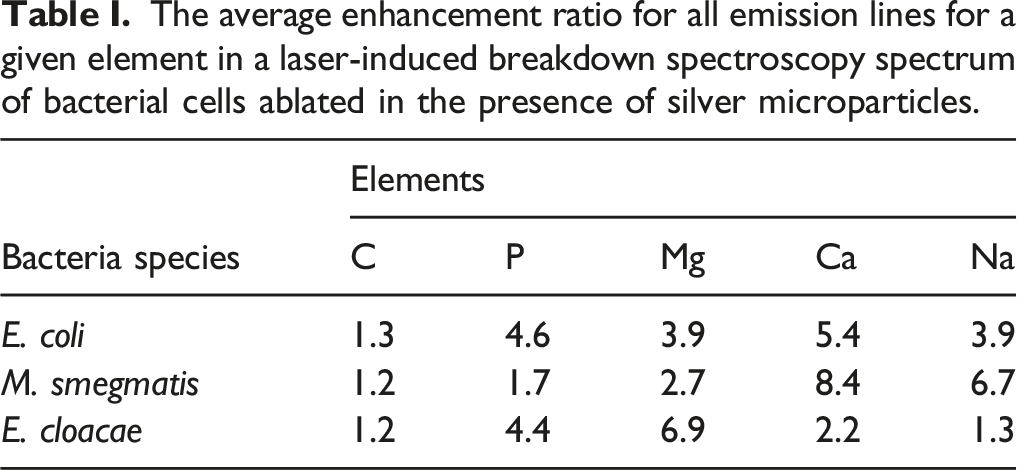
The average enhancement ratio for all emission lines for a given element in a laser-induced breakdown spectroscopy spectrum of bacterial cells ablated in the presence of silver microparticles.
Discussion
The use of the silver deposition chamber was effective in creating a temporary Ag aerosol which quickly settled under the influence of gravity. Reasonable linearity for mass deposition as a function of time was observed using this method. Variations in the deposited mass of Ag for a given deposition time still need to be reduced. Explanations for the variation in measured mass include residual microparticles lying on top of the filter holder assembly being brushed into the filter aperture during removal of the assembly from the box. Small amounts of the Ag powder attached itself onto the bottom side of the filters as well.
All of the elements observed in the bacterial spectra experienced an increase in intensity due to the presence of the Ag MPs. Enhancement of the six phosphorus lines was important, as phosphorus emission is a key indicator of the presence of biological matter, while the metallic Ca, Mg, and Na can often be caused by contamination. Therefore any enhancement of the phosphorus emission in future experiments could be a critical step in the reduction of the limit of detection. Figure 6 summarizes the enhancement of representative strong emission lines from the elements of C, P, Mg, Ca, and Na. Spectra obtained from ablation of the filter both with (first row) and without (second row) Ag MPs possessed strong carbon emission, no phosphorus, and trace amounts of Mg, Ca, and Na. These trace amounts were not quantifiable in single-shot spectra, but can be seen in Fig. 6, which is the average of 20 spectra. In the spectra shown, the carbon emission intensity decreased upon deposition of the bacteria (third row) due to the shielding effect of the bacterial film resulting in reduced ablation of the nitrocellulose filter medium. Appreciable emission from Mg, Ca, and Na was observed due to the presence of the bacterial cells. No measurable phosphorus emission was measured for the particular line shown, but was in evidence in the stronger line at 213.618 nm. In the presence of the Ag MPs (fourth row), all of the emission lines including carbon showed an enhancement in emission intensity relative to the spectrum of bacteria acquired on a blank filter only. Comparison of absolute emission intensities of five lines of interest from C, P, Mg, Ca, and Na obtained from spectra in Figs. 4 and 5. The number under each region of interest is the center wavelength of the emission line (in nm) and the value above each region of interest is the integrated area under the curve, which is the emission intensity for that line (in arbitrary units). Carbon emission stayed relatively constant, only exhibiting a decrease in intensity when bacteria were deposited upon the filter, resulting in less nitrocellulose filter ablation. Phosphorus peaks were noticeably enhanced with the addition of Ag, but were not seen in any spectra from the filtration medium alone. Magnesium, calcium, and sodium were present in trace amounts in the filtration medium and emission was observable only in averaged spectra but never in single-shot spectra. Significant emission was observed from these elements due to the deposition of bacteria and that emission was enhanced due to the presence of the Ag MPs.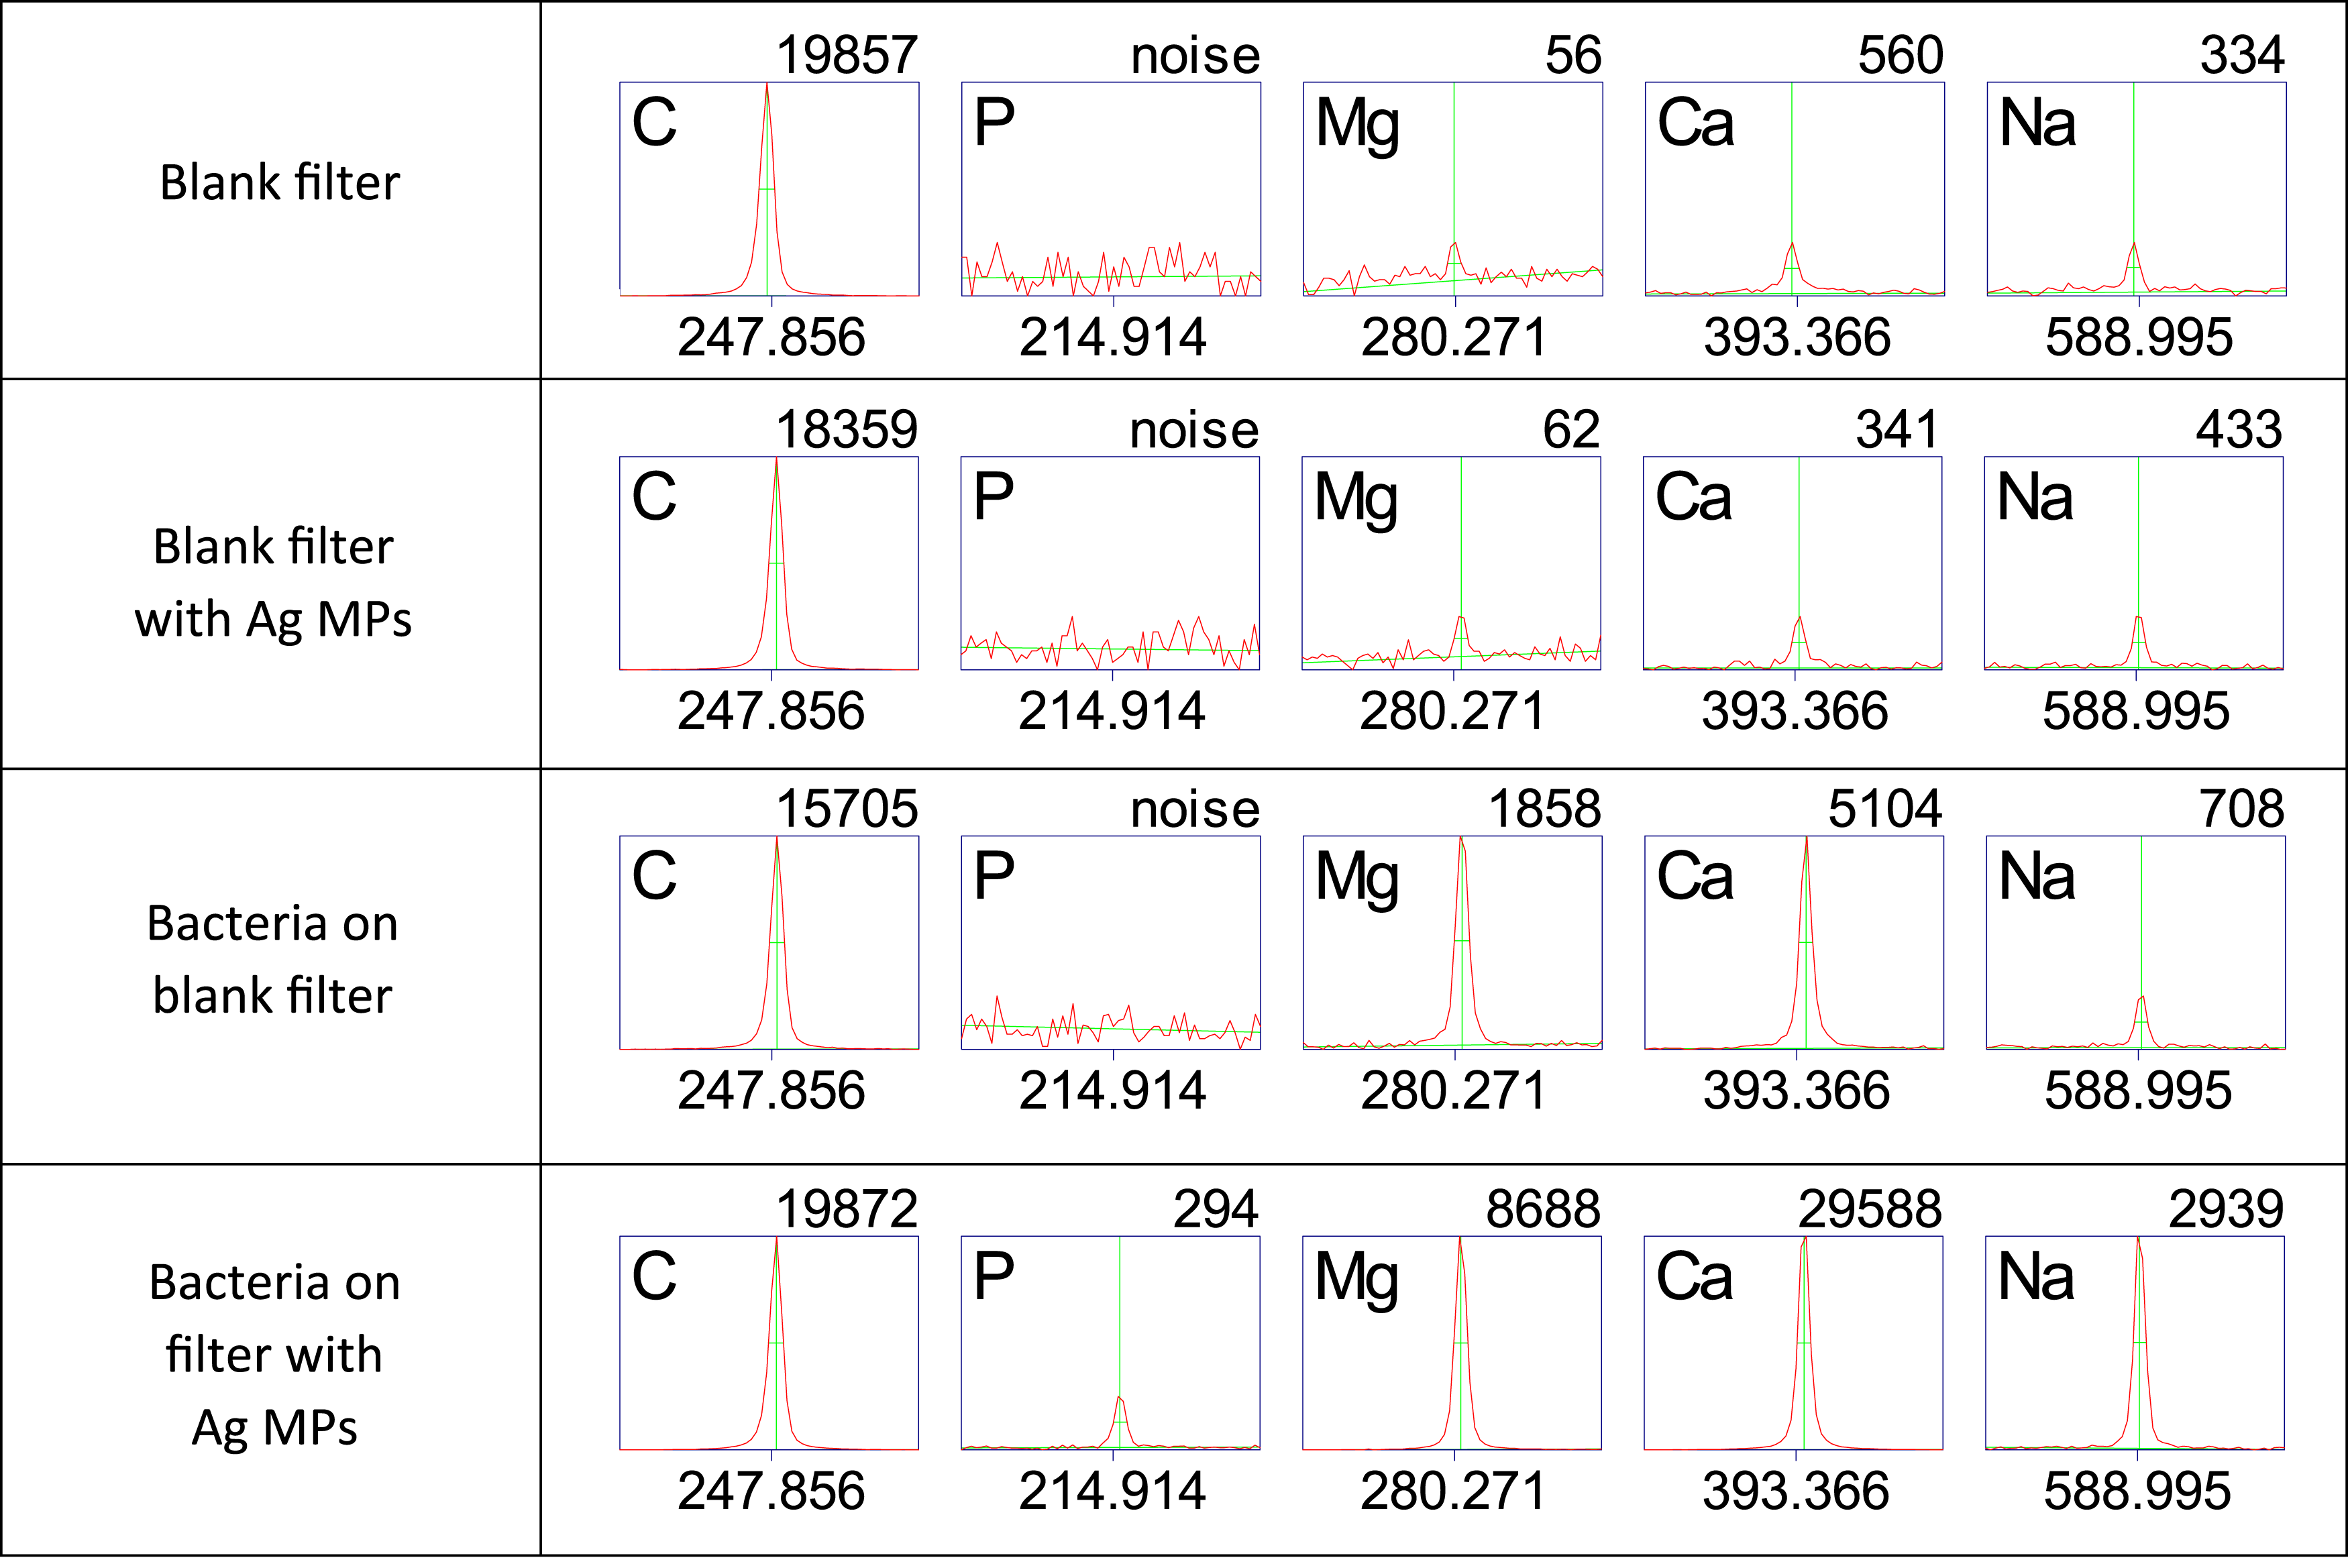
Enhancement was observed for all species of bacteria tested as expected. Because the Ag MPs were not interacting with the cells in any biochemical way, there is no microbiological reason why one species should experience preferential enhancement compared to the others. It is therefore not inferred from the data in Table I that the enhancement ratio for any given element is dependent upon the species, rather the three enhancement ratios for a given element most likely represent the scatter in the independent measurements of the actual enhancement ratio for the element. The variations in the enhancement for a given element between species is most likely caused by the variations between the spectra themselves due to differences in ablation properties for the different bacteria. Each bacterial species forms slightly different colonies and has different physico-mechanical properties that control how the cells cluster and clump in suspension and how they form films on the filter. Our previous work performing scanning electron microscopy on the films and the ablation craters has shown that the bacterial films are neither smooth nor highly uniform surfaces conducive to efficient ablation. 18 They tend to be more foam-like with poor thermal properties leading to large shot-to-shot variations in plasma emission intensities. This heterogeneity can be easily seen in Figure S1 (Supplemental Material). Efforts to create more homogenous single-cell suspensions that will then form more uniform films of bacteria after deposition on the filters are ongoing. It may be possible that for suspensions with very low cell numbers this will not be a problem.
For any given bacterial species, the enhancement ratios were also not constant across the five elements shown in Table I, as expected. The different atoms or ions in the silver-seeded plasma will equilibrate differently depending on their identity. This is typically observed in time-evolving LIBS plasmas which tend to never achieve complete thermodynamic equilibrium. For all three species, carbon experienced an average enhancement of 1.2; phosphorus, 3.6; magnesium, 4.5; calcium, 5.3; and sodium, 4.0. The carbon emission mostly originated from the carbon ablated from the nitrocellulose filter medium which is much less effected by the Ag NPs, as was shown in Figs. 4–6. For the bacterial cell trace elements, the total average enhancement ratio was 4.3. While this is not as large an improvement as some nanoparticle studies have shown, the ease of preparation and potential cost savings may make this a viable technique. As was observed for some of the smaller lines such as the phosphorus 214.914 nm line shown in Fig. 6, making reasonable signal-to-noise lines appear out of the noise due to increased emission intensity could actually be quantified as an infinite enhancement, since previously that line was unmeasurable. The addition of more analytic lines, particularly lines not caused by any form of contamination or present in the filter, will assist in the classification of the bacteria on the basis of their spectrum and will also lower the limit of detection.
One issue that arose due to the inconsistent enhancement of different lines based on their elemental identity and ionization state is that the ratio of lines was different from non-enhanced spectra, making them unclassifiable in a chemometric identification. A partial least squares discriminant analysis (PLS-DA) discrimination was performed on the LIBS spectral data obtained from E. coli deposited on the blank nitrocellulose filter and E. coli deposited on the Ag MP-coated nitrocellulose filter. A model was constructed from both of these spectra and validated with 20 “unknown” Ag MP E. coli spectra that were not included in the model. No silver emission lines were used in the model, only the 19 previously identified bacterial lines. The model was constructed accurately with a sensitivity and specificity of 100% demonstrating the uniqueness of the two types of spectra and all the unknown data points were classified correctly in the external validation. These spectra from identical cells are thus entirely different in terms of a chemometric classification. This PLS-DA is shown in Figure S3 (Supplemental Material). The uniqueness of the enhanced spectra relative to the control spectra could be problematic if the variations in enhancement remain large and uncontrolled. In this case, it would be not just the intensity of the overall LIBS spectrum that was changing, the relative intensities would also be varying from shot to shot, deteriorating the uniqueness of the spectrum. This will continue to be investigated but no other attempt has yet been made to use the silver-enhanced spectra in a chemometric classification.
Finally, the complete mechanism behind this MP enhancement is not conclusively known, but it is known that this effect is not the same as the plasmon resonance occurring in NELIBS and we do not claim it to be such. It is suspected that the presence of metals, which in general ablate much more easily than any other target substrates due to their thermal properties and their ability to donate electrons to the plasma, causes a higher temperature and a higher number of seed electrons in the plasma. The increased number of these electrons results in an enhanced emission from the same number of atoms as the metal microparticles produce a hotter analytic laser-induced plasma. As well, microparticles with their high surface area to volume ratio ablate much more efficiently than bulk materials (which is one of the reasons for the enhancement observed in double-pulse LIBS). This will more readily add free electrons and ions to the plasma. This mechanism will need to be studied further by collecting more bacterial spectra deposited on Ag MP-coated filters with LIBS. Further exploration into microparticle-enhanced LIBS will determine whether enhancement using metallic powders on the micron scale to improve the overall limit of detection of bacteria in liquid specimens is feasible.
Conclusion
This set of experiments has provided proof of concept that the addition of metallic microparticles can effectively increase the emission from bacterial LIBS spectra. The addition of easy to obtain and cheaply available Ag MPs enhanced the intensity of all the observed emission lines in each of the bacterial species tested. An easy to use non-technical deposition chamber was constructed that resulted in uniform surface coverage as determined by scanning electron microscopy. A linear dependence of the mass deposition with time was observed and a 30 s settling time was chosen to provide a total mass deposition of 39 μg ± 17 μg. The amount of additional silver mass ablated per single-shot laser-induced plasma was calculated to be 3.3 ng. This amount of silver enhanced the emission of all the observed emission lines by an average factor of 4.3, while also causing some unmeasurable lines to rise above the background noise and become measurable.
No research utilizing microparticles for bacteria identification, classification, or discrimination has previously been published to our knowledge. These results need to be further investigated to determine the ultimate limit of enhancement before signal and sample degradation due to scorching of the substrate filtration medium limits its utility. In addition, the use of other metals could be investigated. Because the enhancement is not due to a plasmonic resonance, it is likely that the metals of choice need not be silver and gold as they are with nanoparticle enhancement. Perhaps the use of less expensive metal microparticles like copper or even aluminum could yield efficient enhancement at an even more reduced cost.
The potential creation of a new field of microparticle-enhanced laser-induced breakdown spectroscopy or MPLIBS could result from such future research and emerge as a convenient mechanism for enhancing low signal-to- noise LIBS spectra.
Supplemental Material
Supplemental Material - Silver Microparticle-Enhanced Laser-Induced Breakdown Spectroscopy
Supplemental Material for Silver Microparticle-Enhanced Laser-Induced Breakdown Spectroscopy by Jeremy C. Marvin, Emma J. Blanchette, Sydney C. Sleiman, Haiqa Arain, Emily A. Tracey, and Steven J. Rehse in Applied Spectroscopy
Footnotes
Acknowledgments
The authors are grateful to Ingrid Churchill who supplied the initial stabs for all bacterial cultures and provided advice and assistance with microbiological questions and Sharon Lackie who performed the measurements with the scanning electron microscope. Janeen Auld and Lara Watanabe assisted with the use of the EA microbalance.
Declaration of Conflicting Interests
The author(s) declared no potential conflicts of interest with respect to the research, authorship, and/or publication of this article.
Funding
The author(s) disclosed receipt of the following financial support for the research, authorship, and/or publication of this article: This work was supported by the Natural Sciences and Engineering Research Council (NSERC) of Canada under Grant award number RGPIN/05842-2017.
References
Supplementary Material
Please find the following supplemental material available below.
For Open Access articles published under a Creative Commons License, all supplemental material carries the same license as the article it is associated with.
For non-Open Access articles published, all supplemental material carries a non-exclusive license, and permission requests for re-use of supplemental material or any part of supplemental material shall be sent directly to the copyright owner as specified in the copyright notice associated with the article.