
Abstract
We investigated the near-infrared spectrum of piperine using quantum mechanical calculations. We evaluated two efficient approaches, DVPT2//PM6 and DVPT2//ONIOM [PM6:B3LYP/6-311++G(2df, 2pd)] that yielded a simulated spectrum with varying accuracy versus computing time factor. We performed vibrational assignments and unveiled complex nature of the near-infrared spectrum of piperine, resulting from a high level of band convolution. The most meaningful contribution to the near-infrared absorption of piperine results from binary combination bands. With the available detailed near-infrared assignment of piperine, we interpreted the properties of partial least square regression models constructed in our earlier study to describe the piperine content in black pepper samples. Two models were compared with spectral data sets obtained with a benchtop and a miniaturized spectrometer. The two spectrometers implement distinct technology which leads to a profound instrumental difference and discrepancy in the predictive performance when analyzing piperine content. We concluded that the sensitivity of the two instruments to certain types of piperine vibrations is different and that the benchtop spectrometer unveiled higher selectivity. Such difference in obtaining chemical information from a sample can be one of the reasons why the benchtop spectrometer performs better in analyzing the piperine content of black pepper. This evidenced direct correspondence between the features critical for applied near-infrared spectroscopic routine and the underlying vibrational properties of the analyzed constituent in a complex sample.
Keywords
Introduction
Near-infrared (NIR) spectroscopy is a vibrational spectroscopic technique particularly potent and wide-spread in analytical applications. 1 It offers remarkable universality and applicability to wide diversity of materials.2–4 Its capability of acquiring good quality spectra from bulk sample with no need for prior sample preparation, while operating in non-contact, diffuse reflectance mode is a decisive practical advantage over, e.g., infrared (IR) and mid-infrared (MIR) spectroscopy. The latter technique requires either sample preparation (i.e., a destructive dilution of the sample in a non-absorbing medium) or the use of attenuated total reflection (ATR) mode, which introduces a set of issues, e.g., related to the quality of the surface contact between the sample and the internal reflective element (IRE) or very shallow penetration depth that may become an issue for imperfectly homogenous samples. A straightforward applicability makes NIR spectroscopy highly valued as a nondestructive, rapid, and efficient tool for qualitative and quantitative analysis in a variety of areas, for example in foodstuff5,6 and natural products, 7 agriculture,8–10 pharmaceuticals, 11 polymers, 12 and fuel, 13 among others. 1
Near-infrared spectroscopy is an essential division of vibrational spectroscopy in basic research as well. 14 NIR spectra are abundant in information on the anharmonicity of molecular vibrations, the chemical structure and intra- and inter-molecular interactions, solvent effect, etc. 14 This technique notably contributed into gaining deeper insights into several phenomena of physical chemistry. 15 Despite a number of unique and important advantages, NIR spectroscopy also faces significant limitations and challenges due to the convoluted nature of the spectra and difficulties in their direct interpretation. 16 The absorption of radiation in this spectral region stems from excitation of numerous non-fundamental vibrations, with the primary contribution from the first overtones and binary combination transitions.16,17 The individual bands corresponding to those transitions overlap exceedingly and the resulting NIR spectral lineshape is intrinsically very complex. In contrast to IR spectra, the observed NIR absorption features are broad and non-homogeneous. The interpretability of IR bands much benefited from quantum chemical calculation of vibrational spectra,18–20 which can be described as routine with the availability of an efficient harmonic approximation. 16 Conversely, the harmonic approximation is incapable of describing the transitions relevant to NIR spectra. The necessary anharmonic methods were prohibitively computationally complex for practical applications, and in the past only conventional, empirical methods known to spectroscopy could be used for approximate identification of NIR bands. Conventional approaches, e.g., the analysis of series of analogous compounds, 21 isotopic substitution (manifested stronger in the NIR than in the region of fundamental vibrations), 22 or elucidation of correlations between IR and NIR spectra of the same sample, e.g., by applying hetero-correlated two-dimensional analysis (2D-COS), 23 particularly its hetero-correlation variant which highlights spectral similarities and differences between NIR and IR or Raman bands,24–26 should be noted here.
However, the above methods are far from being capable of fully derogating the ambiguity in NIR band assignments and despite significant efforts, only shallow assignments of broader NIR peaks were possible, where the expected positions of the overtones and combinations were anticipated from the known positions of IR peaks. 22 Recently, anharmonic calculations based on efficient vibrational second-order perturbation theory (VPT2) approach have become feasible for practically meaningful molecules, with the accuracy and efficiency sufficient for use in applied NIR spectroscopy.17,27–30 Reliable and detailed reproduction of NIR spectra improved our understanding of strongly convoluted spectra.17,31 Several other examples of accurate calculation of overtones and combination bands that can also be observed as weak bands in IR spectra, together with the anharmonic effects that affect fundamental bands, are noteworthy for demonstrating the intrinsic value of anharmonic calculation for applied spectroscopy.32–36 Further, a brief note should be made here to point the readers’ attention to other potent anharmonic approaches. Those methods can be roughly divided into those oriented at very high accuracy, e.g., vibrational configuration interaction (VCI),37,38 vibrational coupled cluster (VCC),39,40 or grid-based methods.41,42 Alongside, continued development of anharmonic methods oriented towards efficiency is ongoing, particularly essential for applied spectroscopic studies. Finally, briefly mentioned should be highly automated, generally applicable methods (characteristics similar to VPT2 approach), well integrated into popular packages for quantum chemical calculations that make them attractive and easily accessible for applied spectroscopists. In this area, the implementations of vibrational self-consistent field (VSCF) 43 often available alongside its refined correlation-corrected variant (CC-VSCF), 44 are particularly useful in such roles. The VSCF calculations of vibrational spectra are especially well-established and assisted experimental vibrational spectroscopy in solving numerous problems.45–48
With the accessibility to theoretical prediction of NIR spectra, an attempt may be made to obtain insights into the factors directly meaningful for the chemometric calibration models underlying analytical applications of NIR spectroscopy. For quantitative analysis of a given chemical content using NIR spectroscopy, a regression model is typically built, in which the correlation between the reference value (e.g., a known concentration of a selected constituent present in the sample) and the spectral points is found for the set of calibration samples. The calibrated regression model may then be used for predicting the intended property (in this example, the concentration of the selected constituent) for unknown samples. Despite being commonly used, this general procedure in routine applications very seldom leads to the interpretation of the underlying vibrational features at the molecular level. Hence, little is known about how the fundamental properties of the sample manifested in its NIR spectrum are reflected in the models used in practical applications. The detailed identification of NIR bands is meaningful for understanding the instrumental differences. 49 Particularly, the past decade marked a dynamic development of miniaturized NIR spectrometers driven by the immense application potential of on-site capable analysis.9,50,51 However, unlike a commonly used benchtop Fourier transform NIR (FT-NIR) spectrometer, the technology underlying these devices is also diverse, with different implemented wavelength selection principles. 50 Miniaturized spectrometers typically operate in a narrower spectral region, different between given sensors, with lower spectral resolution and poorer signal-to-noise ratio. 50 In the result, the performance of miniaturized NIR spectrometers in acquiring the spectral information corresponding to a given chemical constituent present in the sample is not equal to that of a benchtop FT-NIR spectrometer.52–54
To examine the relevance of the accessibility of a spectrometer to the specific chemical information present in NIR spectrum, the case study is based on the microPHAZIR (Thermo Fisher Scientific) handheld spectrometer. This instrument is a miniaturized Hadamard spectrometer with a programmable micro–electro–mechanical system (MEMS) mask, which makes it distinctly different in the used technology from a generic design of a benchtop FT-NIR spectrometer. The microPHAZIR is particularly interesting for this study, as being one of the first broadly available portable NIR spectrometers it is a fairly popular instrument in various analyses.55–58 Strikingly, however, it operates over a particularly narrow spectral range of 6266–4173 cm–1, which for most molecules captures the region of strongly overlapping combination bands. It was suggested before that the limited spectral region observed by microPHAZIR reduces its performance in analyzing chemical constituents that feature strong, characteristic bands outside of that region. 54 Therefore, this instrument serves a nearly ideal case study for elucidating the factors affecting performance that correspond to the underlying vibrational transitions. It would be particularly interesting to attempt to investigate the correspondence between the analytical performance and the instrument’s sensitivity towards vibrational bands of the analyzed constituent in a complex NIR spectrum of a natural sample that presents a strongly convoluted lineshape.
For the outlined reasons, in this work, we aimed for obtaining a detailed understanding of the NIR absorption features of piperine, as the case study. Piperine is an alkaloid essential for the flavoring, conserving, and therapeutic properties of black pepper.59–61 Piperine is the quality parameter for this major spice at the world market (black pepper forms 34% of the global spice trade) and, therefore, keen attention is given to efficient quantitative analysis of piperine content in black pepper; recently, we developed an NIR spectroscopic method for this purpose. 53 In the present study, we analyzed the vibrational contributions to NIR spectra of piperine and identified those of the spectra-structure correlations that are most meaningful for the spectral lineshape in NIR region. Anharmonic calculations are significantly more demanding, with respect to the computational time, than the harmonic ones. To be more useful in analytical applications of NIR spectroscopy, spectral simulations optimized towards efficiency are desired. Therefore, in our study, we evaluated the suitability of anharmonic vibrational analysis based on the potential energy surface (PES) of the piperine molecule obtained through the concept of a hybrid treatment of its fragments at different levels of electronic theory. Next, we aimed to elucidate the manifestation of the vibrational transitions of piperine in the partial least squares regression (i.e., PLSR) models calibrated for quantifying piperine content in black pepper on the basis of NIR spectral datasets obtained by, respectively, a benchtop and a miniaturized spectrometer. 53 Through this, we obtained an insight into how the instrumental difference corresponds to the chemical information stemming from the analyzed sample. We identified a disparity between the selectivity of the benchtop and the miniaturized spectrometer towards the NIR transitions of piperine analyzed in black pepper.
Materials and Methods
Experimental
Piperine (98.5%) and carbon tetrachloride (anhydrous, >̲99.5%) were purchased from Sigma Aldrich. Carbon tetrachloride was distilled and stored over molecular sieves (5 Å, Sigma Aldrich). Piperine was used with no further purification.
The NIR spectra were measured using a Fourier transform (FT) Büchi NIRFlex N-500 spectrometer equipped with polarization interferometer and the accessory for measurement of liquid samples in transmittance mode. The samples were deposited in a quartz cell of 10 mm thickness (Hellma QX). The spectra were acquired in the region of 10 000 to 4000 cm–1 with the spectral resolution of 8 cm–1, interpolated to 4 cm–1, resulting in 1501 data points per spectrum. For each spectrum, a total number of 64 averaged scans were collected. The spectrometer was operated by the software Büchi NIR Ware v.1.4.3010. The spectrometer is capable of stabilizing the temperature of the sample, from room temperature up to 338 K (65 ℃). The interpretation of the quantitative performance in analyzing piperine content in black pepper (reported by us recently) 53 of NIRFlex N-500 was compared with the same results obtained by microPHAZIR. 50 While the details of the analytical procedures are given in the referenced article, a brief summary of the essentials are given here. The construction of PLS regression models, as well as the preceding spectral pretreatments was performed with the use of The Unscrambler X v.10.5 (CAMO Software) software. The measured spectra were transformed from reflectance R to log(1/R), i.e., into intensity scale common with absorbance. Replicate spectra measured for each sample were averaged to one spectrum per sample. Afterwards, numerical second-order differentiation of the spectra using the Savitzky–Golay (SG) algorithm was carried out. PLS regression was performed for mean-centered spectral sets, with NIPALS algorithm and full cross-validation using a leave-one-out scheme.
Because of low solubility of piperine in carbon tetrachloride under normal conditions, and poor intensity of the measured NIR bands (Fig. S1, Supplemental Material), the measurements of the saturated solution at elevated temperatures were performed up to the limit of the instrument, while also maintaining a safe margin below the boiling point of the solvent (349.85 K, or 76.7 ℃). The solubility of piperine in carbon tetrachloride increased rapidly at higher temperatures, resulting in a much-improved intensity of the measured spectrum (Fig. S1). The experimental spectra presented and discussed further in this work correspond to the saturated solution of piperine in carbon tetrachloride measured at 333.15 K (60 ℃). Note, this temperature is far below the temperature at which piperine decomposes. 62
Theoretical Calculations of NIR Spectra
To enhance the efficiency of anharmonic vibrational analysis of a medium-sized system such as the molecule of piperine, we applied the ONIOM (i.e., our own n-layered integrated molecular orbital and molecular mechanics) model, as proposed by Svensson et al.
63
Within this hybrid scheme, the electronic structure of the system may be determined by applying different methods to distinct atomic centers. This approach is often used to reduce the computational cost of the entire calculation. More approximate but also more efficient methods can be applied to treat the fragments of the molecule less susceptible to be impacted by a relatively large inaccuracy. In this case, to describe the alkene fragment, we employed a lower-level method, a semi-empirical parametric method 6 (PM6) (Fig. 1). The remaining atoms were treated at density functional theory (DFT) level, with single-hybrid B3LYP functional combined with 6-311++G(2df,2pd) basis set. To obtain meaningful vibrational analysis, the minimum at the PES of piperine molecule was found, confirmed by all real harmonic frequencies. The molecular structures of piperine converged to the stationary point at PES are presented, respectively, for PM6 and ONIOM[PM6:B3LYP/6-311++G(2df,2pd)] calculation, in Tables S1 and S2 (Supplemental Material). The following anharmonic vibrational analysis was performed using the deperturbed vibrational second-order perturbation theory (DVPT2).64,65 The calculations included up to two quanta transitions, i.e., the first overtones and binary combination; this is sufficient to accurately reconstruct an NIR spectrum.
66
All quantum mechanical calculations were performed with Gaussian 09 Revision E01 software.
67
The modeling of the spectral lineshape was carried out through parameterized band broadening. Lorentz–Gauss (Cauchy–Gauss) product function was used as the band shape model.68,69
Molecular structure of piperine optimized using the ONIOM approach. The fragment marked by the rectangle was treated at semi-empirical PM6 level, while the remaining fragments at B3LYP/6-311++G(2df,2pd) level.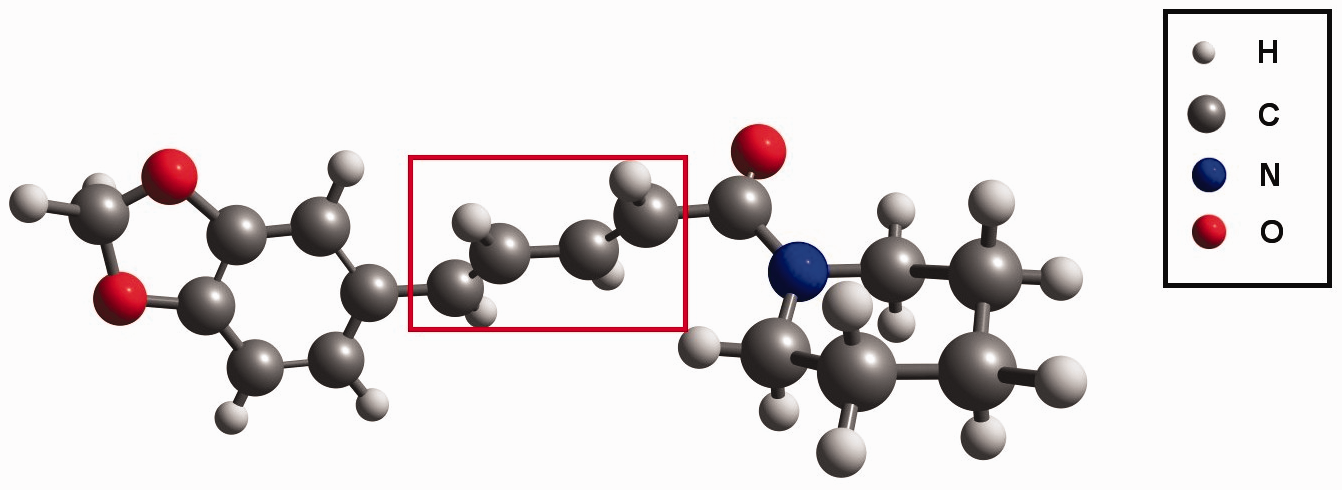
Results and Discussion
Efficiency of Modeling NIR Spectra
The primary focus here was on improving the efficiency of the theoretical simulation of NIR spectra, essential for the use of this tool in applied NIR spectroscopy. Depending on the chosen method, the anharmonic vibrational analysis requires steeply to extremely steeply increased computational time versus the harmonic calculations. 16 Despite favorable efficiency, the original VPT2 framework suffers from intrinsic vulnerability to erroneous treatment of vibrational resonances. The DVPT2 scheme is a truncated variant of VPT2 method, in which the vibrational resonances are identified and neglected in the subsequent calculations. This concept is introduced to remove the possibility of a large error occurring. Further development of this concept leads to generalized VPT2 (GVPT2) method, which reintroduces the treatment of resonances using a computationally costly variational approach that is not susceptible for the discussed error. In the case of the calculations of NIR spectra, the DVPT2 approach often delivers fully adequate accuracy. 70 Direct evaluation of the accuracy of the truncated DPVT2 and enhanced GPVT2 methods in approximating NIR spectra on the example of melamine 71 demonstrated similar quality for the spectra predicted by both methods. Having the efficiency as the priority for applied NIR spectroscopy, the DVPT2 calculations offer a good combination of reliability and cost factor.
The major computational expense in DVPT2 method of anharmonic vibrational analysis corresponds to the evaluation of Hessian matrix at geometries displaced from the equilibrium, in order to yield the cross-derivatives of the potential energy with respect to normal coordinates. However, the overall efficiency of the steps underlying anharmonic vibrational analysis considerably depends on the complexity of the method used for the determination of the electronic structure. Therefore, we first evaluated the accuracy of the vibrational analysis based on the PES entirely determined by semi-empirical PM6 method. Semi-empirical methods offer very high efficiency, but at the cost of accuracy and reliability, these methods may produce results of varying precision depending on a particular system. In the present case, the DVPT2//PM6 approach yielded only a limited agreement between the theoretical and experimental NIR spectra (Fig. 2). The most significant disagreement can be seen in the upper region (∼6100–5500 cm–1 in the experimental lineshape) and in the missing minor absorption features that are observed in the experimental spectra between approximately 4900–4600 cm–1. However, one should note that the predicted position of the entire absorption feature at ∼5500–5100 cm–1 is uniformly underestimated versus the experimental spectrum, while its lineshape generally corresponds well to the latter. On the other hand, the major bands in the lower region (∼4500–4000 cm–1) predicted at DVPT2/PM6 level also roughly resemble the experimental ones. Therefore, such approach may be used for fast screening purposes or for treatment of very large systems, with a penalty to the accuracy that is noticeable but still acceptable for rough assignments of NIR spectra.
Experimental (solution in CCl4) and theoretical NIR spectra of piperine obtained with DVPT2 calculations. The underlying electronic structure calculations performed with, respectively, PM6 method used uniformly for describing all atomic centers and ONIOM PM6:B3LYP/6-311++G(2df,2pd) scheme (c.f. Fig. 1).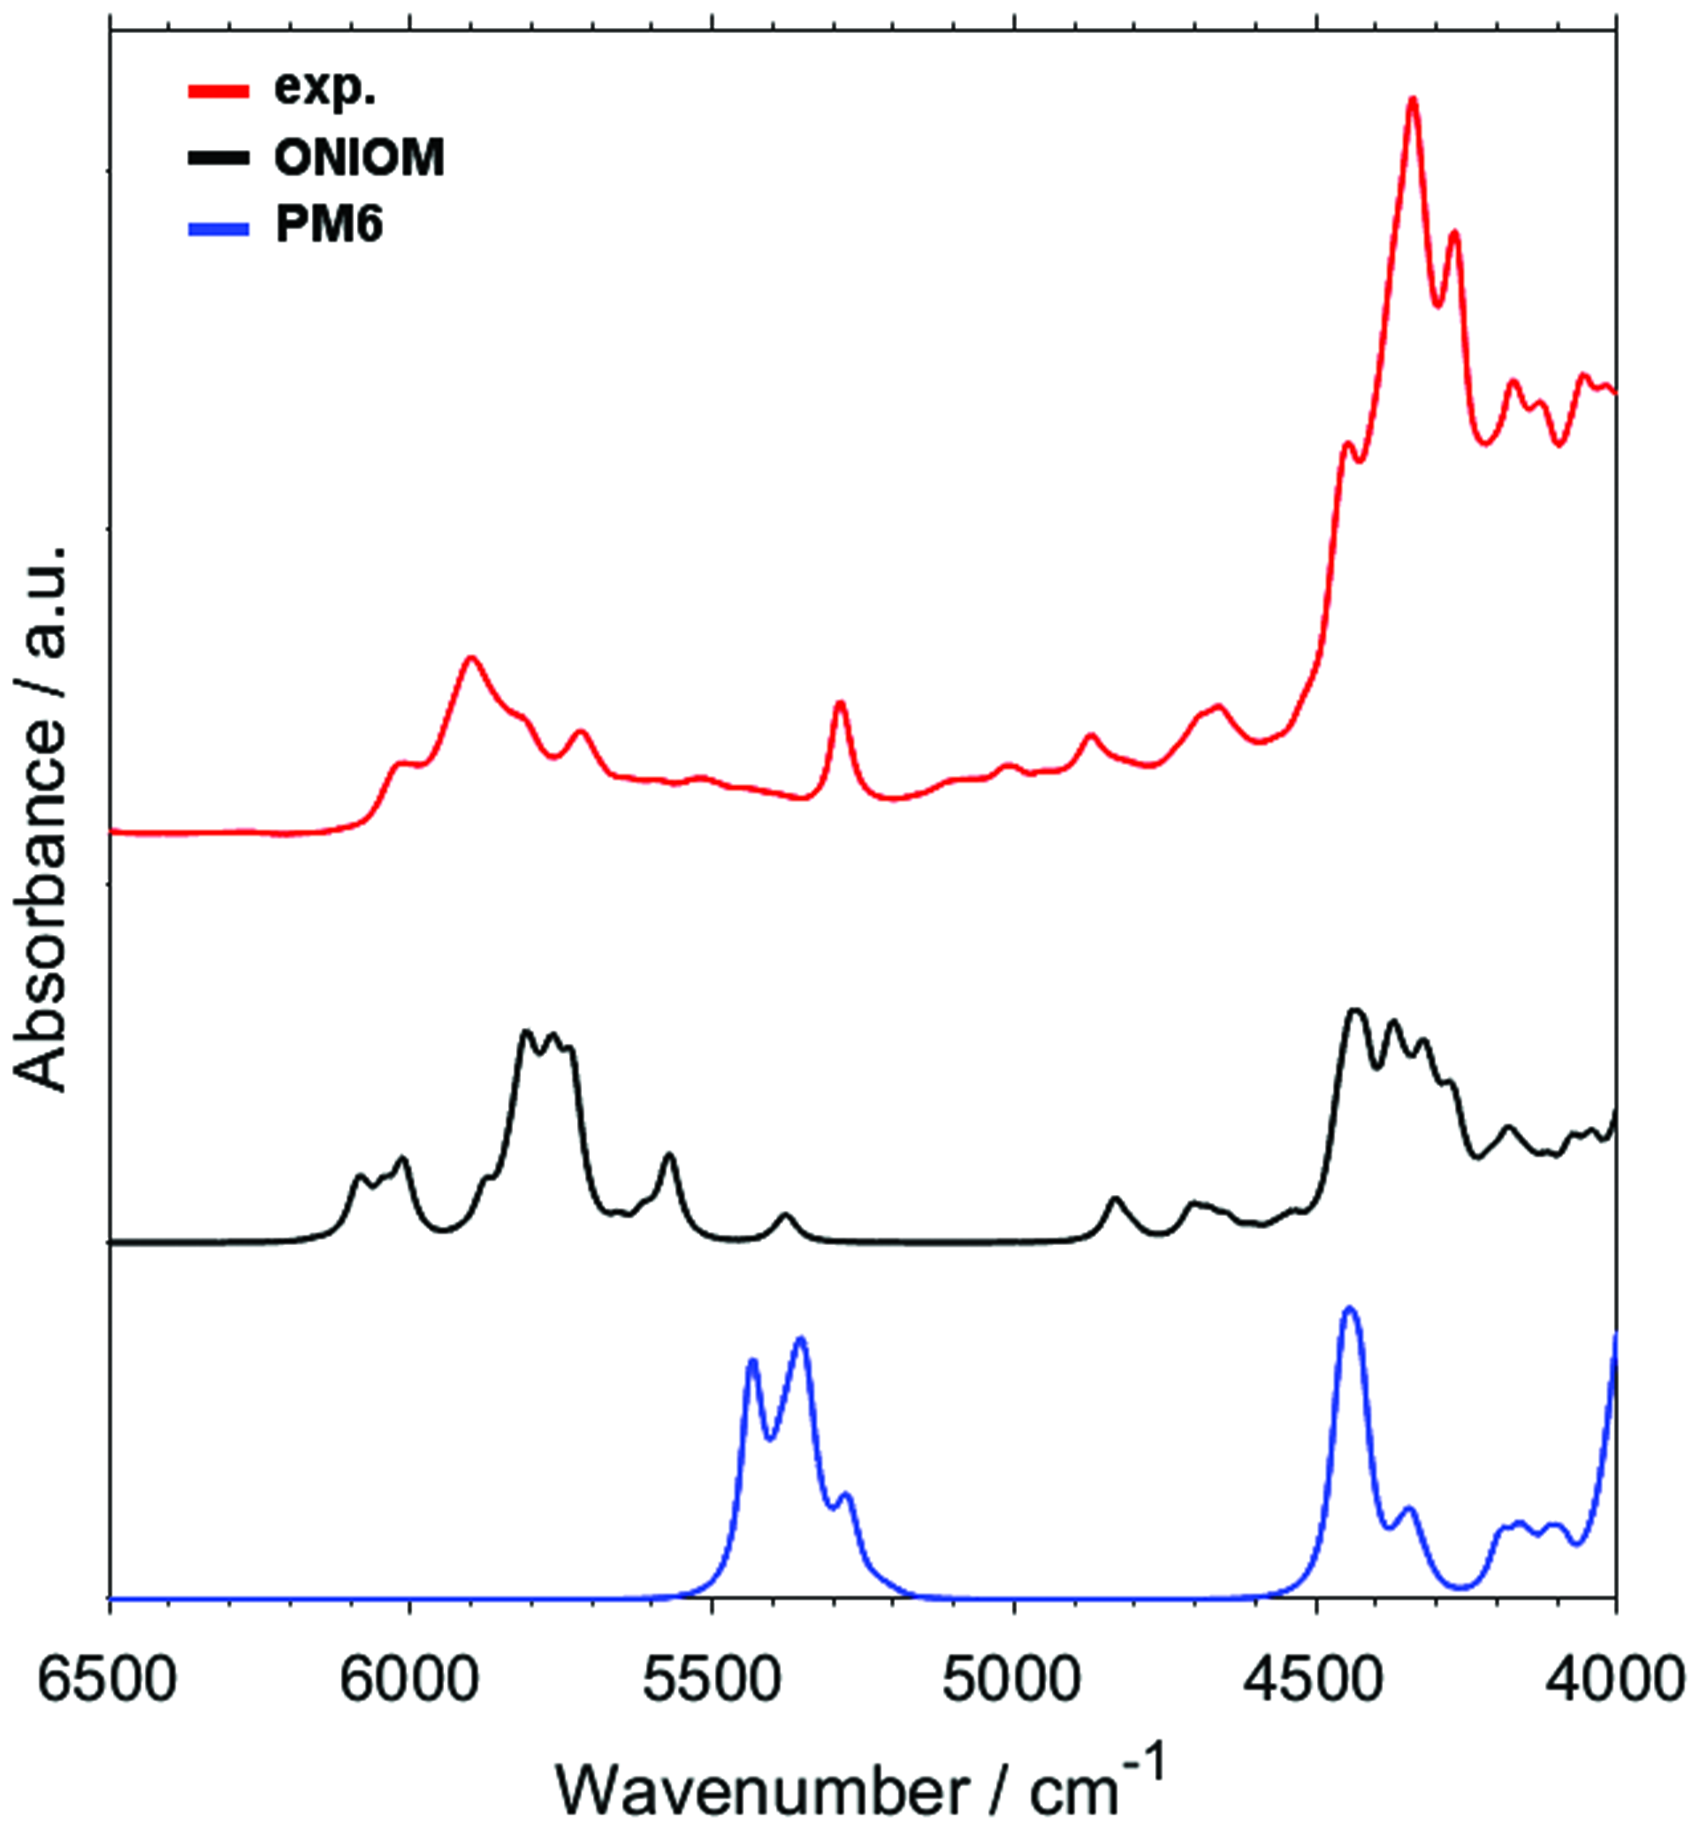
With the aim to provide better precision of the simulated NIR spectrum combined with an improved efficiency, we applied the hybrid ONIOM scheme, in which the alkene fragment and the remaining part of the molecule of piperine were treated at different levels of electronic theory (see the Theoretical Calculations of NIR Spectra section). The accuracy of the reproduction of the piperine spectrum by DPVT2 method is significantly improved with the use of the hybrid ONIOM (PM6:B3LYP/6-311++G(2df,2pd)) scheme (Fig. 2). In this case, the increase in the demand for computing resources remains acceptable for practical use in analytical NIR spectroscopy. Minor disagreements between the peak positions and lineshape in the absolute sense seem acceptable, as the correspondence between the simulated and experimental features is sufficient for reliable identification of the contributing transitions and the subsequent use of this information for the interpretation of the experimental lineshape. Furthermore, the agreement between the simulated and experimental spectrum could only be achieved at a disproportional increase in the computational time. 72 Further discussion in this work will be based on the calculations that used the ONIOM scheme.
Relative Contributions from the First Overtones and Binary Combinations to the Integral Intensity in NIR Region
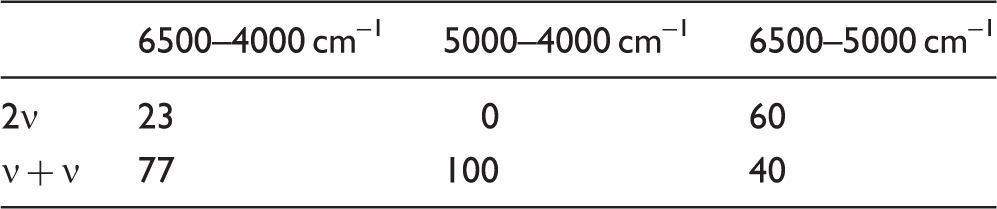
The NIR spectrum of piperine features two distinct regions of meaningful absorption, i.e., the region of 6200–5300 cm–1 and 5000–4000 cm–1 (Fig. 3). The simulated spectra unveil a clear separation between the origin of these two regions (Fig. 3a). The upper one is equally contributed by the first overtones and binary combinations, while the lower one is populated only by the latter type of bands. The relative contributions of the first overtones and the binary combinations, represented by the integral intensities calculated for the modeled bands as presented in Fig. 3a, are given in Table I. In the entire analyzed NIR region of piperine (6500–4000 cm–1), the first overtones contribute only by 23% to the integral intensity of the simulated spectrum. In the upper region of interest (6500–5000 cm–1), the estimated contribution of the first overtones is 60%. However, the summarized lineshape of the first overtones suggests that their intensities are slightly overestimated by the present calculation. This can be noticed by following the shape of the major absorption feature with the peak intensity observed in the experimental spectrum at ∼5900 cm–1 and comparing it with the theoretical lineshape of the combination bands alone (Fig. 3a). An even lower contribution of the first overtones to the integral intensity of the experimental NIR spectrum of piperine may be anticipated. Therefore, the absorption of piperine in the NIR region is primarily decided by the binary combination bands.
NIR spectra of piperine. (a) The experimental and the calculated spectrum; summarized contributions from the first overtones and binary combination bands are presented. (b) The individual simulated first overtones and binary combination bands (narrower simulated bands presented for a better view of detail). The relative contribution (%) of the first overtones (2ν) and binary combination bands (ν+ν) to the integral intensity of the simulated NIR spectrum of piperine (Fig. 3a).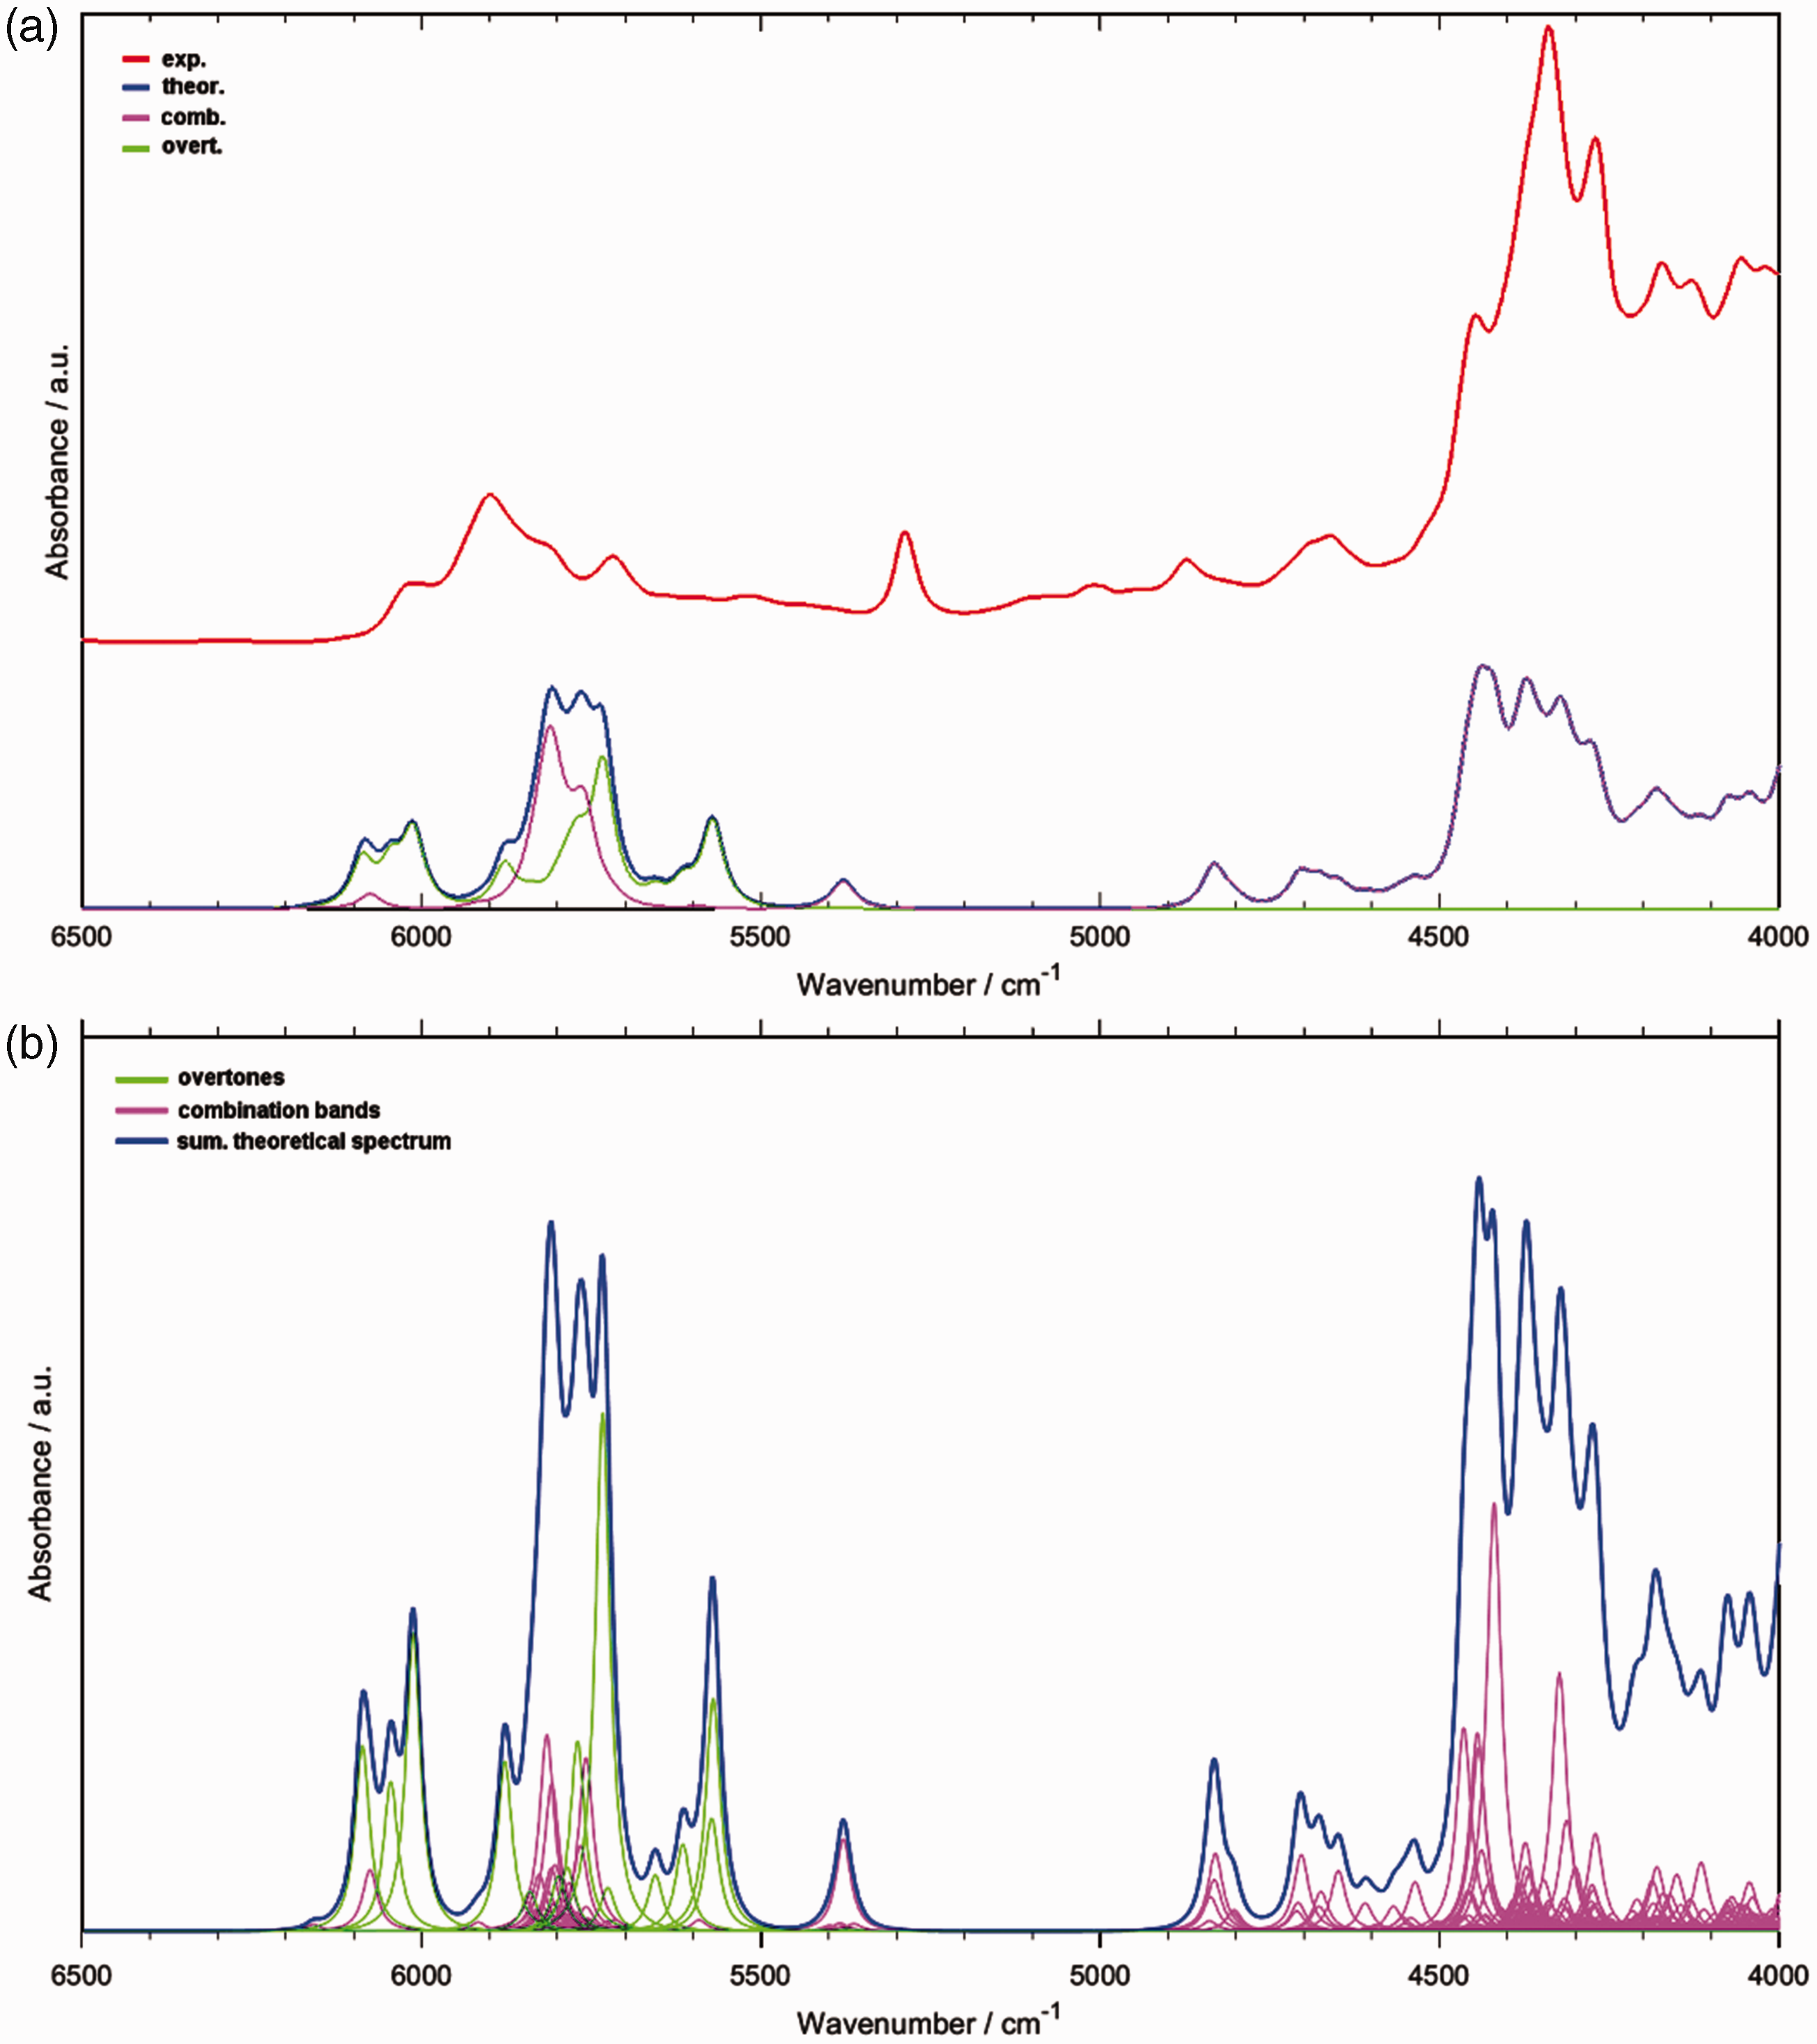
Individual Vibrational Contributions and the Convolution of NIR Spectra
The profound role that the binary combinations play in shaping the NIR spectrum of piperine can also be seen in a high number of meaningful, individual bands that contribute to the observable spectral lineshape. As presented in Fig. 3b, the number of overlapping bands is particularly large in the lower NIR region (∼4800–4000 cm–1). This stands in sharp contrast to IR spectra, where rarely that many convoluted bands are observed and often a leading component can be designated.73,74 Furthermore, the extent of the overlapping observed in the ∼4500–4000 cm–1 region helps to explain the apparent disagreement between the simulated and experimental lineshape. Even a moderate imprecision in the calculated positions of the contributing bands may result in a visible distortion of the summarized lineshape.
NIR Band Assignments
To properly reflect the convoluted nature of NIR spectra, the typical approach to the assignments, known from IR spectroscopy is not feasible. Ascribing the observed peaks to single transitions to present tabularized assignments of NIR spectra would only capture a fragment of the true picture. To present the NIR assignments in an exhaustive way and dissect the intricate overlapping, we instead illustrate the assignments in the form of a heatmap (Fig. 4).
70
The vibrational contributions to the NIR spectrum of piperine unveiled this way show the dominance in the upper region (∼6200–5500 cm–1) of the first overtones of C–H and CH2 stretching as well as the binary combinations involving either of these modes (Fig. 4). Noteworthy, the νCH bands appear at the higher wavenumbers than the νCH2 ones, reflecting a similar order between the respective calculated fundamental bands appearing in IR region of piperine. Combinations including stretching and deformation vibrations of νCH and νCH2 groups, as well as with ring deformation modes, mostly populate the lower NIR region of piperine (∼4500–4000 cm–1). Note, the relative contributions of C=O stretching and C–N stretching are relatively minor. The contribution from C=O stretching can be seen in the region free from very strong bands, i.e., in the region of 4900–4600 cm–1, where its combination bands with C–H stretching are observed (Fig. 4).
Vibrational contributions to NIR spectrum of piperine.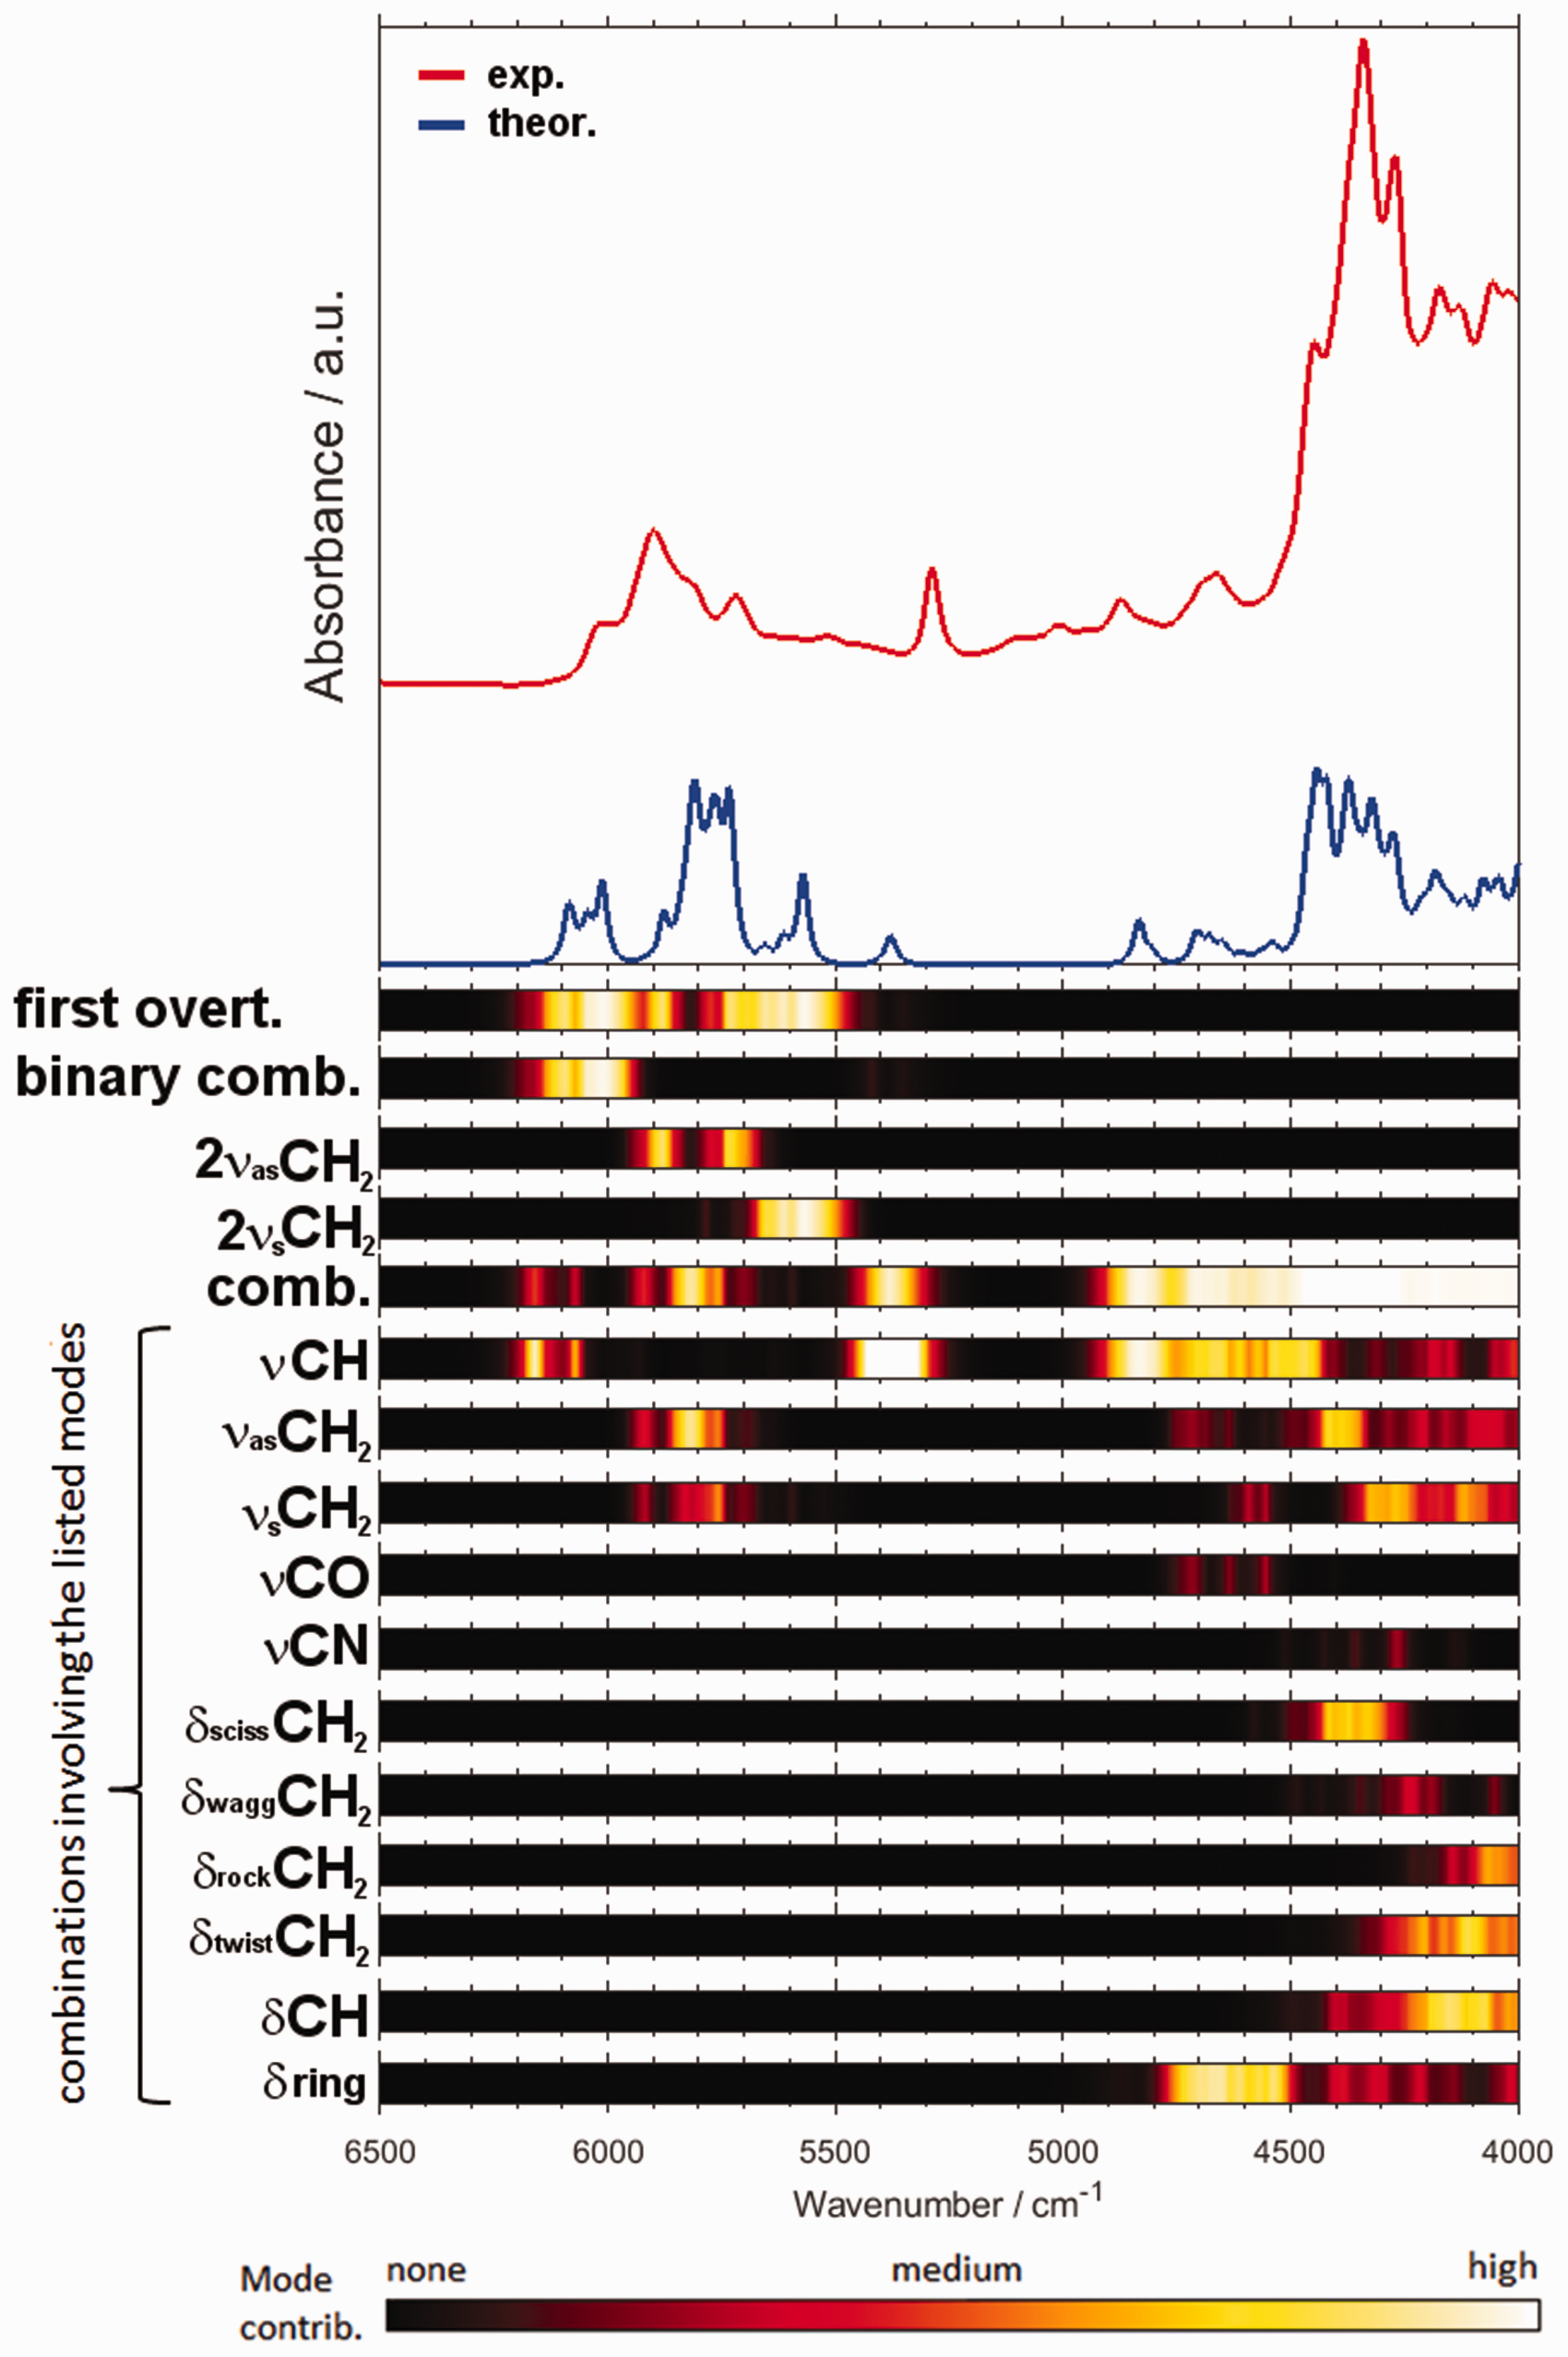
Vibrational Interpretation of the PLS Regression Factors Corresponding to Piperine Content in Black Pepper
With the availability of detailed NIR band assignments of piperine (Fig. 4), one may interpret their manifestation in the regression model, in which the correlation is described between the piperine content in the sample of black pepper and the respective NIR spectrum.
75
Here, the discussion is based on the analytical study performed by us previously.
53
It is particularly interesting to compare the features of PLS regression models constructed on the basis of the spectral datasets obtained with two different instruments (Fig. 5). Based on the detailed band assignments of piperine, the correspondence of the PLS factors and the NIR vibrational contributions of piperine can be roughly established. In this case, we analyzed the results corresponding to a benchtop spectrometer NIRFlex N-500 (Fig. 6a) and a handheld microPHAZIR (Fig. 6b). The distinction of the implemented technology results in a significant instrumental difference between these devices, manifested primarily in the spectral regions in which these spectrometers operate.
50
Importantly, that instrumental difference translates into a measurable inequality in the ultimate analytical performance of these two spectrometers in the quantitative prediction of piperine content in black pepper. Nonetheless, the structure of the respective PLS models demonstrates general similarity. Note, the narrow spectral region in which microPHAZIR operates (6266–4173 cm–1) is just enough to acquire the most meaningful absorption of piperine (Fig. 4), with only weak second overtones and ternary combination bands populating the spectrum above ∼6150 cm–1 in this case. Firstly, as expected, the structure of the loadings plots for all factors indicates a clear correspondence with the absorption features of piperine. Interestingly, exclusion of the region between ∼5550 and 4950 cm–1 improved the performance of the prediction for microPHAZIR (Fig. 6b). Otherwise, the calibration of PLS regression model without such treatment resulted in an overfit, reducing the prediction accuracy of the independent test set. Comparing this information with the determined vibrational assignments (Fig. 4), one may conclude that the contributions from weak νCH combination bands of piperine to the NIR spectrum of black pepper are not acquired well enough by microPHAZIR (Fig. 6b). Conversely, the method based on the measurement by the benchtop spectrometer gained best performance when the entire region of meaningful absorption of piperine was included in the PLS model (Fig. 6a).
Experimental NIR spectra of milled black pepper samples measured by benchtop Büchi NIRFlex N-500 and miniaturized microPHAZIR spectrometer presented in the spectral region of interest (6500–4000 cm–1). Refer to Fig. S2 (Supplemental Material) for the spectra presented in full operational spectral region of the benchtop spectrometer. Loadings plots for the PLSR model of piperine content in black pepper developed for the NIR spectral sets measured with a (a) benchtop Büchi NIRFlex N-500; (b) miniaturized microPHAZIR spectrometer. The spectral region of interest (6500–4000 cm–1) presented here. Refer to Figs. S4 and S5 (Supplemental Material) for further details.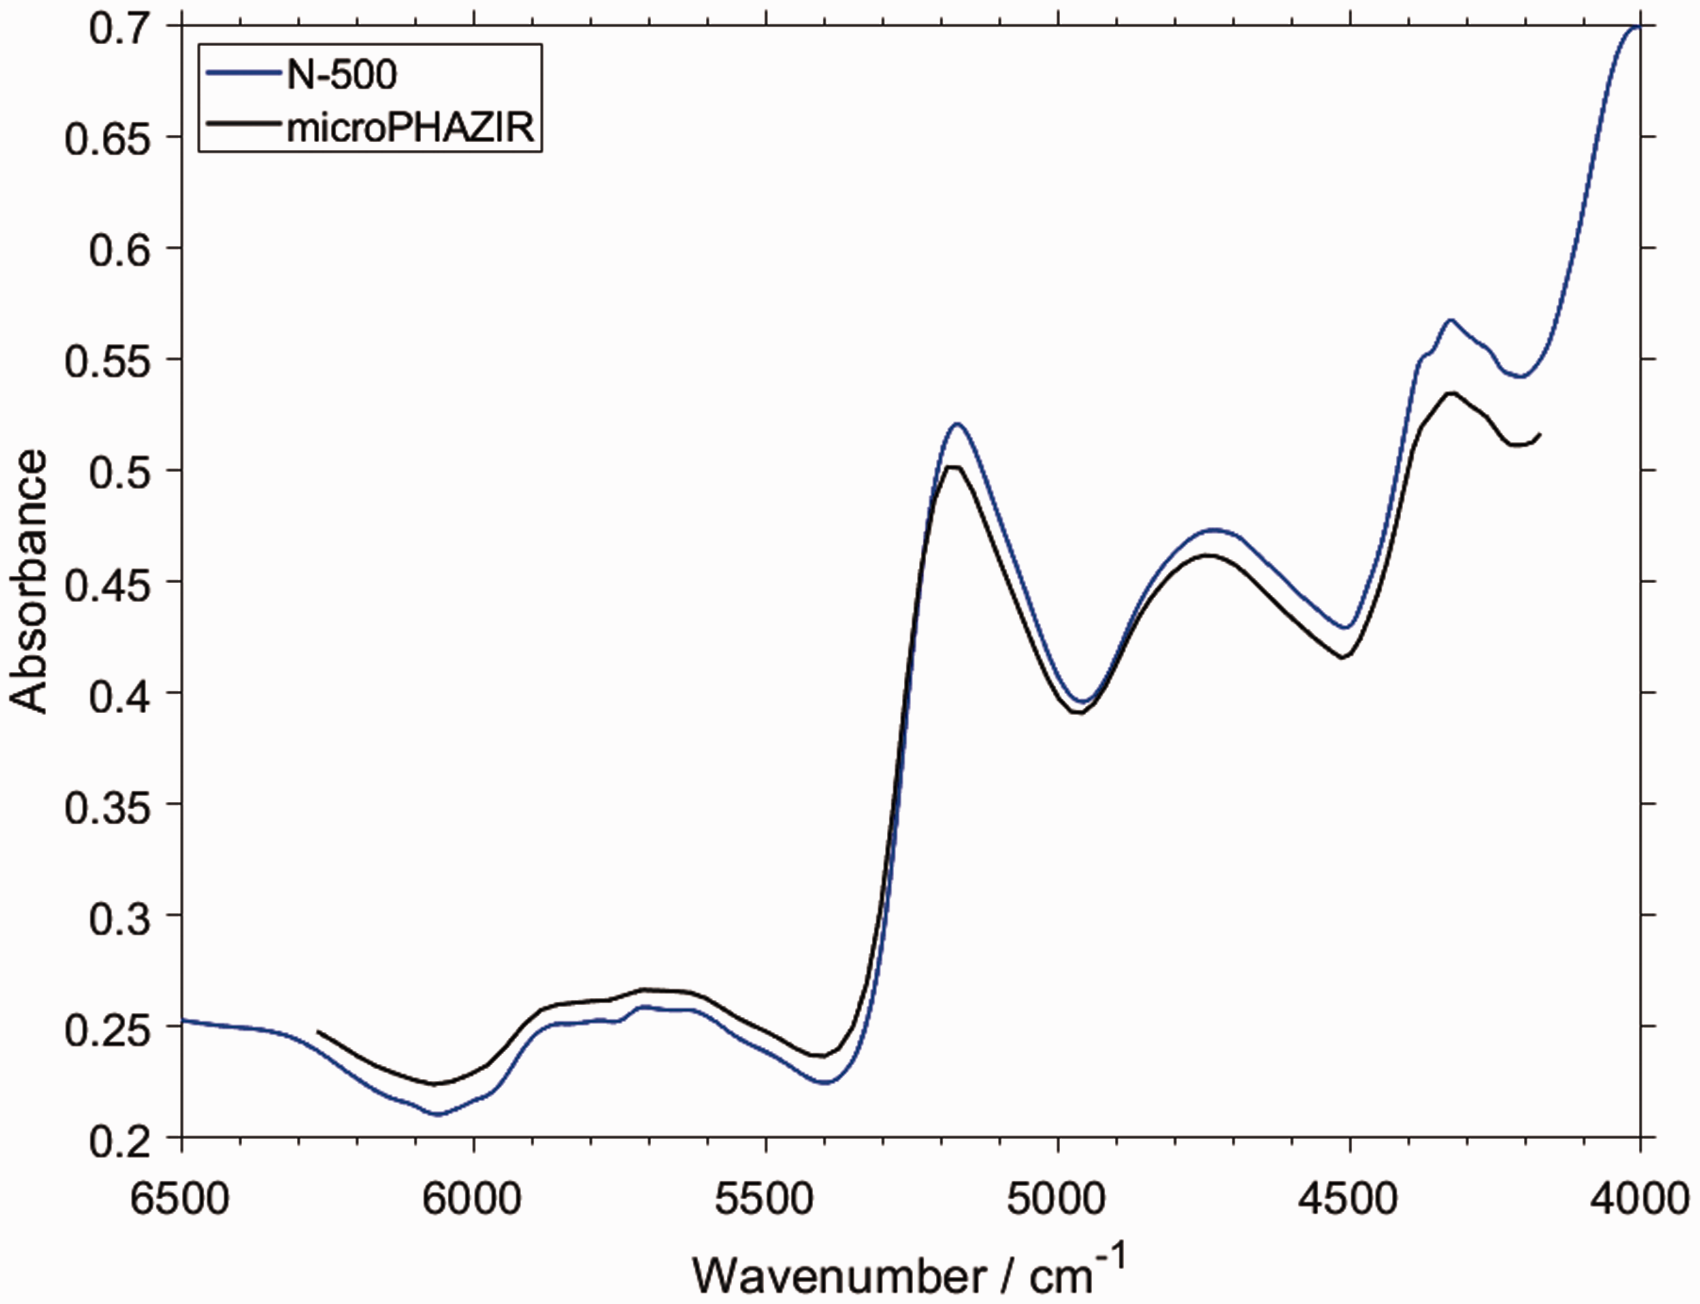
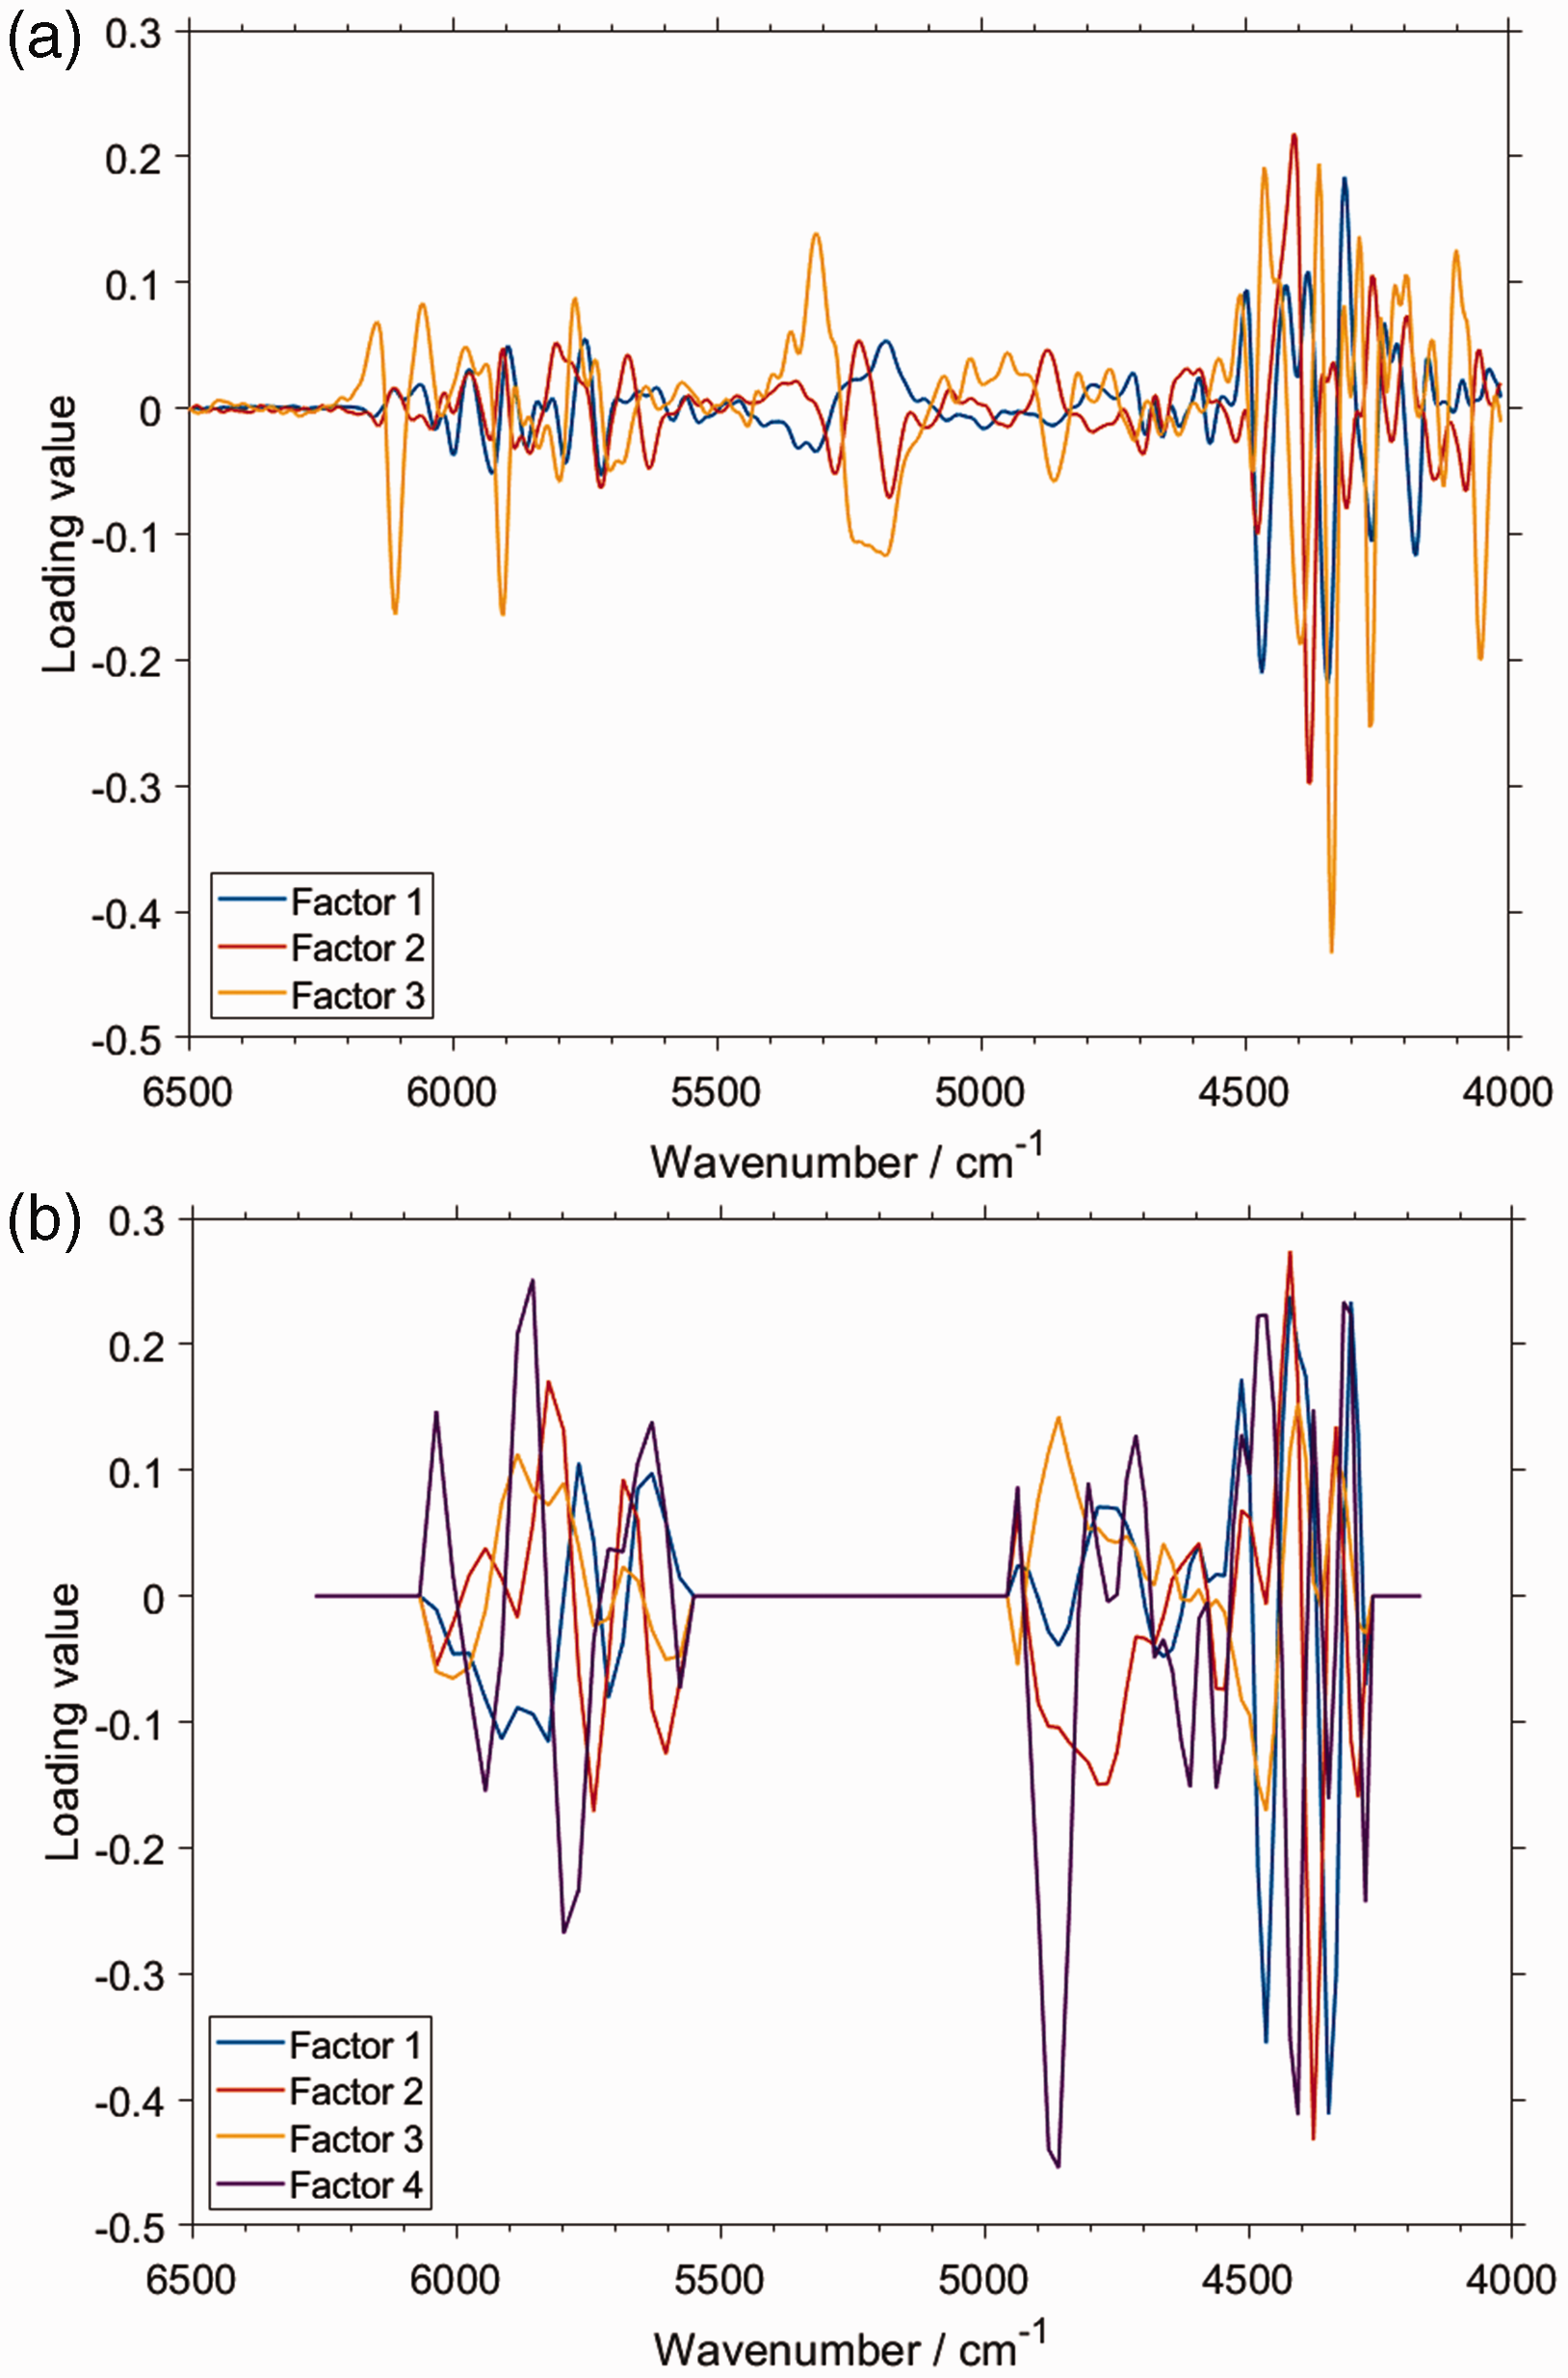
Further, the model constructed for microPHAZIR required four factors to obtain the maximum predictive performance, while for the dataset from benchtop spectrometer the optimal number of factors was three. 53 Interestingly, the structures of the first factors for both cases are quite similar, and these seem to capture the most intense bands of piperine (Figs. 4 and 6). Note, the structure of the third factor in the case of benchtop spectrometer clearly stands out from the remaining ones, e.g., above 6000 cm–1 and in the region of ∼5300–4900 cm–1 (Fig. 6a). At these wavenumbers, one may see, standing out from the rest as well, contributions from the combination bands involving νCH and, to lesser extent, ring deformation bands of piperine (Fig. 4). The presence of the combinations involving ring deformation is also viable in the second factor for the benchtop spectrometer, where a distinct structure is observed near 4750–4500 cm–1. This region corresponds very well to the picture presented in Figs. 3 and 4 (δring). In contrast, in the model constructed for the microPHAZIR spectra, the structure of the four factors is more resembling. However, a correspondence can be seen between the Factor 3 and Factor 4 from the models based on, respectively, the benchtop and miniaturized spectrometers. This is particularly noticeable in the vicinity of 4900–4800 cm–1. It seems probable that the distinct character of the νCH combination bands of piperine is reflected in the Factor 4 for microPHAZIR analysis as well.
In conclusive remarks, it seems that the benchtop spectrometer is more sensitive towards specific vibrations of piperine in black pepper, e.g., as evidenced by the outstanding Factor 3 that corresponds to the νCH combination bands of the analyzed constituent. Distinct contribution of the ring deformation bands to the second and third factor can also be noticed. Therefore, more fine correspondence between specific transitions and the regression model is captured in this case. Conversely, the factors in the PLS regression model constructed for the spectra acquired by microPHAZIR seem less specific. It remains to be verified, whether this observation can, at least to an extent, explain the inferior performance of microPHAZIR versus benchtop spectrometer in the discussed analysis (root mean square of prediction, i.e., RMSEP of, respectively, 0.30 and 0.18% w/w). 53
Conclusion
Complex nature of NIR spectra resulting from intrinsic convolution of the numerous individual bands makes them difficult for interpretation using conventional methods of spectroscopy. On the other hand, anharmonic quantum mechanical calculations capable of simulating NIR spectra from the first principles were practically limited in their availability as the result of computational demand. In this work, we evaluated efficient approaches to this problem with the anharmonic vibrational analysis based on DVPT2 scheme and the underlying semi-empirical concept for the determination of the electronic structure. On the example of piperine, the constituent of the most popular spice in world trade, we directly compared DVPT2//PM6 and DVPT2//ONIOM[PM6:B3LYP/6-311++G(2df,2pd)] approaches. The former offers very high efficiency and the accuracy level suitable for the needs of fast, approximate NIR band assignments. It may be useful for screening of the most prominent features observed in the spectra. Higher accuracy and computational complexity still acceptable for applied spectroscopy may be achieved with the hybrid ONIOM approach. The dissection of an NIR spectrum of piperine obtained this way unveils intrinsically complex structure with high number of overlapping bands. The majority of those are the binary combinations, and in particular, these contributions solely correspond to the absorption of piperine in the 5500–4000 cm–1 region. The detailed NIR band assignments of piperine enabled us to interpret the features of PLS regression models constructed for describing the content of piperine in black pepper samples. Two models were compared developed for the spectral datasets obtained by a benchtop (NIRFlex N-500) and a miniaturized (microPHAZIR) spectrometer. These two spectrometers implement distinct optical principles (respectively, FT-NIR with polarization interferometer and Hadamard with programmable MEMS mask), resulting in profound instrumental difference. However, both are capable of capturing the most meaningful region of NIR absorption of piperine. We concluded that the sensitivity of these two instruments towards specific types of vibrations of piperine differs, with the benchtop spectrometers being noticeably more selective. This difference in acquiring chemical information from the sample may be one of the reasons behind the superior performance of the benchtop spectrometer in analyzing piperine content in black pepper.
Supplemental Material
sj-pdf-1-asp-10.1177_00037028211027951 - Supplemental material for Theoretical Simulation of Near-Infrared Spectrum of Piperine: Insight into Band Origins and the Features of Regression Models
Supplemental material, sj-pdf-1-asp-10.1177_00037028211027951 for Theoretical Simulation of Near-Infrared Spectrum of Piperine: Insight into Band Origins and the Features of Regression Models by Justyna Grabska, Krzysztof B. Beć, Sophia Mayr and Christian W. Huck in Applied Spectroscopy
Footnotes
Acknowledgments
Declaration of Conflicting Interests
The author(s) declared no potential conflicts of interest with respect to the research, authorship, and/or publication of this article.
Funding
The author(s) disclosed receipt of the following financial support for the research, authorship, and/or publication of this article: This work was supported by the Austrian Science Fund (FWF), P32004-N28.
Supplemental Material
All supplemental material mentioned in the text is available in the online version of the journal.
References
Supplementary Material
Please find the following supplemental material available below.
For Open Access articles published under a Creative Commons License, all supplemental material carries the same license as the article it is associated with.
For non-Open Access articles published, all supplemental material carries a non-exclusive license, and permission requests for re-use of supplemental material or any part of supplemental material shall be sent directly to the copyright owner as specified in the copyright notice associated with the article.