
Abstract
Photoacoustic spectroscopic detection of infrared absorption often produces spectra with enhanced intensities for weaker peaks, enabling the detection of features due to overtones and combinations, as well as less-abundant isotopic species. To illustrate this phenomenon, we present and discuss photoacoustic infrared spectra of calcite. We use linearization of rapid-scan spectra, as well as comparing step-scan and rapid-scan spectra, to demonstrate that saturation is not the driving force behind these enhanced intensities. Our results point to a significant knowledge gap, since a theoretical basis for the enhancement of these weak bands has not yet been developed.
Introduction
In the field of materials characterization, infrared (IR) spectroscopy can be used to assess structural differences in materials based on differences in the fundamental bands, as well as in the overtones, combinations, and isotopic peaks. The latter three band types are generally much weaker than fundamental bands, making it difficult to obtain information regarding all of the desired peak locations and intensities from a single spectrum. In traditional absorption spectroscopy, weak peaks can be intensified by increasing the quantity of sample that is examined, but this may cause the stronger peaks to become saturated. The identification of weak bands is even more problematic when sample quantities are limited. Alternative methods for the acquisition of IR spectra are needed in these circumstances. In this work, we discuss one such alternative method, photoacoustic spectroscopy (PAS), and its application to the mineral calcite (CaCO3).
The PAS variant of Fourier transform IR (FT-IR) spectroscopy is based on the detection of thermal waves induced in a sample as it absorbs modulated IR radiation.1–3 PAS is less common than other IR sampling techniques that are based on transmission measurements for samples embedded in alkali halide pellets or solutions, or others based on attenuated total reflection (ATR) of powders, solutions, or films. Nevertheless, PAS is the preferred option for strongly absorbing solid materials, as well as viscous liquids and semi-solids that may consist of multiple phases, which are not amenable to grinding or are insoluble in common solvents. Furthermore, PAS can enable depth profiling of layered or inhomogeneous samples, under specialized experimental conditions. The advantage that PAS offers is based on the fact that the modulated IR energy absorbed by a sample within an enclosed cell produces thermal waves, which in turn create corresponding pressure waves in a carrier gas that surrounds the sample. These pressure (acoustic) waves can be detected by a sensitive microphone or cantilever. The signals produced by these transducers are amplified and then processed by the FT-IR spectrometer, yielding an absorptive PAS spectrum.
Calcite, the material under investigation in the present work, has been widely studied using FT-IR transmission and ATR techniques, but very little by PAS.4–8 Calcium carbonate polymorphs, including CaCO3, appear naturally in many instances and are of importance to materials scientists, archaeologists, and those who study biomineralization.9–11 FT-IR spectroscopy offers distinct advantages relative to diffraction-based techniques because calcium carbonate polymorphs can be easily differentiated from each other even when they are poorly crystallized. This is particularly important in the context of biomineralization, wherein newly mineralized tissues typically form from amorphous calcium carbonate, which then crystallize as they mature.9,11 In archaeological contexts, calcium carbonate can be poorly crystalline when it originates from wood ash or lime plaster binder, but is well crystallized in the form of limestone.10,12,13 Thus, the ability to monitor transitions between amorphous and crystalline CaCO3—as well as intermediate levels of crystallinity—offers great insights with regard to material identification and transformation.
The FT-IR spectra acquired using different variants (ATR, transmission or PAS) are not identical, even when the spectra are acquired for the same sample. Previous work on strongly absorbing samples has shown that differences in peak widths and shapes are sometimes observed when comparing PAS and transmission FT-IR spectra. These differences are often attributed to partial saturation in the PAS spectra; this phenomenon limits maximum intensities while increasing the apparent widths of the strong bands. In these situations, the intensities of weaker bands, such as those arising from combinations and overtones, are enhanced with respect to the more prominent features in the spectrum.
Previous studies, whether experimental or theoretical, have not fully discussed the origins or implications of these differences. In the present context, the accurate analysis of calcium carbonate materials requires the recognition of which differences in the spectra can be attributed to structural differences within the minerals themselves. If differences occur in spectra due to the use of alternative measurement methods (ATR, PAS, transmission), then there is a risk that these differences could be erroneously attributed to variations or changes in the materials under study. In this way, materials scientists require a solid working knowledge of the characterization methods on which they rely for structural data.
We show here—and cite examples from other work in the literature—that differences in peak widths, shapes, and relative intensities can occur among PAS, ATR, and transmission IR spectra of CaCO3. This includes a systematic investigation of saturation-related effects in PAS data.
Methods
We used CaCO3 (analytical grade CaCO3, Merck) as our benchmark material in this study. CaCO3 has been studied extensively in our laboratory and shown to give rise to a number of distinct mid-IR absorption bands, including isotopic ( 12 C, 13 C) peaks, combination modes, and overtones. The assignments of these bands are well known. 14 Prior to each measurement, the CaCO3 powder was manually ground using a mortar and pestle for approximately 2 minutes to sharpen the spectral features, as described in detail elsewhere. 15
All experiments were carried out with vacuum FT-IR spectrometers with thermal infrared (globar) sources. Initial PAS measurements used a spectrometer (Bruker IFS 66v/S) and a microphone-based PAS cell (MTEC PAC300) located at the mid-infrared beamline of the Canadian Light Source. More extensive experiments were carried out at Memorial University with a cantilever-based cell (Gasera PA301) with a different spectrometer (Bruker Vertex 70v). For PAS data collection, a few milligrams of ground powder were loaded directly into an aluminum sample cup that sits inside the PAS cell. Data were collected either under ambient conditions (Memorial) or after the PAS cell was purged with dry helium gas (Canadian Light Source). Carbon black standards (MTEC and Gasera, respectively) were employed to acquire background (reference) spectra. Rapid-scan (continuous scan) and step-scan data were collected with both spectrometers. Rapid-scan spectra were acquired at different frequencies (specified at 15 800 cm–1, the wavenumber of the internal He–Ne laser) ranging from 1.6 kHz to 18.0 kHz. For this range of scan frequencies, the thermal diffusion length of CaCO3 falls in the 60–20 µm range. The physical sample depth is much larger than this, on the order of millimetres, when using 2–5 mg of sample. The intensity scale is labeled as arbitrary units; sample spectra were ratioed against reference spectra recorded under like conditions.
Transmission and ATR IR spectra were also collected (Bruker Vertex 70v). For each ATR measurement, a few milligrams of powder were pressed directly onto the ATR crystal (Bruker Platinum ATR, single reflection diamond, 45° incidence angle), and the data were collected under ambient conditions. Assuming an index of refraction n = 1.6 for CaCO3, the resulting effective penetration depth ranges between 1.8 and 18 µm, for 4000 and 400 cm–1, respectively.
Transmission measurements required diluting the sample (∼1:100) with potassium bromide (KBr) to allow sufficient transparency. The CaCO3–KBr mixture was ground and re-pressed into a 5 mm pellet using a hand press (Pike Technologies) several times before measurement, in order to minimize particle scattering effects that broaden IR peaks. 16 Transmission measurements were carried out under vacuum conditions. The illumination spot is about 4 mm across, and scattering does not increase the heated area. Diluted samples refer only to transmission measurements (using KBr pellets), not ATR or PAS measurements.
Results
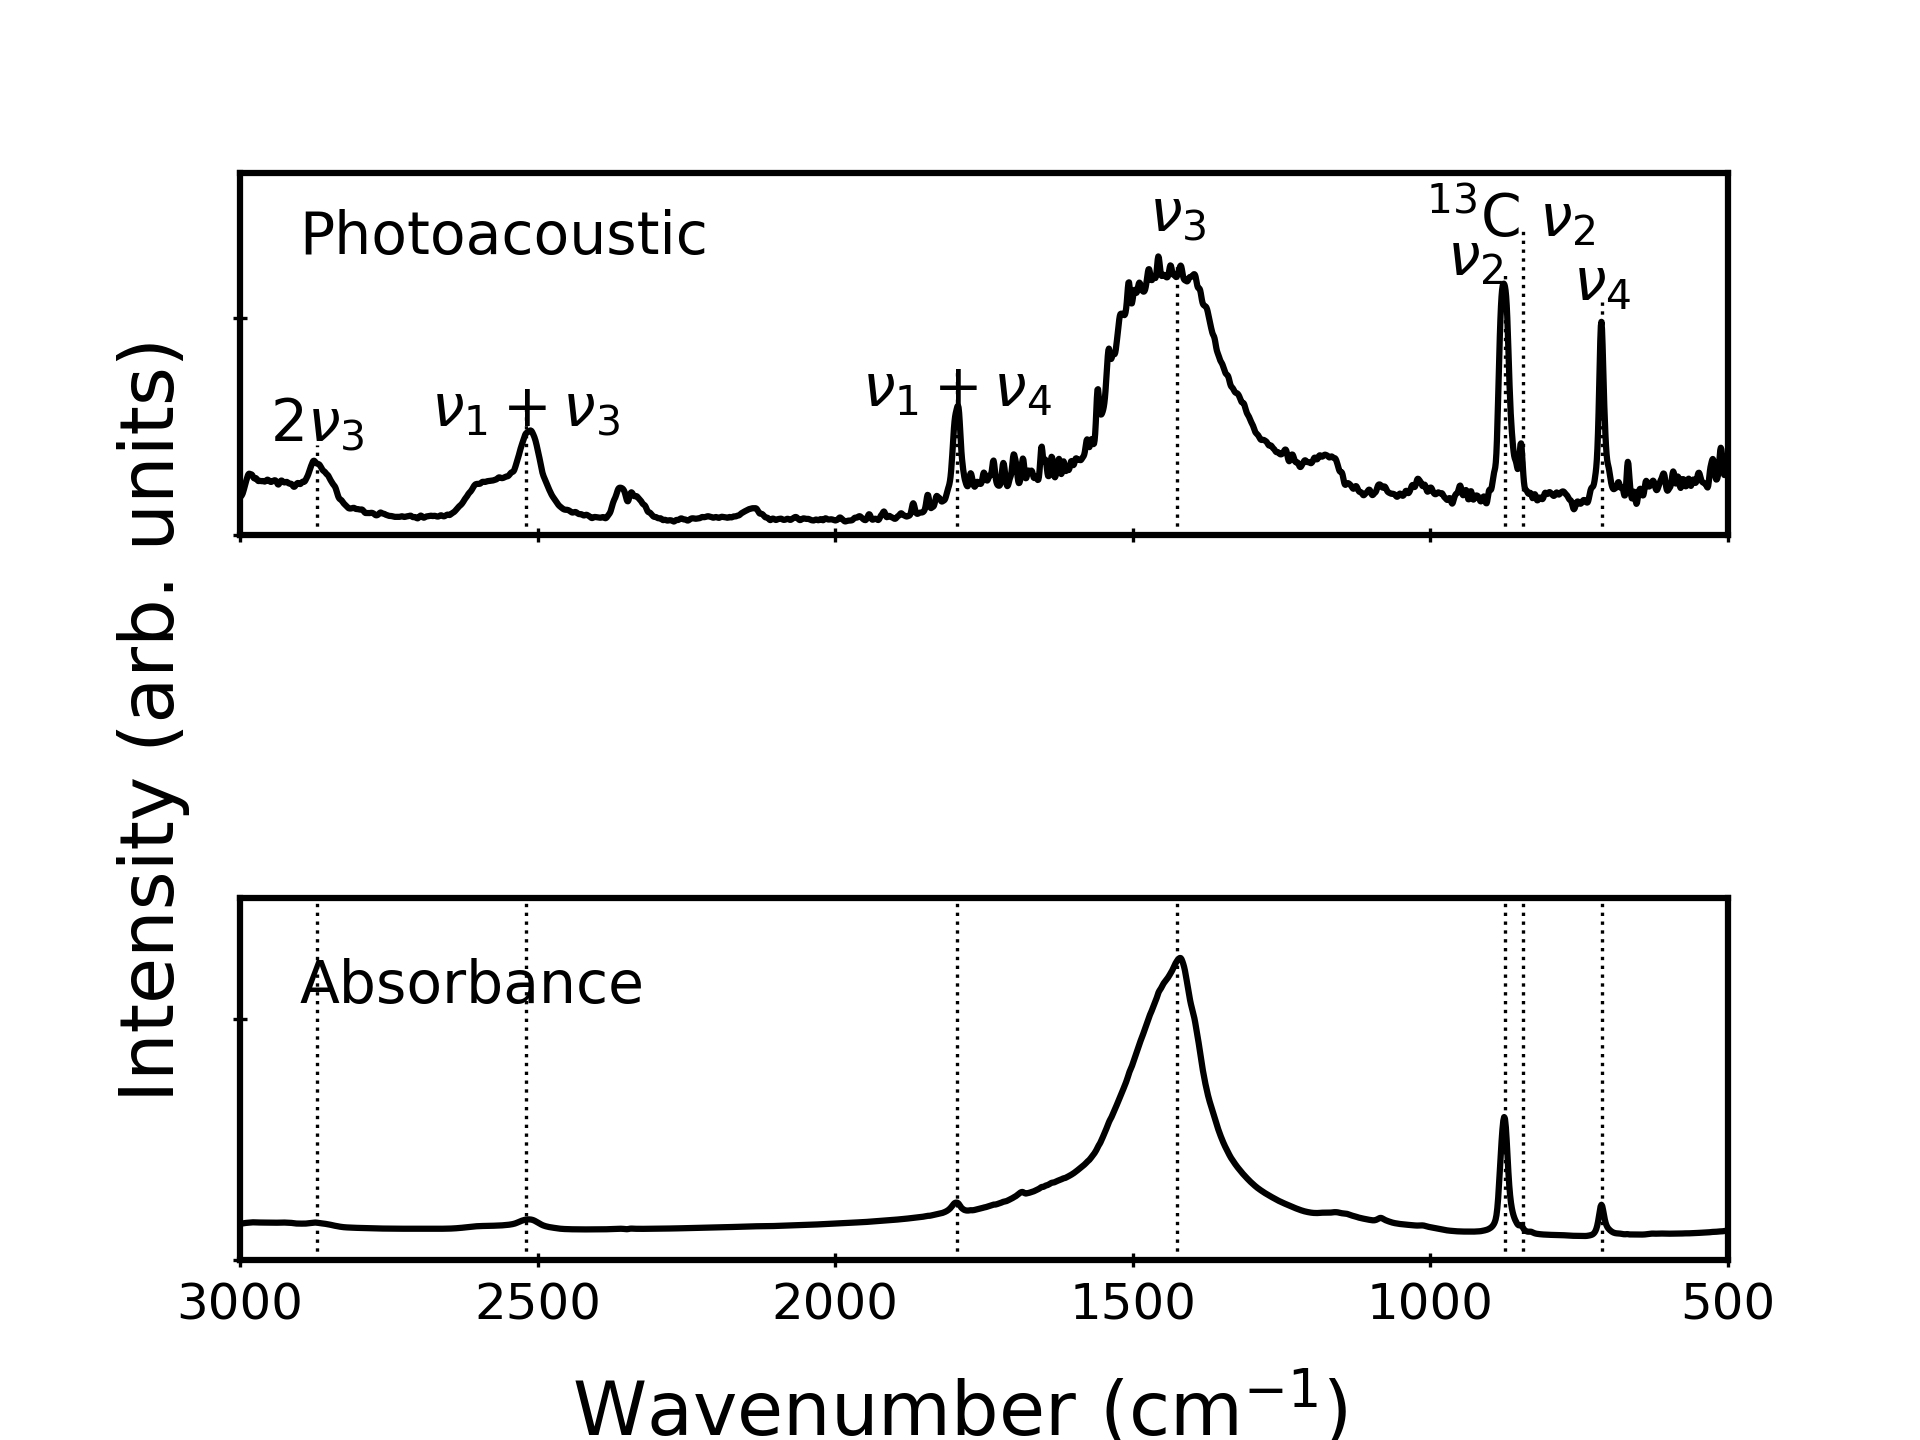
Figure 1 compares rapid-scan PAS, ATR, and absorption spectra collected for the same CaCO3 powder sample. The weakest peaks in the ATR and absorption spectra (middle and bottom, respectively) are greatly enhanced—relative to the strongest ( Representative FT-IR spectra of calcite acquired using three different techniques: PAS (top), ATR (middle), absorption (bottom). Peaks are labeled as fundamentals (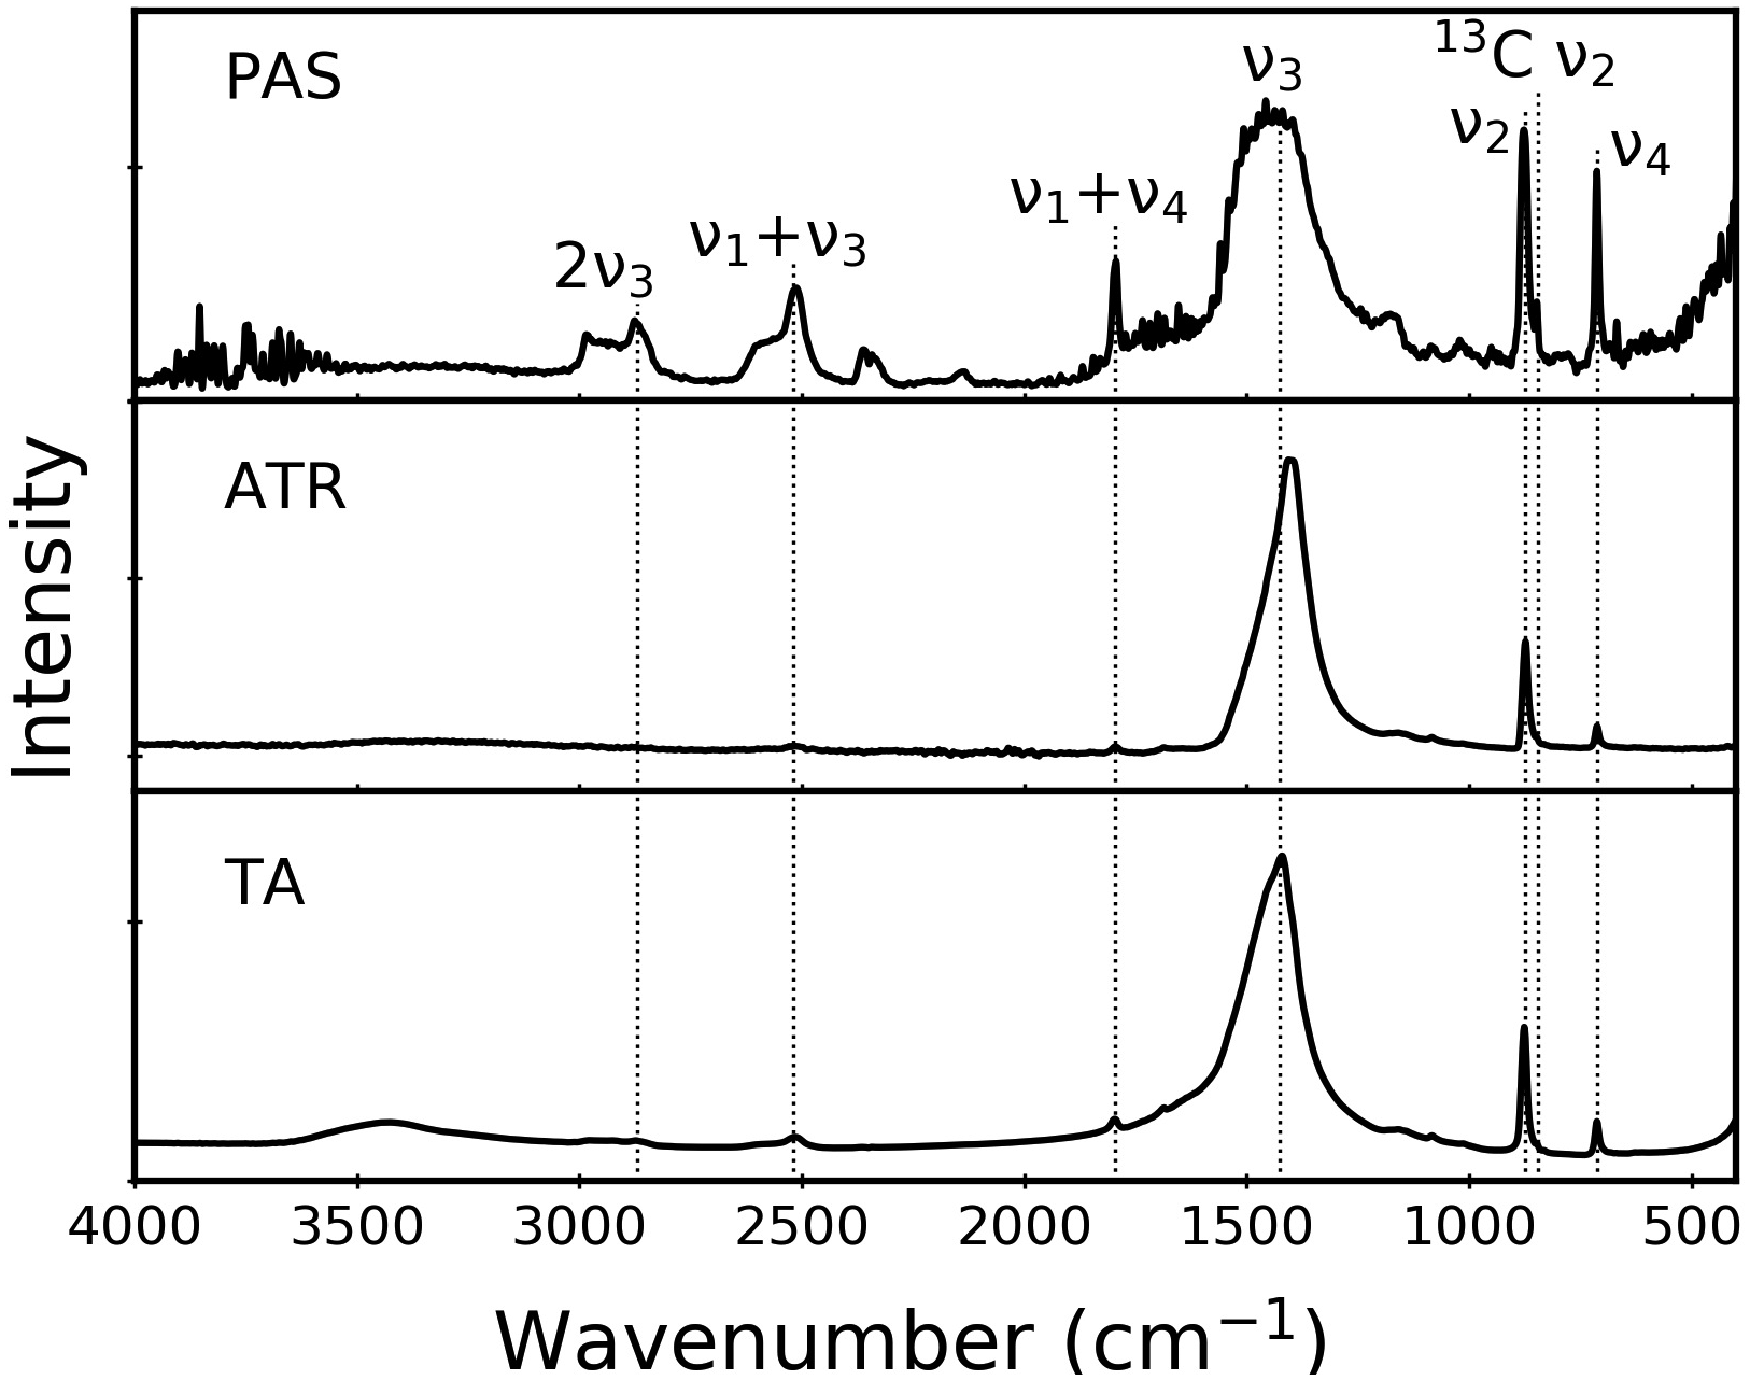
The intensification of the weak overtone and combination bands in the PAS data is a general result that occurs for many solid materials. Indeed, Natale and Lewis noted this tendency nearly four decades ago in near-IR PAS data for carbonyl compounds. 19 More recent studies show this effect in mid-IR PAS data for aromatic hydrocarbons and soils.20–22 Although this intensification is beneficial for analyzing weak peaks, the effect that causes it is poorly understood. Below, we demonstrate that saturation alone cannot explain the enhancement of the weak peaks in the PAS data. In doing so, we describe how we process the data to eliminate any “artificial” contributions to the data, in accordance with best practices described in the literature. 3
Linearization of Rapid-Scan Spectra
The striking differences between the PAS data and the ATR and absorption spectra in Fig. 1 deserve further comment. Given the differences in the overall shape of the strong broad
Figure 2 displays rapid-scan PA spectra acquired at 3.0, 10.0, and 18.0 kHz. As described above, these frequencies refer to radiation at 15 800 cm–1. In a Michelson interferometer such as those used in this work, modulation frequency f (Hz) and wavenumber Representative rapid-scan PAS data for calcite acquired at 3.0 kHz (top), 10.0 kHz (middle), and 18.0 kHz (bottom) with 2 minutes collection time for each. The bottom two spectra show significant noise resulting from the intrinsically weaker spectra at these higher scan frequencies. A wider spectral range for the 3.0 kHz (top) spectrum is provided in Fig. 3.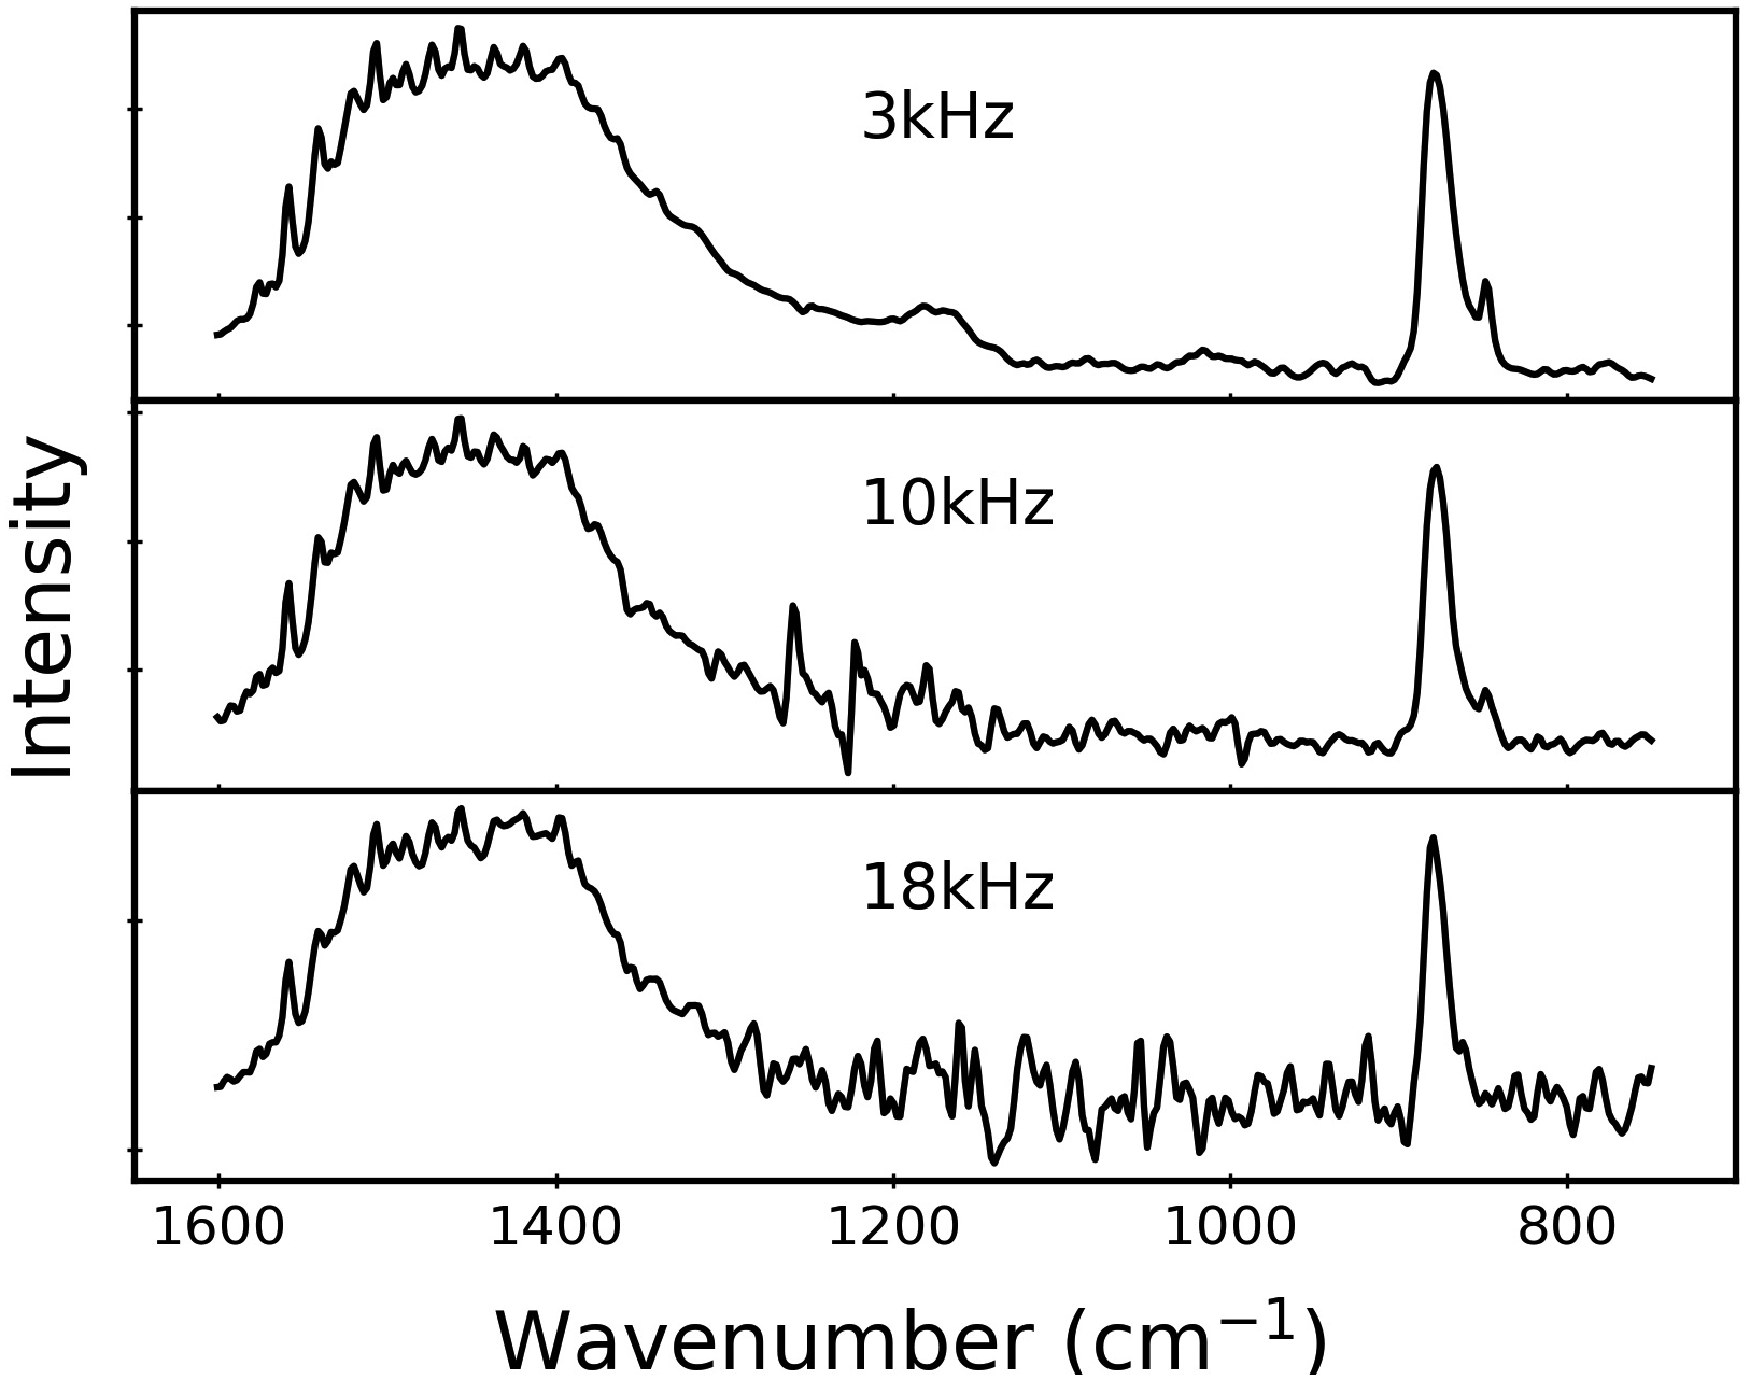
Still referring to Fig. 2, we note that the relative peak intensities of the
To make our case for the lack of saturation more quantitative, we linearize the rapid-scan PAS data. This calculation produces spectra that are linear over one or more orders of magnitude of absorption intensity; put simply, this reduces saturation effects in PAS data. 3 In conventional PAS data treatment, a single-channel spectrum from the sample is divided by a carbon black spectrum acquired under like conditions. In contrast, linearization uses a numerical method developed a number of years ago by Burggraf and Leyden that has been used effectively in several PAS studies.23–25 The linearization calculation utilizes amplitude and phase information for both sample and reference. The procedure uses real and imaginary spectra derived from Fourier transformation of the two interferograms, rather than the more common Mertz phase correction. We emphasize that linearization can correct for intensity saturation effects, but it does not compensate for lineshape differences that occur between PAS and transmission IR spectra.
Figure 3 compares linearized and conventional PAS data for CaCO3. The spectra are quite similar. There is slight narrowing of the broad Comparison of linearized (top) and standard (bottom) rapid-scan PAS data for calcite, recorded at 3.0 kHz for 27 scans. The intensity scales are different due to the calculation details in the two methods, so we report the intensities in arbitrary units and comment only on relative peak intensity changes. We note that at this scan frequency, the first detector resonance (820 Hz) would occur well above the spectral range shown here at 3000 cm–1 is equivalent to 570 Hz.
Step-Scan Versus Rapid-Scan Spectra
A cleaner way to avoid saturation effects is to perform a different FT-IR experiment that uses step-scan mirror movement. In step-scan (step-and-integrate) spectroscopy, the incident radiation is modulated either by chopping the IR beam (amplitude modulation) or by dithering the mirror at each resting position (phase modulation). Amplitude modulation with a chopper modulates the entire spectrum at a single frequency, but with a trade-off that half of the incident intensity is blocked by the chopper blade. Nevertheless, either strategy will ensure that all PAS data are collected at a single frequency, and eliminate the low-wavenumber bias of the rapid-scan spectra. Our experiments employed phase modulation, thereby utilizing all of the available incident intensity.
Figure 4 compares representative step-scan and rapid-scan PAS data for CaCO3. Band intensities above 2000 cm–1 are significantly increased in the step-scan spectrum, as expected. We note that the intensity in this kind of phase modulation spectrum is proportional to a first-order Bessel function, which rises from zero at 0 cm–1 to a maximum whose location varies with modulation amplitude and frequency. A representative example of this effect is provided as Supplemental Material. The Bessel function profile therefore reduces band intensities at low wavenumbers.
3
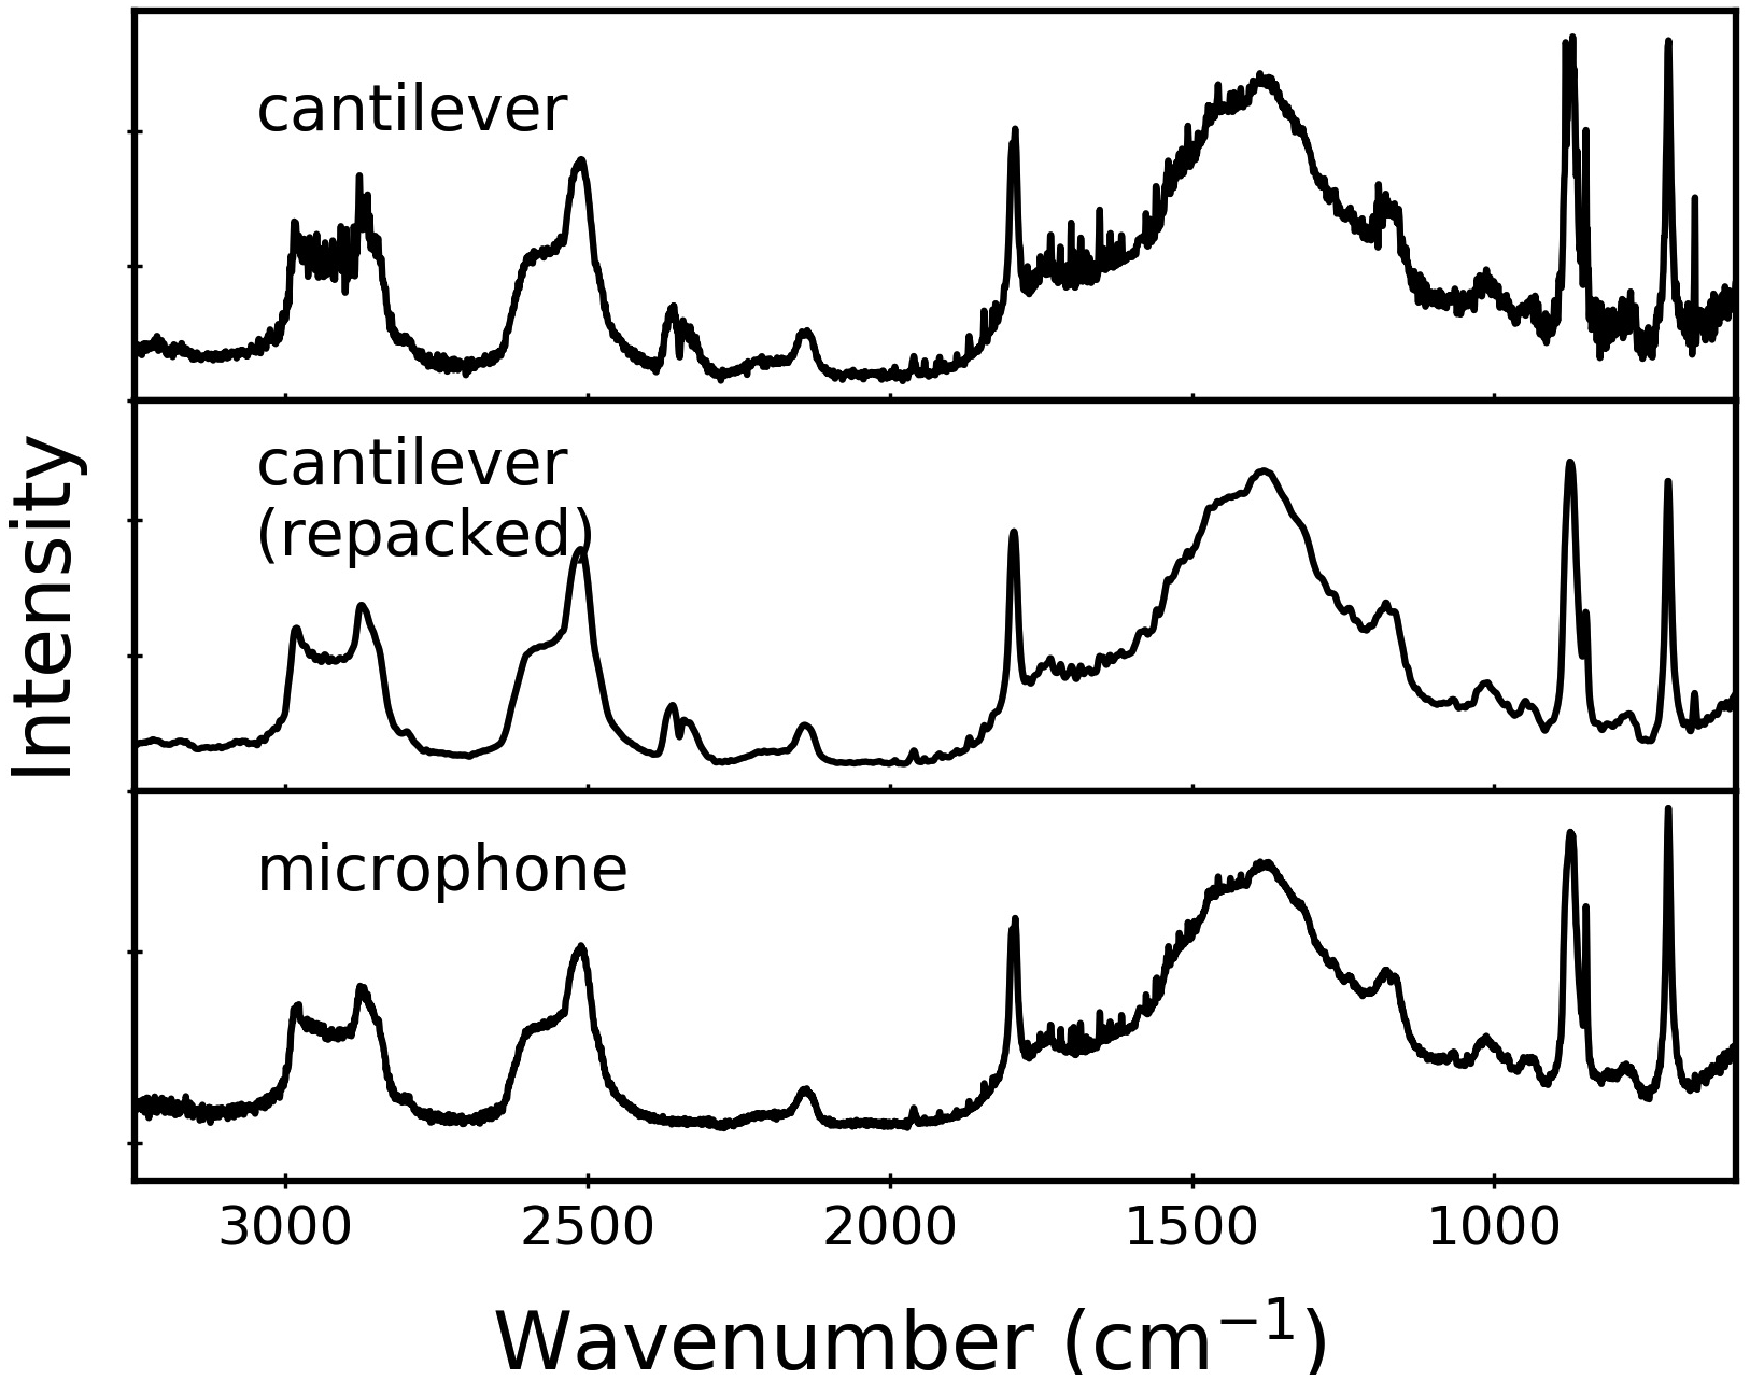
However, this affects both sample and reference, so it is largely eliminated when the CaCO3 spectrum is ratioed against the carbon black reference spectrum. Any difference in modulation frequency between the two spectra contributes to the relative intensity reduction for the Comparison of rapid-scan (top) and step-scan (bottom) PAS data for calcite. The rapid-scan spectrum was obtained at 1.6 kHz for 27 scans, while the step-scan spectrum was acquired using phase modulation at 227 Hz and a modulation amplitude of 2λ (λ = 633 nm) for 64 scans. Representative rapid-scan PAS data for calcite that compare: cantilever transducer (top), cantilever transducer with repacked sample (middle), microphone transducer (bottom). These spectra represent 8, 32, and 512 scans, respectively.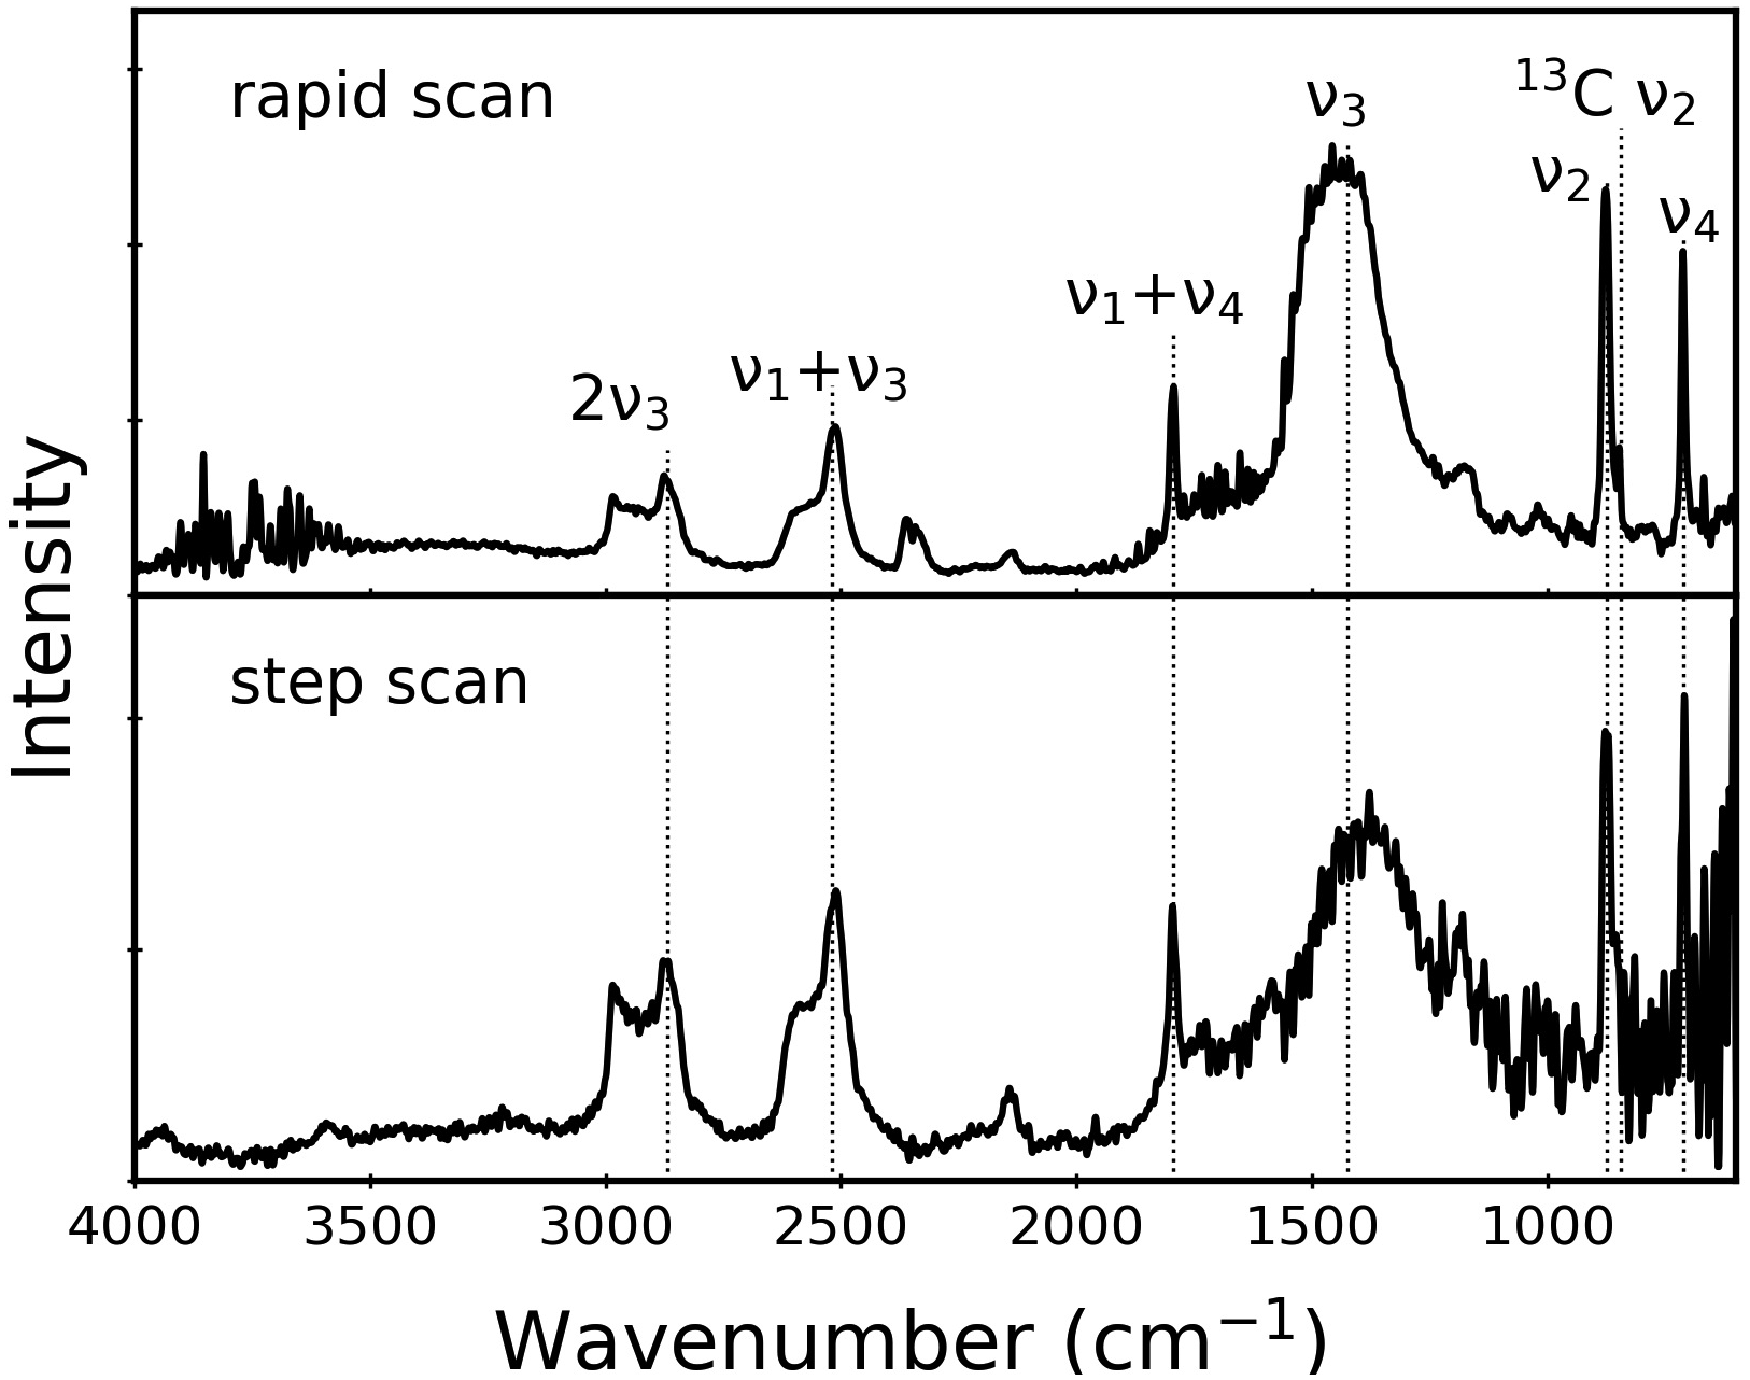
We note that Fig. 4 compares a rapid-scan result obtained at a scan frequency of 1.6 kHz, while the step-scan modulation frequency was 227 Hz. This means that the
Transducer Effects
The relative peak intensities in PAS data for CaCO3 samples are not affected by transducer type (cantilever versus microphone) nor by repacking the powdered sample used for the measurement. Figure 5 shows illustrative data that support this assertion. The top and middle spectra compare the same CaCO3 powder, loaded in the sample cup and packed on different days. The similarity in the resulting spectra is consistent with earlier reports that show PAS data are usually insensitive to the amount of solid, likely because the penetration depth limits how much of the material is probed. 3 For the bottom panel of Fig. 5, a spectrum collected with a microphone-based transducer is virtually identical to the cantilever-based spectra shown above it. We note that all PAS data in Figs. 1 to 4 were collected with a cantilever-based cell.
It is worth clarifying our assumptions about optical and thermal penetration depths. According to Rosencwaig-Gersho theory, for optically transparent and thermally thick samples (the case that could be said to apply for the weak bands), only the light absorbed within the first thermal diffusion length contributes to the PAS signal, even though the light is also absorbed at greater depths.
1
The thermal diffusion length is given by μ
s
= (
Discussion
Our experiments and subsequent analyses, as laid out above, do not point to a reasonable cause for enhanced weak peaks in PAS data for CaCO3. These effects are not associated solely with either rapid-scan or step-scan data. We demonstrate that our sample is substantially thicker than the optical penetration depth or thermal diffusion length. We compare two different kinds of transducers, and find no clues there. Finally, we present a large number of comparisons (including different mirror speeds, collection times, and linearization corrections) that show that the intensity enhancements are not consistent with saturation effects.
Existing theories do not help us understand these intensity enhancements. Transmission IR data for CaCO3 have been simulated by many groups using quantum chemical density-functional theory calculations.14,16,18,26 In these instances, calculations provide energy values for the fundamental vibrational modes, and the IR spectra are then simulated based on initial user-specified broadening parameters and intensities. Relative changes in peak widths and intensities are qualitatively meaningful, but all are based on initial user-specified input, which is based on experimental trends. In this way, the IR peak intensities are not calculated from first principles in the same way that the energies of the vibrational modes are calculated. Furthermore, there are always discrepancies between the calculated and experimentally observed band energies due to anharmonicity. We are not aware of any PAS-specific calculations or simulations for IR spectra of solids.
It is conceivable that scatter-induced enhanced absorption could be a candidate for the anomalous behavior as it would cause unusual and enhanced saturation behavior around
Conclusion
The PAS spectra show persistent, repeatable enhancement of weak peaks due to combination modes, overtones, and isotopic species in CaCO3 relative to transmission and ATR spectra of this material. We have shown that this enhancement is intrinsic to the detection method (PAS) and note that an adequate theoretical explanation for this long-standing phenomenon has not yet been developed.
Supplemental Material
sj-zip-1-asp-10.1177_00037028211009212 - Supplemental material for Photoacoustic Detection of Weak Absorption Bands in Infrared Spectra of Calcite
Supplemental material, sj-zip-1-asp-10.1177_00037028211009212 for Photoacoustic Detection of Weak Absorption Bands in Infrared Spectra of Calcite by Stephen Campbell, Marisa Dusseault, Ben Xu, Kirk H. Michaelian and Kristin M. Poduska in Applied Spectroscopy
Footnotes
Declaration of Conflicting Interests
The author(s) declared no potential conflicts of interest with respect to the research, authorship, and/or publication of this article.
Funding
The author(s) disclosed receipt of the following financial support for the research, authorship, and/or publication of this article: This work was supported by the Natural Sciences and Engineering Research Council (Canada) (grant number 2018-04888). We thank F. Borondics, T. May, and X. Lu from the Mid-IR beamline at the Canadian Light Source.
Supplemental Material
The supplemental material mentioned in the text, consisting of figures and tables, is available in the online version of the journal.
References
Supplementary Material
Please find the following supplemental material available below.
For Open Access articles published under a Creative Commons License, all supplemental material carries the same license as the article it is associated with.
For non-Open Access articles published, all supplemental material carries a non-exclusive license, and permission requests for re-use of supplemental material or any part of supplemental material shall be sent directly to the copyright owner as specified in the copyright notice associated with the article.