
Abstract
It has previously been demonstrated that the ratio of the degenerate four wave mixing signal from two hot water line groups near 3231 cm–1 can be used for seedless flame temperature measurements. This paper presents an investigation of the impact of saturation effects on the measured signal intensity from each line group, as well as an estimation of the accuracy of the method. The saturation effects observed here would result in a large systematic error if they are not taken into account when using the degenerate four-wave mixing intensity of these water line groups to calculate the flame temperature.
Introduction
Temperature measurements are of high importance in combustion research. Molecular line strengths are sensitive to temperature, so accurate temperature measurements are needed to accurately measure the concentration of molecular species. A variety of laser techniques have been developed for temperature measurements in combustion environments. 1 In this work, we use the relative intensity of two water line groups to determine the temperature. This method was first proposed by Sun et al. 2 The two water line groups in question are located in the 3230–3232 cm–1 range, and their relative intensity changes rapidly with temperature in the range 1000–2000 K, making this a potentially very sensitive method for flame thermometry.
The work in our laboratory has been focused on the use of infrared polarization spectroscopy (IRPS) and infrared degenerate four wave mixing (DFWM) for combustion diagnostics of molecular species which otherwise lack available absorption lines in the visible/ultraviolet spectral range. This includes many hydrocarbons and toxic pollutants such as CH4, C2H6, HCN, HCl, HF, etc. Quantitative concentration measurements in combustion environments using DFWM and IRPS have been demonstrated using calibration in a room-temperature gas flow with known concentrations. 3 This method requires accurate knowledge of the temperature during the measurement. A major advantage of using water line thermometry (WALTHER) to determine the temperature is that the strength of the water line groups can also be measured using IRPS or DFWM. This drastically reduces the time and effort needed to obtain the temperature during the concentration measurement, and makes it easier to ensure that the temperature and concentration measurements are taken under the same conditions. For these reasons, WALTHER was employed for spatially resolved HCN concentration measurements. 4
The effect of saturation was already investigated in Sun et al. 2 However, a recent work has raised new questions. Firstly, we have suspected that the mid-infrared dye-pumped laser system, used for IRPS and DFWM measurements, jumps between different longitudinal modes in a way that can vary from scan to scan and thus make the results less reproducible. The dye laser system (Sirah, PRSC-D-18) has recently been equipped with a dynamic mode operation system (DMO), which vibrates the dye laser cavity to increase the randomness of the longitudinal mode structure. It would be good to investigate how this improves the accuracy and repeatability of the measurements. Secondly, the effects of saturation on the accuracy of the WALTHER method need to be quantified. Finally, we wished to investigate how the on-line approach to WALTHER used in Hot et al. 4 perform compared to measuring the line group strength by excitation scans.
This paper performs a systematic investigation of the DFWM signal from the two water line groups employed for water line flame thermometry. The repeatability of the excitation scans and the stability of the measured signal intensity were investigated in several laminar CH4/H2/air flames at different temperatures. The saturation intensity for the different line groups was investigated at different flame temperatures, and the effect of the different degree of saturation on the WALTHER line ratio was thoroughly investigated. In order to calibrate the results, the temperature in the flames was measured using laser Rayleigh scattering (LRS), and this value was used as a reference for the later WALTHER measurements using both the on-line and scanning approach.
Theory
Water Line Thermometry with Degenerate Four Wave Mixing
Figure 1a shows the simulated DFWM water line spectra at 1200 K and 1800 K. Each of the lines in this spectral range is in fact a line group consisting of two or more closely spaced transitions, also marked in the figure. The DFWM water line thermometry technique introduced by Sun et al.
2
uses the ratio between water line groups II and III to determine the flame temperature. As can be seen in the figure, the relative strength of line groups II and III changes rapidly over this temperature range: line group II has highest intensity at lower temperatures, while the relative strength of line group III increases at higher temperatures. Figure 1(b) shows the measured DFWM excitation scans of these water lines recorded in laminar CH4/H2/air flames. The scans were recorded at 1520 K (Flame 8), 1681 K (Flame 5) and 1805 K (Flame 1). The flow rates of fuel and air for the different flames are shown in Table III. The measured spectra also show the increasing intensity in line group III with increasing temperature.
(a) Simulated DFWM water line spectra of the line groups used for thermometry. This shows the large change in ratio between line groups II and III over the primary range of the waterline thermometry technique. The red vertical lines indicate individual transition lines. The data used for the calculated line shapes was taken from HITEMP 2010.
5
(b) Line scans measured in selected CH4/H2/air flames. As can be seen here, the change the in relative intensity between line groups II and III is very clear even for smaller changes in temperature. The pump intensity during the measurements was Ipump = 0.6 TWm–2.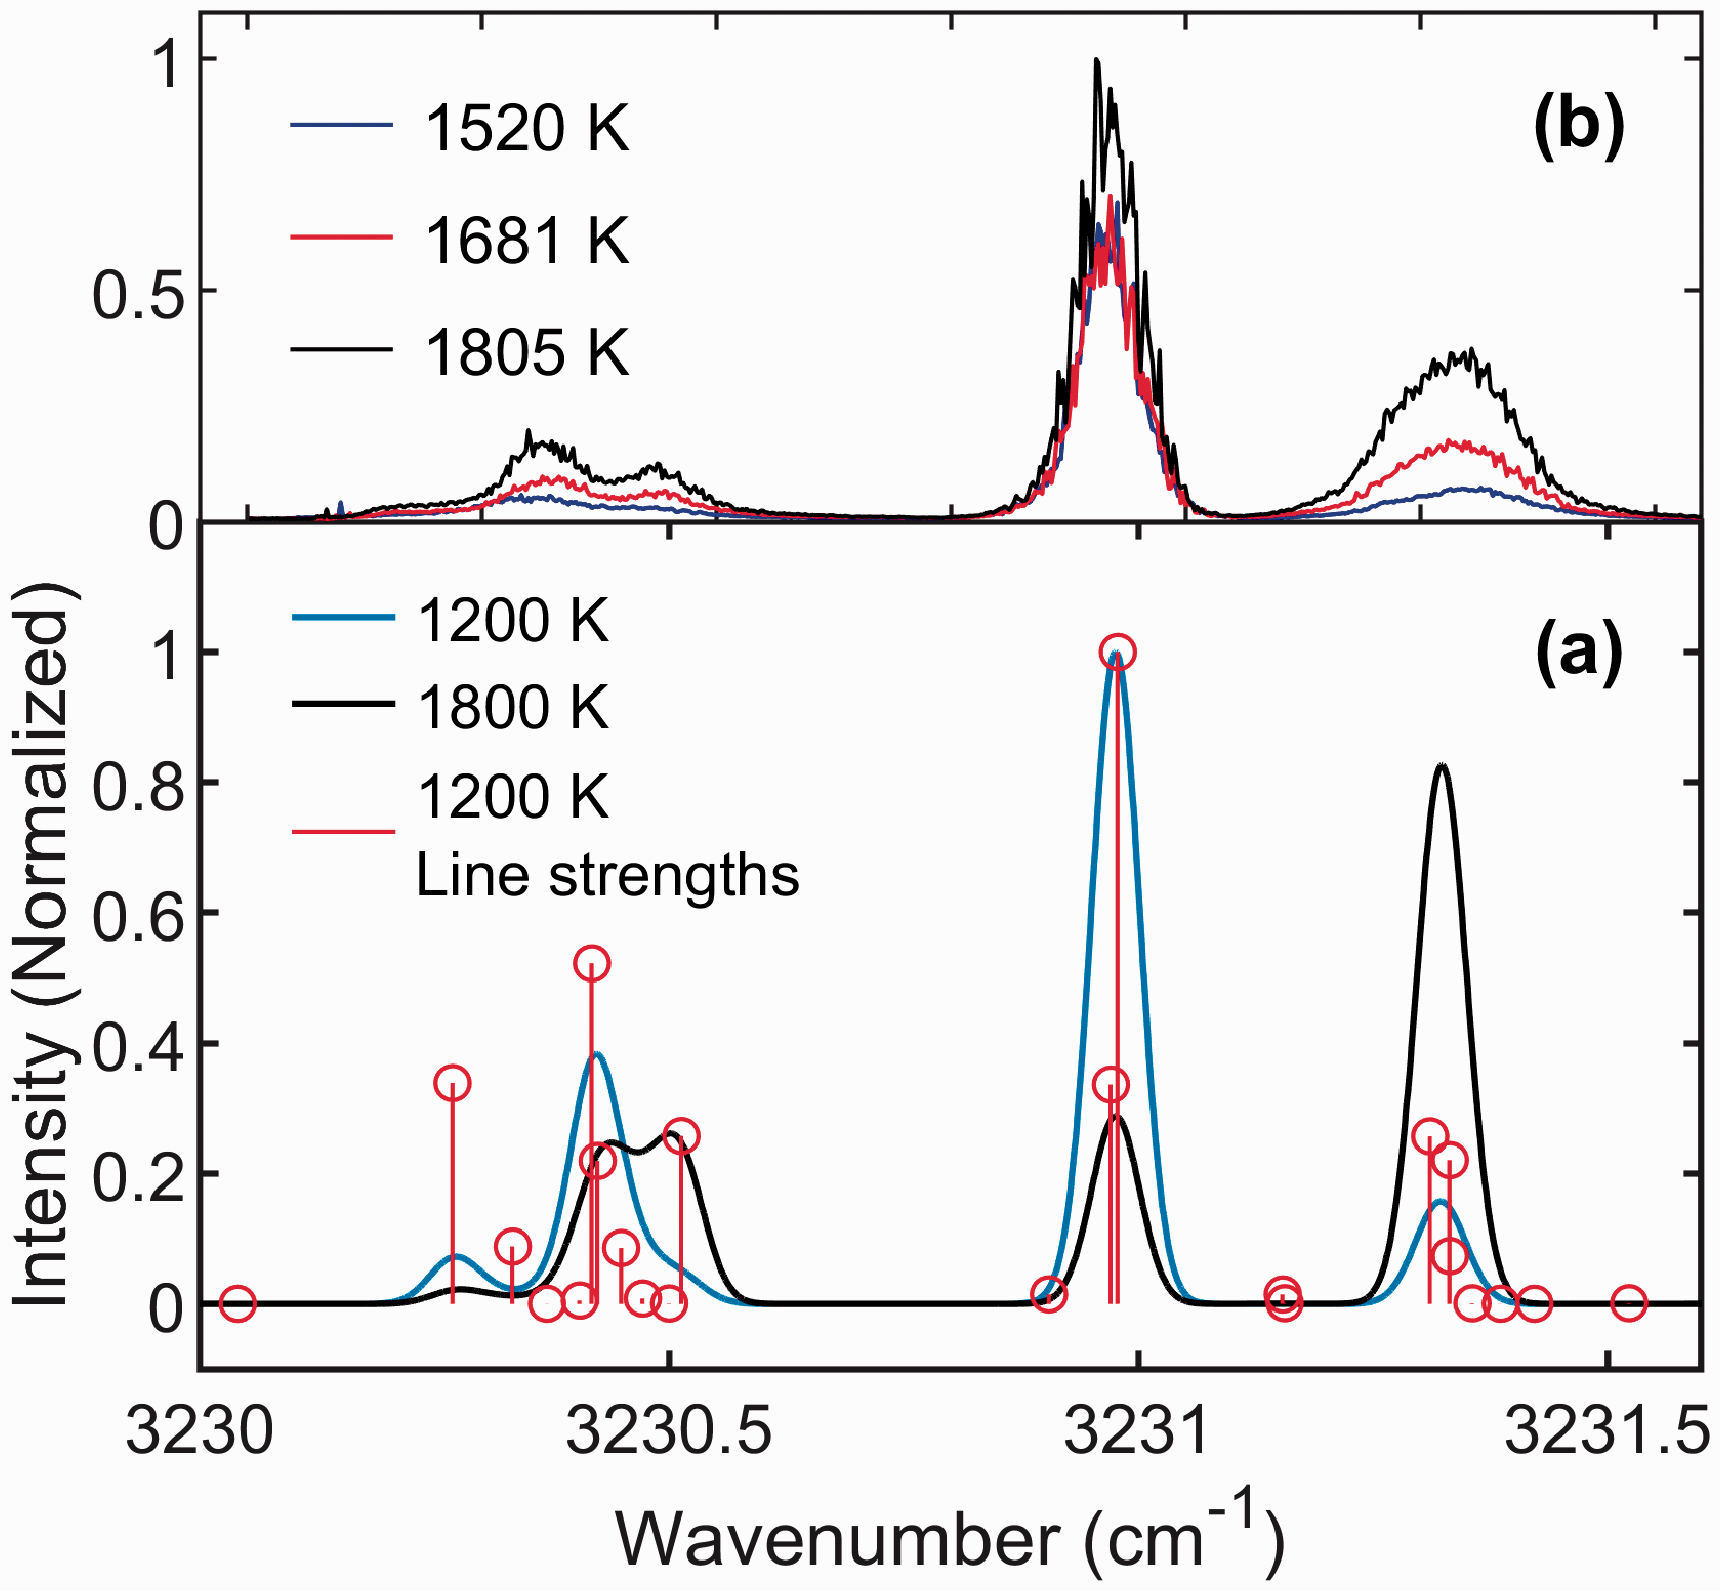
The individual transition lines that make up line groups II and III are listed in Table I. Note that the data used here come from HITEMP 2010,
5
while Sun et al.
2
used HITEMP 2000 data. The line labelled as ‘e’ in this article was not included in the HITEMP 2000 database, and therefore was not included in the analysis by Sun et al. The line strength Sn of each individual line n scales with the temperature T as
6
The line strength as a function of temperature for the individual lines comprising the two water line groups used for thermometry. The data used to calculate these were taken from HITEMP 2010.
5
Water line data for the two groups used for WALTHER, taken from HITEMP 2010.
5
Note: The lines are named to match the nomenclature used by Sun et al.,
2
except for the line labelled “e”.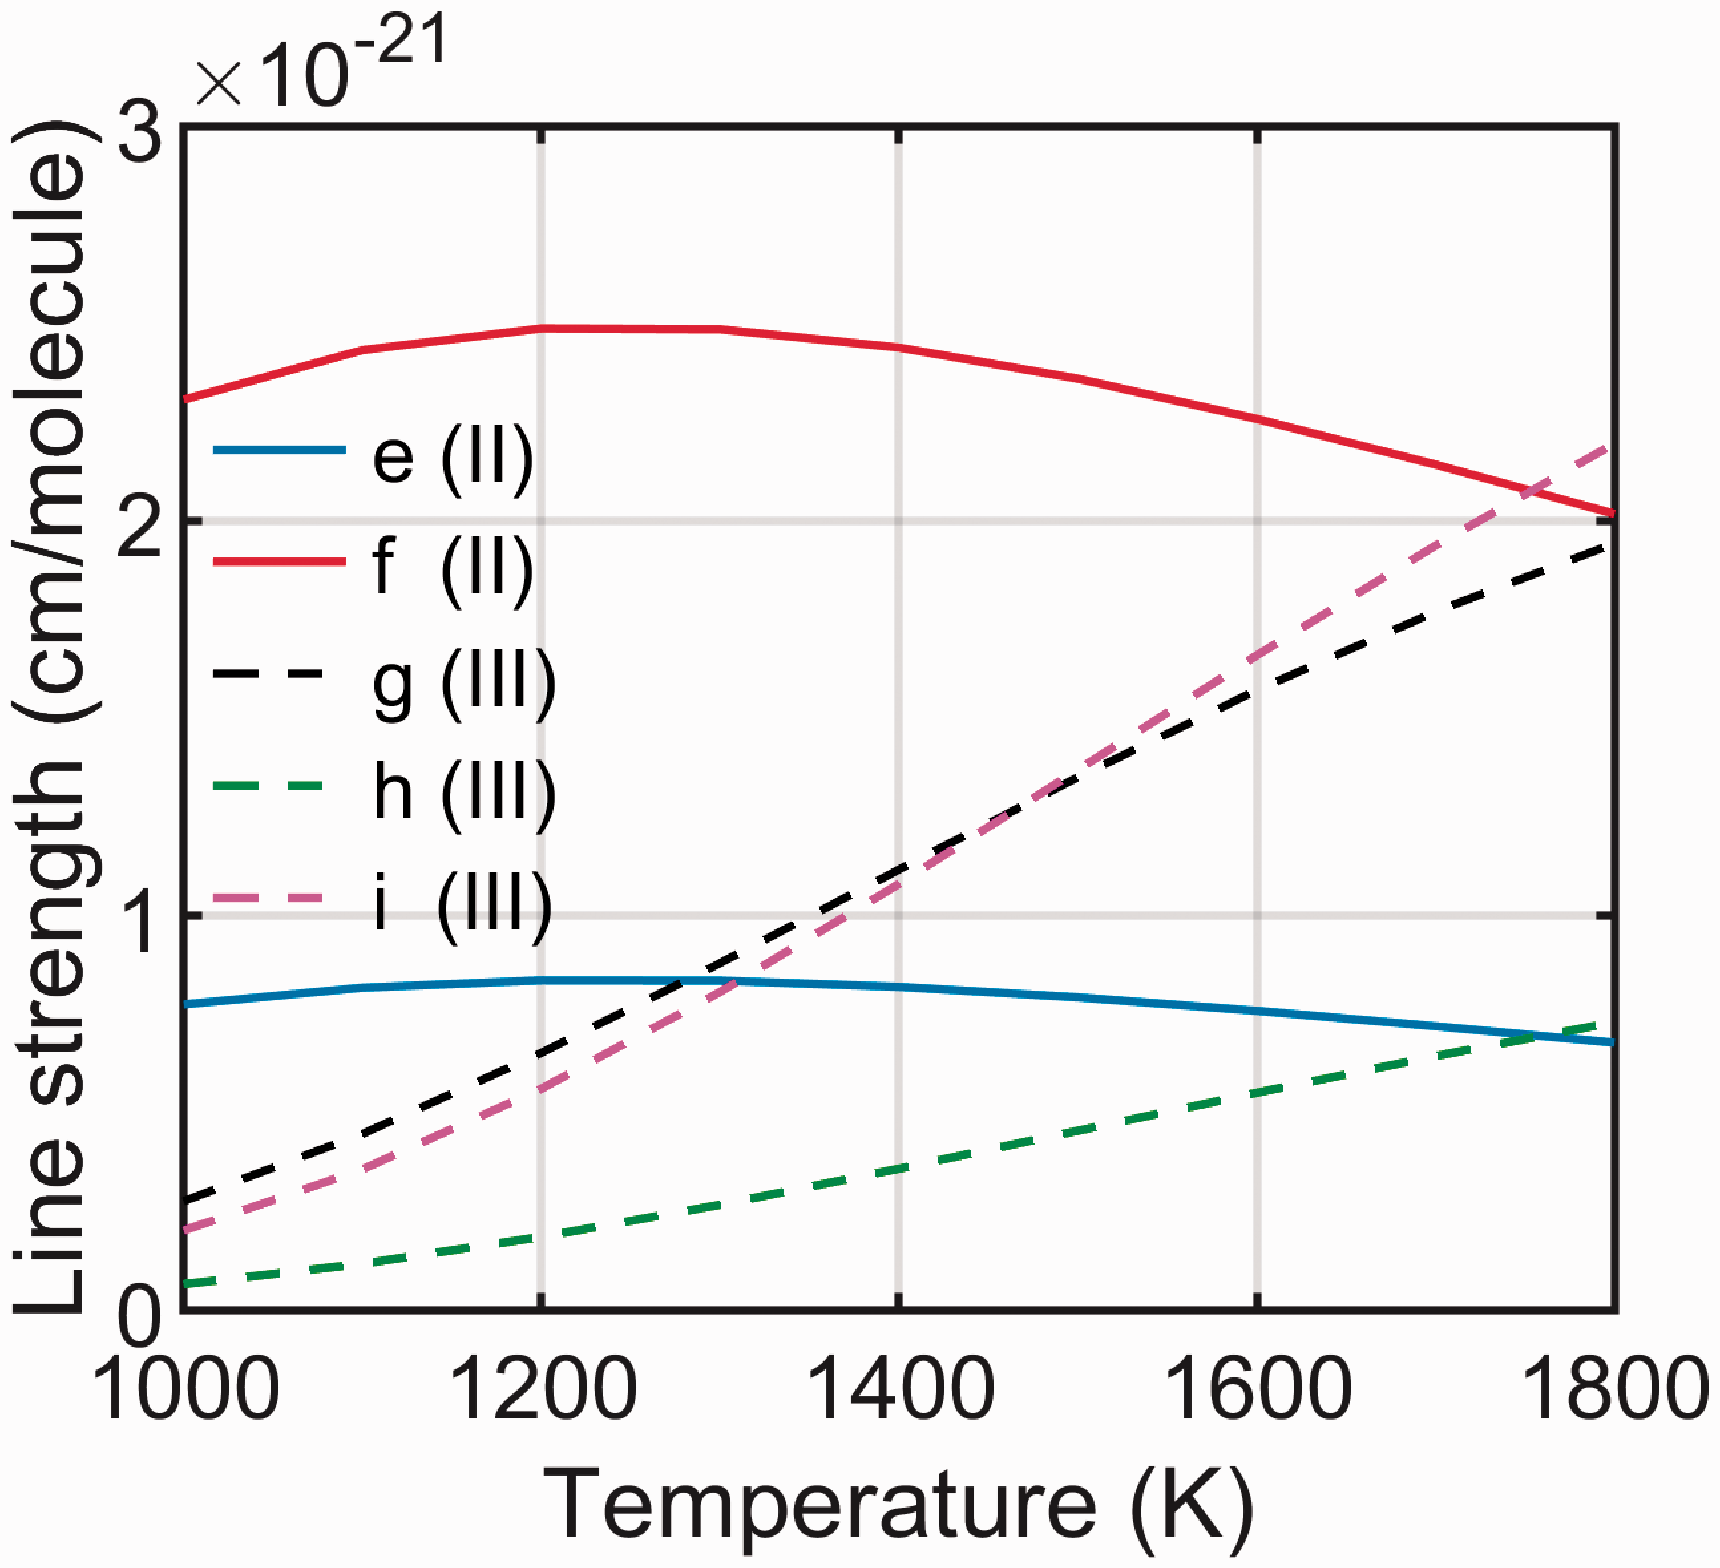
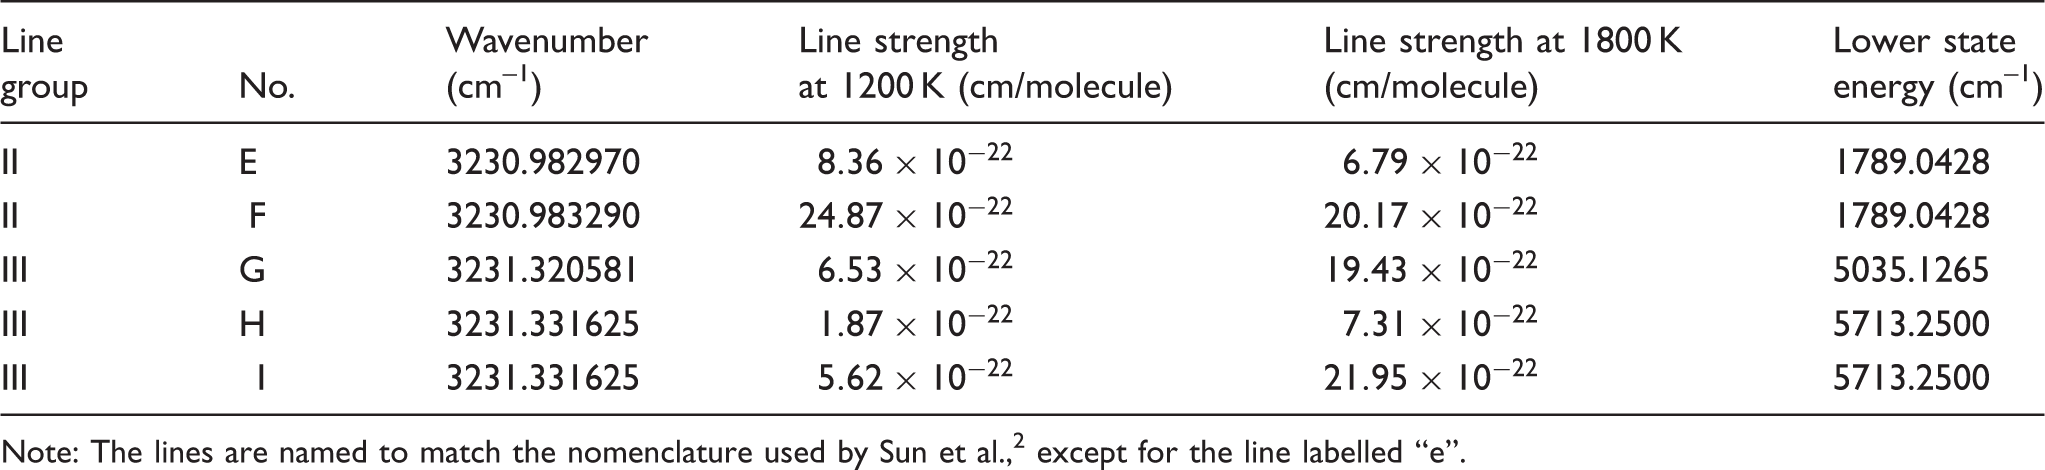
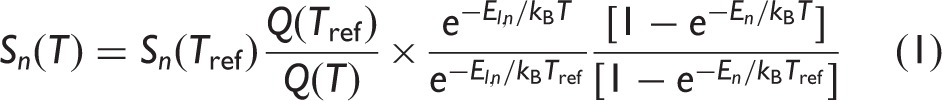
As can be seen, the line strength of the transitions in line group II changes very little over the interval 1000–1800 K, while the line strength of the transitions in line group III changes rapidly within this temperature range.
Saturation of the DFWM signal in the strong field limit for equal intensity pumps has been investigated by Williams et al.
7
The line-center DFWM signal, Isignal, is given by
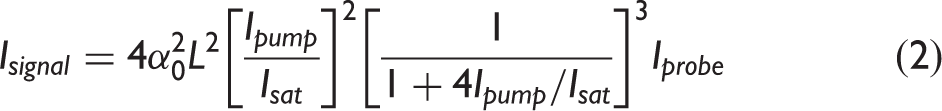
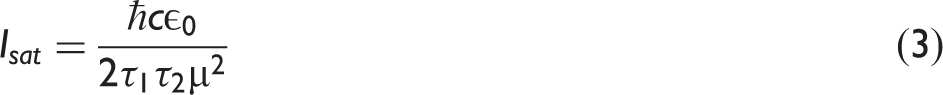
As can be seen, the line-center DFWM signal changes significantly depending on the degree of saturation. For
The mathematical model described by Williams et al. 7 assumes a weak probe field and saturating pump beams, while probe and pump beams of equal intensity are used here. In addition, interference effects from the closely spaced transition lines within group II and III are not included in the model. The mathematical model is, therefore, only used to provide a rough estimate of signal behaviour. Saturating probe fields in DFWM have been treated by a non-perturbative analytical model 10 and by direct numerical simulation (DNS). 11 Closely spaced transitions in DFWM have been treated analytically 12 and by DNS. 13 However, the application of these simulation methods is outside the scope of this work.
Laser Rayleigh Scattering Thermometry
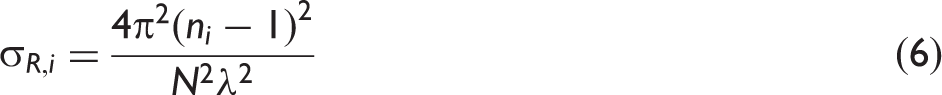
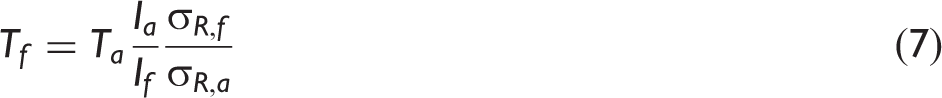
Laser Rayleigh scattering (LRS) measures the elastic scattering of light from molecules. In LRS, a laser beam is directed through the measurement medium, and a camera is aligned to measure the Rayleigh scattered light from the molecules. The intensity of the scattered light can be used for accurate temperature measurements. LRS has been applied for flame thermometry in a wide variety of alignments and environments (see e.g., literature11–14). The intensity IR of the Rayleigh scattered light is given by
14

Refractive index (n) and Rayleigh cross section (σR) at 457 nm for different gases.
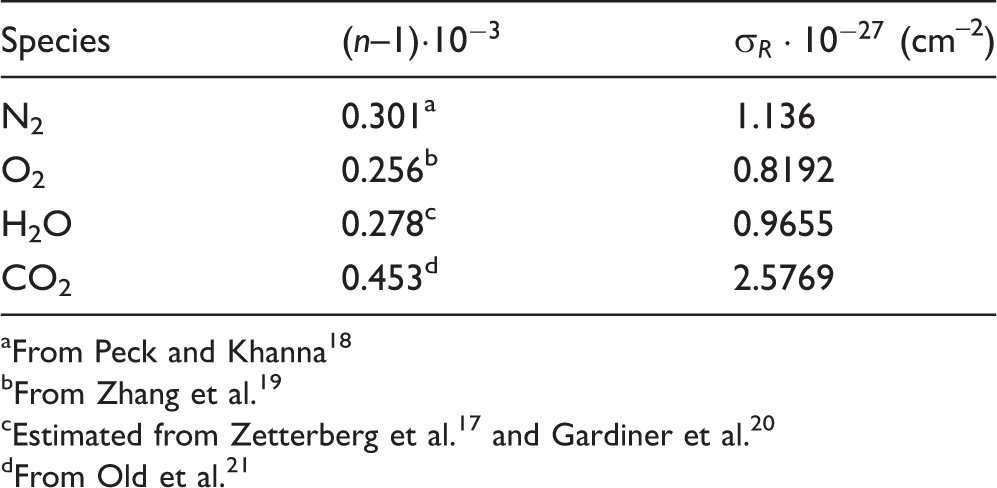
From Peck and Khanna 18
From Zhang et al. 19
From Old et al. 21
Experimental Arrangement
Degenerate Four Wave Mixing setup
The DFWM pump and probe beams were generated by a pulsed IR dye laser system, which has been described previously. 22 The mid-infrared laser light is produced by difference-frequency mixing in a LiNbO3 crystal, between a narrow-band dye-laser beam at 792 nm (Sirah, PRSC-D-18, with dye LDS 798) and a single-mode 1064 nm laser beam from a Nd:YAG laser (Spectra Physics, PRO 290-10). The laser provides pulse energies up to 6.3 mJ in the 3230–3232 cm–1 spectral range used here, with a linewidth of less than 0.025 cm–1, at a repetition rate of 10 Hz. In addition to what is covered in the previous descriptions, 22 the system has been equipped with a dynamic modulation operation (DMO) mode. This randomizes the longitudinal mode distribution of the dye laser output by vibrating the cavity mirrors at 11 Hz, in order to average out effects of mode jumping. This reduces the variability between separate scans. In practice, we did not see much difference with the DMO on/off, which could be because the mode jumping is still within the linewidth of the absorption line. The shot-to-shot variation for the online measurements on line group III is much less compared to the narrower line group II, which supports this assumption.
A diagram of the setup used for DFWM is shown in Fig. 3. The IR-laser is first passed through a half waveplate and a polarizing beamsplitter. The angle of the half waveplate can be adjusted to control the energy of the laser pulses transmitted through the polarizing beamsplitter. The IR laser beam is overlapped with a 632 nm visible HeNe laser beam for the ease of alignment. The IR beam is split in the horizontal plane, to two parallel beams using a beamsplitter (BS). These two beams are then split in the vertical plane into four parallel beams using a BOXCARS plate.
23
The four beams are spaced at the four corners in a square. One of these beams is chosen to be the alignment beam. This beam traces the path the generated signal beam will follow, which enables the alignment of the signal beam path to the detector. During the experiments, the alignment beam is blocked using a beam block. The remaining beams are focused to a common crossing point using the lens L1, 2 inches in diameter with a 500 mm focal length which results in a beamwaist with a 0.22 mm radius. The size of the measurement volume is estimated to be 0.22 × 0.22 × 11 mm3, and the measurement point was aligned at 8 mm height above the burner (HAB). The pump and probe beams are then blocked using an iris, while the signal is let through and collimated using lens L2, which has a focal length of 500 mm. The signal is directed to the upconversion detector, where the signal intensity is reduced using ND filters if necessary. Lens L3 is used to focus the signal beam into the periodically poled lithium niobate (PPLN) crystal of the upconversion detector, to match the beam width of the 1064 nm pump in the detector. To achieve the optimal focal length, L3 consists of two lenses with focal lengths of 1000 mm and 200 mm for an effective focal length of 167 mm. The upconversion detector uses an intracavity system to do sum frequency generation between the IR signal and a 1064 nm pump, for increased sensitivity. The system and its advantages have been described in detail elsewhere.23–25
M1-7: mirrors. M2: dichroic mirror. BS: Beam splitter. PBS: polarizing beam splitter. BCP: BOXCARS plate. L1-3: lenses.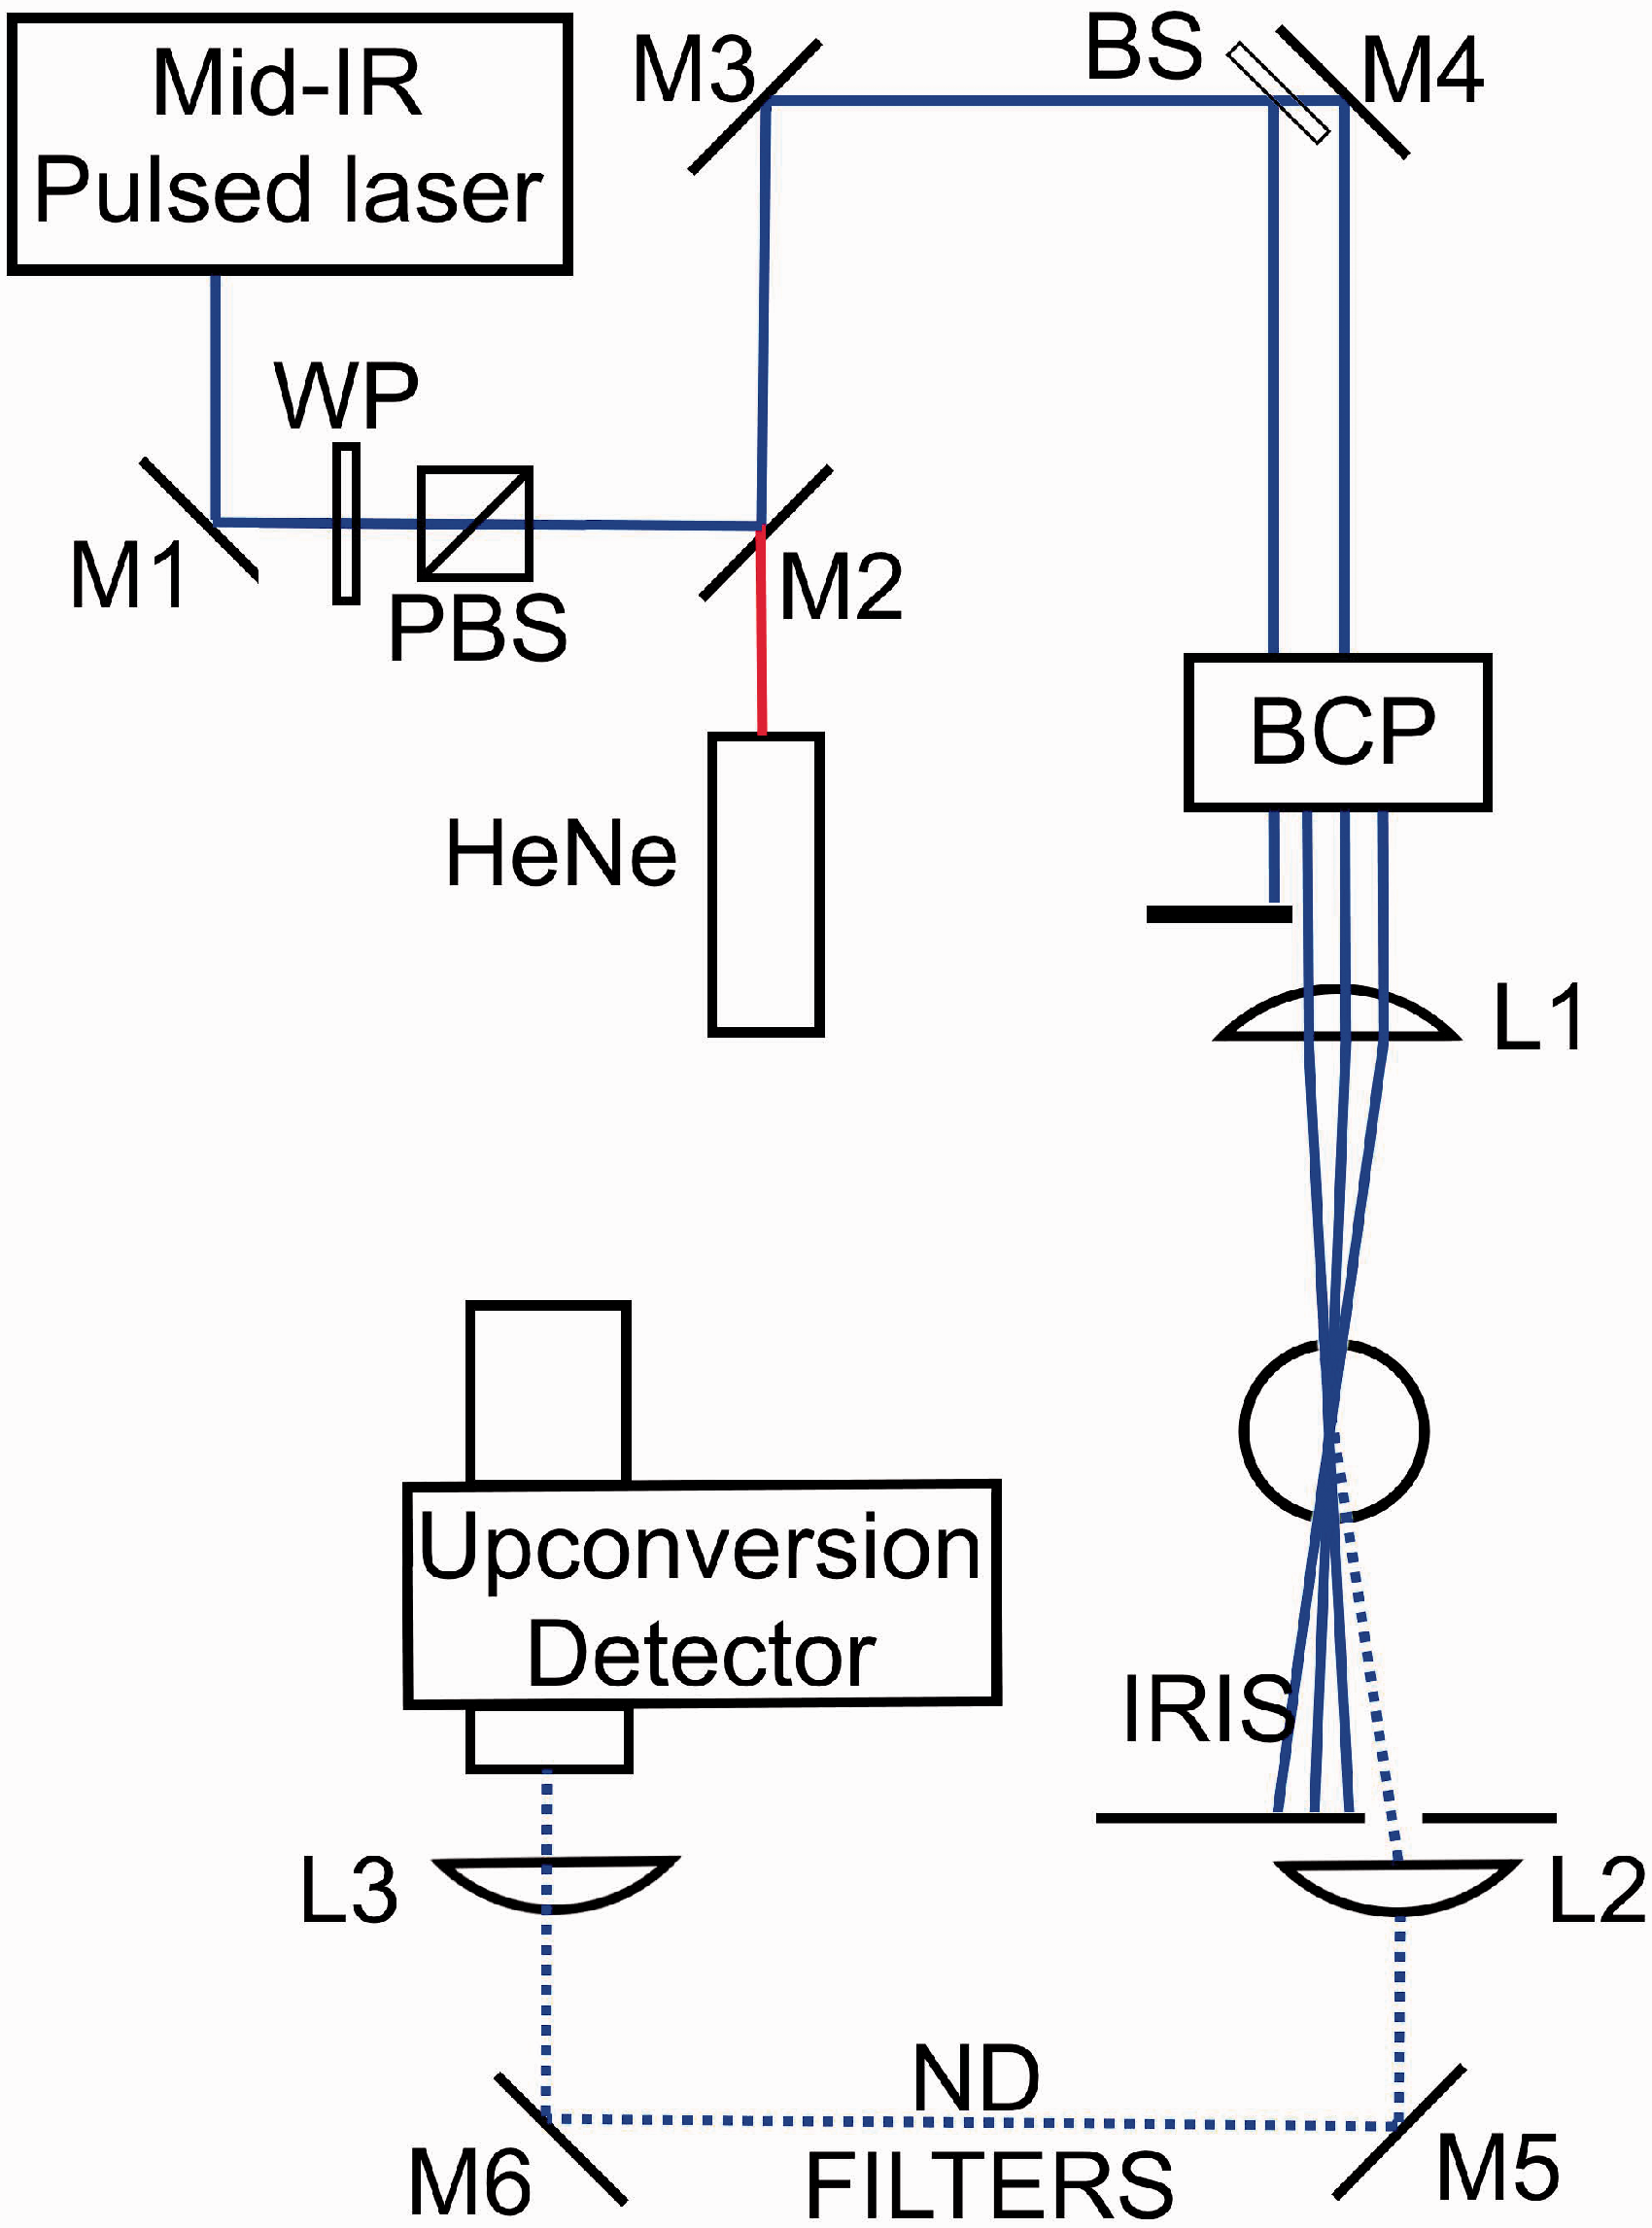
The signal from the water lines was recorded in two ways using this setup, either by a scanning measurement or an on-line peak measurement. The first was achieved by scanning the laser wavelength across the range 3230–3231.5 cm–1 at a scanning speed of 0.025 cm–1s–1 and recording the DFWM signal during the scan. Each measurement point shown in the following figures is the average of the values obtained from five scans. The standard deviation of the values from each set of five scans was used to calculate the uncertainty. The on-line method consisted of tuning the laser to the peak of a water line group and recording the signal for 30 s. The maximum value recorded during this time was used as the DFWM intensity of each line group. The maximum value was used because this provided a more consistent result compared to using the average value. One cause for this could be that the intensity data obtained for each 30 s on-line measurement does not follow a normal distribution. One on-line measurement of each peak was used to obtain the ratio, and six ratio measurements were recorded to evaluate the repeatability and precision. Scanning is generally easier to work with, and is more accurate, due to the difficulty in tuning the laser wavelength precisely to the peak wavelength. The advantage of using the on-line approach is that it allows temporal resolution for processes that change on time-scales shorter than the duration of a scan.
Laser Rayleigh Scattering Setup
The temperature in flames 1–8 was measured using a relatively simple LRS setup. A collimated 457 nm CW laser beam, with a diameter of 2 mm and power 170 mW, was sent through the flame at 8 mm HAB. The Rayleigh scattered light (the LRS signal) was detected by an EMCCD camera (Andor Luca R DL-604M-OEM) equipped with a Nikon (50 mm, f/2.8) camera lens, placed at 90° to the laser beam path and to the laser polarization. The LRS signal along the laser beam path was recorded as the average of 10 images, and a reference LRS signal was recorded in a dry air flow. In addition to this, a background image was also recorded in order to remove background noise. The exposure time of the camera was set to 0.1 s, and the EM gain to 10.
Flame
The measurements were performed in laminar, flat CH4/H2/air flames stabilized on a Perkin-Elmer burner with a plug diameter of 25 mm. Table III shows the flame composition and equivalence ratio (Φ) of the eight different flames studied here. A bluff-body stabilizer was placed 20 mm above the burner surface. The relative flows of the fuel and air were controlled by Bronkhorst mass flow controllers. A 5 L/min nitrogen co-flow was used to shield the flames.
Fuel/air flows in flames 1–8.
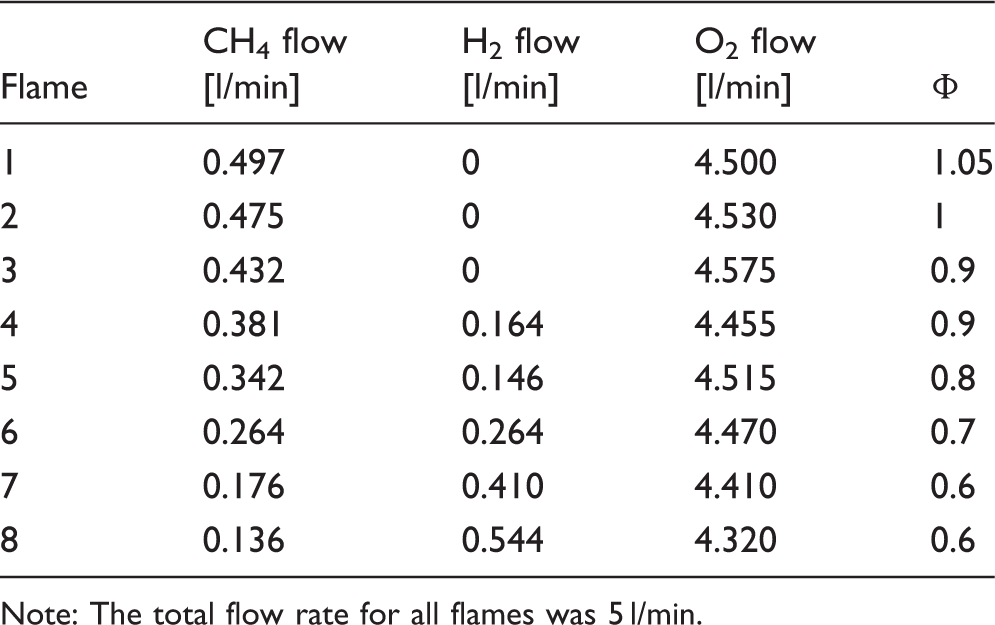
Note: The total flow rate for all flames was 5 l/min.
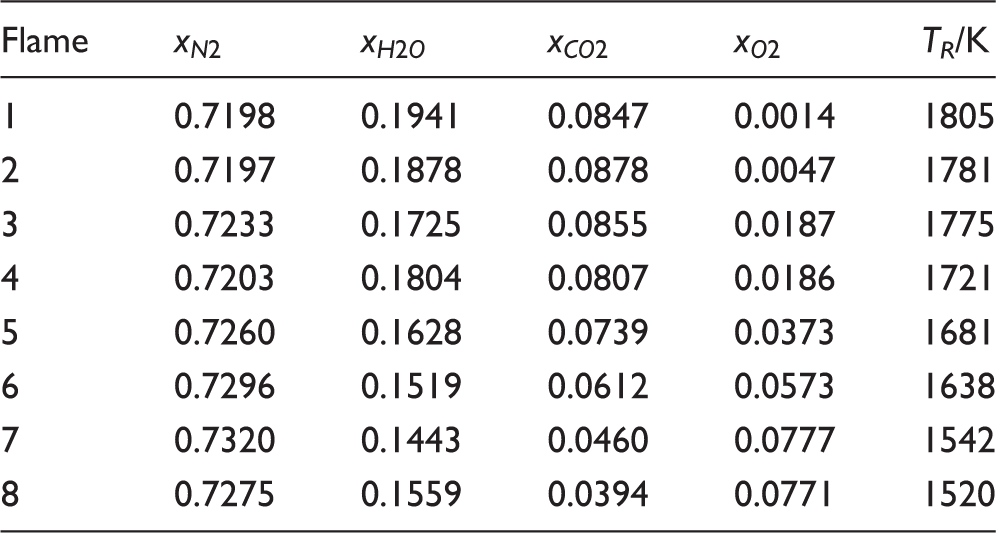
Simulated major species mole fractions (xi) in flames 1–8, together with the flame temperature at 8 mm HAB measured using LRS.
Results and Discussion
LRS Measurements
The flame temperature measured with LRS at 8 mm HAB is shown in Table IV, and these values are used as reference temperature for the DFWM line ratios presented in Fig. 5. The uncertainty in the LRS temperature is estimated to be ±7% of the calculated product zone flame temperature. This is calculated by considering the intensity fluctuation in the Rayleigh signal intensity, as well as the uncertainty in the gas composition and the calculated Rayleigh scattering cross sections. Better precision could be achieved by a more optimized LRS setup.27–30
Water line ratio measurements as a function of flame temperature. The pump intensity used was Ipump = 0.6 TWm–2.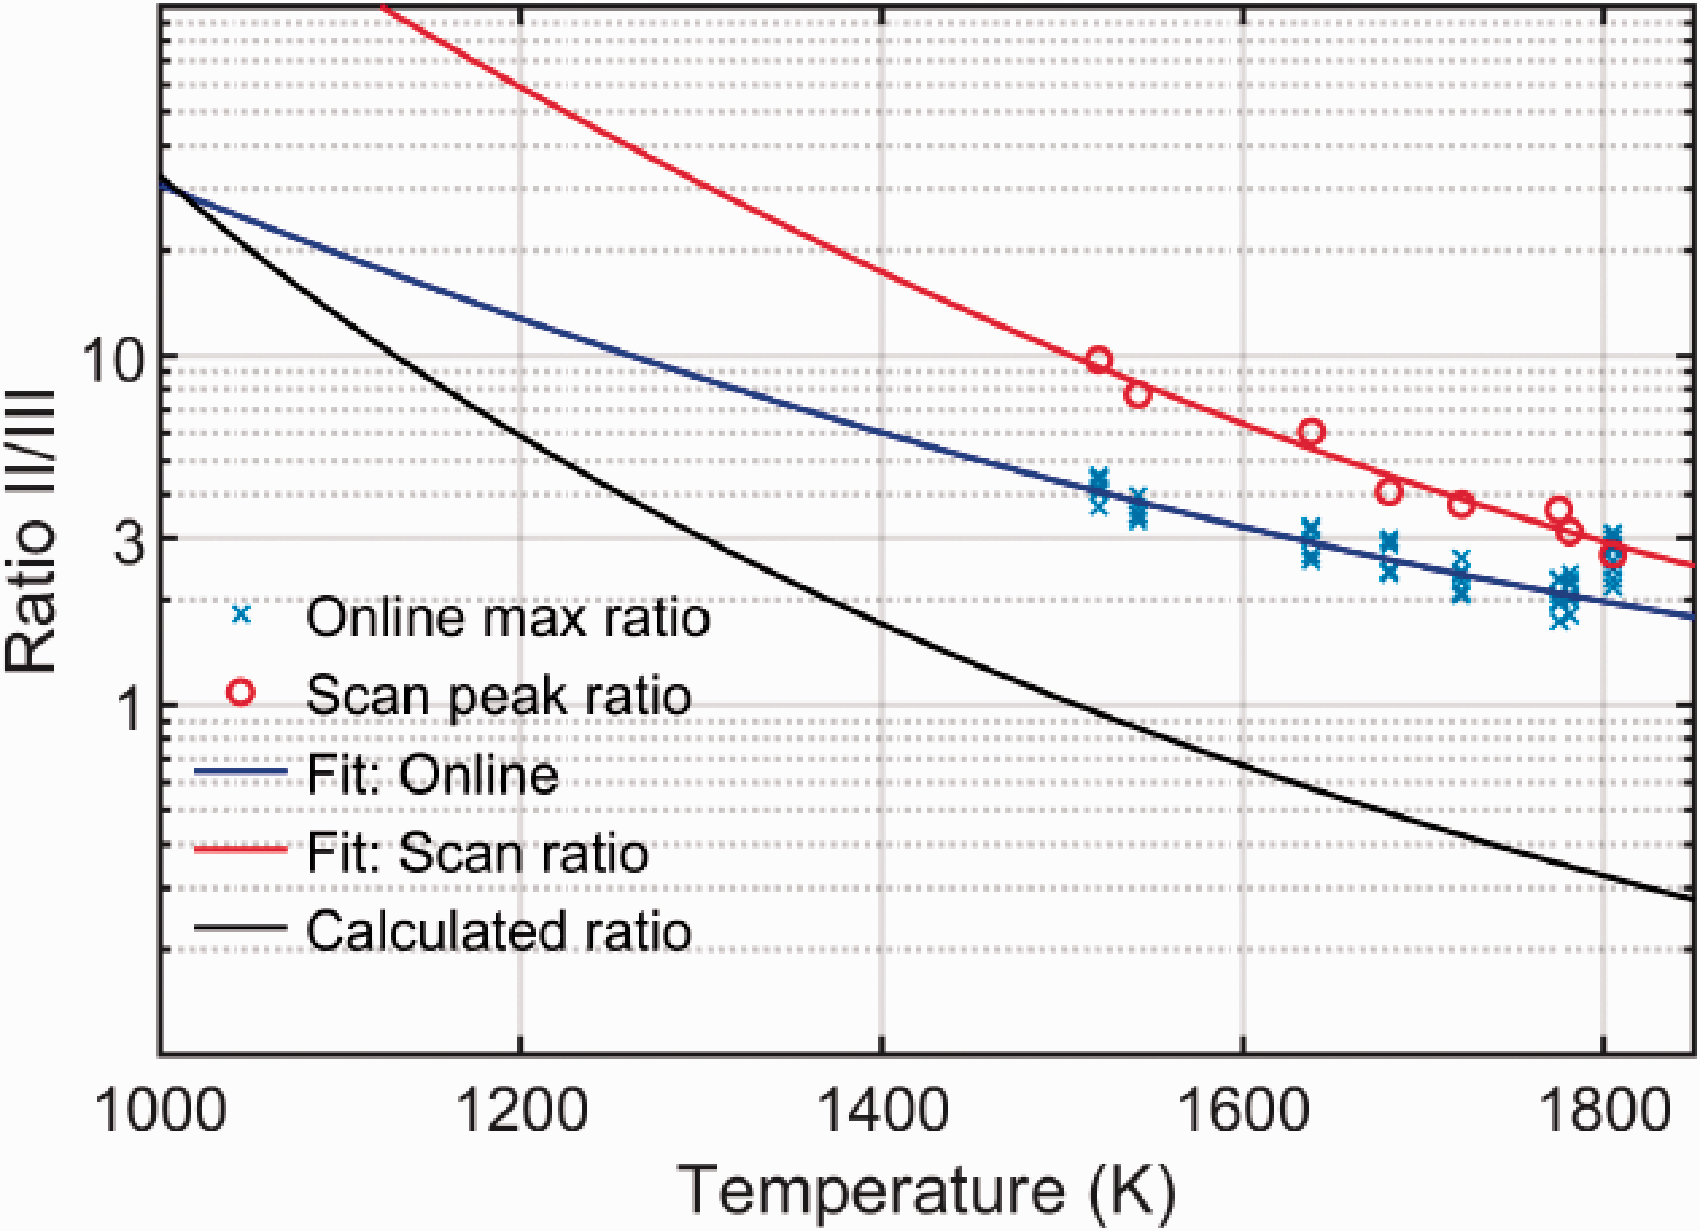
DFWM Saturation Measurements
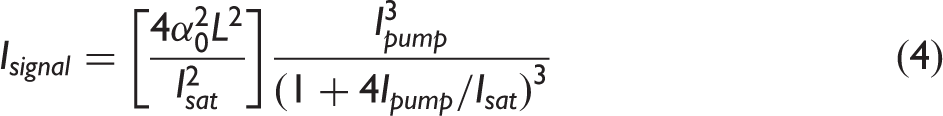
To investigate the saturation behaviour of line groups II and III, DFWM excitation scans over the lines were recorded for a range of different pulse energies, in Flame 2 (1781 K) and Flame 7 (1542 K), respectively. The average peak value from five excitation scans for each line group is shown in Fig. 4 as a function of the pump beam intensity in the measurement point. Each measurement series is shown with a curve fitted to Eq. 4. From the measured peak values and matching fitting curves, it seems that group III is saturated well below the maximum pulse energy available from the current IR laser system, in contrast to group II. This is probably because group III has a higher transition dipole moment than II. Comparing the scans in Flames 2 and 7, the trend seems to indicate that the saturation intensity will be higher at lower temperatures. The difference in saturation intensity in the two flames is probably caused by the difference in collisional quenching in the flames at different temperatures, which affects the collision dephasing rate τ2. Group II approaches the saturation limit at 1781 K (Flame 2), but for 1542 K (Flame 7) this does not seem to be the case. However, for laser intensities I > 0.2 TWm–2, the intensity dependence has gone from cubic, as it is for low energies, to linear, which reduces the impact of intensity variations from pulse to pulse.
Saturation curves for the DFWM signal from line groups II and III, recorded in (a) Flame 2 (1781 K) and (b) Flame 7 (1542 K). The saturation intensity found from these curves are: 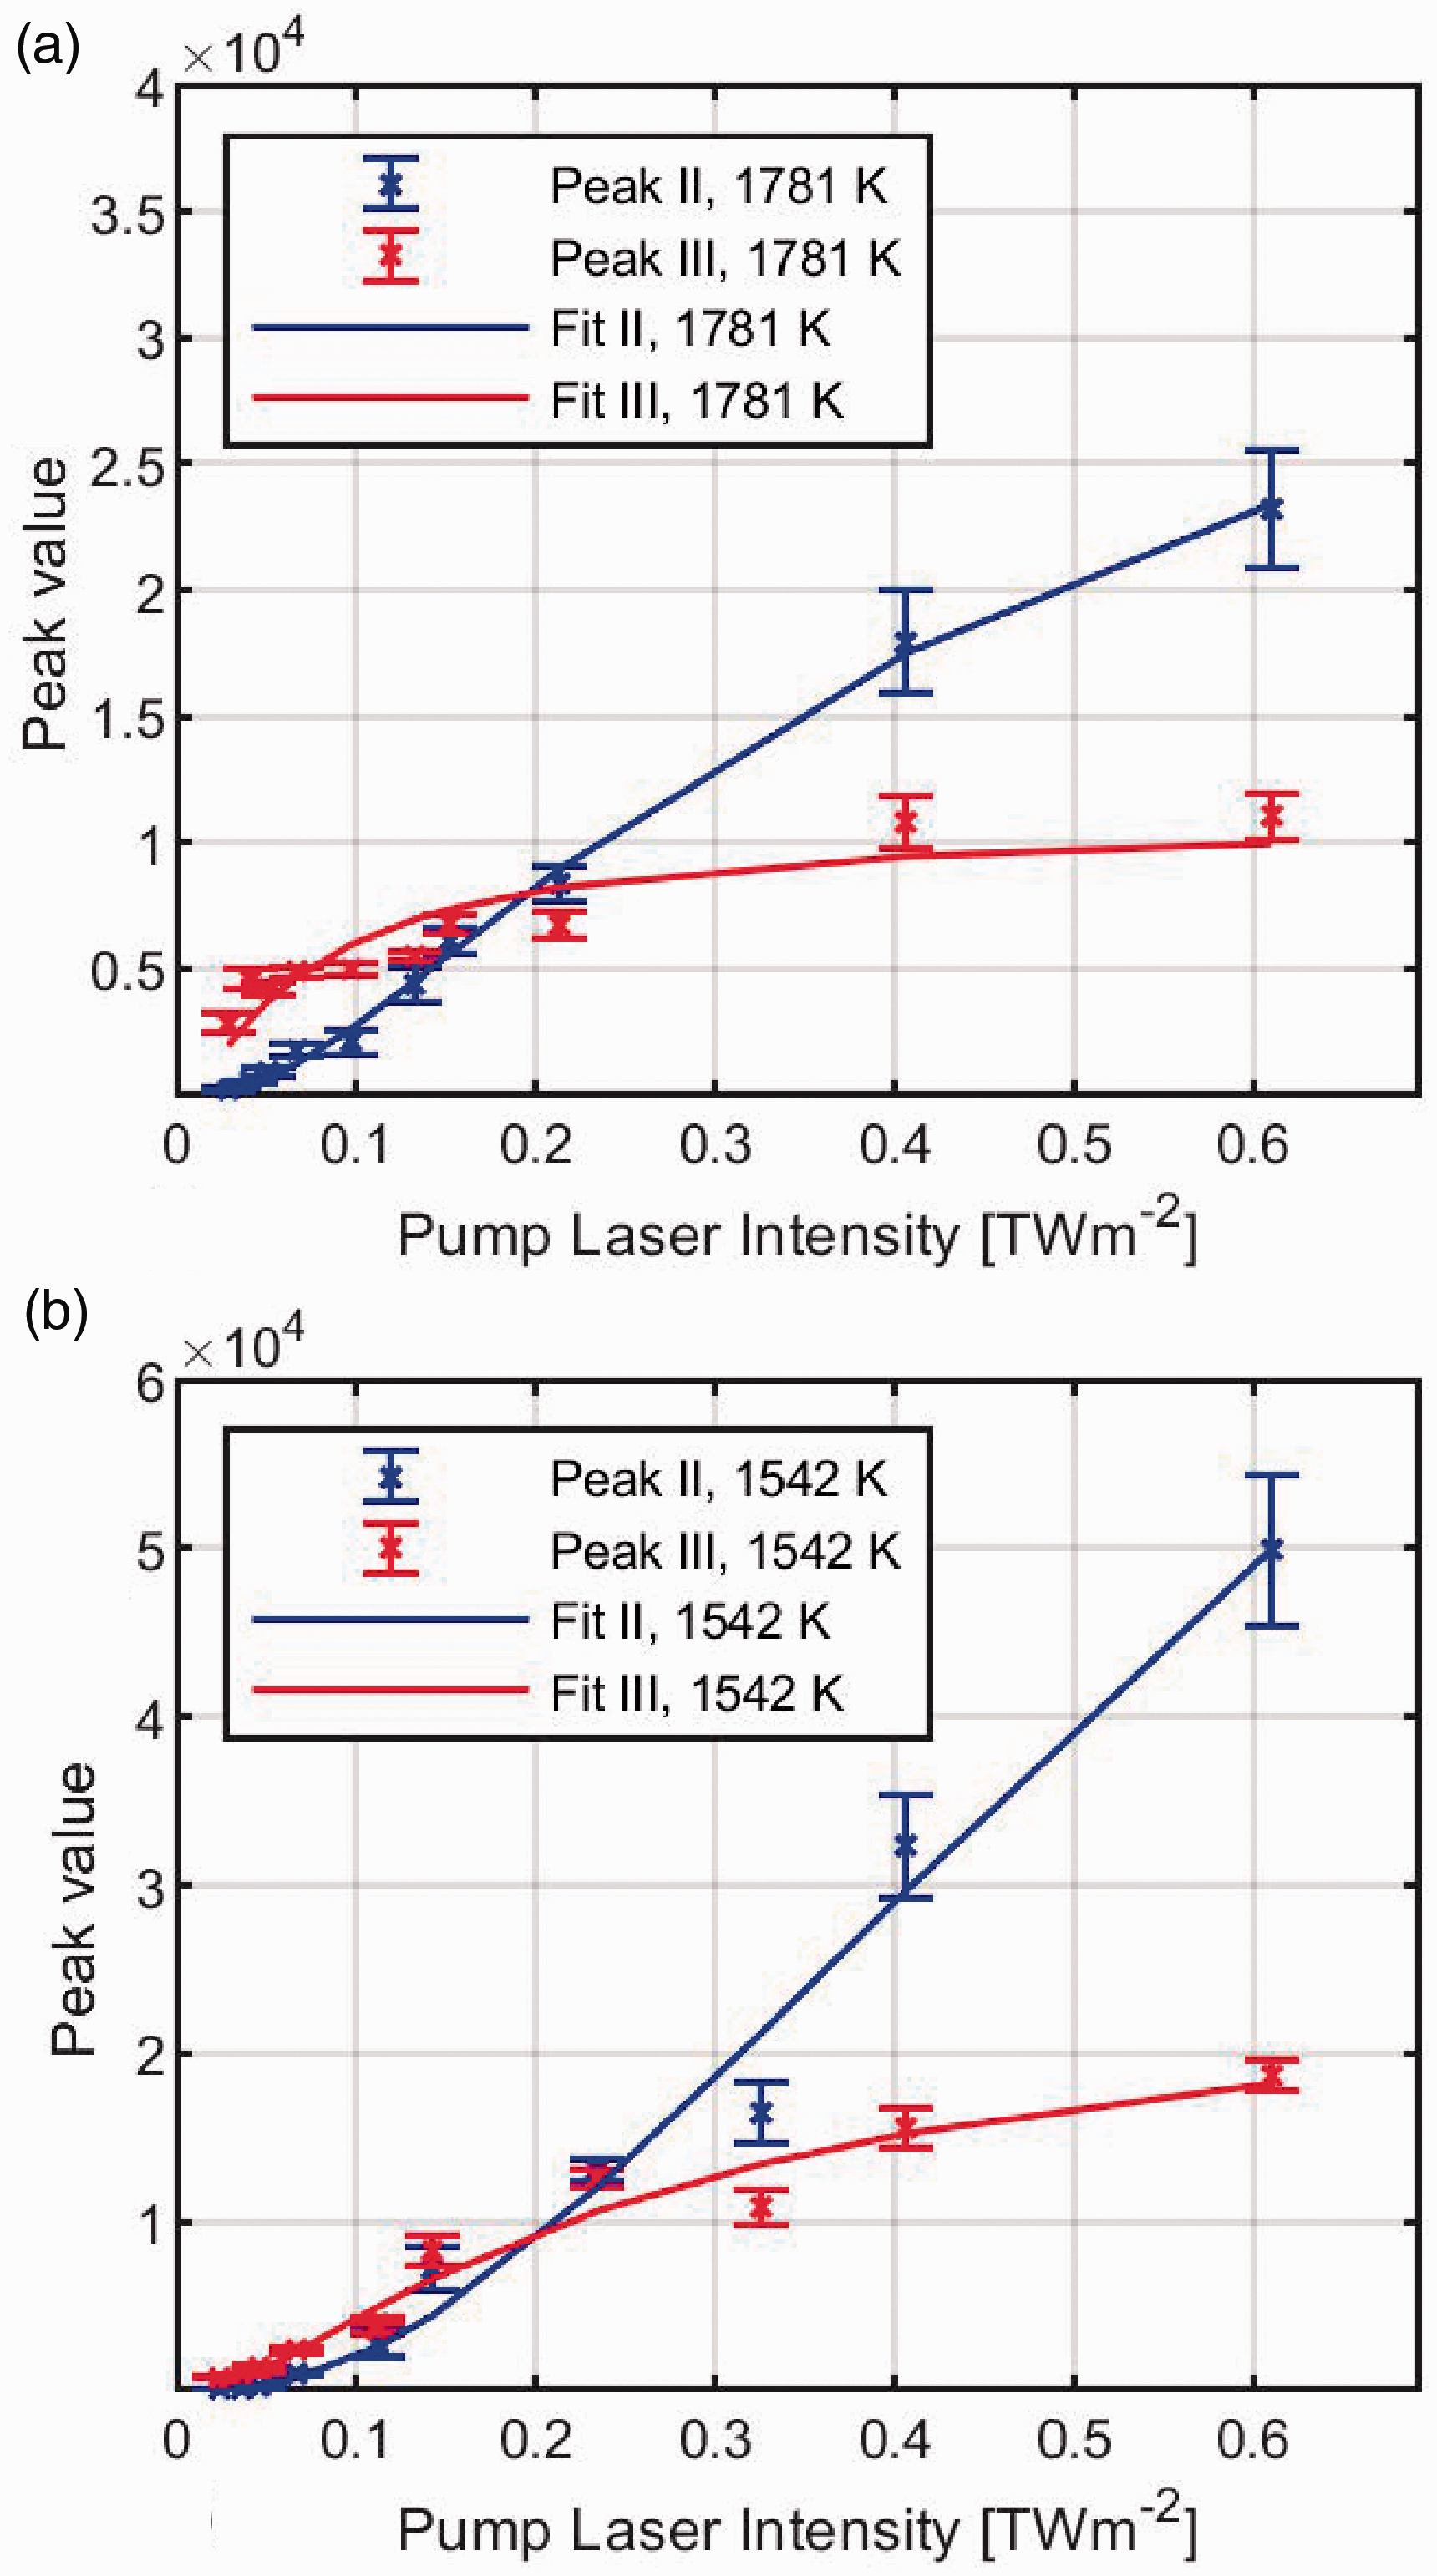
From Fig. 4, it is obvious that the intensity ratio between line groups II and III is very dependent on Ipump. The peak ratios might converge to a set ratio when both groups II and III are well into the saturated regime (
To compare WALTHER with other thermometry methods, it is necessary to quantify the uncertainty of the temperature measurement. This was done by calculating the temperature from the measured ratios, using the fitted calibration curves in Fig. 5, and comparing this with the temperature measured using Rayleigh scattering. The on-line outliers at 1805 K were not included in this calculation. The maximum difference between the LRS and WALTHER temperatures was 34 K and 83 K for the scanning and on-line measurements, respectively, and the average difference was 17 K and 30 K.
Conclusion
The measurements presented show that saturation effects have major impact on the value of water line ratio. However, within the investigated temperature range and for a constant pump and probe intensity, the effect is a constant corrective multiplicative factor, at least when the ratio is measured by scanning across the water lines. In this case, it is possible to adjust for the saturation effects by using a calibration measurement. In the case of the on-line measurements, the ratio trend presented here does not match what is expected from calculations, although the values are reproducible. It is possible to calibrate the on-line ratio as a function of temperature, and use this calibration for further temperature measurements. However, when using a calibration measurement it is essential to keep all important parameters constant between the calibration measurement and the actual measurement. As long as the reason for the deviation from the predicted trend is not understood, it is not possible to control the cause of this effect when going from the calibration measurement to the actual measurement. The only difference between the results measured by scanning and with the on-line approach is the operation of the laser, but we have not been able to pinpoint which factor is the cause of the different results. It is possible that this is a result of the inherent instability of the multi-mode laser, and that it could be avoided using a single-mode laser system with better wavelength tuning precision.
Despite the need to understand and calibrate the saturation behavior, the WALTHER method has several advantages. The intensity ratio of the H2O line groups II and III is very sensitive to small temperature changes in the interval 1000–2000 K, making this a very sensitive technique for small temperature changes. Utilizing the absorption of water, which is almost always present in relatively high concentrations in combustion, means there is no need for seeding of other species into the flame. The mid-infrared laser beams are much less sensitive to scattering compared to visible and ultraviolet wavelengths, making this a viable technique for temperature measurements in sooty flames and other high-scattering environments. In addition, mid-IR DFWM is a promising candidate for quantitative concentration measurements of molecules in combustion environments, 4 and in those types of measurements this technique can be applied with the same setup without needing any extra complex instrumentation, apart from some type of calibration measurement.
In conclusion, measuring the water line ratio using scanning over a less than 1 cm–1 spectral range can provide accurate temperature measurements when combined with the appropriate calibration measurements. The on-line approach needs to be further investigated as it does not seem to provide completely reliable results. However, if the practical challenges of the on-line approach can be identified and addressed, it would become a useful tool for studying time-varying combustion phenomena.
Footnotes
Declaration of Conflicting Interests
The author(s) declared no potential conflicts of interest with respect to the research, authorship, and/or publication of this article.
Funding
The author(s) disclosed receipt of the following financial support for the research, authorship, and/or publication of this article: We are thankful for the support from the Swedish Energy Agency through the KC-CECOST project, the Knut & Alice Wallenberg foundation, the Swedish Research Council (VR) and the European Research Council (ERC) through the Advanced Grant TUCLA.